

Screening Approach of the Langley Calibration Station for Sun Photometers in China
Key Laboratory of Intelligent Computing and Signal Processing of Ministry of Education, School of Electrical Engineering and Automation, Anhui University, Hefei 230601, China
*
Author to whom correspondence should be addressed.
Atmosphere 2023, 14(11), 1641; https://doi.org/10.3390/atmos14111641
Submission received: 19 August 2023
/
Revised: 30 October 2023
/
Accepted: 30 October 2023
/
Published: 31 October 2023
(This article belongs to the Section Atmospheric Techniques, Instruments, and Modeling)
Abstract
:A sun photometer is a type of photometer that points at the sun, and it has been playing an increasingly important role in characterizing aerosols across the world. As long as the solar photometer is accurately calibrated, the optical thickness of the aerosol can be obtained from the measured value of this device. When the calibration of a single instrument is not accurate, the inversion quantity varies greatly. The calibration constant of the sun photometer changes during its use process; thus, calibrations are frequently needed in order to ensure the accuracy of the measured value. The calibration constant of the solar photometer is usually determined using the Langley method. Internationally, AERONET has two Langley calibration stations: the Mauna Loa observatory in the United States and the Izaña observatory in Spain. So far, the International Comparison and Calibration System has been established in Beijing, similar to AERONET at GSFC, but the Langley calibration system has not yet been established. Therefore, it is necessary to select a suitable calibration station in China. This paper studies the requirements of the calibration station using the Langley method. We used long-term records of satellite-derived measurements and survey data belonging to the aerosol optical thickness data of SNPP/VIIRS, CERES, MERRA-2, etc., in order to gain a better understanding of whether these stations are suitable for calibration. From the existing astronomical observation stations, meteorological stations, and the Sun–Sky Radiometer Observation Network (SONET) observation stations in China, the qualified stations were selected. According to the statistical data from the Ali observatory, the monthly average of clear sky is 20.21 days, and it is always greater than 15 days. The monthly average of aerosol is not more than 0.15 and is less than 0.3. We believe that the atmosphere above the Ali observatory is stable, and the results show that the Ali observatory has excellent weather conditions. This study can provide a selection of calibration sites for solar photometer calibrations in China that may need to be further characterized and evaluated, and at the same time provide a method to exclude unsuitable calibration sites.
1. Introduction
An aerosol is a tiny solid or liquid particle suspended in the air or in the form of a gas. An aerosol increases pressure on the climate system through direct absorption, scattering solar radiation, and interacting with clouds [1,2,3].
Sulfate and nitrate particles as components of an aerosol cause significant soil and water acidification after reaching the ground via both dry and wet precipitation. When aerosol content increases, the absorption and scattering of light by aerosol particles reduces atmospheric visibility, and then transportation becomes difficult and has a negative impact on both social and economic activities [4,5]. Additionally, fine aerosols affect human health when they are transported into the bloodstream through inhalation [6]. Ground remote sensing measurement plays an important role in verifying both the accuracy of satellite remote sensing retrieval results and the radiometric calibration of satellite sensors, and it is the most important and accurate method for aerosol observation so far [7,8]. In the past few decades, numerous global networks of photometers have been established worldwide, such as AERONET, PHOTONS, SKYNET, and CAERONET [9]. Although some networks can calibrate the instruments directly at the observation stations using the Langley plot method, such as SKYNET, networks such as AERONET only perform absolute calibration at the calibration station at high elevations [10,11].
A solar photometer is often used outdoors and may consequently be affected by the natural environment, and, in addition, it is also affected by loss problems, such as the attenuation of filter deterioration that is caused by air pollutants or humidity, which will, in turn, lead to changes in the calibration constant of the solar photometer [12,13,14,15]. The change of the calibration constant is the source of the maximum uncertainty of the aerosol retrieval result of a sun photometer. When the accuracy of the calibration constant of the sun photometer is insufficient, the accuracy of the measurements is difficult to ensure, too. This kind of situation affects the accuracy of the retrieval results and results in the sun photometer being unable to meet the needs of the actual measurement [16,17]. The sun photometer needs to be calibrated regularly, which is an essential step in maintaining data accuracy [18].
There are two main methods to calibrate a sun photometer: (1.) the Langley plot method, and (2.) the indoor integrating sphere radiation source method. The requirements of indoor calibration are stringent, including temperature, humidity, and other environmental conditions, and calibration is frequently not adapted [19]. As a calibration method for sun photometers, the Langley plot method has the advantages of high precision, good stability, and high reliability. This method can generally be used without interruption, and it avoids establishing infrastructure and expensive calibration equipment for calibration in the laboratory, which is why it has been so widely used across the world [20,21].
Internationally, AERONET has two calibration stations on high mountains for the Langley plot method––the Mauna Loa observatory in the United States and the Izaña observatory in Spain. It is usually a requirement for standard instruments to go back to the calibration stations for recalibration every 12 to 18 months. The calibration coefficients of the sample instrument (the instrument under test) are obtained by inter-comparison with a master instrument on the calibration site, and the sample instrument is then sent back to the observation station [22]. The calibration of sun photometers in China mainly depend on the United States or Spain, then, and the master instruments must be shipped out to the calibration stations. The distance of transnational transportation is very long, leads to a long calibration cycle, and is also expensive. Unstable transit for a long time may also affect the stability of the instruments. At the same time, it is not easy to ascertain the status of the photometers after returning to China, which is another problem [14,23]. It is therefore vital to find a suitable calibration station in China, and, for this reason, we analyzed the conditions of the calibration station required by the Langley plot method to select a station that meets the calibration conditions in order to provide a reference for the calibration of master sun photometers in China.
2. Related Work
2.1. Principle of the Langley Plot Method
The direct solar radiation E(W/m2) measured on the ground satisfies the following relation at a specific wavelength in a non-vapor absorption channel according to the classic Lambert-Bouguer law [24]:
where E0(λ) is the solar irradiance outside the atmosphere at a distance of one astronomical unit (AU), and where τ(λ) represents the total vertical optical depth of the atmosphere at wavelength λ. Its value mainly comes from the following contributions––the molecular-scattering (Rayleigh scattering) optical depth τr(λ), the aerosol optical depth (AOD) τa(λ), and absorption of trace gases, such as ozone (O3) and nitrogen dioxide (NO2) [11]. R is the Earth–Sun distance correction factor corresponding to the measurement time, which is a precisely known constant if the data of the measurement are known, and m(θ) is the relative optical air mass [25].
V(λ) corresponds to the photon conversion factor voltage with the influence of the atmosphere, and it is proportional to the detected solar radiation value E(λ). The photon conversion factor voltage at the top of the atmosphere is V0(λ), which is given in millivolts (mV), and we can write Equation (1) as
By taking the logarithm of the left and right sides of Equation (2), we can get Equation (3):
The logarithm of the sun photometer calibration constant lnV0(λ) is obtained by establishing the linear regression between lnV(λ) + lnR2 as y-axis and relative optical air mass m(θ) as x-axis multiple sets of measurements under different solar zenith angles. When the calibration conditions are satisfied, a straight line is fitted. The straight-line slope is τ, which is the opposite number of the total vertical optical depth of the atmosphere, and the intercept of the line is lnV0(λ). This is the Langley plot method [26].
2.2. Conditions for a Suitable Calibration Station
Xin et al. [27] point out that when a sun photometer is calibrated using the Langley plot method, the calibration station must meet certain conditions. Many scholars have outlined the requirements of calibration stations for calibrating sun photometers using the Langley diagram method.
The Langley plot method has a high demand for the right weather conditions because the vertical optical depth of the atmosphere is required in order to remain essentially constant for calibration. The key to the success of calibration is to meet conditions of atmospheric stability. In other words, the Langley plot method needs to be in an area where the aerosol optical depth is both low and stable [28,29]. A study by Jeong et al. [30] concluded that atmospheric instability is one of the significant sources of error in the calibration of ground-based sun photometers using the Langley plot method. When analyzing the sources of the errors, Weihs et al. [31] showed that the Langley calibration method is sensitive to adverse weather conditions, and they also found that the calibration error of the instrument may be as high as 45% under extreme conditions, or that valid data obtained from the measurement are too few.
Cloudiness is one of the other main aspects that affects Langley plots, and even thin clouds perturb the Langley calibration dramatically. Our aim, therefore, is to find calibration points with a high number of clear sky days, as the Langley plot method should be carried out with clear and cloudless weather conditions. Li [32], Liu and Wang et al. [33], and Tong et al. [34] have all pointed out that using the data from only one clear day for the calibration could lead to significant errors in the calibration coefficients. It is thus necessary to calculate the average of the calibration coefficients for a number of clear days for the final calibration coefficient. Holben et al. [22] suggest that the Langley method should be applied between 5 to 15 clear morning days, and to then average the coefficients in order to obtain the final calibration coefficients for each channel. This has good repeatability, and the coefficient of variation (standard deviation/mean) will be low.
Furthermore, in order to prevent potential changes of atmospherics using the Langley calibration, the relative optical air mass should vary significantly in a short period [35]. In calibration, the relative optical air mass is generally required to change at a wide range, between 2 to 7 [11]. Optical air mass is a function of the sun’s zenith angle, closely related to geographical latitude. It is well known that a change in the optical air quality in a near subtropical region is more significant and more consistent than that in a near polar region, and that it is consequently easier to meet the rapid change of optical air quality in low-latitude areas.
The calibration of the direct solar radiation channel of the solar photometer is mainly carried out in the calibration station. It is necessary that the station around the calibration station should be wide in view, free from mountains or high-rise buildings, and far away from the pollution source. At the same time, the relative humidity of the atmosphere in the calibration station should be small, and the precipitation frequency should also be low [36]. It is at the bottom of the troposphere that natural and anthropogenic aerosols are mainly concentrated, and this is known as the boundary layer. High altitude areas are rarely affected by the boundary layer [37]. Indeed, Uchiyama et al. [38] have suggested that Langley calibration should be carried out at high-elevation stations. García et al. [39] and Toledano et al. [40] have also noted that the Mauna Loa observatory and the Izaña observatory are both located at high altitude mountaintop locations in the ocean, placing them in the free troposphere. Indeed, the Mauna Loa observatory is located away from nearly all aerosol sources, and the Izaña observatory only experiences episodic seasonal smoke and dust. Generally, UV irradiance increases with height due to a decrease in the amount of absorbing and scattering material above the observer. In addition, enhanced radiation from below can increase irradiance downward through multiple scattering effects due to increased albedo. The resulting increase in UV irradiance is described as the altitude effect (AE). However, high altitude is not used as a direct selection criterion for Langley calibration stations in this paper, because we believe that the choice of high altitude is to find atmospherically stable stations, and that considering atmospheric stability is a more robust choice.
3. Data Processing and Analysis
To make transportation and logistics convenient, we only considered calibration stations that already exist. These stations included meteorological stations, the National Astronomical Observatories of the Chinese Academy of Sciences, and SONET’s (Sun–Sky Radiometer Observation Network) observation stations.
3.1. The Condition of Latitude
The Mauna Loa observatory (19.88° N, 155.95° W) and the Izaña observatory (28.31° N, 16.50° W) are both located at low latitudes, and this can make the relative air mass change rapidly from 7 to 2, which takes about 2 h. In winter, it takes more than 3 h for the relative air mass to change from 2 to 7 at 37° N. At higher latitudes, the relative air mass in winter cannot reach 2. When choosing the calibration stations, only the stations below 37° N in China, as shown in Figure 1, were considered, in order to ensure that the relative air mass changes rapidly, thereby avoiding possible atmospheric change.
3.2. The Condition of Atmospheric Stability
3.2.1. Satellite-Derived Data
Because there are not as many measurement stations with accessible data, we selected long-term records of satellite-derived measurements to analyze aerosol thickness. Although these records are susceptible to changes in technology and different calibration schemes, the fact that the data varied over the same period for all stations did not affect the comparison results. The National Aeronautics and Space Administration (NASA) standard level-3 (L3) monthly deep blue aerosol product from the Suomi National Polar-orbiting Partnership (SNPP) Visible Infrared Imaging Radiometer Suite (VIIRS) provides both monthly mean aerosol optical depth (550 nm) and monthly standard deviation derived from satellite measurements. The deep blue algorithm is used to retrieve AOD from the measurements of the Sea-Viewing Wide Field-of-View Sensor (SeaWiFS) and the Moderate Resolution Imaging Spectroradiometer (MODIS). The monthly data are the arithmetic mean values based on daily L3 grided products [41].
The Clouds and the Earth’s Radiant Energy System (CERES) instrument is one of the highest priority scientific satellite instruments developed by NASA’s Earth Observation System (EOS). CERES instruments work on TERRA, AQUA, and SNPP in order to provide long time series and wideband products for the study of solar-reflected radiation as well as the Earth’s emitted thermal radiation. We used MODIS’s AOD of CERES Single Scanner Foot-Print (SSF) product, containing both monthly mean (550 nm) and monthly standard deviation data [42], because MODIS has greater bandwidth and higher spatial coverage. MODIS mod04 from NASA/GSFC produces the product, using the MOD04_L2/MYD04_L2 product and the match aerosol transport model [43]. Atmospheric aerosols have been extensively studied worldwide using data from CERES [43,44].
The second Modern-Era Retrospective Analysis for Research and Applications (MERRA-2) is a NASA atmospheric reanalysis produced by the Global Modeling and Assimilation Office (GMAO), and the Goddard Earth Observing System Model, Version 5 (GEOS-5) is its data assimilation system. The model assimilates aerosol optical depth data retrieved from various satellites, and it provides a product that focuses on historical climate analyses for a broad range of weather and climate timescales [45]. One study has shown that the aerosol optical thickness product of MERRA-2 is applicable in China [46]. The monthly mean aerosol optical depth and the monthly variance data are both used in this paper.
In this paper, three kinds of satellite-derived measurements (as shown in Table 1) are used to analyze the atmospheric stability simultaneously. The stations satisfying atmospheric stability under the three kinds of data are selected for the following analysis.
3.2.2. Space Matching between Satellite-Derived Data and Ground Station
The results of satellite-derived measurements are gridded, which is not a form of one-to-one correspondence with the ground stations. Before using the satellite-derived measurements for analysis, it is necessary to match them with the ground stations. We used the weighted distance method [47] in order to extract the value of the satellite-derived measurements corresponding to the ground stations according to their longitude and latitude information. The value of the ground stations can be weighted according to distance using the values of the satellite grids adjacent to their longitudes and latitudes. Suppose that the estimated point is (x, y) and that the surrounding points are (x1, y1), (x2, y1), (x1, y2), and (x2, y2); (x, y) represents the aerosol optical depth of latitude and longitude x, y measured by satellites in the area, including cloud fraction data; then the value of the ground station can be obtained using the following formula:
3.2.3. Atmospheric Stability Analysis of Ground Stations
Toledano et al. [40] have analyzed the ground-based observations of AOD at two calibration stations on high mountains of the AERONET. The monthly mean AOD of the two sites did not exceed 0.15 (500 nm), with a maximum deviation of 0.15. Cuevas et al. [48] analyzed the AOD of Izaña over the years in their report, and the monthly values of AOD of Izaña in July, August, and September from 2003 to 2013 were not more than 0.25, with most being about 0.1. Yang et al. [49] have proposed that the AOD at 500 nm should be less than 0.30 when calibrating the master instruments. Therefore, we consider the atmosphere stable when the monthly mean aerosol optical depth (550 nm) is not greater than 0.25 and when the monthly standard deviation is not greater than 0.15. The aerosol optical depth and the master deviation statistics are both based on the geometric averages when analyzing atmospheric stability at various stations that meet the low-latitude condition.
According to the above analysis, the selected stations are shown in Figure 2. The stations that meet the requirements are mainly concentrated in Tibet, southern Qinghai, and Western Sichuan.
3.3. Analyzing the Number of Clear-Sky Days
A suitable calibration station needs to have a certain number of clear-sky days per month for measurement, and even thin high clouds can significantly interfere with the Langley calibration. According to the Langley method, 5 to 15 clear-sky mornings are selected to calibrate sun photometers. Therefore, we set up the threshold of 10 clear-sky days per month in order to select the stations. The statistical average of the monthly average of clear-sky days is the mathematical average, and a clear-sky day is defined here as a day when the fractional cloud cover is no more than 0.1. If the cloud top height is lower than the station altitude, the cloud fraction is considered 0, and the day is recorded as a sunny day.
CLARA is a cloud climate data system developed by the European Organization for the Exploitation of Meteorological Satellites (EUMETSAT) and is one of the most commonly used cloud datasets [50]. CLARA-A2.1 is based on the observation of the Advanced Very-High-Resolution Radiometer (AVHRR) sensor on the satellites of the National Oceanic and Atmospheric Administration (NOAA) of the United States and the European Organization for the Exploitation of Meteorological Satellites (EUMETSAT). We evaluated the monthly mean number of clear-sky days, fractional cloud cover, and the corresponding cloud top height daily products from NOAA_19/AVHRR and METOP-A/AVHRR observations in January 2013 and December 2018, respectively. The daily cloud products are provided in a global grid with a resolution of 0.25° × 0.25° [51].
We selected four stations that meet the conditions shown in Figure 3, and through our analysis, their geographic information and their clear-sky days are shown in Table 2. On average, the Ali observatory exhibits 20.33 clear-sky days per month, the Ali weather station exhibits 14.47 clear-sky days, and the Tuotuohe weather station displays 16.76 clear-sky days, whereas SONET’s Ali station has 20.21 clear-sky days per month.
3.4. Boundary Layer Depth Analysis
Through the above analysis, we selected four stations that meet the conditions of low latitude, stable atmosphere, and sufficient clear-sky days at the same time. The boundary layer refers to the atmospheric region near the earth’s surface, and it is affected by ground friction and is a crucial parameter. In the atmospheric boundary layer, wind speed, temperature, and humidity have noticeable diurnal changes and are not conducive to the Langley calibration; atmospheric boundary layer depth is a trend in this variation, weakening with height. In order to avoid the influence of the boundary layer on calibration, we analyzed it at these stations.
GPSROZPBLA (GPS Radio Occultation Boundary Layer Depth Annual L3 V1) provides an annual average product of a global planetary boundary layer (PBL) height climatology that was obtained from COSMIC/FORMOSAT-3 and Terra SARX Global Positioning System (GPS) radio occultation measurements from June 2006 to December 2015. The PBL height is calculated as the height where the vertical gradient of the refractivity (dN/dz) is the minimum for each occultation; it is well defined, with a strong capping inversion. The purpose of the algorithm is to locate the height when refractivity occurs that has a sizeable vertical change corresponding to the transition from the free troposphere to the boundary layer. This data has a spatial resolution of 2° × 2° latitude/longitude regions [52].
The results are shown in Figure 4. The relative altitudes of the Ali meteorological station and the Tuotuohe meteorological station are lower, and they are in the boundary layer and are thus easily affected. Above the boundary layer, the Ali observatory and the Ali station of SONET are adjacent, and they have excellent conditions for both in situ and column measurements of trace gases and aerosols under the “free troposphere”.
4. Stations Analysis
The Ali Astronomical Observation Station of the National Astronomical observatory is 5100 m above sea level, and it is located in the Tibetan Plateau region, where the air is dry, there are few clouds and little pollution, and the high altitude is potentially advantageous for infrared and submillimeter wave band observations [53]. It is a recently constructed observatory, following a long-term site survey in western China [54]. An optical turbulence forecast system has been established in the weather research and forecasting model at the Ali observatory [55,56,57], which can provide reference for Langley calibration [58]. There is convenient transportation to the Ali observatory, and it is about 30 km away from the town of Shiquanhe, which is the administrative center of the Ali Region, and 25 km away from Nagri Gunsa Airport, which has regular flights to Lhasa every day. There is a new road connecting the Ali observatory to both Shiquanhe and Nagri Gunsa Airport.
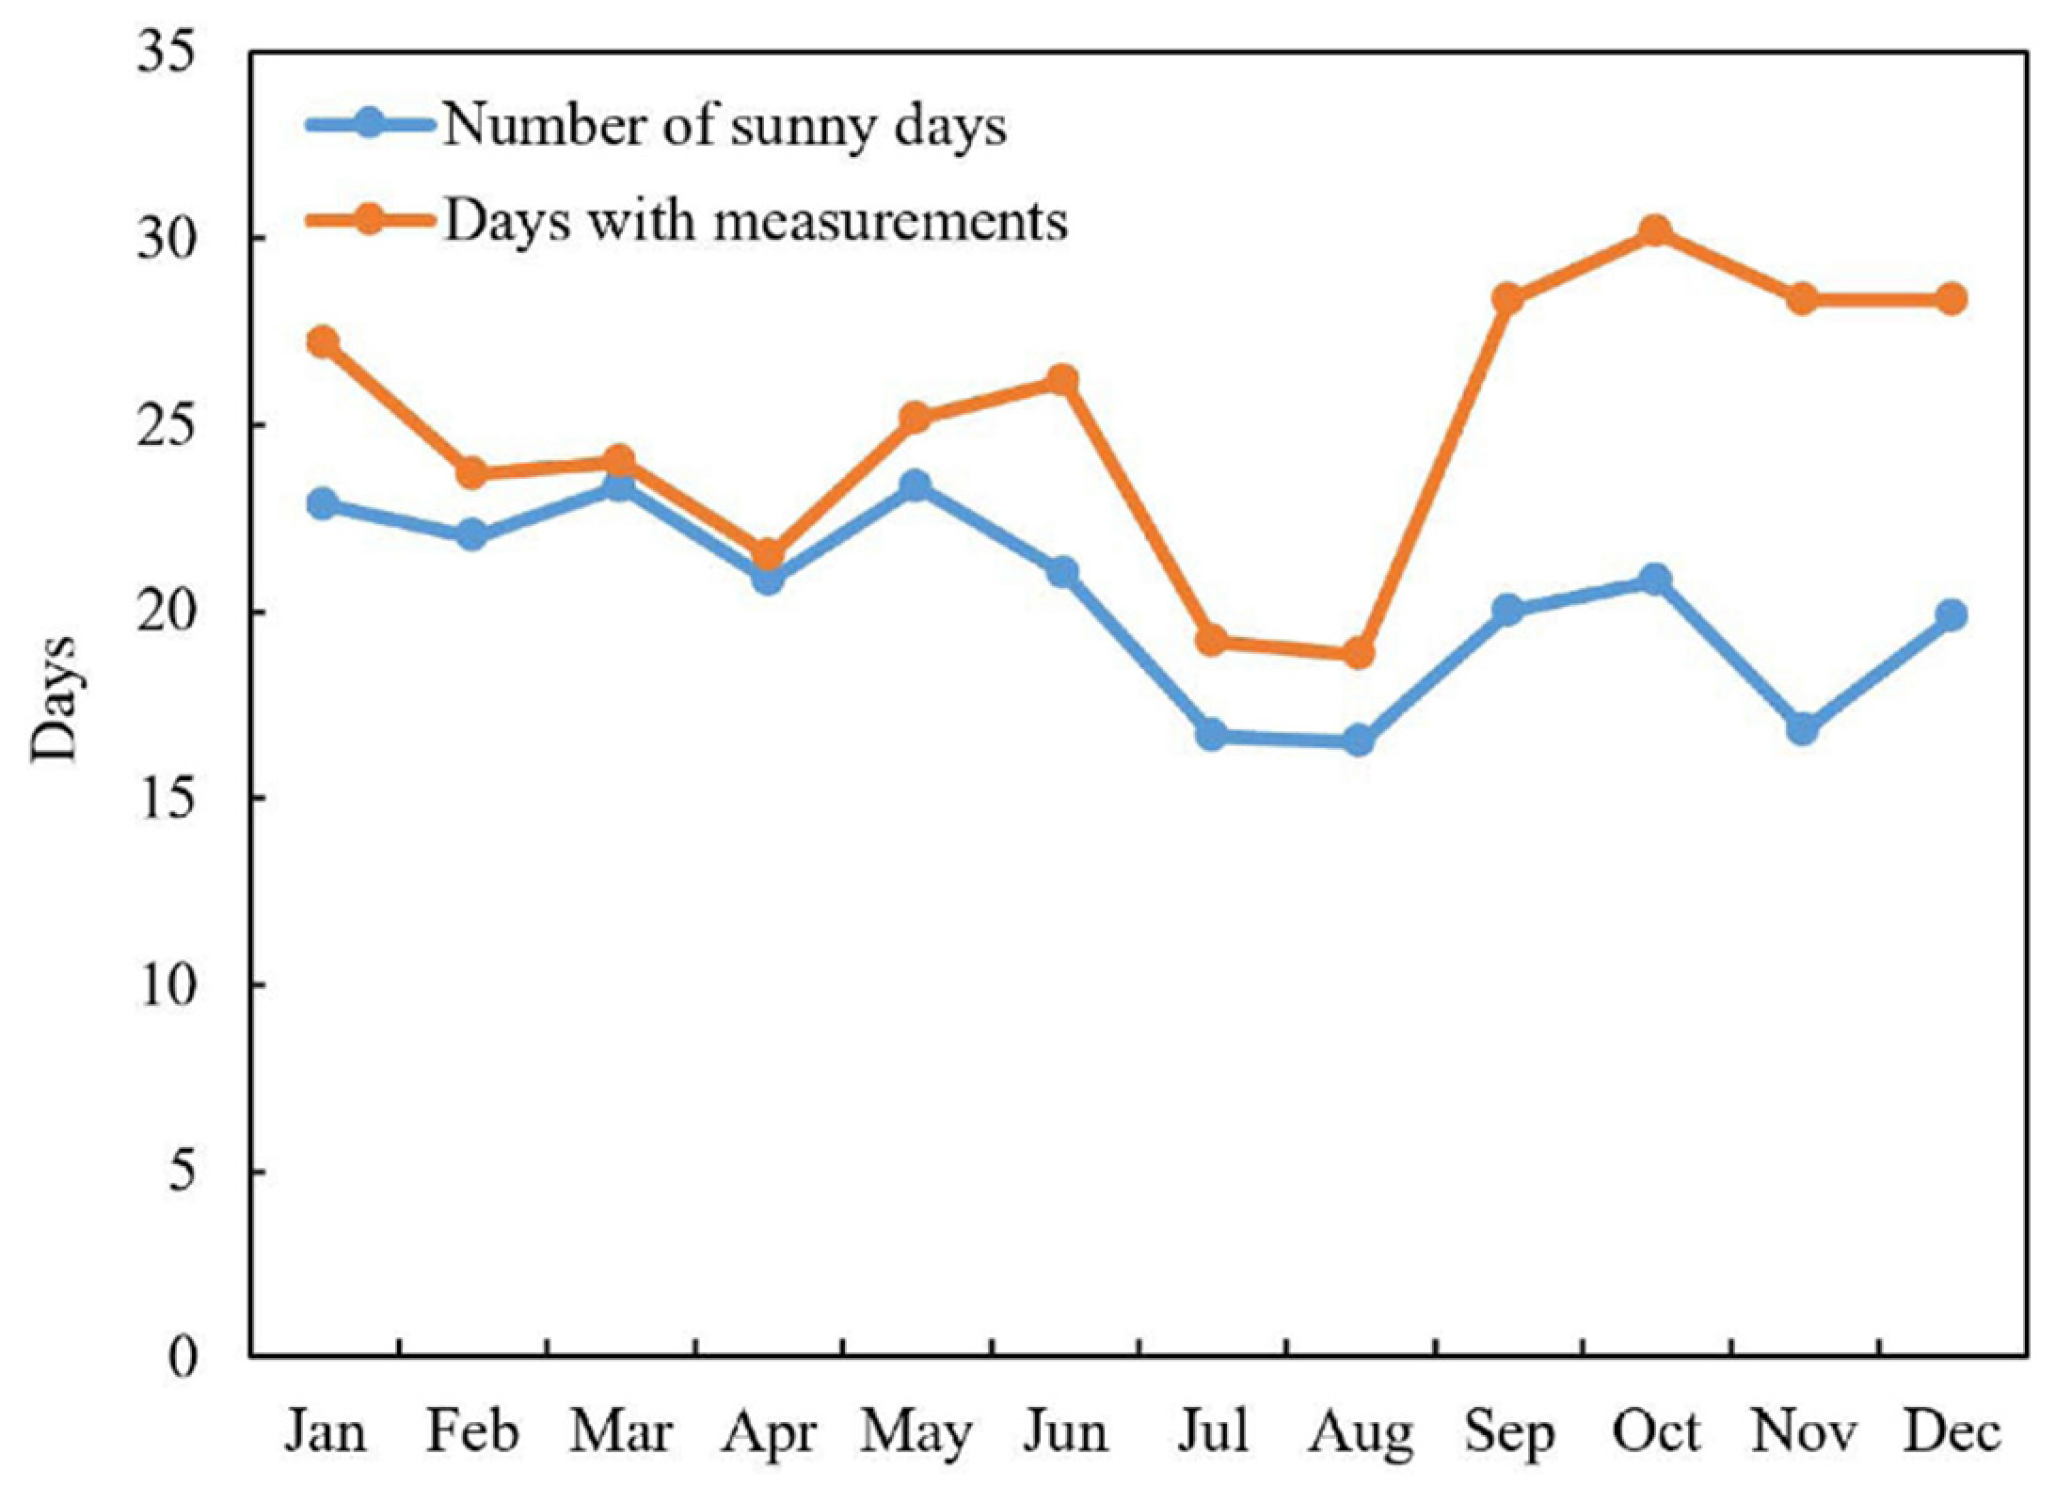
As shown in Figure 5, processing the data from SNPP from 2013 to 2020 and the MERRA-2 data from 2011 to 2020 shows that the trends of monthly aerosol climatology obtained from the two types of satellite-derived measurements are consistent, and it also shows the low aerosol concentration. AOD shows significant seasonal variability from 0.027 in December up to 0.099 in May. The monthly standard deviation indicates that the variability within each month is also very low. The most considerable variability occurred in May, with a value of about 0.063, which synchronized with the AOD changes. Figure 6 provides the statistical data of clear-sky days at the Ali observatory, with more than 15 sunny days per month; and there was some seasonal variability, with the period from July to August having the least clear-sky days. Overall, though, the Ali observatory still has enough clear-sky days, and the clouds are not an obstacle to obtaining a sufficient number of Langley plots at the station.
Based on the above analysis, the Ali observatory meets all the above conditions and is a suitable station for Langley calibration, which may need further evaluation. In Table 3, we show the comparison between the main station characteristics of the Ali observatory and the other best-known stations for Langley calibration in the world.
5. Summary
There are two major Langley calibration stations globally, and both are located within high mountains––the Mauna Loa observatory in the United States and the Izaña observatory in Spain, both of which are far from China and inconvenient for calibration. The main goal of this study was to provide a method to exclude unsuitable Langley calibration sites and to select a suitable Langley calibration site in China. For this purpose, we provided detailed analyses in order to find the conditions that are needed for Langley plot calibration of sun photometers.
In order to calibrate a sun photometer, the Langley plot method is required and the calibration station has high requirements for the calibration site. The key to successful calibration is stable atmospheric conditions. In this study, we used aerosol data, the number of clear days, and boundary layer depth analysis to exclude unsuitable sun photometer calibration stations. The high frequency of cloudless weather and stable aerosol atmospheric conditions throughout the year at the Ali observatory provide favorable conditions for regular Langley calibration of sun photometers. In addition, the easy accessibility of the Ali observatory makes it a more suitable location for sun photometer calibration. However, since a significant amount of the sun photometer data were not measured in the Ali area, a detailed analysis of the data from the sun photometers in the area may be difficult and may require further evaluation.
Author Contributions
Methodology, X.L. and H.L.; Software, H.L.; Formal analysis, Q.Y.; Resources, L.X.; Data curation, X.L.; Writing—original draft, X.L. and H.L.; Writing—review & editing, L.X.; Supervision, J.Z.; Funding acquisition, L.X. All authors have read and agreed to the published version of the manuscript.
Funding
This work was supported in part by the National Key R&D Plan of China under Grant 2018YFB0504604, Key Project of the Open Research Fund of the Key Laboratory of Eco-Environment and Meteorology of Qinling Mountains and Loess Plateau of Shaanxi Meteorological Bureau (2021K-10).
Data Availability Statement
AERDB_M3_VIIRS_SNPP Deep Blue Level 3 monthly aerosol data is provided freely on the internet, and use and even publication of the provided data is possible provided that some stated guidelines are adhered to; for more details on this, please see https://ladsweb.modaps.eosdis.nasa.gov/missions-and-measurements/products/AERDB_M3_VIIRS_SNPP (accessed on 13 March 2021). CERES_SSF1deg_Ed4.1 (Terra-MODIS) monthly aerosol data are provided freely on the internet, and the possible use and even publication of this data are possible provided that some of the stated guidelines are adhered to; for more details on this, please see https://ceres-tool.larc.nasa.gov/ord-tool/jsp/SSF1degEd41Selection.jsp (accessed on 11 March 2021). instM_2d_gas_Nx data are provided freely on the internet, and the use and even publication of this data are possible, provided that some of the stated guidelines are adhered to; for more details on this, please see https://disc.gsfc.nasa.gov/datasets/M2IMNXGAS_5.12.4/summary (accessed on 18 March 2021). NOAA_19/AVHRR and METOP-A/AVHRR data are provided freely on the internet, and the use and even publication of the data provided are possible, provided that some of the stated guidelines are adhered to; for more details on this, please see https://wui.cmsaf.eu/safira/action/viewProduktSearch?menuName (accessed on 18 March 2021). GPSROZPBLA data are provided freely on the internet, and the use and even publication of this data is possible, provided that some of the stated guidelines are adhered to; for more details on this, please see https://disc.gsfc.nasa.gov/datasets/GPSROZPBLA_1/summary?keywords=boundary%20layer%20height (accessed on 20 March 2021).
Conflicts of Interest
The authors declare no conflict of interest.
References
- Bender, F.A.M.; Frey, L.; Mccoy, D.T.; Grosvenor, D.P.; Mohrmann, J. Assessment of aerosol-cloud-radiation correlations in satellite observations, climate models and reanalysis. Clim. Dynam. 2018, 52, 4371–4392. [Google Scholar] [CrossRef]
- Hua, S. Study on Aerosol-Cloud Interaction and Cloud Radiative Effect Over the Tibetan Plateau. Ph.D. Thesis, Lanzhou University, Lanzhou, China, 2020. [Google Scholar]
- López-Romero, J.M.; Montávez, J.P.; Jerez, S.; Lorente-Plazas, R.; Jiménez-Guerrero, P. Precipitation response to aerosol-radiation and aerosol-cloud interactions in regional climate simulations over Europe. Atmos. Chem. Phys. 2021, 21, 415–430. [Google Scholar] [CrossRef]
- Xie, X.H. Researches on Aerosol Optical Properties of Kunming Using CE318 Sunphotometer and MODIS Measurements. Master’s Thesis, Yunnan University, Kunming, China, 2015. [Google Scholar]
- Zhao, J.F.; Jiang, Y.Q.; Zhan, X.; Kong, X.N. Advances in Research of Impacts of Aerosol Pollution on Crop in China. Adv. Meteorol. Sci. Technol. 2018, 8, 6–10. [Google Scholar]
- Vladutescu, D.V.; Madhavan, B.L.; Gross, B.M.; Aguirre, A.; Moshary, F.; Ahmed, S.A.; Razani, M.; Blake, R.A. Assessment of Langley and NASA-GISS Calibration Techniques for MFRSR Aerosol Retrieval. IEEE Trans. Geosci. Remote Sens. 2014, 52, 5880–5894. [Google Scholar] [CrossRef]
- Alexandrov, M.D.; Lacis, A.A.; Carlson, B.E.; Cairns, B. Remote Sensing of Atmospheric Aerosols and Trace Gases by Means of Multifilter Rotating Shadowband Radiometer. Part I: Retrieval Algorithm. J. Atmos. Sci. 2002, 59, 524–543. [Google Scholar] [CrossRef]
- Wu, Y.F.; Zhu, J.; Che, H.Z.; Xia, X.G.; Zhang, R.J. Column-integrated aerosol optical properties and direct radiative forcing based on sun photometer measurements at a semiarid rural site in Northeast China. Atmos. Res. 2015, 157, 56–65. [Google Scholar] [CrossRef]
- Yan, H.; Jiao, M.Y.; Bi, B.G.; Liu, G.Q. Advances in Aerosol Observation Network and corresponding science plan. J. Meteorol. Sci. 2006, 26, 110–117. [Google Scholar] [CrossRef]
- Eck, T.F.; Holben, B.; Reid, J.; Dubovik, O.; Smirnov, A.; O’neill, N.; Slutsker, I.; Kinne, S. Wavelength dependence of the optical depth of biomass burning, urban, and desert dust aerosols. J. Geophys. Res. Atmos. 1999, 104, 31333–31349. [Google Scholar]
- Holben, B.N.; Eck, T.F.; Slutsker, I.a.; Tanré, D.; Buis, J.; Setzer, A.; Vermote, E.; Reagan, J.A.; Kaufman, Y.; Nakajima, T. AERONET—A federated instrument network and data archive for aerosol characterization. Remote Sens. Environ. 1998, 66, 1–16. [Google Scholar] [CrossRef]
- Brooks, D.R.; Mims, F.M. Development of an inexpensive handheld LED-based Sun photometer for the GLOBE program. J. Geophy. Res. Atmos. 2001, 106, 4733–4740. [Google Scholar] [CrossRef]
- Luo, J.; Yi, W.N.; He, C.L.; Peng, N.M. Implement of solar photometer calibration by transferring of radiometric radiator. J. Atmos. Environ. Opt. 2006, 1, 112–116. [Google Scholar] [CrossRef]
- Huang, D.; Li, X.; Zhang, Y.N.; Zhang, Q.; Zheng, X.B.; Sun, L. Field calibration of sunphotometer in Dunhuang test site. Acta Photonica Sin. 2019, 48, 142–151. [Google Scholar] [CrossRef]
- Shaw, G.E. Sun Photometry. Bull. Am. Meteorol. Soc. 1983, 64, 4–10. [Google Scholar] [CrossRef]
- Campanelli, M.; Nakajima, T.; Olivieri, B. Determination of the solar calibration constant for a sun-sky radiometer: Proposal of an in-situ procedure. Appl. Opt. 2004, 43, 651–659. [Google Scholar] [CrossRef]
- Wang, X.H.; Qiao, Y.L.; Philip, G.; Li, Z.Q. Sun radiometer calibration system for global aerosol measurement network. Acta Opt. Sin. 2008, 28, 87–91. [Google Scholar] [CrossRef]
- Che, H.Z.; Zhang, X.Y.; Chen, H.B.; Damiri, B.; Goloub, P.; Li, Z.Q.; Zhang, X.C.; Wei, Y.; Zhou, H.G.; Dong, F.; et al. Instrument calibration and aerosol optical depth validation of the China Aerosol Remote Sensing Network. J. Geophy. Res. Atmos. 2009, 114, D03206. [Google Scholar] [CrossRef]
- Liu, Z.Y. Analysis on the Characteristic of Aerosol Optical Depth Changed with Season in Delingha and Hefei. Master’s Thesis, University Science Technology China, Hefei, China, 2017. [Google Scholar]
- Qie, L.L.; Dai, C.M.; Xu, Q.S.; Wei, H.L. Calibration of near-infrared absorption band for a sun-photometer. Natl. Remote Sens. Bull. 2012, 16, 928–938. [Google Scholar] [CrossRef]
- Dong, Z.P.; Yu, X.; Lu, D.; Dai, J.; Li, X.M.; Chen, C.; Peng, Y.; Dong, Y. An objective method for assessment of Langley calibrations of sunphotometer. Chin. J. Atmos. Sci. 2020, 44, 39–52. [Google Scholar] [CrossRef]
- Holben, B.N.; Tanré, D.; Smirnov, A.; Eck, T.F.; Slutsker, I.; Abuhassan, N.; Newcomb, W.W.; Schafer, J.S.; Chatenet, B.; Lavenu, F.; et al. An emerging ground-based aerosol climatology: Aerosol optical depth from AERONET. J. Geophy. Res. Atmos. 2001, 106, 12067–12097. [Google Scholar] [CrossRef]
- Li, Z.Q.; Li, D.H.; Li, K.Y.; Xu, H.; Chen, X.F.; Chen, C.; Xie, Y.S.; Li, L.; Li, L.; Lv, Y.; et al. Sun-sky radiometer observation network with the extension of multi-wavelength polarization measurements. J. Remote Sens. 2015, 19, 495–519. [Google Scholar] [CrossRef]
- Swinehart, D.F. The beer-lambert law. J. Chem. Educ. 1962, 39, 333. [Google Scholar] [CrossRef]
- Kasten, F.; Young, A.T. Revised optical air mass tables and approximation formula. Appl. Opt. 1989, 28, 4735–4738. [Google Scholar] [CrossRef] [PubMed]
- Shaw, G.E.; Reagan, J.A.; Herman, B.M. Investigations of atmospheric extinction using direct solar radiation measurements made with a multiple wavelength radiometer. J. Appl. Meteorol. Clim. 1973, 12, 374–380. [Google Scholar] [CrossRef]
- Xin, J.Y.; Wang, Y.S.; Li, Z.Q.; Wang, P.C.; Wang, S.G.; Wen, T.X.; Sun, Y. Introduction and calibration of the Chinese sun hazemeter network. Environ. Sci. 2006, 27, 1697–1702. [Google Scholar] [CrossRef]
- Zhang, J.H.; Wang, M.H.; Mao, J.T. Error analysis and correction for multi-wavelength sun-photometer aerosol remote sensing. Chin. J. Atmos. Sci. 2000, 24, 855–859. [Google Scholar] [CrossRef]
- Carlund, T.; Kouremeti, N.; Kazadzis, S.; Grobner, J. Aerosol optical depth determination in the UV using a four-channel precision filter radiometer. Atmos. Meas. Tech. 2017, 10, 905–923. [Google Scholar] [CrossRef]
- Jeong, U.; Tsay, S.C.; Pantina, P.; Butler, J.J.; Loftus, A.M.; Abuhassan, N.; Herman, J.R.; Dimov, A.; Holben, B.N.; Swap, R.J. Langley Calibration Analysis of Solar Spectroradiometric Measurements: Spectral Aerosol Optical Thickness Retrievals. J. Geophy. Res. Atmos. 2018, 123, 4221–4238. [Google Scholar] [CrossRef]
- Weihs, P.; Dirmhirn, I.; Czerwenka-Wenkstetten, I.M. Calibration of sunphotometer for measurements of turbidity. Theor. Appl. Climatol. 1995, 51, 97–104. [Google Scholar] [CrossRef]
- Li, X. Assessment of calibration results of sun photometers with conventional meteorological data. Meteorol. Sci. Technol. 2009, 37, 79–84. [Google Scholar] [CrossRef]
- Liu, J.J.; Wang, G.Y.; Xu, Z.X.; Liu, Y.; Wang, J.; Yan, Q.; Hua, D.X. Study on calibration method of sky radiometer and aerosol optical properties in Xi’an region. Infrared Laser Eng. 2020, 49, 257–263. [Google Scholar] [CrossRef]
- Tong, J.L.; Zhao, Y.R.; Zhao, Z.Y.; Zhang, W.Y. Research on calibration method of sunphotometer in semi-arid areas. Acta Opt. Sin. 2014, 34, 9–13. [Google Scholar] [CrossRef]
- Lee, K.H.; Li, Z.Q.; Cribb, M.C.; Liu, J.J.; Wang, L.; Zheng, Y.F.; Xia, X.G.; Chen, H.B.; Li, B. Aerosol optical depth measurements in eastern China and a new calibration method. J. Geophy. Res. Atmos. 2010, 115, D00K11. [Google Scholar] [CrossRef]
- Yang, Z.F. The Aerosol Optical Characteristics in Representative Regions Over China. Master’s Thesis, Chinese Academy of Meteorological Sciences, Beijing, China, 2008. [Google Scholar]
- Cerqueira, J.G.; Fernandez, J.H.; Hoelzemann, J.J.; Leme, N.M.P.; Sousa, C.T. Langley method applied in study of aerosol optical depth in the Brazilian semiarid region using 500, 670 and 870 nm bands for sun photometer calibration. Adv. Space Res. 2014, 54, 1530–1543. [Google Scholar] [CrossRef]
- Uchiyama, A.; Matsunaga, T.; Yamazaki, A. The instrument constant of sky radiometers (POM-02)—Part 1: Calibration constant. Atmos. Meas. Tech. 2018, 11, 5363–5388. [Google Scholar] [CrossRef]
- García, R.D.; García, O.E.; Cuevas, E.; Cachorro, V.E.; Barreto, A.; Guirado-Fuentes, C.; Kouremeti, N.; Bustos, J.J.; Romero-Campos, P.M.; Frutos, A.M. Aerosol optical depth retrievals at the Izaña atmospheric observatory from 1941 to 2013 by using artificial neural networks. Atmos. Meas. Tech. 2016, 9, 53–62. [Google Scholar] [CrossRef]
- Toledano, C.; Gonzalez, R.; Fuertes, D.; Cuevas, E.; Eck, T.F.; Kazadzis, S.; Kouremeti, N.; Grobner, J.; Goloub, P.; Blarel, L.; et al. Assessment of sun photometer Langley calibration at the high-elevation sites Mauna Loa and Izaña. Atmos. Chem. Phys. 2014, 18, 14555–14567. [Google Scholar] [CrossRef]
- Sayer, A.M.; Hsu, N.C.; Lee, J.; Bettenhausen, C.; Kim, W.V.; Smirnov, A.J.J.O.G.R.A. Satellite Ocean Aerosol Retrieval (SOAR) Algorithm Extension to S-NPP VIIRS as Part of the “Deep Blue” Aerosol Project. Available online: https://ladsweb.modaps.eosdis.nasa.gov/missions-and-measurements/products/AERDB_M3_VIIRS_SNPP (accessed on 13 March 2021).
- Doelling, D.R.; Sun, M.; Nguyen, L.T.; Nordeen, M.L.; Haney, C.O.; Keyes, D.F.; Mlynczak, P.E. Advances in Geostationary-Derived Longwave Fluxes for the CERES Synoptic (SYN1deg) Product. J. Atmos. Ocean. Tech. 2016, 33, 503–521. [Google Scholar] [CrossRef]
- Ignatov, A.; Minnis, P.; Loeb, N.; Wielicki, B.; Miller, W.; Sun-Mack, S.; Tanre, D.; Remer, L.; Laszlo, I.; Geier, E. Two MODIS aerosol products over ocean on the Terra and Aqua CERES SSF datasets. J. Atmos. Sci. 2005, 62, 1008–1031. [Google Scholar] [CrossRef]
- Biswas, J.; Pathak, B.; Patadia, F.; Bhuyan, P.K.; Gogoi, M.M.; Babu, S.S. Satellite-retrieved direct radiative forcing of aerosols over north-east India and adjoining areas: Climatology and impact assessment. Int. J. Climatol. 2017, 37, 298–317. [Google Scholar] [CrossRef]
- GMAO. MERRA-2 instM_2d_gas_Nx: 2d, Monthly mean, Instantaneous, Single-Level, Assimilation, Aerosol Optical Depth Analysis V5.12.4. Available online: https://disc.gsfc.nasa.gov/datasets/M2IMNXGAS_5.12.4/summary (accessed on 18 March 2021).
- Pang, S.T. Optical Characteristics of Aerosol in China Based on MERRA-2 Reanalysis and AERONET Ground-Based Remote Sensing. Master’s Thesis, Lanzhou University, Lanzhou, China, 2020. [Google Scholar]
- Zhang, Y. Variation of Total Ozone Over China for 30 Years and Meteorological Factors on Ozone Concentrations Near the Ground. Master’s Thesis, Nanjing University Information Science & Technology, Nanjing, China, 2014. [Google Scholar]
- Cuevas, E.; Milford, C.; Bustos, J.J.; del Campo-Hernández, R.; García, O.E.; García, R.D.; Gómez-Peláez, A.J.; Guirado-Fuentes, C.; Marrero, C.; Prats, N.; et al. Izaña Atmospheric Research Center Activity Report 2015–2016; State Meteorological Agency (AEMET): Madrid, Spain; World Meteorological Organization: Geneva, Switzerland, 2017. [Google Scholar]
- Yang, Z.F.; Zhang, X.Y.; Che, H.Z.; Zhang, X.C.; Hu, X.Q.; Zhang, L.J. An introductory study on the calibration of CE318 sunphotometer. J. Appl. Meteorol. Sci. 2008, 19, 297–306. [Google Scholar] [CrossRef]
- Liu, J.; Wang, X.J. Assessment on main kinds of satellite cloud climate datasets. J. Appl. Meteorol. Sci. 2017, 28, 654–665. [Google Scholar] [CrossRef]
- Karlsson, K.G.; Anttila, K.; Trentmann, J.; Stengel, M.; Solodovnik, I.; Meirink, J.F.; Devasthale, A.; Kothe, S.; Jääskeläinen, E.; Sedlar, J.; et al. CLARA-A2.1: CM SAF Cloud, Albedo and Surface Radiation Dataset from AVHRR data—Edition 2.1. Available online: https://wui.cmsaf.eu/safira/action/viewDoiDetails?acronym=CLARA_AVHRR_V002_01 (accessed on 18 March 2021).
- Chi, A.; Peter, K.; Matthew, L.; Joao, T. GPS Radio Occultation Boundary Layer Depth Annual L3 V1. Available online: https://disc.gsfc.nasa.gov/datasets/GPSROZPBLA_1/summary (accessed on 20 March 2021).
- Liu, L.Y.; Yao, Y.Q.; Yin, J.; Wang, H.S.; Li, J.R.; Zhou, Y.H.; You, X.L.; Tang, P.; Zhao, X.Y.; Ma, D.Q.; et al. Site testing campaign for the Large Optical Telescope at the Ali site. Res. Astron. Astrophys. 2020, 20, 63–72. [Google Scholar] [CrossRef]
- Qian, X.; Yao, Y.; Wang, H.; Wang, Y.; Bai, Z.; Yin, J. The Characteristics at the Ali Observatory Based on Radiosonde Observations. Publ. Astron. Soc. Pac. 2018, 130, 125002. [Google Scholar] [CrossRef]
- Liu, L.; Yao, Y.; Vernin, J.; Chadid, M.; Wang, Y.; Wang, H.; Yin, J.; Giordano, C.; Qian, X. Atmospheric turbulence measurements at Ali Observatory, Tibet. In Ground-Based and Airborne Telescopes IV; SPIE: Bellingham, WA, USA, 2012; Volume 8444. [Google Scholar]
- Qian, X.; Yao, Y.; Zou, L.; Wang, H.; Li, J. Optical turbulence in the atmospheric surface layer at the Ali Observatory, Tibet. Mon. Not. R. Astron. Soc. 2022, 510, 5179–5186. [Google Scholar] [CrossRef]
- Qian, X.; Yao, Y.; Wang, H.; Liu, L.; Li, J.; Yin, J. Numberical calculations of atmospheric conditions over Tibetan Plateau by using WRF Model. J. Phys. Conf. Ser. 2015, 595, 012028. [Google Scholar] [CrossRef]
- Wang, H.S.; Yao, Y.Q.; Liu, L.Y. Forecast of atmosphere optical turbulence at Ali site by weather research and forecasting model. Acta Photonica Sin. 2013, 33, 39–43. [Google Scholar] [CrossRef]
Figure 1.
Distribution of meteorological stations, astronomical stations, and SONET stations (totaling 511 stations) below 37° N in China.
Figure 1.
Distribution of meteorological stations, astronomical stations, and SONET stations (totaling 511 stations) below 37° N in China.

Figure 2.
Distribution of stations (totaling 65) in accordance with atmospheric stability.
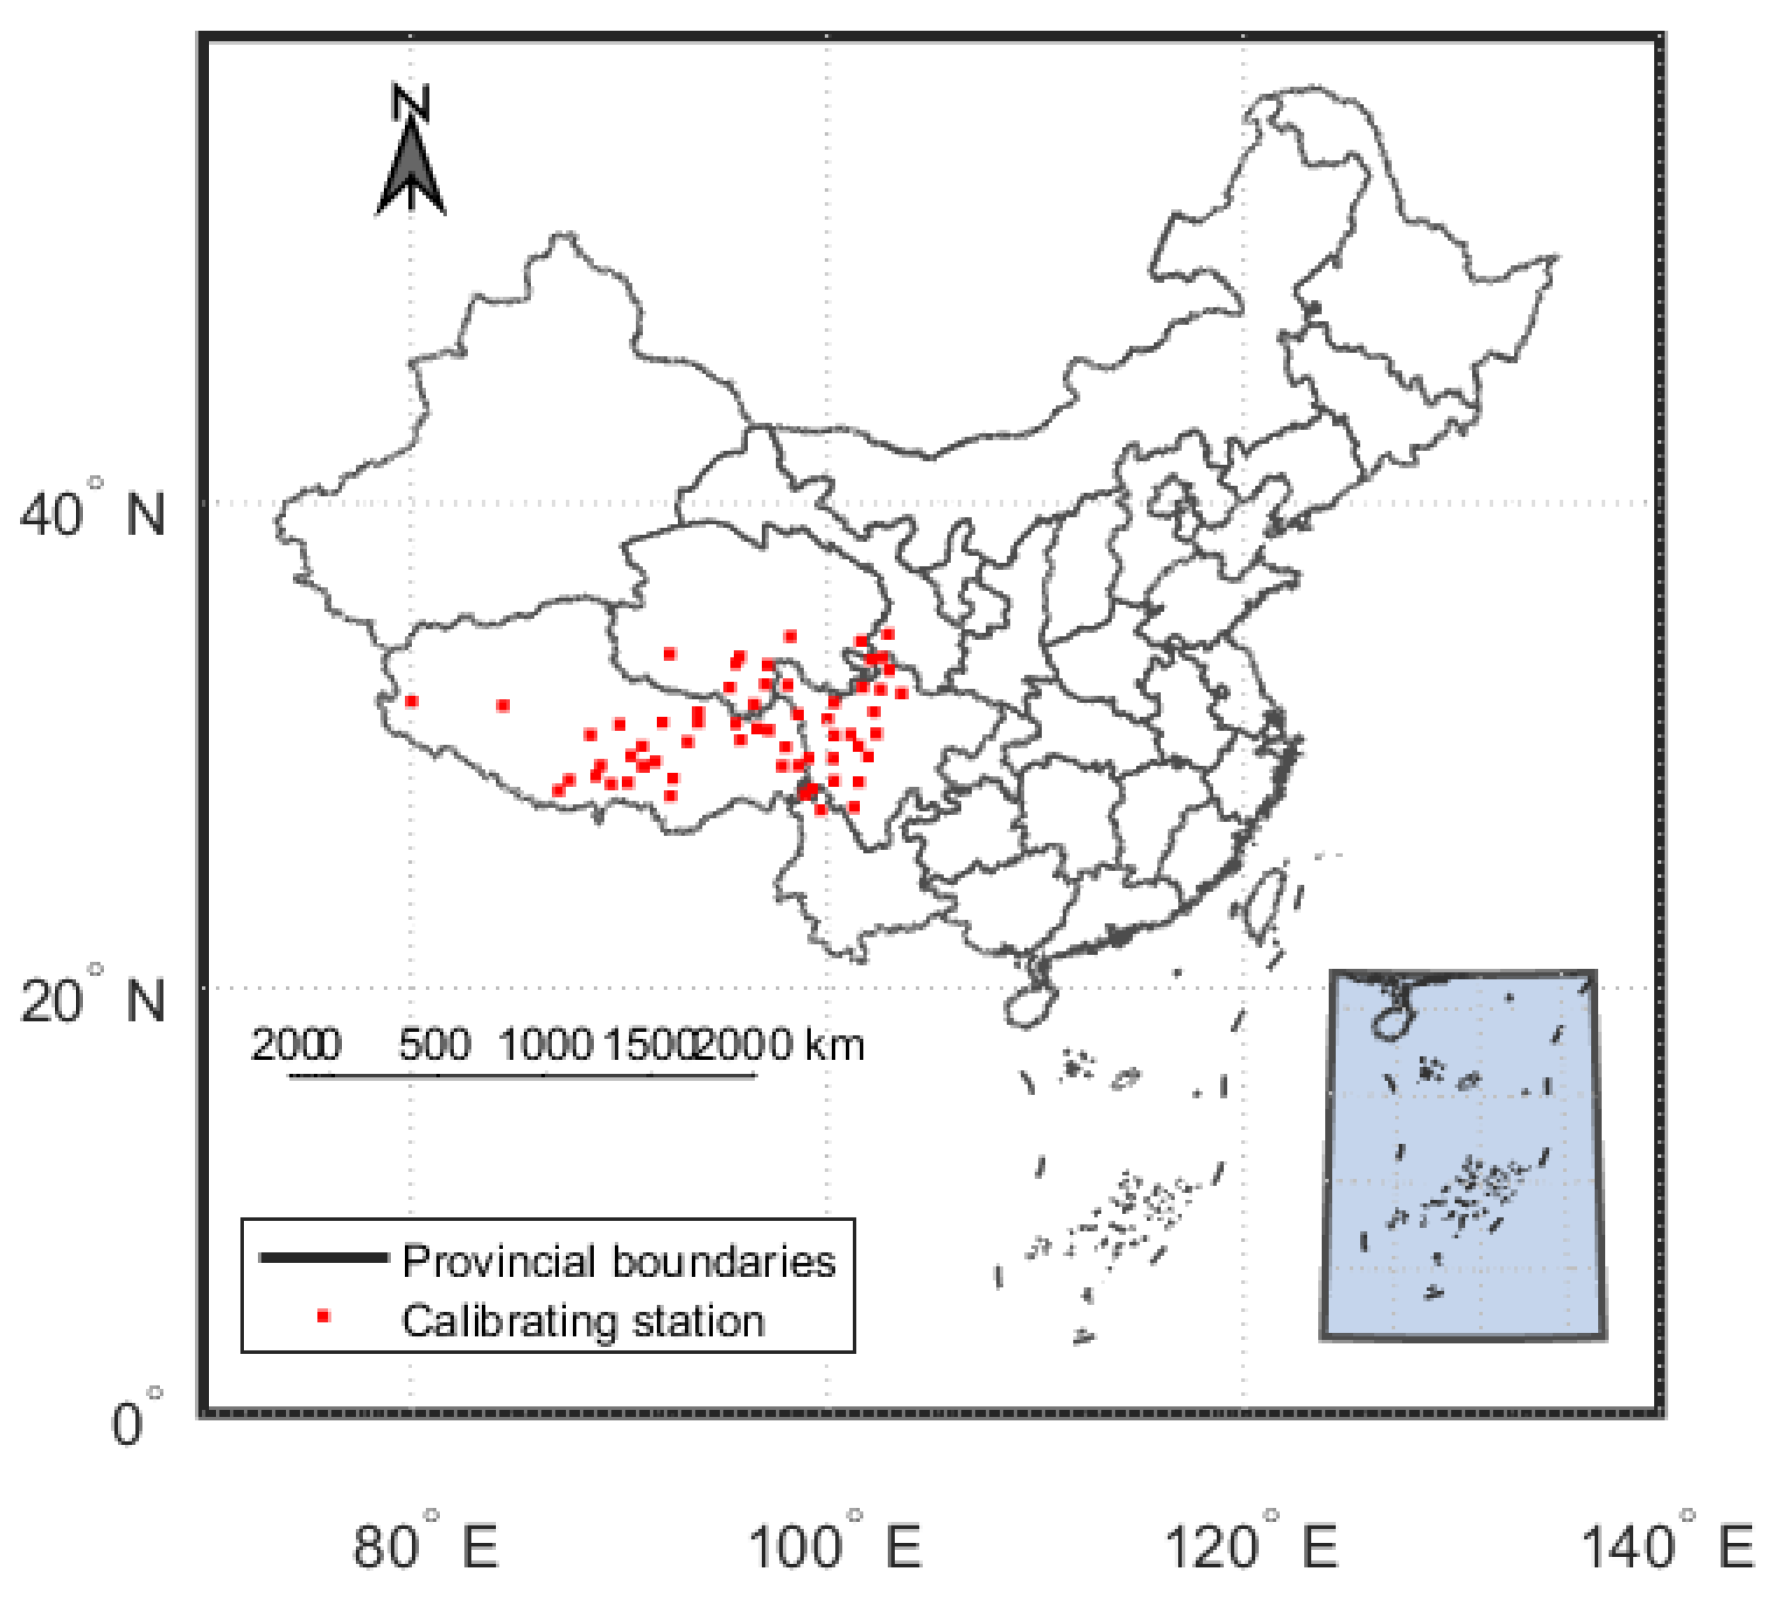
Figure 3.
Distribution of stations (totaling 2) meeting the conditions of clear-sky days.
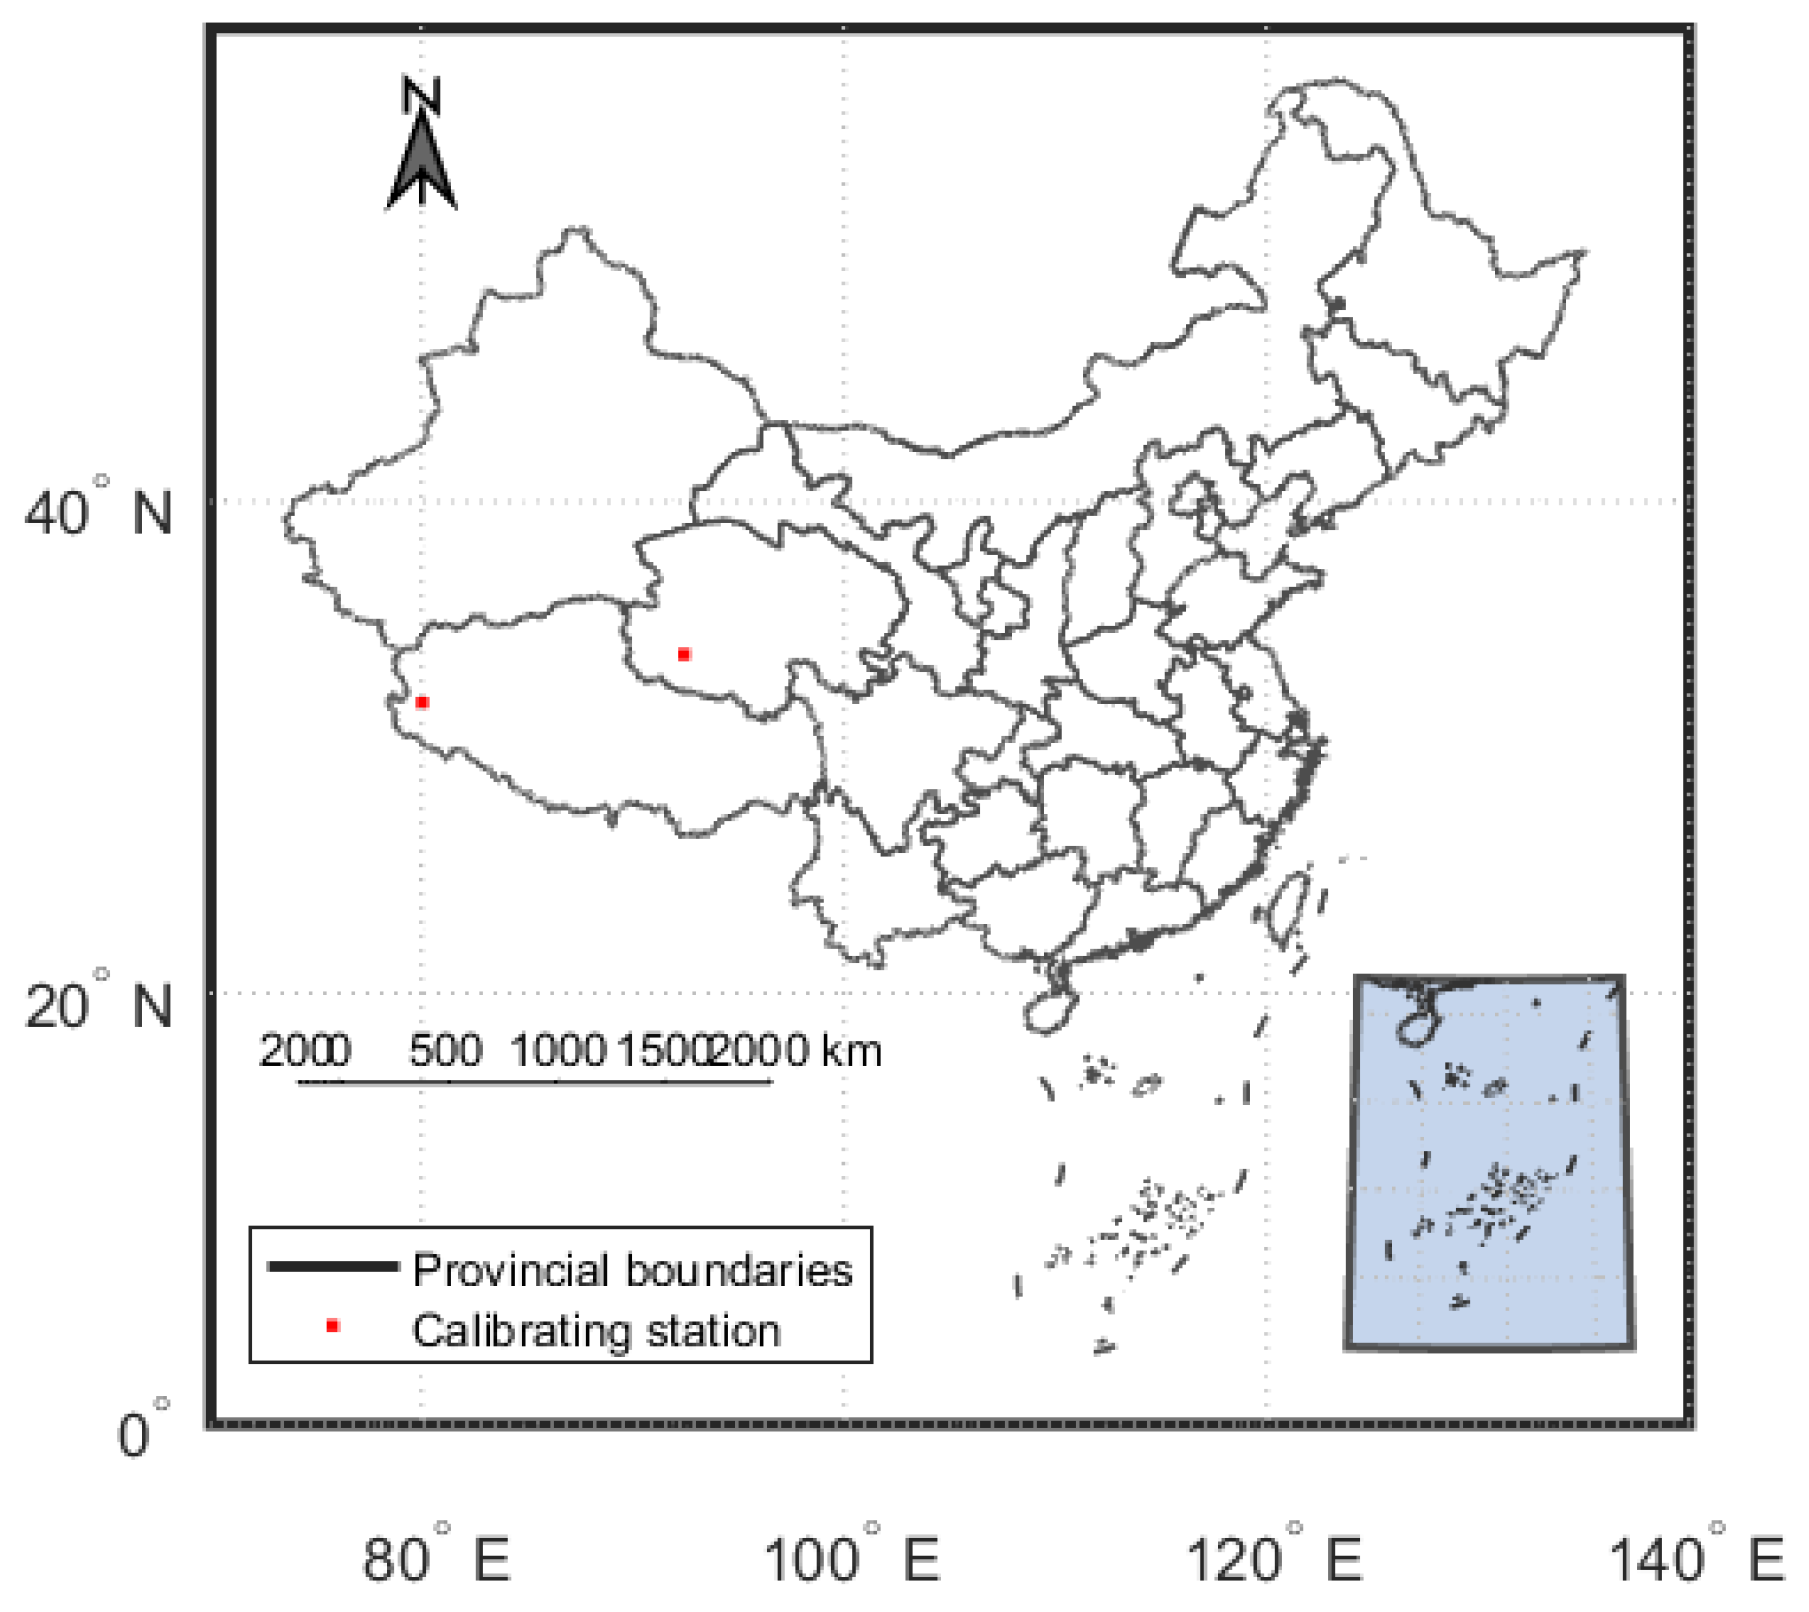
Figure 4.
Depth analysis of boundary layer.
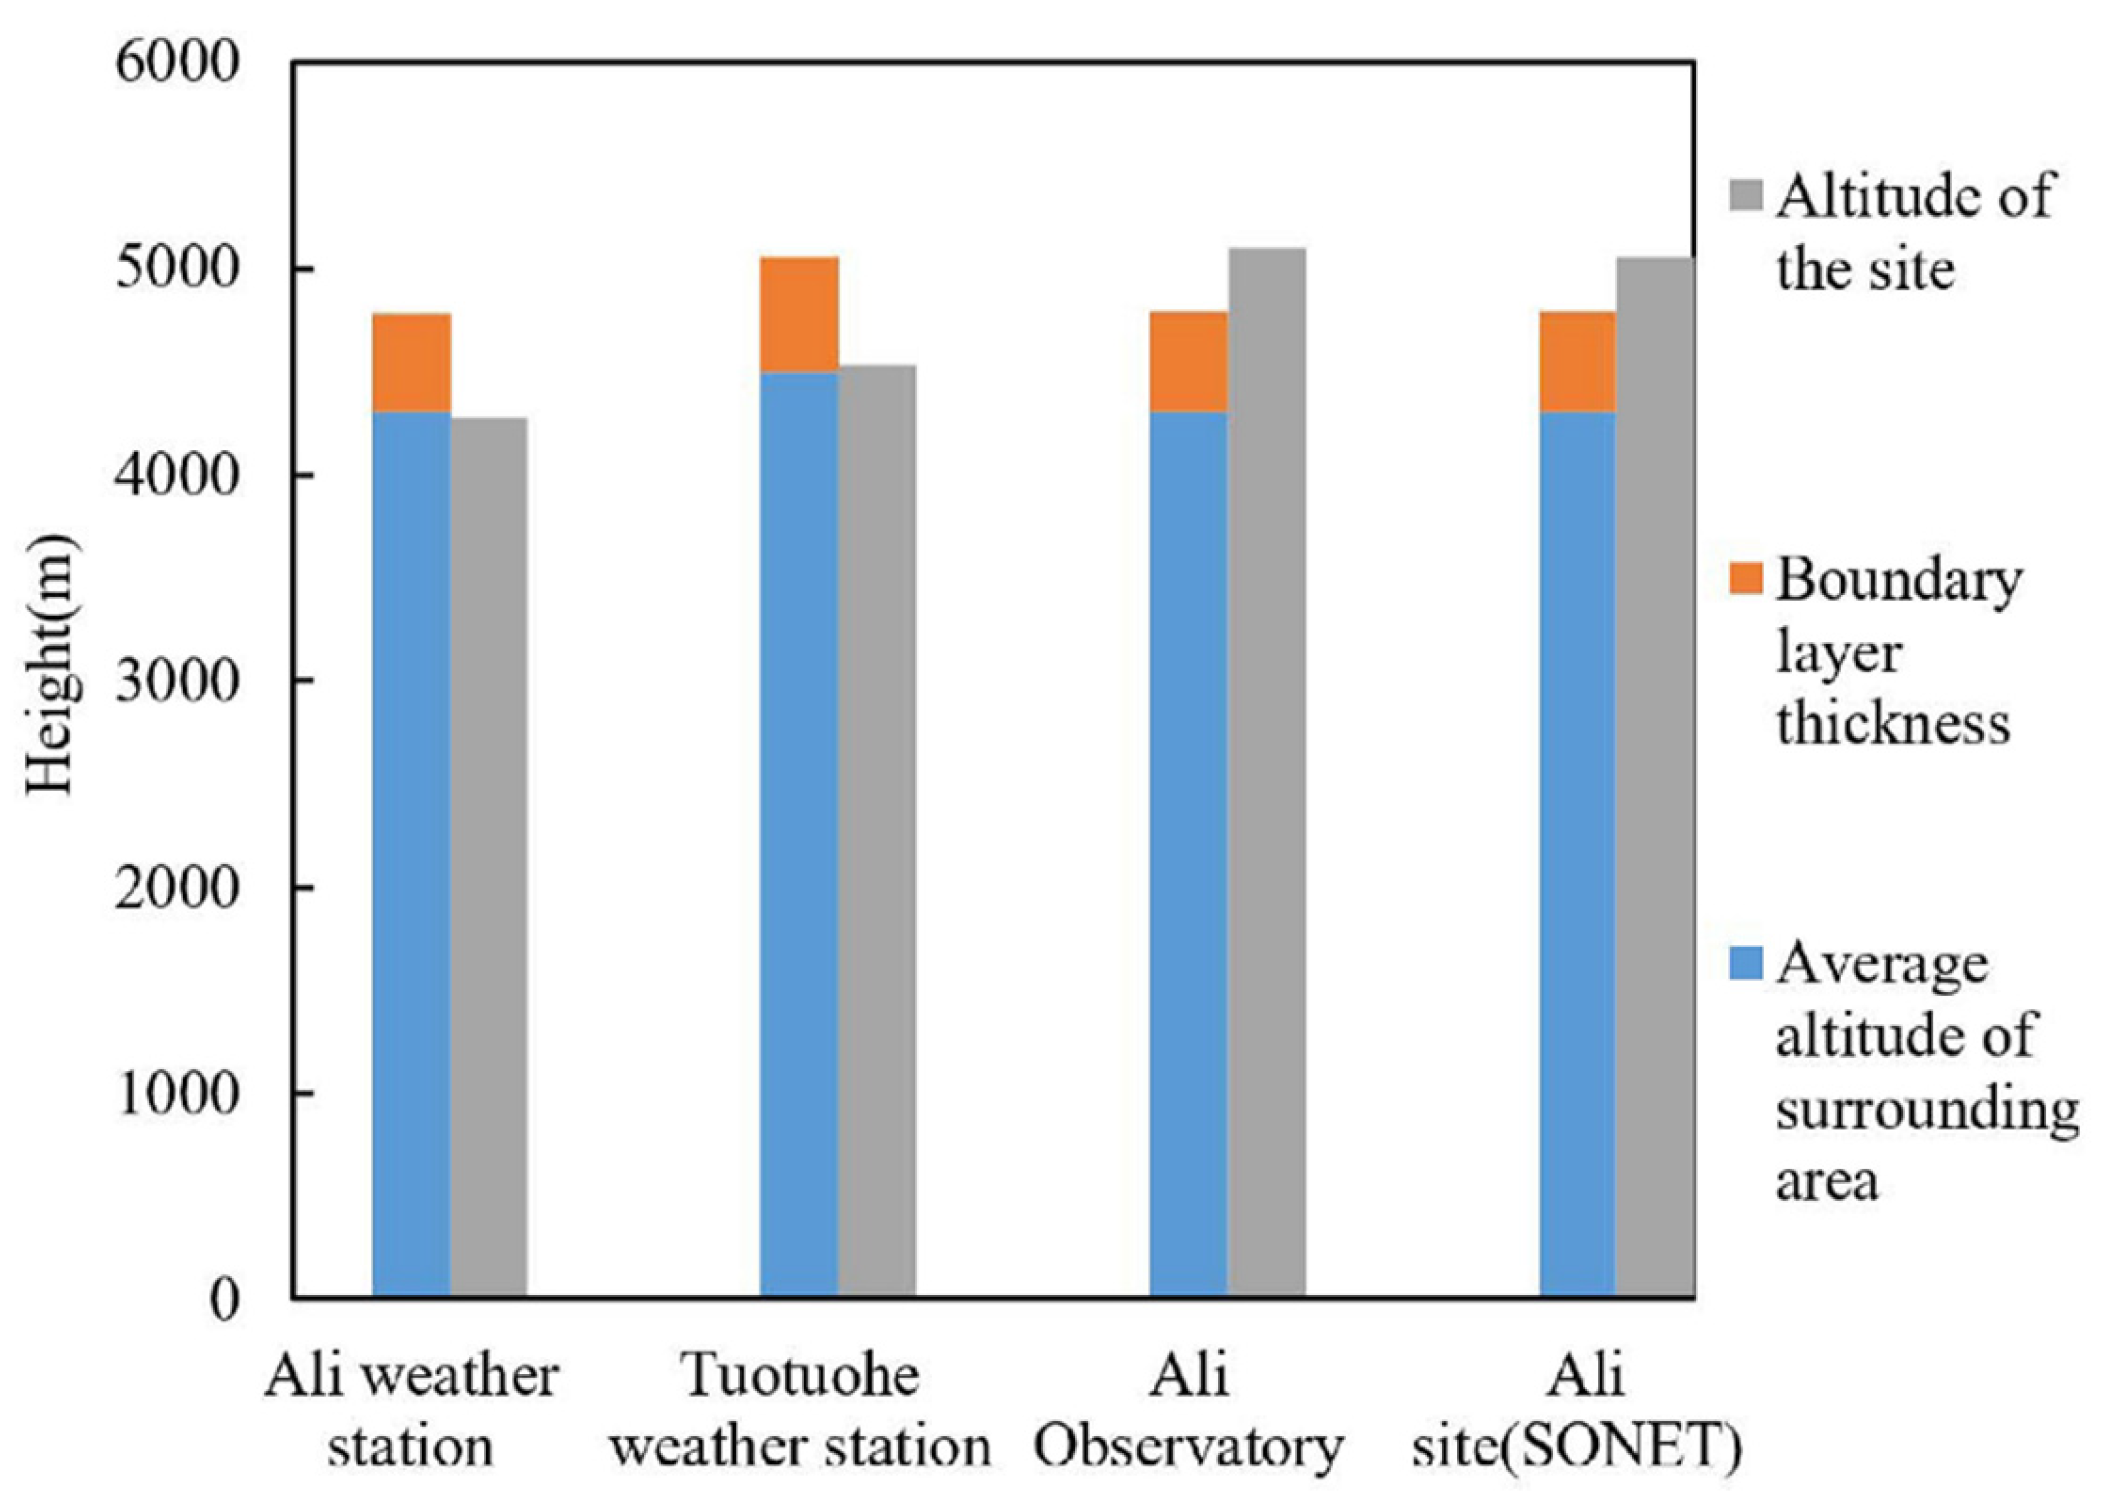
Figure 5.
Overall statistical data of the monthly mean AOD and the monthly standard deviation of the Ali observatory from data of SNPP between 2013 and 2020 and of MERRA-2 between 2011 and 2020.
Figure 5.
Overall statistical data of the monthly mean AOD and the monthly standard deviation of the Ali observatory from data of SNPP between 2013 and 2020 and of MERRA-2 between 2011 and 2020.
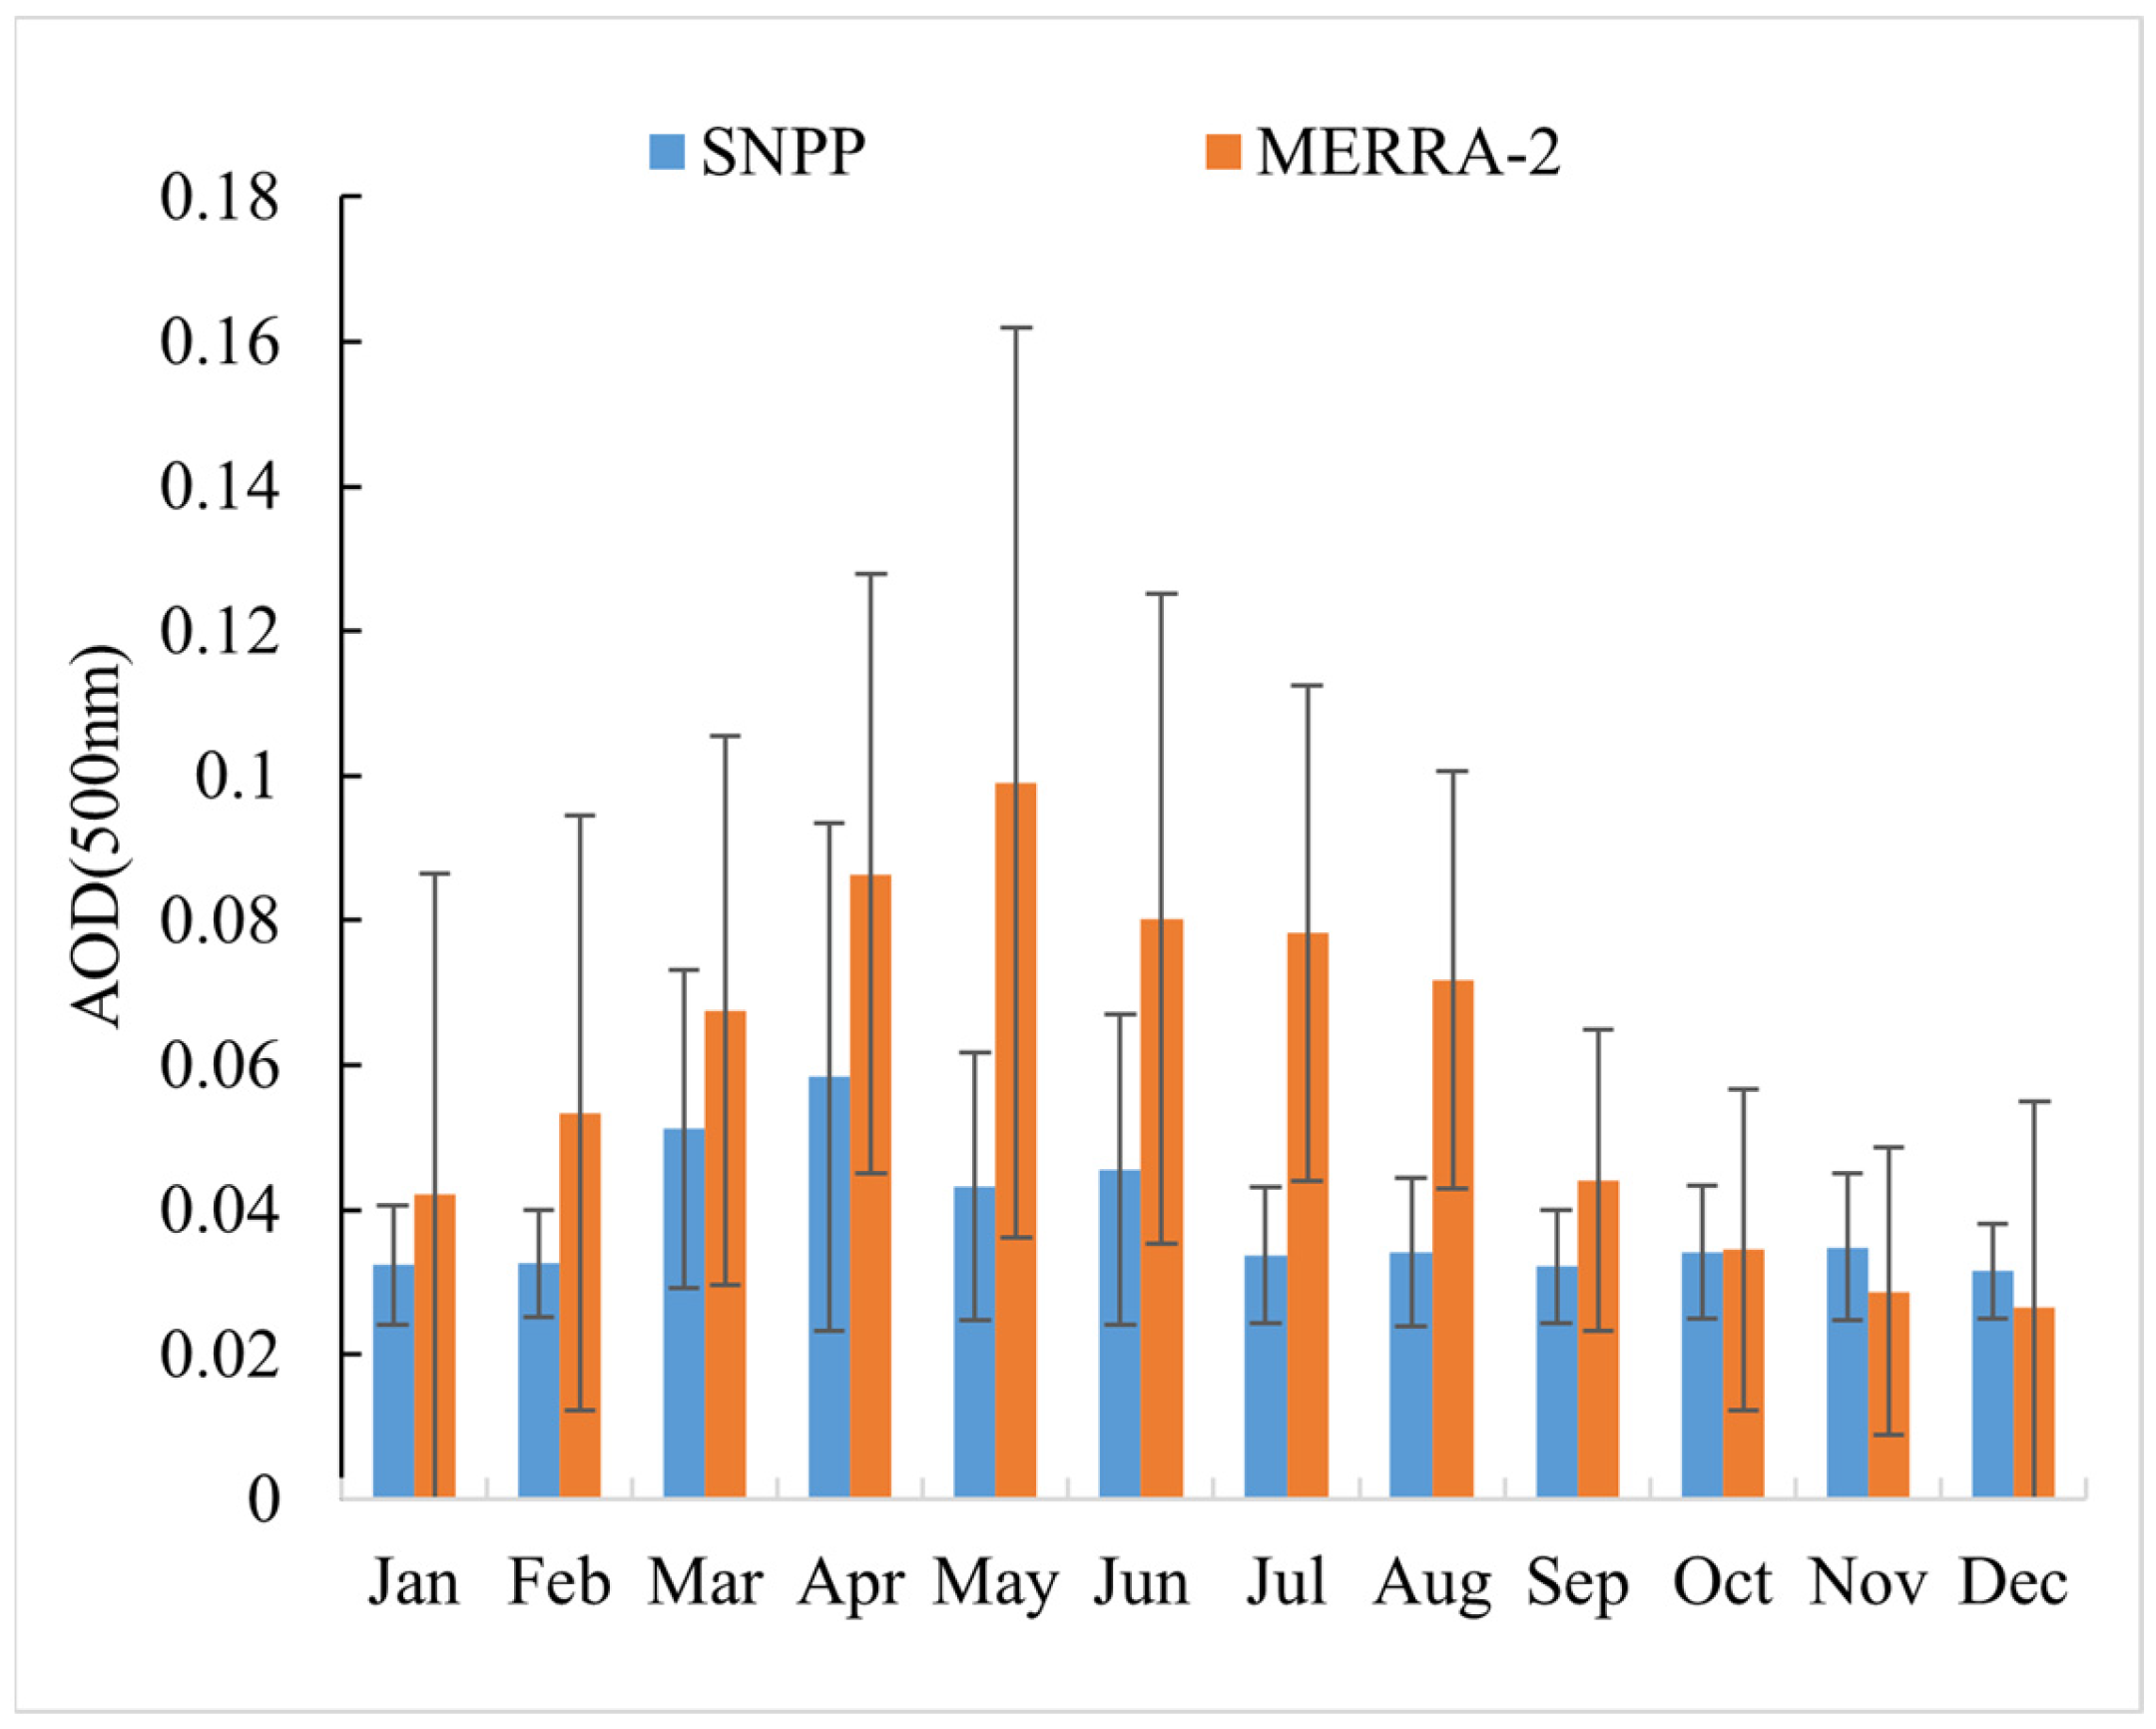
Figure 6.
The monthly average number of clear-sky days at the Ali observatory.

Table 1.
Information of satellite-derived measurements.
| Data Sources | Data Name | Time Resolution | Horizontal Resolution Grid | Time Interval of Data |
|---|---|---|---|---|
| SNPP/VIIRS | AERDB_M3_VIIRS_SNPP | Monthly | 1° × 1° | 2013–2020 |
| CERES | CERES_SSF1deg_Ed4.1 (Terra-MODIS) | Monthly | 1° × 1° | 2011–2020 |
| MERRA-2 | instM_2d_gas_Nx | Monthly | 0.625° × 0.5° | 2011–2020 |
Table 2.
The mean number of clear-sky days per month over the Ali weather station, the Tuotuohe weather station, the Ali observatory, and SONET’s Ali station, derived from NOAA_19/AVHRR and METOP-A/AVHRR cloud products between 2013 and 2018.
Table 2.
The mean number of clear-sky days per month over the Ali weather station, the Tuotuohe weather station, the Ali observatory, and SONET’s Ali station, derived from NOAA_19/AVHRR and METOP-A/AVHRR cloud products between 2013 and 2018.
| Station | Address | Latitude (°N) | Longitude (°E) | Altitude (m) | Mean Number of Clear-Sky Days per Month |
|---|---|---|---|---|---|
| Ali weather station | Shiquanhe, Ali, Tibet | 32.5 | 80.08 | 4278.6 | 14.47 |
| Tuotuohe weather station | Tanggulashan, Golmud, Qinghai | 34.22 | 92.43 | 4533.1 | 16.76 |
| Ali observatory | Shiquanhe, Ali, Tibet | 32.33 | 80.03 | 5100 | 20.33 |
| SONET’s Ali station | Shiquanhe, Ali, Tibet | 32.33 | 80.03 | 5053 | 20.21 |
Table 3.
Comparison of the key station characteristics with the other best-known stations in the world.
Table 3.
Comparison of the key station characteristics with the other best-known stations in the world.
| Station | Latitude | Monthly Mean AOD a | Monthly Mean Standard Deviation of AOD | Monthly Mean Number of Clear-Sky Days b | Position in the Atmosphere |
|---|---|---|---|---|---|
| Ali observatory | 32.33° N | 0.059 | 0.013 | 20.33 | Free troposphere |
| Mauna Loa observatory | 19.88° N | 0.096 | 0.044 | 24.17 | Free troposphere |
| Izaña observatory | 28.31° N | 0.142 | 0.099 | 19.58 | Free troposphere |
a The monthly mean AOD and the monthly mean standard deviation of AOD at the Ali observatory, the Mauna Loa observatory, and the Izaña observatory are from MERRA-2 data from 2011 to 2020. b The monthly mean number of clear-sky days at the Mauna Loa observatory and the Izaña observatory are from Table 1 of Toledano et al. [40] The Mauna Loa observatory and the Izaña observatory are in the free troposphere, and taken from Toledano et al. [40] and Cuevas et al. [48].
Disclaimer/Publisher’s Note: The statements, opinions and data contained in all publications are solely those of the individual author(s) and contributor(s) and not of MDPI and/or the editor(s). MDPI and/or the editor(s) disclaim responsibility for any injury to people or property resulting from any ideas, methods, instructions or products referred to in the content. |
© 2023 by the authors. Licensee MDPI, Basel, Switzerland. This article is an open access article distributed under the terms and conditions of the Creative Commons Attribution (CC BY) license (https://creativecommons.org/licenses/by/4.0/).
Share and Cite
MDPI and ACS Style
Xun, L.; Liu, X.; Lu, H.; Zhang, J.; Yan, Q. Screening Approach of the Langley Calibration Station for Sun Photometers in China. Atmosphere 2023, 14, 1641. https://doi.org/10.3390/atmos14111641
AMA Style
Xun L, Liu X, Lu H, Zhang J, Yan Q. Screening Approach of the Langley Calibration Station for Sun Photometers in China. Atmosphere. 2023; 14(11):1641. https://doi.org/10.3390/atmos14111641
Chicago/Turabian StyleXun, Lina, Xue Liu, Hui Lu, Jingjing Zhang, and Qing Yan. 2023. "Screening Approach of the Langley Calibration Station for Sun Photometers in China" Atmosphere 14, no. 11: 1641. https://doi.org/10.3390/atmos14111641
Note that from the first issue of 2016, this journal uses article numbers instead of page numbers. See further details here.