
Chemical Composition and Source of PM2.5 during Winter Heating Period in Guanzhong Basin
by
Lei Cao
1,2,
Yanan Tao
1,2,
Hao Zheng
1,2,
Mei Wang
3,
Shiying Li
4,
Yongjiang Xu
5 and
Mei Li
5,6,* 1
Shaanxi Environmental Monitoring Center Station, Xi’an 710043, China
2
Shaanxi Key Laboratory for Environmental Monitoring and Forewarning of Trace Pollutants, Xi’an 710054, China
3
Guangzhou Hexin Analytical Instrument Company Limited, Guangzhou 510530, China
4
Institute for Environmental and Climate Research, Jinan University, Guangzhou 511443, China
5
Institute of Mass Spectrometry and Atmospheric Environment, Guangdong Provincial Engineering Research Center for On-line Source Apportionment System of Air Pollution, Jinan University, Guangzhou 510632, China
6
Guangdong-Hongkong-Macau Joint Laboratory of Collaborative Innovation for Environmental Quality, Guangzhou 511443, China
*
Author to whom correspondence should be addressed.
Atmosphere 2023, 14(11), 1640; https://doi.org/10.3390/atmos14111640
Submission received: 11 August 2023
/
Revised: 18 September 2023
/
Accepted: 26 September 2023
/
Published: 31 October 2023
(This article belongs to the Special Issue Measurements of Physico-Chemical Properties of Atmospheric Aerosols and Their Impacts in Air Pollution and Climate)
Abstract
:An intensive field campaign was carried out from December 2022 to March 2023 at six different sites across five major cities (Xi’an, Baoji, Xianyang, Weinan, and Hancheng) in the Guanzhong Basin, China, covering most of the heating period there, which is characterized by high PM2.5 pollution levels. During the campaign, the mean PM2.5 concentrations at these sites exceeded the 24 h PM2.5 standard (75 μg m−3), except the site at Hancheng, with mean PM2.5 concentrations of 57.8 ± 32.3 μg m−3. The source apportionment of PM2.5 varied significantly across sites, with vehicle exhaust being the dominant source at urban sites located in Xi’an and Baoji, coal combustion at suburban sites in Hancheng, and comparable contribution from coal combustion and industrial emissions at suburban sites in Xianyang and Weinan. Compared with clean condition, the contribution of vehicle exhaust and secondary inorganic sources (SIs) were largely enhanced during heavy PM2.5 pollution periods, while the contribution from biomass burning (BB) and dust decreased significantly at all sites. Combined with an analysis of meteorological parameters, the study further found that higher contributions of SIs and heavy PM2.5 pollution were generally associated with higher relative humidity (RH). In addition, higher PM2.5 concentrations at suburban sites were related to lower wind speeds, which could be explained by the stagnant condition favoring the accumulation of local emissions as well as the formation of secondary pollutants. In contrast, at urban sites (e.g., Xianyang), higher PM2.5 concentrations were more associated with the strong influence of vehicle exhaust at slightly higher wind speeds.
1. Introduction
Fine particulate matter (PM2.5) is a major pollutant of the atmosphere, which has been assumed to influence air quality, visibility, radiative forcing, and have adverse impacts on human health [1,2,3,4]. The composition of the PM2.5 is extremely variable depending on numerous factors (sources, seasons, geographic area, etc.), but generally speaking, it can refer to a composition that typically includes nitrate, sulfate, ammonium, organic matter, and black carbon [5,6,7,8]. Rapid economic growth, industrialization, and urbanization in China have led to frequent occurrences of high concentrations of PM2.5 [9,10], drawing significant scientific and political attention. With the implementation of the “Air Pollution Prevention and Control Action Plan” in 2013 and “Blue Sky Protection Campaign” in 2017, notable reductions in PM2.5 have been achieved in economically developed areas of China such as the Beijing–Tianjin–Hebei region (39.6% reduction from 2013 to 2017, and 20.3% reduction from 2017 to 2020), the Yangtze River Delta area (34.3% reduction from 2013 to 2017, and 20.5% reduction from 2017 to 2020), and the Pearl River Delta (27.7% reduction from 2013 to 2017) [11]. Despite the decreasing trend in the annual average PM2.5, extremely high PM2.5 cases during winter were still frequently observed in cities around northwestern China, particularly in the Guanzhong Plain [12,13,14]. In order to formulate efficient control strategies and substantially reduce the frequency of severe haze events, a comprehensive understanding and thorough investigation of the regional sources and dominant contributing factors are still required.
Air pollution in the Guanzhong Plain typically exhibits distinct regional characteristics, influenced by both meteorological factors and emission sources. As part of the Fenwei plain in the northwestern region of China, the Guanzhong Plain has been recognized as a heavily air-polluted region [15,16,17,18]. The topography of the Guanzhong Plain is unique, with a relatively flat plain at the center surrounded by the Qinling Mountains to the south and the Loess Plateau to the north [19]. The mountain ranges act as natural barriers, influencing the movement of air masses and climate patterns in the region. Anthropogenic emissions are also significant contributors to PM2.5 in the Guanzhong Plain. The primary local emission sources, including the coal combustion industry, coke production, and power plants [15,20,21], release various air pollutants, such as particulate matter (PM), sulfur dioxide (SO2), nitrogen oxides (NOx), volatile organic compounds (VOCs), and carbon monoxide (CO). The conventional pollution pattern of the Guanzhong Plain involves pollutants initially passing through the North China Plain and Shanxi Province, then entering the northeastern area of the Guanzhong Plain, where they further mix with local fresh emissions and are eventually transported toward the central cities of the Guanzhong Plain. This leads to the accumulation and circulation of pollutants within the plain, ultimately leading to regional air pollution [15]. Such distinctive pollution patterns exacerbate pollution levels while also perpetuating the process for extended periods of time.
Numerous studies have been conducted to characterize the variation trends and sources of PM2.5 in the Guanzhong Plain. In terms of seasonal variations, a consistent observation reveals that PM2.5 tends to reach its highest values during wintertime in Xi’an [22,23]. High levels of PM2.5 are primarily attributed to increased pollutant emissions and unfavorable meteorological conditions which impede the diffusion of pollutants [24,25]. As evidenced by several studies, the primary sources of PM2.5 during wintertime were typically vehicle emissions, coal burning, and biomass burning [22,26,27]. The varied contributions can be traced to specific emissions across different cities and inter-annual variations. References [23,28,29] pointed out that Xianyang, which is located in the Guanzhong Plain, experienced an effective reduction in PM2.5 during the heating season from 2018 to 2021. Nevertheless, according to data from the Shaanxi Provincial Environmental Monitoring Station, PM2.5 during the heating season in the five major cities in the Guanzhong Plain barely decreased after 2021, and even showed a reverse increment in 2023. This suggests that meteorological factors as well as the impact of anthropogenic activities after the epidemic might contribute to the elevation of PM2.5.
To date, the majority of studies have focused on the central city of the Guanzhong Plain—Xi’an. Only a limited number of studies have performed simultaneous regional measurements across the region. Spatial differences in source emission may lead to a scarcity of information regarding how to effectively implement coordinated air quality control measures. Moreover, most studies have exclusively focused on source apportionment results or solely evaluated the effects of meteorological conditions on the pollution process, which will neglect the potential synergistic interplay between meteorological factors and source emissions.
In the present study, five sites across the Guanzhong Plain were selected, employing single-particle aerosol mass spectrometers (SPAMSs) with high temporal resolution to investigate the spatiotemporal pattern of PM2.5 concentration during heating season. Through analyzing the PM2.5 chemical composition and the identification of sources, the study aimed to characterize the transport and formation processes of regional air pollution. Additionally, meteorological factors were further analyzed to explore the corresponding diffusion conditions and ascertain the main driving factors affecting the air quality.
2. Experimental Methods
2.1. Sampling
The whole campaign was carried out from December 2022 to March 2023, covering most of the winter heating period. Six sites in five cities in the Guanzhong Basin were selected, and the measurements were conducted for about 3 weeks at each site. Detailed information of the six sites is listed in Table 1. Except for XA and BJ, where the SPAMSs are located at permanent observatories, the measurement was conducted in mobile monitoring vehicles in the other four sites. The selected sites represent different environments:
- (1)
- XA is located in the south of Xi’an city, mainly in the commercial and living areas, and is close to the intersection of three highways.
- (2)
- XASP is located in the north of Xi’an city, mainly in the living areas, and is close to one circling expressway in Xi’an.
- (3)
- BJ is located in the center of Baoji city and is very close to city expressways.
- (4)
- XYXP is located in the area surrounded by chemical industries.
- (5)
- WNHZ is near Shaanxi Chemical Industry Group Co., Ltd. Staff Hospital, surrounded by Shaanxi Chemical Industry Group and other industries.
- (6)
- HC is 50 m northeast of Helimeijiao Co., Ltd., surrounded by many coking and coal-coking industries.
2.2. SPAMS and Data Analysis
Single-particle aerosol mass spectrometers (SPAMSs, Hexin Analytical Instrument Co., Ltd., Guangzhou, China) are used in this study for the online in situ measurements of the size and chemical composition of ambient aerosol particles. The principle and performance of SPAMSs was introduced in-detail in several previous works (e.g., Li et al., 2011 [30]; Zhou et al., 2016 [31]). In short, particles are introduced from the environment into the vacuum system through a ~100 mm critical orifice, then pass through the aerodynamic lens and are accelerated to a size-dependent velocity, gradually accumulating on the axis of the lens as the pressure differential changes. The particle beam passes through two 532 nm lasers and the signals are recorded using two photomultiplier tubes (PMTs), monitoring the time passing of each particle and thus measuring the size each particle. Particles are individually ionized in the center of the ion source region by a pulsed 266 nm Nd:YAG laser (1.0 mJ). The positive and negative ions are then entered into a mass spectrometry analysis system (a bipolar time-of-flight mass spectrometer) to determine the chemical components of the particles.
The MATLAB-based COCO V1.4 software package was used to process the SPAMS data. The collected particulates were classified through two steps [30]. First, the adaptive resonance neural network algorithm (ART-2a) [31] was applied to classify the single-particle mass spectrum. Particles with similar ion peak intensities were classified into the same category, using parameters including a vigilance factor of 0.65, a learning rate of 0.05, and a maximum of 20 iterations. Then, based on chemical composition characteristics, the initial categories of particles were further grouped into 10 categories to basically cover the major components of ambient particles and better help the identification of the sources of particles [32,33,34,35,36,37,38], namely elemental carbon (EC), organic carbon (OC), high-molecular organic carbon (HOC), mixed carbon (ECOC), rich sodium (Na-rich), potassium-rich particles (K-rich), levoglucosan particles (LEV), heavy metal particles (HM), mineral particles (MD), and others (other).
Finally, based on the emission characteristics of the mass spectrum from various pollution sources collected in previous SPAMS studies combined with the source tracer method [16,39,40,41,42,43,44], we analyzed the spectral characteristics of ambient particles and as-signed them into eight sources, namely cooking, dust, biomass burning, vehicle exhaust, coal combustion, industrial, secondary formation of inorganic compositions, and other sources. The choice of the 8 sources is based on previous studies in Xi’an and covers most of the sources for particles in the Guanzhong Basin [15,23,35,36]. Among them, the cooking source mainly includes soot particles generated during the cooking process; the dust source includes road dust, soil dust, and construction dust; vehicle exhaust mainly includes exhaust particles produced by gasoline vehicles, diesel vehicles, and other mobile traffic; coal combustion mainly includes coal chemical enterprises, power plants, and residents who use coal as fuel; industrial sources mainly include non-combustion process sources; secondary inorganic sources mainly include particles containing only secondary components such as sulfates, nitrates, and ammonium salts; and particles not classified into the above sources are defined as others. Based on the measured aerosol chemical composition, the contribution of the 8 sources to particulate matter is determined.
3. Results
3.1. PM2.5 Pollution Overview
During the campaign, PM2.5 concentrations varied significantly across the sites. The highest PM2.5 pollution level was found at the XYXP site, with a mean concentration of 98.6 ± 56.9 μg m−3, followed by WNHZ (83.2 ± 46.5 μg m−3), XASP (81.6 ± 40.0 μg m−3), XASZ (80.8 ± 42.8 μg m−3), BJ (80.6 ± 49.2), and HC (57.8 ± 32.3). Based on the China Air Quality Index (AQI), the PM2.5 concentrations could be classified into six levels: (1) excellent with concentrations < 35.0 μg m−3, (2) good for those in the range of 35.0–75.0 μg m−3, (3) light pollution for 75.0–115 μg m−3, (4) medium pollution for 115–150 μg m−3, (5) heavy pollution for 150–250 μg m−3, and (6) serious pollution for > 250 μg m−3. Figure 1 shows fractions of PM2.5 levels at these six sites. The XYXP site again showed the highest probability of PM2.5 pollution (60.9%), of which 2.01% is for serious pollution, 15.0% for heavy pollution, 17.1% for median pollution, and 26.8% for light pollution. The probability of PM2.5 pollution was similar at the XASZ, XASP, BJ, and WNHZ sites, around 51.3–53.1%, except that only the BJ site showed the occurrence of serious pollution with a probability of 0.192%. The HC site showed the lowest probability of PM2.5 pollution, with zero occurrence of heavy pollution and serious pollution, namely the highest probability of excellent and good air quality in terms of PM2.5 concentrations. The mean concentrations obtained in this study are relatively lower than the mean value of 137.0 μg m−3 observed in the Xi’an–Xianyang region from January to February in 2019 [15]. This is consistent with the decreasing trend of PM2.5 in the Fenwei Plain from 2017 to 2019 [15], reflecting the achievement of local efforts to mitigate air pollution. Similarly, much higher probabilities of PM2.5 pollution in Xi’an were reported by Xu et al. [23] during the wintertime of 2006, 2008, and 2010 (96.6%, 93.1%, and 92.9%, respectively). Keep in mind that the AQI is intended for daily PM2.5 concentrations, while the results here are hourly data. Therefore, the probability of the PM2.5 level here may be different from the results based on daily averages.
Figure 2 shows the wind maps of PM2.5 concentrations at 5 of the 6 sites (excluding XASZ). The dominant wind direction varied largely across the sites. For example, the dominant wind direction is northwest at XYXP and WNHZ, northeast at XASP and HC, and southeast at BJ. PM2.5 concentrations were generally relatively higher with relatively lower wind speeds regardless of wind direction. The only exception is at XASP and BJ, where the highest PM2.5 concentrations occurred at relatively higher wind speeds (>1 m s−1). It is interesting to note that both the highest and the lowest PM2.5 concentrations at XASP were found at relatively higher wind speeds (>1 m s−1), the former of which is under the influence of the northeast wind, and the latter corresponds to the west wind.
Figure 3 presents the chemical composition of PM2.5 at these sites. Keeping in mind that the classification of PM2.5 chemical composition based on the SPAMS instrument is different from the one based on other instruments (e.g., ion chromatography for water-soluble ions and X-ray fluorescence for inorganic elements). On the other hand, it is more like categorizing PM2.5 chemical composition into different factors used especially for source identification, which will be discussed in detail in the following section. As seen from Figure 3, PM2.5 at all sites was dominated by particles rich in carbonaceous components (including EC, ECOC, OC, HOC, and Lev), with contributions in the range of 64.3–75.0%, while the fractions of particles rich in inorganic components were quite small. However, the detailed chemical composition was quite different among the sites. The fractions of EC were relatively higher at XASZ, XASP, and BJ (~40%) than at the other sites (<20%), which could be related to the higher influence of vehicle exhausts. Conversely, the fractions of ECOC and OC were relatively lower at XASZ, XASP, and BJ than at the others. Especially at HC and XYXP, the combined fractions of ECOC and OC reached 48.1% and 42.4%, respectively, probably implying the influence of coal combustion. Note that the combined fractions of ECOC, OC, and HOC were extremely low (<5%) at BJ, while the other sites are in the range of 18.1–48.2%. In addition, higher fractions of Lev associated with higher fractions of K were found at BJ (20.0% and 22.2%) and XYXP (17.3% and 22.1%), suggesting the strong influence of biomass burning (BB) there.
3.2. Source Identification of PM2.5
Eight factors were identified during the campaign, including cooking, dust, BB, vehicle exhausts, coal combustion, industrial emission, secondary inorganic sources (SI), and Other (namely the unidentified sources). Figure 4 and Table 2 show the source apportionment of PM2.5, which demonstrated significantly different source attribution of PM2.5 across the sites. The dominant source at XASZ, XASP, and BJ was vehicle exhaust, ranging from 28.8% to 37.5%, and at HC, the dominant source is coal combustion (38.8%), while XYXP and WNHZ were dominated by both coal combustion (26.5% and 23.8%) and industrial emissions (21.0% and 23.3%). In contrast, coal combustion and industrial emission only contributed to 10.2–12.1% and 9.21–15.9% of PM2.5, respectively, at XASZ, XASP, and BJ, while vehicle exhausts contributed to 13.4–19.3% at XYXP, WNHZ, and HC. The dominant influence of vehicle exhausts instead of coal combustion at XASZ, XASP, and BJ is consistent with the much higher fraction of EC at these sites. Additionally, XASZ, XASP and BJ were located in urban areas, where the large influence of vehicle exhaust could be expected. In contrast, XYXP and WNHZ were sited in industrial parks, where the influence of industrial emissions and coal combustion was more obvious. Similarly, HC was close to coking enterprises and thus was subject to the large impact of coal combustion. It is worth mentioning that industrial emissions are the least important in Xi’an compared with other cities. This is because that the gross domestic product (GDP) in Xi’an is dominated by the third sector, while it is dominated by the second sector (manufacturing) in the other cities. In addition, the leading industries in Xi’an are high-tech equipment manufacturing, new energy industries, etc., which release less pollutants compared with other industries (e.g., non-metallic mineral production) [15].
Relatively higher BB contributions were found at XASP (12.5%), BJ (14.0%), and XYXP (16.6%), making it the secondary, fourth, and third largest source, respectively. In addition, SI also contributed significantly to PM2.5 concentrations at BJ (16.2%), XASZ (15.7%), WNHZ (13.3%), and XASP (12.1%), making it the secondary, secondary, fourth, and third largest source, respectively. The contribution of dust was similar among sites, from 5.92 to 9.21%. The contribution from cooking is negligible (0.838–1.79%), except at BJ, where the contribution from cooking is around 4.13%, higher than the contribution from Other (3.43%).
Table 2 also presents the source apportionment of PM2.5 in Xi’an and Weinan in wintertime from previous studies. Significant differences exist in the results of source apportionment, even in the same city. The variation could be, to a large extent, attributed to the changes in emission sources along with the development in technology and economy as well as the local efforts to reduce the particle pollution. For example, there is an obvious decreasing trend in the contribution of coal combustion in Xi’an: 31.2% in 2006, 24.1% in 2010 [23], 20.6% in 2018–2019 [15], and 10.8–12.1% in 2023. This is consistent with the substitution of coal with natural gas for residential usage as well as effective measures in reducing coal emissions (e.g., reduction in emissions from power plants) [23,45]. Similarly, the contributions of vehicle exhaust in Xi’an are the largest in this study, reaching ~35%, while the study of Xu et al. [23] reported a contribution of ~20%. This is consistent with the increasing trend in the number of total vehicles. The difference could also partly be attributed to the spatial variation. For instance, BB’s contributions are generally lower in urban areas (e.g., Xi’an) than in rural areas (e.g., Baoji and Tongchuan) [23,46]. However, the study of Cao et al. [15] reported much higher BB contribution (24.4%) in Xi’an than in other cities (21.8% in Xianyang, 20.8% in Tongchuan, and 15.0% in Baoji). Overall, the results reveal that coal combustion, vehicle exhausts, and SIs are important sources in Xi’an. In addition, high contributions of SIs were reported in all previous studies. The values are larger than the results in this study. The discrepancy could be explained by the fact that SIs in previous studies include the contribution of secondary organic aerosols (SOAs) in addition to secondary inorganic aerosols (SIAs). Huang et al. [47] found that the contributions of SOAs and SIAs are of similar importance during haze events.

Table 2.
Source contributions (%) of PM2.5 in this study in comparison with previous studies.
| Cites | Sources | Time Periods | References | |||||||
|---|---|---|---|---|---|---|---|---|---|---|
| Coal | Vehicle | SI | BB | Industry | Dust | Cooking | Other | |||
| XASZ, Xi’an | 10.8 ± 2.40 | 37.5 ± 19.2 | 15.7 ± 7.10 | 9.70 ± 8.90 | 11.9 ± 2.00 | 9.20 ± 5.50 | 0.800 ± 0.900 | 4.30 ± 1.40 | This study | |
| XASP, Xi’an | 12.1 ± 3.70 | 36.6 ± 13.9 | 12.1 ± 5.30 | 12.5 ± 12.0 | 9.20 ± 2.40 | 7.70 ± 2.20 | 1.80 ± 1.50 | 8.00 ± 3.50 | ||
| BJ, Baoji | 10.2 ± 2.10 | 28.8 ± 13.1 | 16.2 ± 5.70 | 14.0 ± 12.1 | 15.9 ± 4.60 | 7.40 ± 3.90 | 4.10 ± 4.20 | 3.40 ± 1.40 | ||
| XYXP, Xianyang | 26.5 ± 6.50 | 13.4 ± 3.20 | 8.10 ± 3.70 | 16.6 ± 8.40 | 21.0 ± 2.60 | 7.00 ± 2.20 | 1.60 ± 1.00 | 5.90 ± 3.90 | ||
| WNHZ, Weinan | 23.8 ± 4.40 | 19.1 ± 4.60 | 13.3 ± 5.50 | 8.60 ± 6.60 | 23.3 ± 2.60 | 6.50 ± 2.20 | 0.900 ± 0.600 | 4.30 ± 1.40 | ||
| HC, Hancheng | 38.8 ± 9.00 | 19.3 ± 5.20 | 6.50 ± 3.90 | 5.60 ± 4.40 | 18.3 ± 4.00 | 5.90 ± 2.20 | 1.40 ± 1.70 | 4.20 ± 2.00 | ||
| Baoji | 19.9 | 6.70 | 38.5 a | 14.3 | / | 20.5 | / | / | March 2012–February 2013 | (Xiao, Wang et al., 2014) [46] |
| Baoji | 11.39 | 12.72 | 37.10 a | 14.97 | 10.12 | 13.69 | / | / | November 2018–January 2019 | (Cao and Cui 2021) [15] |
| Weinan | 38.48 | 5.02 | 19.19 a | 15.04 | 9.28 | 5.0 | 7.98 | 27 November 2017–8 December 2017 | (Zhu, Cao et al., 2019) [48] | |
| Tongchuan | 12.87 | 24.18 | 30.88 a | 20.81 | 1.76 | 9.48 | / | / | November 2018–January 2019 | (Cao and Cui 2021) [15] |
| Xianyang | 13.04 | 10.79 | 34.44 a | 21.83 | 10.54 | 9.36 | / | / | November 2018–January 2019 | (Cao and Cui 2021) [15] |
| Xi’an | 20.61 | 10.48 | 28.88 a | 24.42 | 3.14 | 12.46 | / | November 2018–January 2019 | (Cao and Cui 2021) [15] | |
| Xi’an | 31.2 | 19.3 | 20.9 a | 6.00 | 9.80 | 12.8 | / | / | 1 January 2006–28 February 2006 | (Xu, Cao et al., 2016) [23] |
| Xi’an | 27.6 | 20.9 | 23.2 a | 5.10 | 11.5 | 11.7 | / | / | 2 January 2008–29 February 2008 | (Xu, Cao et al., 2016) [23] |
| Xi’an | 24.1 | 21.3 | 17.5 a | 5.10 | 12.6 | 19.4 | / | / | 1 January 2010–28 February 2010 | (Xu, Cao et al., 2016) [23] |
a means secondary aerosols including secondary organic aerosols.
Figure 5 further explores the variation in sources with different PM2.5 pollution levels according to categories defined in the China AQI. Significant increases in the contribution of vehicle exhausts were found at XASZ, XASP, and BJ, from 18.8–25.7% during “excellent” condition to 30.7–57.2% during “serious” condition. Especially at XASZ, the vehicle contribution was more than doubled from “excellent” to “serious pollution”. Meanwhile, the contribution from BB and dust was largely reduced at XASZ, from 17.0% to 2.43% and from 14.4% to 4.80%, respectively, while little change was found for the other sources. As a result. the first three largest sources at XASZ changed from vehicle exhausts, BB, and SIs at excellent condition to vehicle exhausts, industrial emissions, and SIs during serious pollution. A slight increase in the contribution of vehicle exhausts was also found at the other 3 sites, from 12.5–15.6% during “excellent” condition to 16.6–22.3% during “serious” condition.
Significant increases in the SI contribution were found from “excellent” to “serious pollution” at all sites except for XASZ, where the SI contribution peaked during light and medium pollution (16.0–17.3%) but reached its minimum (11.0%) during serious pollution. The SI contribution more than tripled at XASP, increasing from 6.53% to 20.0%, and doubled at BJ, XYXP, WNHZ, and HC, increasing from 5.52–12.2% to 9.16–29.9%. The absolute increase in SI contribution was the largest at BJ, making it one of the first two largest sources there during serious pollution periods, comparable to the vehicle contribution (29.9% vs. 30.7%). Similarly, at XASP, SIs became the second largest source during serious pollution, only after vehicle exhausts (20.0% vs. 41.3%).
Both increases and decreases in the contribution of coal combustion were found as the PM2.5 pollution level increased. The most significant increases occurred at XASP and XYXP, from 10.8% and 20.3% to 14.3% and 36.0%, respectively. Especially at XYXP, coal combustion became the largest source during serious pollution. The decreases were found at WNHZ and HC, from 27.0% and 43.2% to 22.7% and 32.2%, respectively. In addition, the contribution of industrial emissions increased at BJ, HC, and XASP, from 11.9%, 15.5%, and 7.08% to 21.5%, 21.5%, and 10.3%, respectively, but remained unchanged at the other three sites.
On the other hand, large decreases in BB contribution were found at all sites, from 8.67–27.7% during excellent conditions to 1.86–5.59% during serious pollution. Especially at XASP, BJ, and XYXP, BB was the largest source during clean conditions but became negligible during serious pollution. The contribution of dust also decreased significantly at those sites except HC as PM2.5 concentrations increased. The largest decrease occurred at XASZ, where dust was the third largest source (14.4%) during clean conditions but became negligible (4.80%) during serious pollution.
3.3. Factors Contributing to PM2.5 Pollution
To explore the impact of meteorological conditions on PM2.5 pollution levels, Figure 6 shows the relationship between RH and PM2.5 levels at these sites. The PM2.5 pollution levels generally increased as the RH increased, which could be attributed to the fact that higher RH favors the formation of secondary aerosols. This is demonstrated in Figure 7, which shows the increase in the SI contribution as RH increased. This is also consistent with the source attribution of PM2.5, which suggested higher SI contribution at serious pollution levels compared to clean conditions as discussed earlier in Section 3.2. The impact of RH on PM2.5 pollution has also been reported in previous studies. Higher RH could accelerate the formation of nitrate and sulfate and is generally associated with high PM2.5 pollution levels [49,50]. Figure 6 also shows the relationship between wind speeds and PM2.5 levels. At XYXP, WNHZ, and HC, higher PM2.5 pollution levels were generally associated with relatively lower wind speeds. This could be explained by the stagnant condition occurring at lower wind speeds favoring the accumulation of air pollutants. In contrast, PM2.5 pollution at XASP became more severe as wind speeds increased. The condition at BJ was more complicated, with higher wind speeds associated with medium PM2.5 pollution.
To further explore possible factors affecting PM2.5 pollution, Figure 8 gives the source attribution of PM2.5 at different wind speeds. It could be found that at relatively higher wind speeds, PM2.5 from vehicle exhausts at XASP increased from 29.3 to 41.2 μg m−3, serving as a major driver of the increase in PM2.5 concentrations. As indicated by Figure 2, this condition occurred under the influence of northeast winds, probably implying the strong impact of vehicular emission from the highway lying to the north of XASP at wind speed of 1–2 m s−1. Similarly, PM2.5 from vehicle exhausts at BJ increased from 21.2 to 40.3 μg m−3 at relatively higher wind speeds (2–3 m s−1), which corresponded to the influence of southeast winds (seen from Figure 2) and implying the strong impact of vehicular emissions from the highway lying to the south of BJ at higher wind speeds.
The conditions at XYXP, WNHZ, and HC were quite different from the sites located in the urban areas (XASP and BJ). Taking XYXP as an example, PM2.5 concentrations there gradually decreased as the wind speeds increased. The change in PM2.5 concentrations was mainly driven by the influence of coal combustion (decreasing from 32.7 to 4.55 μg m−3), followed by vehicle exhaust (from 15.5 to 2.36 μg m−3) and SIs (from 9.29 to 1.18 μg m−3). As a result, the contribution of these sources dropped to about half of the original value (decreasing from 29.9%, 14.2%, and 8.51% to 15.7%, 8.12%, and 4.08%, respectively) as the wind speeds increased from 0–1 m s−1 to 4–5 m s−1. On the other hand, the contribution of BB more than doubled, increasing from 13.3% to 32.9%, although its absolute concentrations decreased from 14.5 to 9.53 μg m−3. The contribution of dust also doubled (from 5.91% to 11.0%) when the wind speeds increased to 4–5 m s−1. It is worth mentioning that the contribution of industrial emissions remained around 20%, although its absolute concentrations decreased from 22.5 to 6.73 μg m−3.
Figure 9 shows the wind maps for the contribution of BB and coal combustion at XYXP. Consistent with the discussion above, a higher BB contribution at XYXP was associated with higher wind speeds either from the northwest or from the southwest direction, while higher contributions of coal combustion occurred at lower wind speeds regardless of wind directions. Therefore, the low PM2.5 concentration at XYXP at higher wind speeds was the combination of the good meteorological condition favoring pollutant ventilation and the shift in the dominant sources of local emissions to the influence of relatively long-range transport. On the other hand, high PM2.5 concentrations at XYXP at lower wind speeds could be attributed to the stagnant condition favoring the accumulation of local emission and the formation of secondary pollutants. Overall, the impact of wind speeds on PM2.5 level varies with different sites. Previous studies have pointed out the anti-correlation between wind speeds and particulate pollution [46,50]. However, the results here indicate significant spatial variation in the impact of wind speeds. In background areas, higher wind speeds may be associated with more transport of up-wind emissions and thus result in higher PM2.5 concentrations.
4. Conclusions
Heavy PM2.5 pollution is generally found in the Guanzhong Basin during the heating period, making it the dominant pollutant degrading air quality there. In this study, based on an intensive field campaign in the winter in 2022 to 2023, we obtained chemical components of PM2.5 with high time resolution at six different sites across the five major cities in the Guanzhong Basin. The PM2.5 pollution at the XYXP site was the most severe among all sites during the campaign, with probabilities of 2.01%, 15.0%, 17.1% and 26.8% for serious, heavy, medium, and light pollution, respectively. In addition to XYXP, serious pollution also occurred at BJ with a probability of 0.192%. The air quality in terms of PM2.5 was the best at HC, with a probability of 73.0% for excellent and good conditions and 0.00% for heavy and serious pollution.
This study found that PM2.5 concentrations at urban sites including XASZ, XASP, and BJ were dominated by vehicle exhaust (~30–40%), and at suburban sites, they were contributed to mainly by coal combustion (HC, ~40%) or almost equally by coal combustion and industrial emissions (XYXP and WNHZ, ~45%). Significant variations were found in the results of PM2.5 source apportionment as the pollution level increased. The contribution of vehicle exhaust increased significantly at all sites when the PM2.5 concentrations increased from “excellent” to “serious pollution”, especially at the urban sites, where its contribution doubled. Meanwhile, the SI contribution more than doubled at all sites except for XASZ, where it peaked during light and medium pollution. The change in the contributions of coal combustion and industrial emissions varied across sites. For example, the contribution of coal combustion increased at XASP and XYXP, decreased at WNHZ and HC, and remained similar at BJ and XASZ when the PM2.5 pollution level was elevated. On the other hand, the contributions of BB and dust were generally greatly reduced during serious pollution. Consequently, the top three sources responsible for PM2.5 concentrations were quite different between “excellent” and “serious pollution” at the following sites:
- (1)
- XASZ: “vehicle exhausts, BB, and dust” versus “vehicle exhausts, industrial emissions and SI”;
- (2)
- XASP: “vehicle exhausts, BB, and coal combustion” versus “vehicle exhausts, SI, and coal combustion”;
- (3)
- BJ: “BB, vehicle exhausts, and SI” versus “vehicle exhausts, SI, and industrial emissions”;
- (4)
- XYXP: “BB, industrial emissions, and coal combustion” versus “coal combustion, industrial emissions, and vehicle exhausts”.
In contrast, the top three sources at WNHZ and HC remained unchanged (coal combustion, industrial emissions, and vehicle exhaust), although their relative contribution did change significantly.
Combined with the analysis of meteorological conditions, this study found that the contribution of Sis as well as PM2.5 pollution levels were well associated with RH, with higher RH favoring the formation secondary pollutants and thus higher PM2.5 concentrations. The relationship between wind speeds and PM2.5 level, however, varied across sites. In general, higher PM2.5 concentrations occurred at relatively lower wind speeds at suburban sites (including XYXP, WNHZ, and HC), while the condition was just opposite at XASP. The former phenomenon could be attributed to the stagnant weather conditions occurring at lower wind speeds, favoring the accumulation of local emissions as well as the formation of secondary pollutants. And the latter could be explained by the relatively strong influence of vehicular emissions from the highway, associated with relatively higher wind speeds (1–2 m s−1).
Author Contributions
Conceptualization, L.C., Y.T., H.Z. and M.L.; Methodology, L.C., Y.T., H.Z., M.W. and Y.X.; Software, M.W.; Validation, M.W.; Formal analysis, L.C., Y.T., H.Z. and M.W.; Investigation, L.C., Y.T., H.Z. and Y.X.; Resources, M.L.; Data curation, M.W.; Writing—original draft, L.C., Y.T., H.Z. and S.L.; Visualization, M.W. and S.L.; Supervision, M.L.; Project administration, M.L.; Funding acquisition, M.L. All authors have read and agreed to the published version of the manuscript.
Funding
This research was funded by the Key-Area Research and Development Program of Guangdong Province (Grant No. 2020B1111360001) and the National Natural Science Foundation of China (Grant No. 41827804).
Institutional Review Board Statement
Not applicable.
Informed Consent Statement
Not applicable.
Data Availability Statement
Data and methods used in the research have been presented in sufficient detail in the paper.
Conflicts of Interest
The authors declare no conflict of interest. Ms Mei Wang is an employee of Guangzhou Hexin Analytical Instrument Company Limited. The paper reflects the views of the scientists and not the company.
References
- Chen, R.; Zhao, Z.; Kan, H. Heavy smog and hospital visits in Beijing, China. Am. J. Respir. Crit. Care Med. 2013, 188, 1170–1171. [Google Scholar] [CrossRef] [PubMed]
- Feng, S.; Gao, D.; Liao, F.; Zhou, F.; Wang, X. The health effects of ambient PM2.5 and potential mechanisms. Ecotoxicol. Environ. Saf. 2016, 128, 67–74. [Google Scholar] [CrossRef] [PubMed]
- Pui, D.Y.; Chen, S.C.; Zuo, Z. PM2.5 in China: Measurements, sources, visibility and health effects, and mitigation. Particuology 2014, 13, 1–26. [Google Scholar] [CrossRef]
- Zhang, Q.; Zheng, Y.; Tong, D.; Shao, M.; Wang, S.; Zhang, Y.; Xu, X.; Wang, J.; He, H.; Liu, W.; et al. Drivers of improved PM2.5 air quality in China from 2013 to 2017. Proc. Natl. Acad. Sci. USA 2019, 116, 24463–24469. [Google Scholar] [CrossRef] [PubMed]
- Bell, M.L.; Dominici, F.; Ebisu, K.; Zeger, S.L.; Samet, J.M. Spatial and temporal variation in PM2.5 chemical composition in the United States for health effects studies. Environ. Health Perspect. 2007, 115, 989–995. [Google Scholar] [CrossRef] [PubMed]
- Cao, J.J.; Shen, Z.X.; Chow, J.C.; Watson, J.G.; Lee, S.C.; Tie, X.X.; Ho, K.F.; Wang, G.H.; Han, Y.M. Winter and summer PM2.5 chemical compositions in fourteen Chinese cities. J. Air Waste Manag. Assoc. 2012, 62, 1214–1226. [Google Scholar] [CrossRef]
- Ye, B.; Ji, X.; Yang, H.; Yao, X.; Chan, C.K.; Cadle, S.H.; Chan, T.; Mulawa, P.A. Concentration and chemical composition of PM2.5 in Shanghai for a 1-year period. Atmos. Environ. 2003, 37, 499–510. [Google Scholar] [CrossRef]
- Rodrıguez, S.; Querol, X.; Alastuey, A.; Viana, M.M.; Alarcon, M.; Mantilla, E.; Ruiz, C.R. Comparative PM10–PM2.5 source contribution study at rural, urban and industrial sites during PM episodes in Eastern Spain. Sci. Total Environ. 2004, 328, 95–113. [Google Scholar] [CrossRef]
- Li, G.; Fang, C.; Wang, S.; Sun, S. The effect of economic growth, urbanization, and industrialization on fine particulate matter (PM2.5) concentrations in China. Environ. Sci. Technol. 2016, 50, 11452–11459. [Google Scholar] [CrossRef]
- Zhang, Y.L.; Cao, F. Fine particulate matter (PM2.5) in China at a city level. Sci. Rep. 2015, 5, 14884. [Google Scholar] [CrossRef]
- Ministry of Ecology and Environment of the People’s Republic of China. Available online: https://www.mee.gov.cn/hjzl/sthjzk/zghjzkgb/index (accessed on 31 December 2020).
- Wang, M.; Zhang, Z.; Yuan, Q.; Li, X.; Han, S.; Lam, Y.; Cui, L.; Huang, Y.; Cao, J.; Lee, S.C. Slower than expected reduction in annual PM2.5 in Xi’an revealed by machine learning-based meteorological normalization. Sci. Total Environ. 2022, 841, 156740. [Google Scholar] [CrossRef] [PubMed]
- Wang, S.; Ren, Y.; Xia, B. PM2.5 and O3 concentration estimation based on interpretable machine learning. Atmos. Pollut. Res. 2023, 14, 101866. [Google Scholar] [CrossRef]
- Zhang, X.; Xu, H.; Liang, D. Spatiotemporal variations and connections of single and multiple meteorological factors on PM2.5 concentrations in Xi’an, China. Atmos. Environ. 2022, 275, 119015. [Google Scholar] [CrossRef]
- Cao, J.J.; Cui, L. Current status, characteristics and causes of particulate air pollution in the Fenwei plain, China: A review. J. Geophys. Res. Atmos. 2021, 126, e2020JD034472. [Google Scholar] [CrossRef]
- Chen, Y.; Cao, J.; Huang, R.; Yang, F.; Wang, Q.; Wang, Y. Characterization, mixing state, and evolution of urban single particles in Xi’an (China) during wintertime haze days. Sci. Total Environ. 2016, 573, 937–945. [Google Scholar] [CrossRef]
- Li, N.; Long, X.; Tie, X.; Cao, J.; Huang, R.; Zhang, R.; Feng, T.; Liu, S.; Li, G. Urban dust in the Guanzhong basin of China, part II: A case study of urban dust pollution using the WRF-Dust model. Sci. Total Environ. 2016, 541, 1614–1624. [Google Scholar] [CrossRef]
- Shen, Z.; Cao, J.; Liu, S.; Zhu, C.; Wang, X.; Zhang, T.; Xu, H.; Hu, T. Chemical composition of PM10 and PM2.5 collected at ground level and 100 meters during a strong winter-time pollution episode in Xi’an, China. J. Air Waste Manag. Assoc. 2011, 61, 1150–1159. [Google Scholar] [CrossRef]
- Wang, D.; Hu, J.; Xu, Y.; Lv, D.; Xie, X.; Kleeman, M.; Xing, J.; Zhang, H.; Ying, Q. Source contributions to primary and secondary inorganic particulate matter during a severe wintertime PM2.5 pollution episode in Xi’an, China. Atmos. Environ. 2014, 97, 182–194. [Google Scholar] [CrossRef]
- Li, Q.; Li, X.; Jiang, J.; Duan, L.; Ge, S.; Zhang, Q.; Deng, J.; Wang, S.; Hao, J. Semi-coke briquettes: Towards reducing emissions of primary PM2.5, particulate carbon and carbon monoxide from household coal combustion in China. Sci. Rep. 2016, 6, 19306. [Google Scholar] [CrossRef]
- Lu, P.; Deng, S.; Li, G.; Tuheti, A.; Liu, J. Regional Transport of PM2.5 from Coal-Fired Power Plants in the Fenwei Plain, China. Int. J. Environ. Res. Public Health 2023, 20, 2170. [Google Scholar] [CrossRef]
- Wang, Z.; Wang, R.; Wang, J.; Wang, Y.; Donahue, N.M.; Tang, R.; Dong, Z.; Li, X.; Wang, L.; Han, Y.; et al. The seasonal variation, characteristics and secondary generation of PM2.5 in Xi’an, China, especially during pollution events. Environ. Res. 2022, 212, 113388. [Google Scholar] [CrossRef] [PubMed]
- Xu, H.; Cao, J.; Chow, J.C.; Huang, R.J.; Shen, Z.; Chen, L.A.; Ho, K.; Watson, J.G. Inter-annual variability of wintertime PM2.5 chemical composition in Xi’an, China: Evidences of changing source emissions. Sci. Total Environ. 2016, 545, 546–555. [Google Scholar] [CrossRef] [PubMed]
- Zhang, T.; Shen, Z.X.; Su, H.; Liu, S.X.; Zhou, J.M.; Zhao, Z.Z.; Wang, Q.Y.; Prevot, A.S.H.; Cao, J.J. Effects of Aerosol Water Content on the formation of secondary inorganic aerosol during a Winter Heavy PM2.5 Pollution Episode in Xi’an, China. Atmos. Environ. 2021, 252, 118304. [Google Scholar] [CrossRef]
- Zhong, J.; Zhang, X.; Wang, Y.; Wang, J.; Shen, X.; Zhang, H.; Wang, T.; Xie, Z.; Liu, C.; Zhang, H.; et al. The two-way feedback mechanism between unfavorable meteorological conditions and cumulative aerosol pollution in various haze regions of China. Atmos. Chem. Phys. 2019, 19, 3287–3306. [Google Scholar] [CrossRef]
- Sun, J.; Shen, Z.; Cao, J.; Zhang, L.; Wu, T.; Zhang, Q.; Yin, X.; Lei, Y.; Huang, Y.; Huang, R.; et al. Particulate matters emitted from maize straw burning for winter heating in rural areas in Guanzhong Plain, China: Current emission and future reduction. Atmos. Res. 2017, 184, 66–76. [Google Scholar] [CrossRef]
- Wang, Y.; Wang, M.; Li, S.; Sun, H.; Mu, Z.; Zhang, L.; Li, Y.; Chen, Q. Study on the oxidation potential of the water-soluble components of ambient PM2.5 over Xi’an, China: Pollution levels, source apportionment and transport pathways. Environ. Int. 2020, 136, 105515. [Google Scholar] [CrossRef] [PubMed]
- Niu, X.; Cao, J.; Shen, Z.; Ho, S.S.H.; Tie, X.; Zhao, S.; Xu, H.; Zhang, B.; Huang, R. PM2.5 from the Guanzhong Plain: Chemical composition and implications for emission reductions. Atmos. Environ. 2016, 147, 458–469. [Google Scholar] [CrossRef]
- Shi, J.; Liu, S.; Qu, Y.; Zhang, T.; Dai, W.; Zhang, P.; Li, R.; Zhu, C.; Cao, J. Variations of the urban PM2.5 chemical components and corresponding light extinction for three heating seasons in the Guanzhong Plain, China. J. Environ. Manag. 2023, 327, 116821. [Google Scholar] [CrossRef]
- Chen, D.; He, J.; Zhang, G. The Influence of Different Air Masses on the Single Particle Aerosol Physical and Chemical Characteristics in Heshan Atmospheric Supersite of Guangdong. Ecol. Environ. Sci. 2015, 24, 63–69. [Google Scholar] [CrossRef]
- Song, X.H.; Hopke, P.K.; Fergenson, D.P.; Prather, K.A. Classification of single particles analyzed by ATOFMS using an artificial neural network, ART-2A. Anal. Chem. 1999, 71, 860–865. [Google Scholar] [CrossRef]
- Chen, D.; Li, M.; Huang, B.; Jiang, B.; Zhang, T.; Jiang, M.; Xie, M.; Zhong, L.; Bi, X.; Lv, X.; et al. The pollution characteristics and source apportionment of regional atmospheric fine particles. China Environ. Sci. 2016, 36, 651–659. [Google Scholar]
- Liu, J.; Gao, J.; Zhang, Y.C. Results comparison of different source apportionment methods during APEC summit in Beijing. China Environ. Sci. 2020, 40, 938–947. [Google Scholar] [CrossRef]
- Zhuang, W.; Wang, J.; Lei, Z. Source Apportionment of Fine Particles during Dust Storm Period in Beijing in 2017. Adv. Environ. Prot. 2018, 8, 192–198. [Google Scholar] [CrossRef]
- Mou, G.; Liu, H.; Li, W.; Wang, F.; Wang, Y. Study on the Pollution Characteristics of Mineral Dust Particle in PM2.5 in the North Area of Xi’an in Autumn. Environ. Monit. Forewarning 2017, 9, 48–53. [Google Scholar]
- Yan, L.; Liu, H.; Huang, X.; Gao, J.; Zhang, W. Characteristics and Source Apportionment of Fine Particles in Xi’an Using a Single Particle Aerosol Mass Spectrometer (SPAMS) during Heavy Pollution. Res. Environ. Sci. 2018, 31, 1841–1848. [Google Scholar] [CrossRef]
- Sodeman, D.A.; Toner, S.M.; Prather, K.A. Determination of single particle mass spectral signatures from light-duty vehicle emissions. Environ. Sci. Technol. 2005, 39, 4569–4580. [Google Scholar] [CrossRef]
- Bi, X.; Zhang, G.; Li, L.; Wang, X.; Li, M.; Sheng, G.; Fu, J.; Zhou, Z. Mixing state of biomass burning particles by single particle aerosol mass spectrometer in the urban area of PRD, China. Atmos. Environ. 2011, 45, 3447–3453. [Google Scholar] [CrossRef]
- Chen, Y.; Wenger, J.C.; Yang, F.; Cao, J.; Huang, R.; Shi, G.; Zhang, S.; Tian, M.; Wang, H. Source characterization of urban particles from meat smoking activities in Chongqing, China using single particle aerosol mass spectrometry. Environ. Pollut. 2017, 228, 92–101. [Google Scholar] [CrossRef]
- Li, L.; Li, M.; Huang, Z.; Gao, W.; Nian, H.; Fu, Z.; Gao, J.; Chai, F.; Zhou, Z. Ambient particle characterization by single particle aerosol mass spectrometry in an urban area of Beijing. Atmos. Environ. 2014, 94, 323–331. [Google Scholar] [CrossRef]
- Ma, L.; Li, M.; Zhang, H.; Li, L.; Huang, Z.; Gao, W.; Chen, D.; Fu, Z.; Nian, H.; Zou, L.; et al. Comparative analysis of chemical composition and sources of aerosol particles in urban Beijing during clear, hazy, and dusty days using single particle aerosol mass spectrometry. J. Clean. Prod. 2016, 112, 1319–1329. [Google Scholar] [CrossRef]
- Xu, J.; Li, M.; Shi, G.; Wang, H.; Ma, X.; Wu, J.; Shi, X.; Feng, Y. Mass spectra features of biomass burning boiler and coal burning boiler emitted particles by single particle aerosol mass spectrometer. Sci. Total Environ. 2017, 598, 341–352. [Google Scholar] [CrossRef] [PubMed]
- Xu, J.; Wang, H.; Li, X.; Li, Y.; Wen, J.; Zhang, J.; Shi, X.; Li, M.; Wang, W.; Shi, G.; et al. Refined source apportionment of coal combustion sources by using single particle mass spectrometry. Sci. Total Environ. 2018, 627, 633–646. [Google Scholar] [CrossRef] [PubMed]
- Yang, J.; Ma, S.; Gao, B.; Li, X.; Zhang, Y.; Cai, J.; Li, M.; Yao, L.; Hunag, B.; Zheng, M. Single particle mass spectral signatures from vehicle exhaust particles and the source apportionment of on-line PM2.5 by single particle aerosol mass spectrometry. Sci. Total Environ. 2017, 593, 310–318. [Google Scholar] [CrossRef] [PubMed]
- Zheng, B.; Tong, D.; Li, M.; Liu, F.; Hong, C.; Geng, G.; Li, H.; Li, X.; Peng, L.; Qi, J.; et al. Trends in China’s anthropogenic emissions since 2010 as the consequence of clean air actions. Atmos. Chem. Phys. 2018, 18, 14095–14111. [Google Scholar] [CrossRef]
- Xiao, S.; Wang, Q.; Cao, J.; Huang, R.-J.; Chen, W.; Han, Y.; Xu, H.; Liu, S.; Zhou, Y.; Wang, P.; et al. Long-term trends in visibility and impacts of aerosol composition on visibility impairment in Baoji, China. Atmos. Res. 2014, 149, 88–95. [Google Scholar] [CrossRef]
- Huang, R.-J.; Zhang, Y.; Bozzetti, C.; Ho, K.-F.; Cao, J.-J.; Han, Y.; Daellenbach, K.R.; Slowik, J.G.; Platt, S.M.; Canonaco, F.; et al. High secondary aerosol contribution to particulate pollution during haze events in China. Nature 2014, 514, 218–222. [Google Scholar] [CrossRef]
- Zhu, Y.; Cao, N.; Wei, Z.; Zhang, Y.J. Pollution Characteristics and Sources of Fine Particles During a Heavy Haze Episode in Winter: A Case Study of Weinan City. IOP Conf. Ser.: Earth Environ. Sci. 2019, 281, 012012. Available online: https://iopscience.iop.org/article/10.1088/1755-1315/281/1/012012/pdf (accessed on 17 September 2023). [CrossRef]
- Wang, G.; Zhang, R.; Gomez, M.E.; Yang, L.; Zamora, M.L.; Hu, M.; Lin, Y.; Peng, J.; Guo, S.; Meng, J.; et al. Persistent sulfate formation from London Fog to Chinese haze. Proc. Natl. Acad. Sci. USA 2016, 113, 13630–13635. [Google Scholar] [CrossRef]
- Lv, L.; Wei, P.; Hu, J.; Chen, Y.; Shi, Y. Source apportionment and regional transport of PM2.5 during haze episodes in Beijing combined with multiple models. Atmos. Res. 2022, 266, 105957. [Google Scholar] [CrossRef]
Figure 1.
Fractions of PM2.5 levels at different sites.
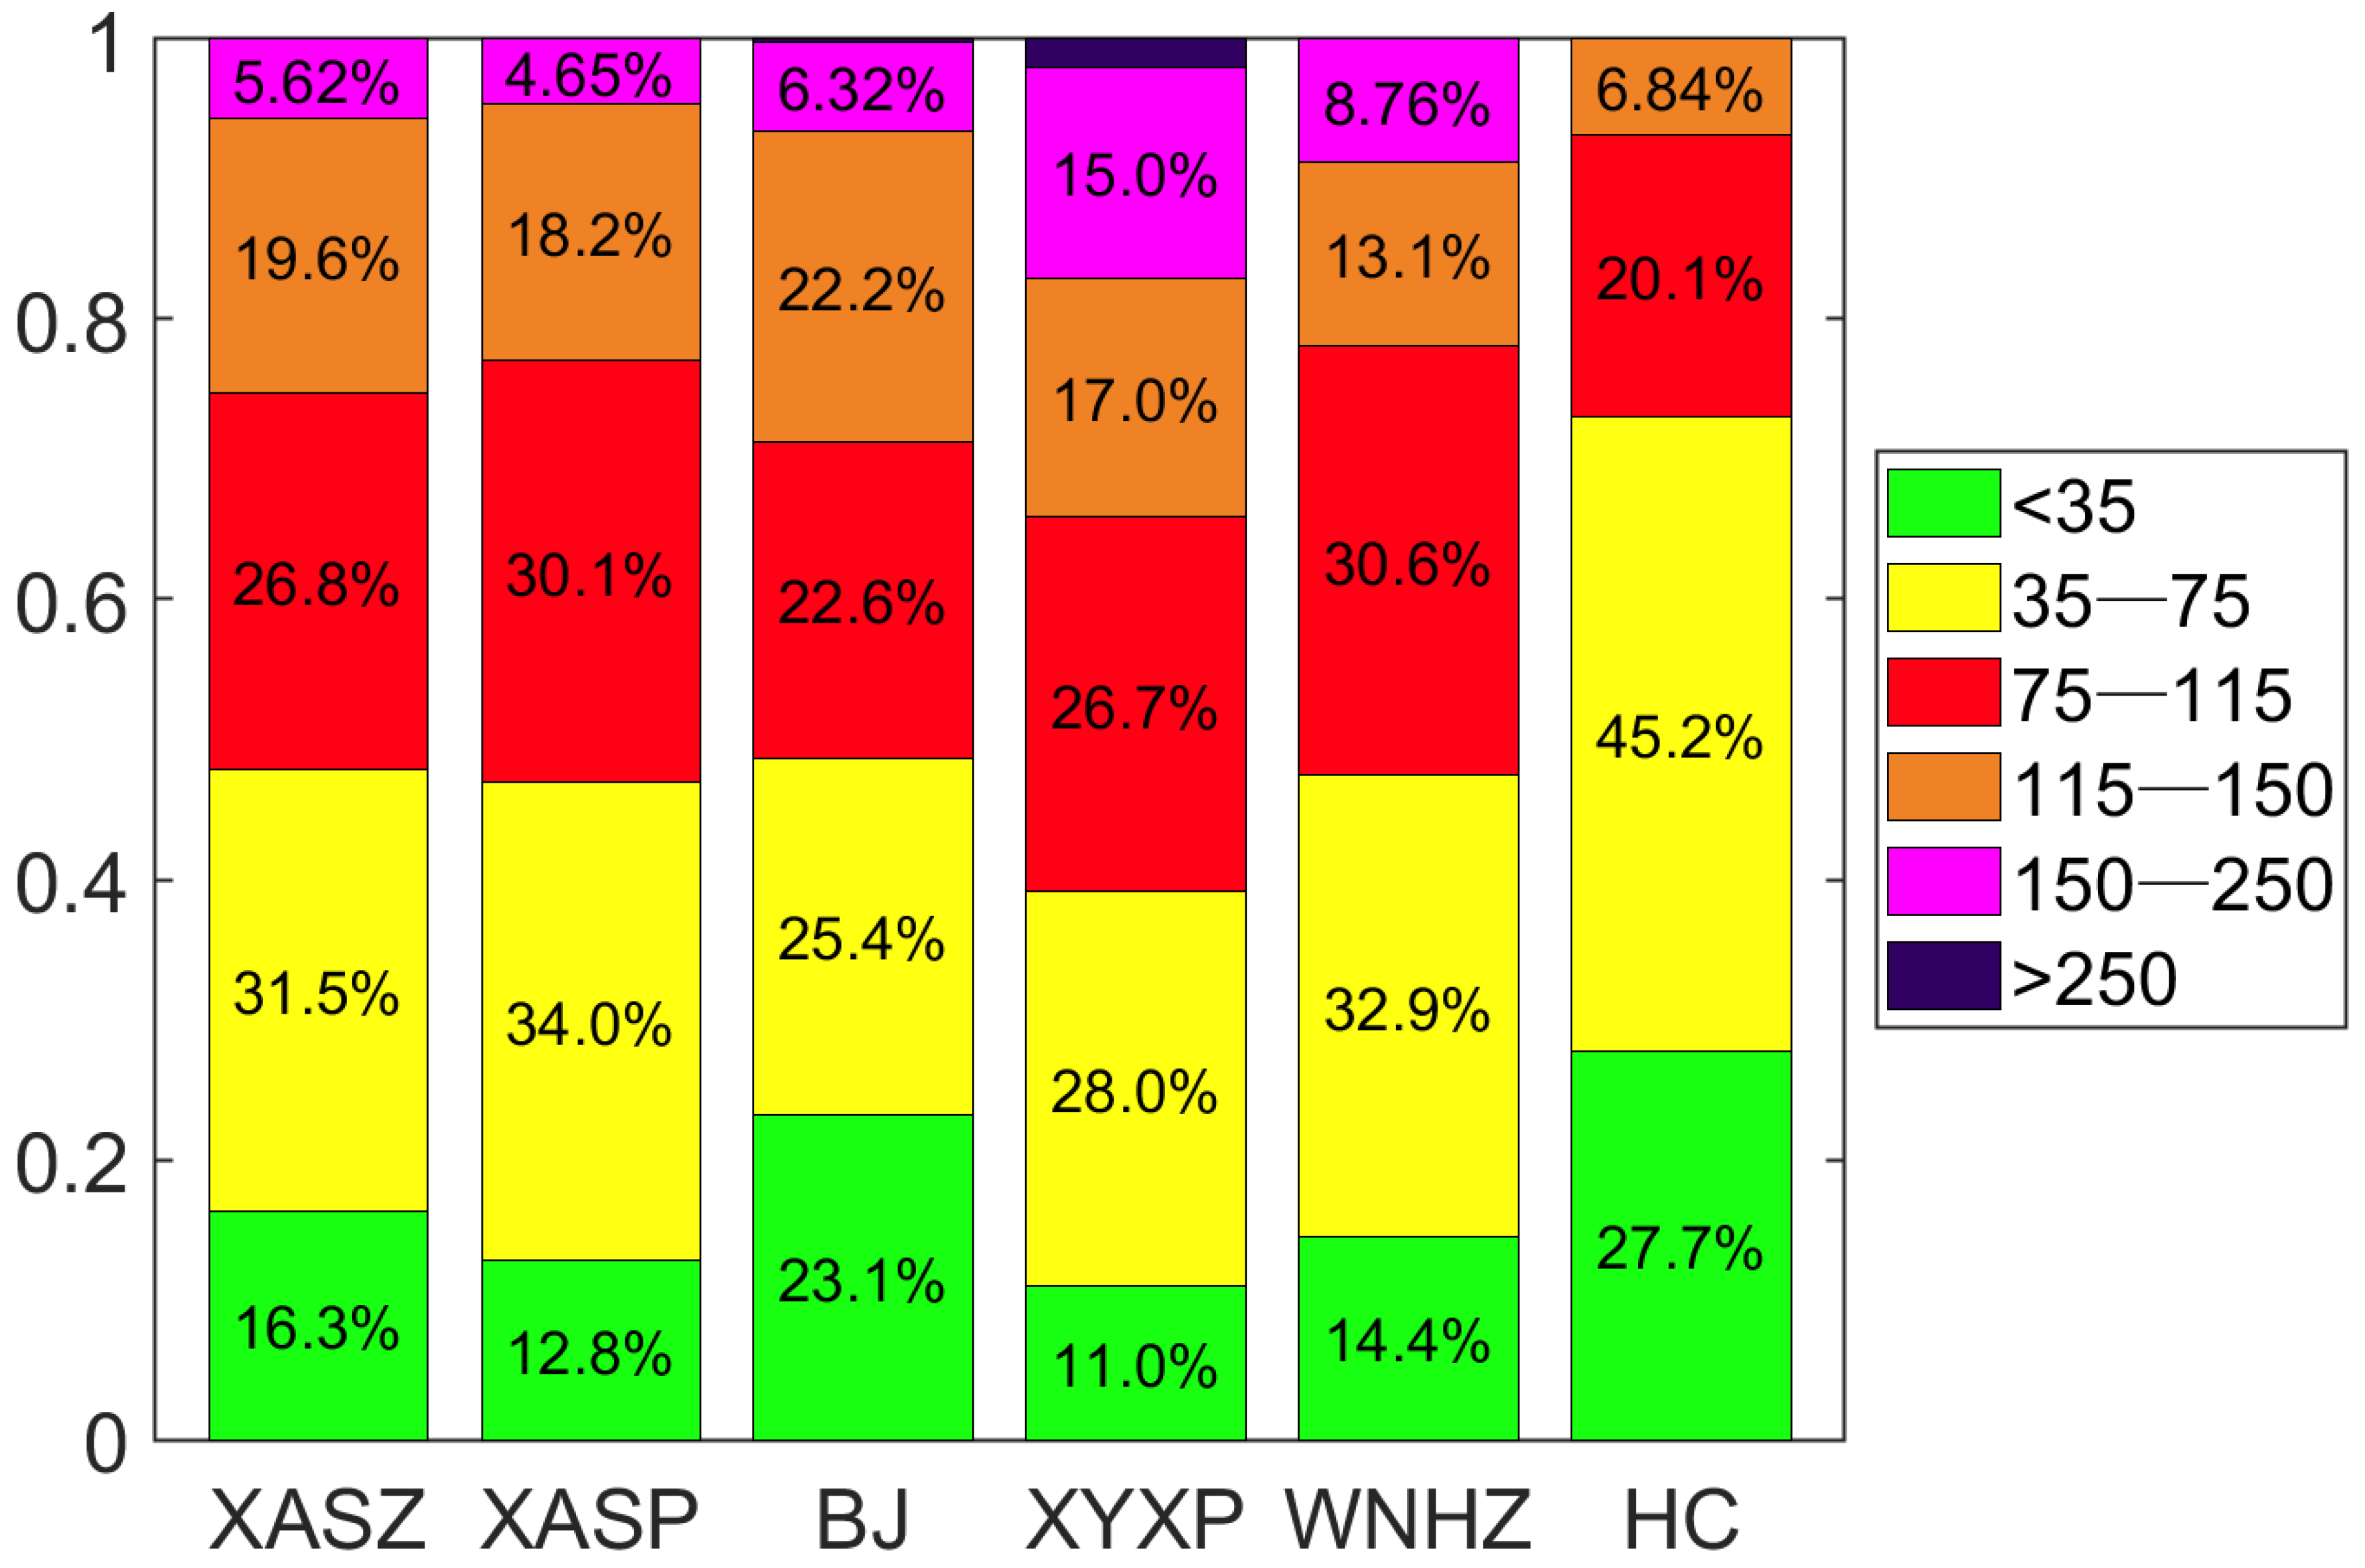
Figure 2.
Wind maps for PM2.5 concentrations at different sites. The color indicates the corresponding mean concentrations of PM2.5 at certain wind direction and wind speed; the dashed lines indicate the PM2.5 mean concentrations corresponding to a certain wind direction, and the solid lines represent wind rose.
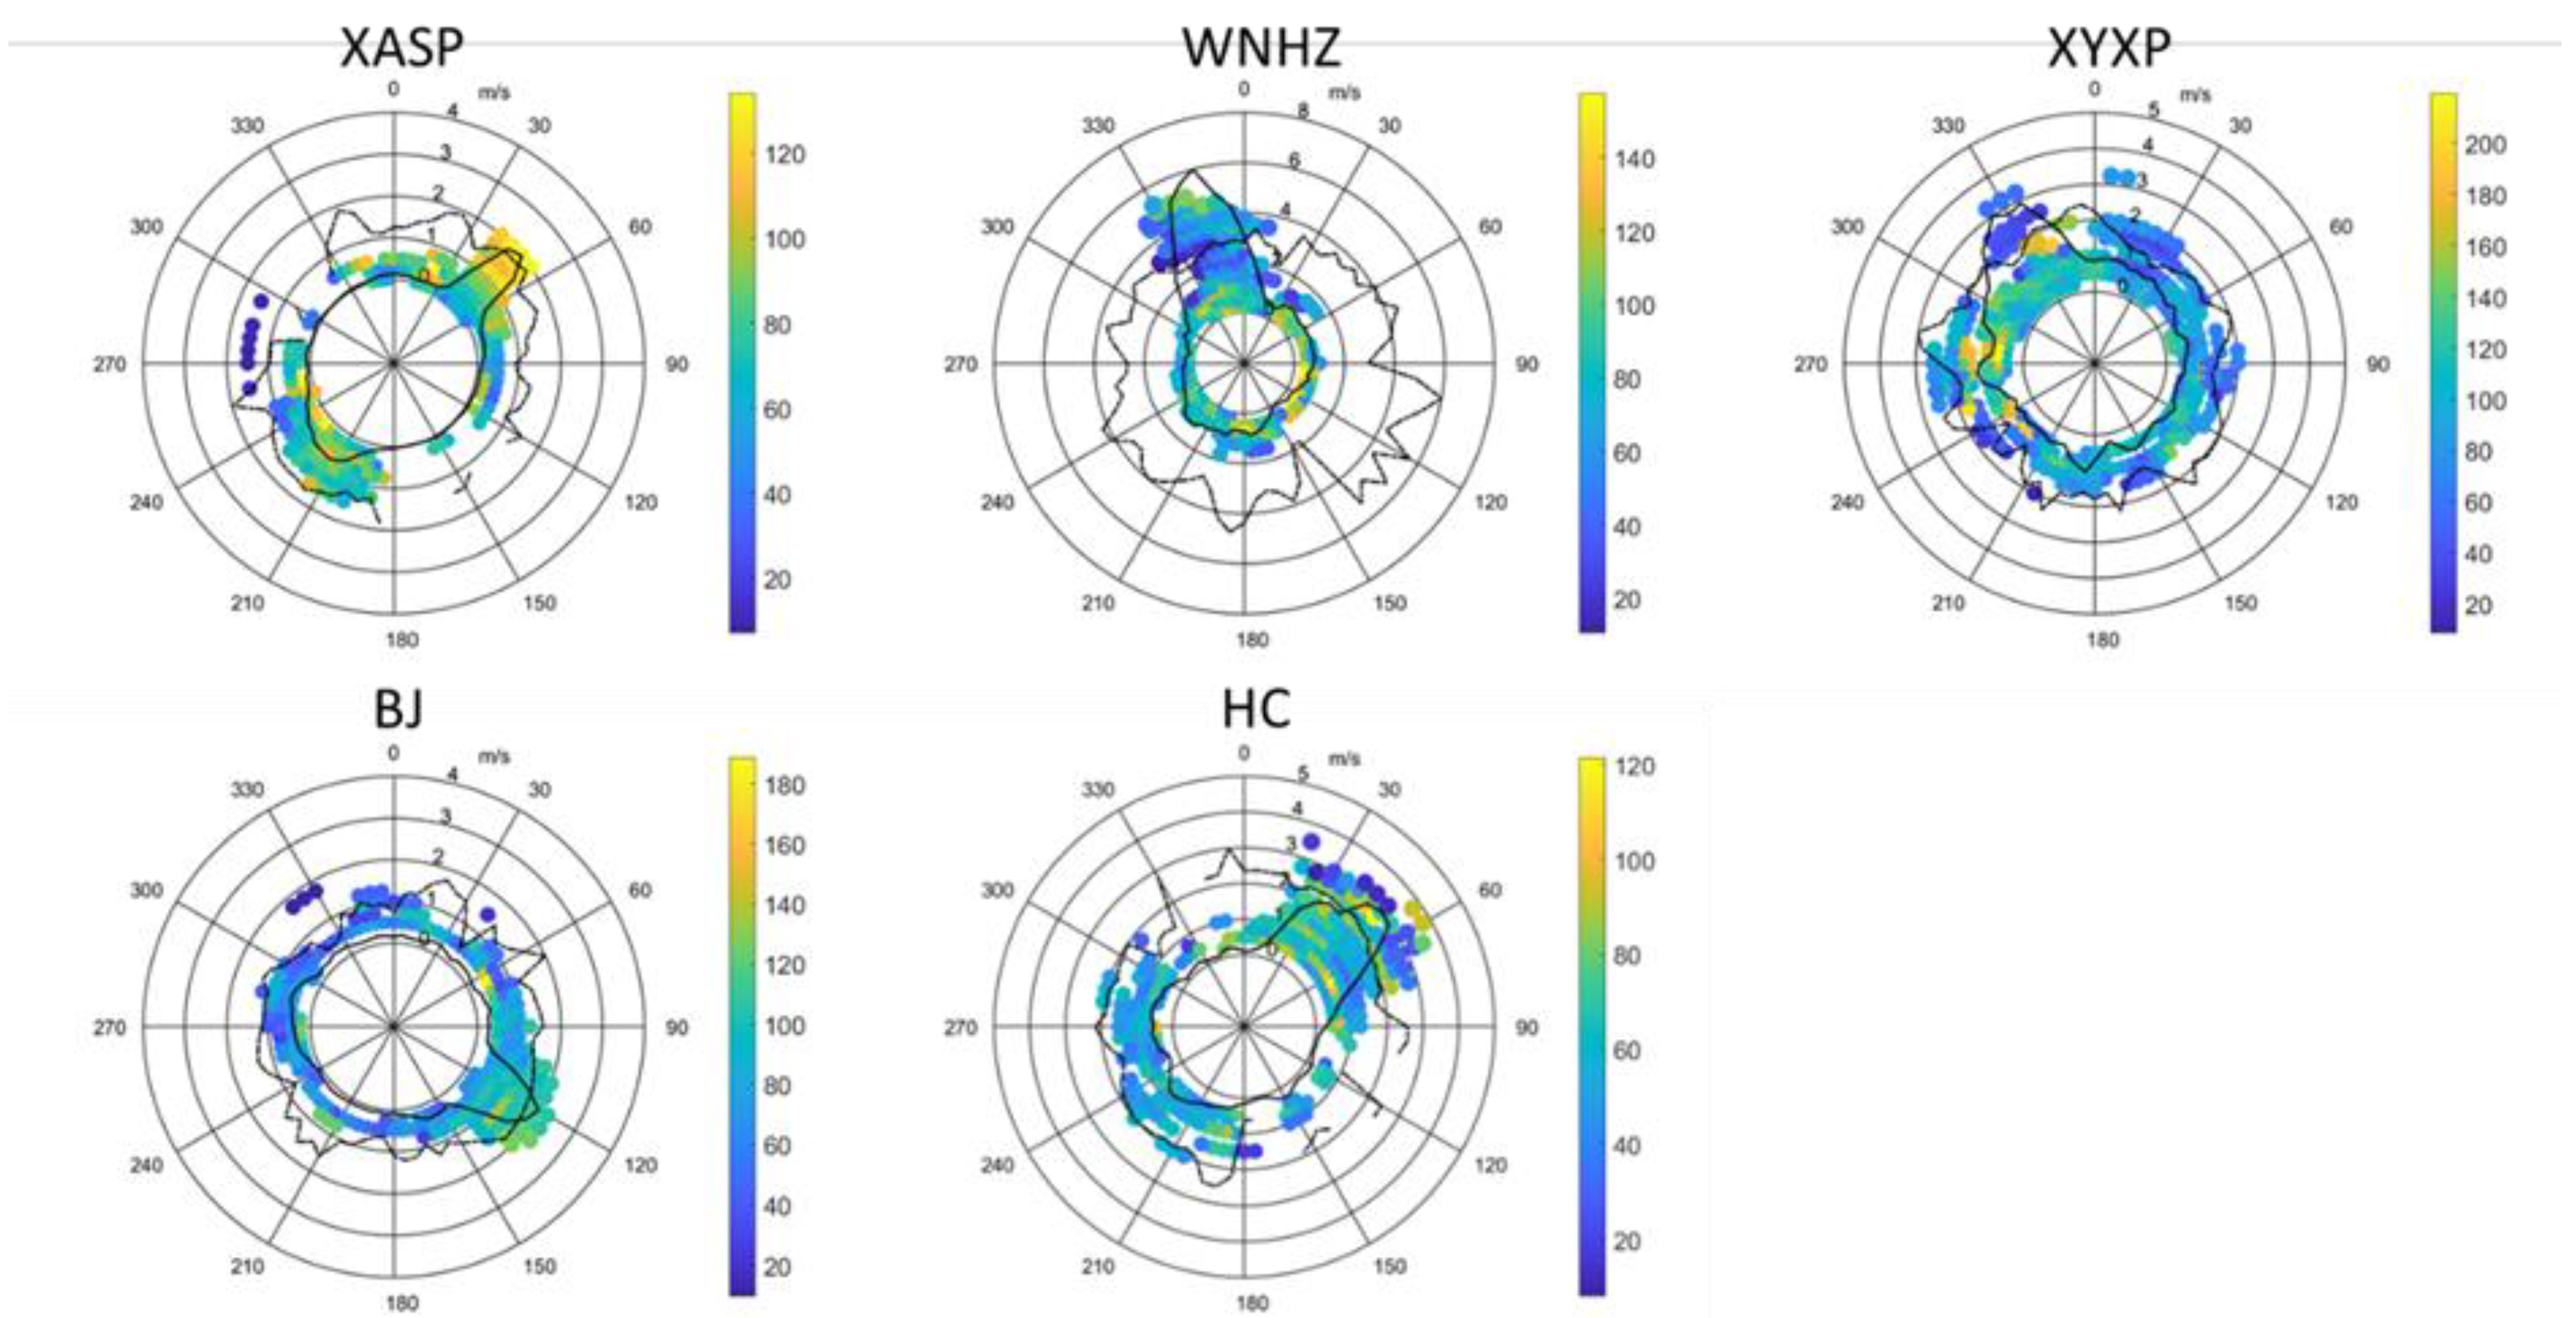
Figure 3.
Chemical composition of PM2.5 at different sites.
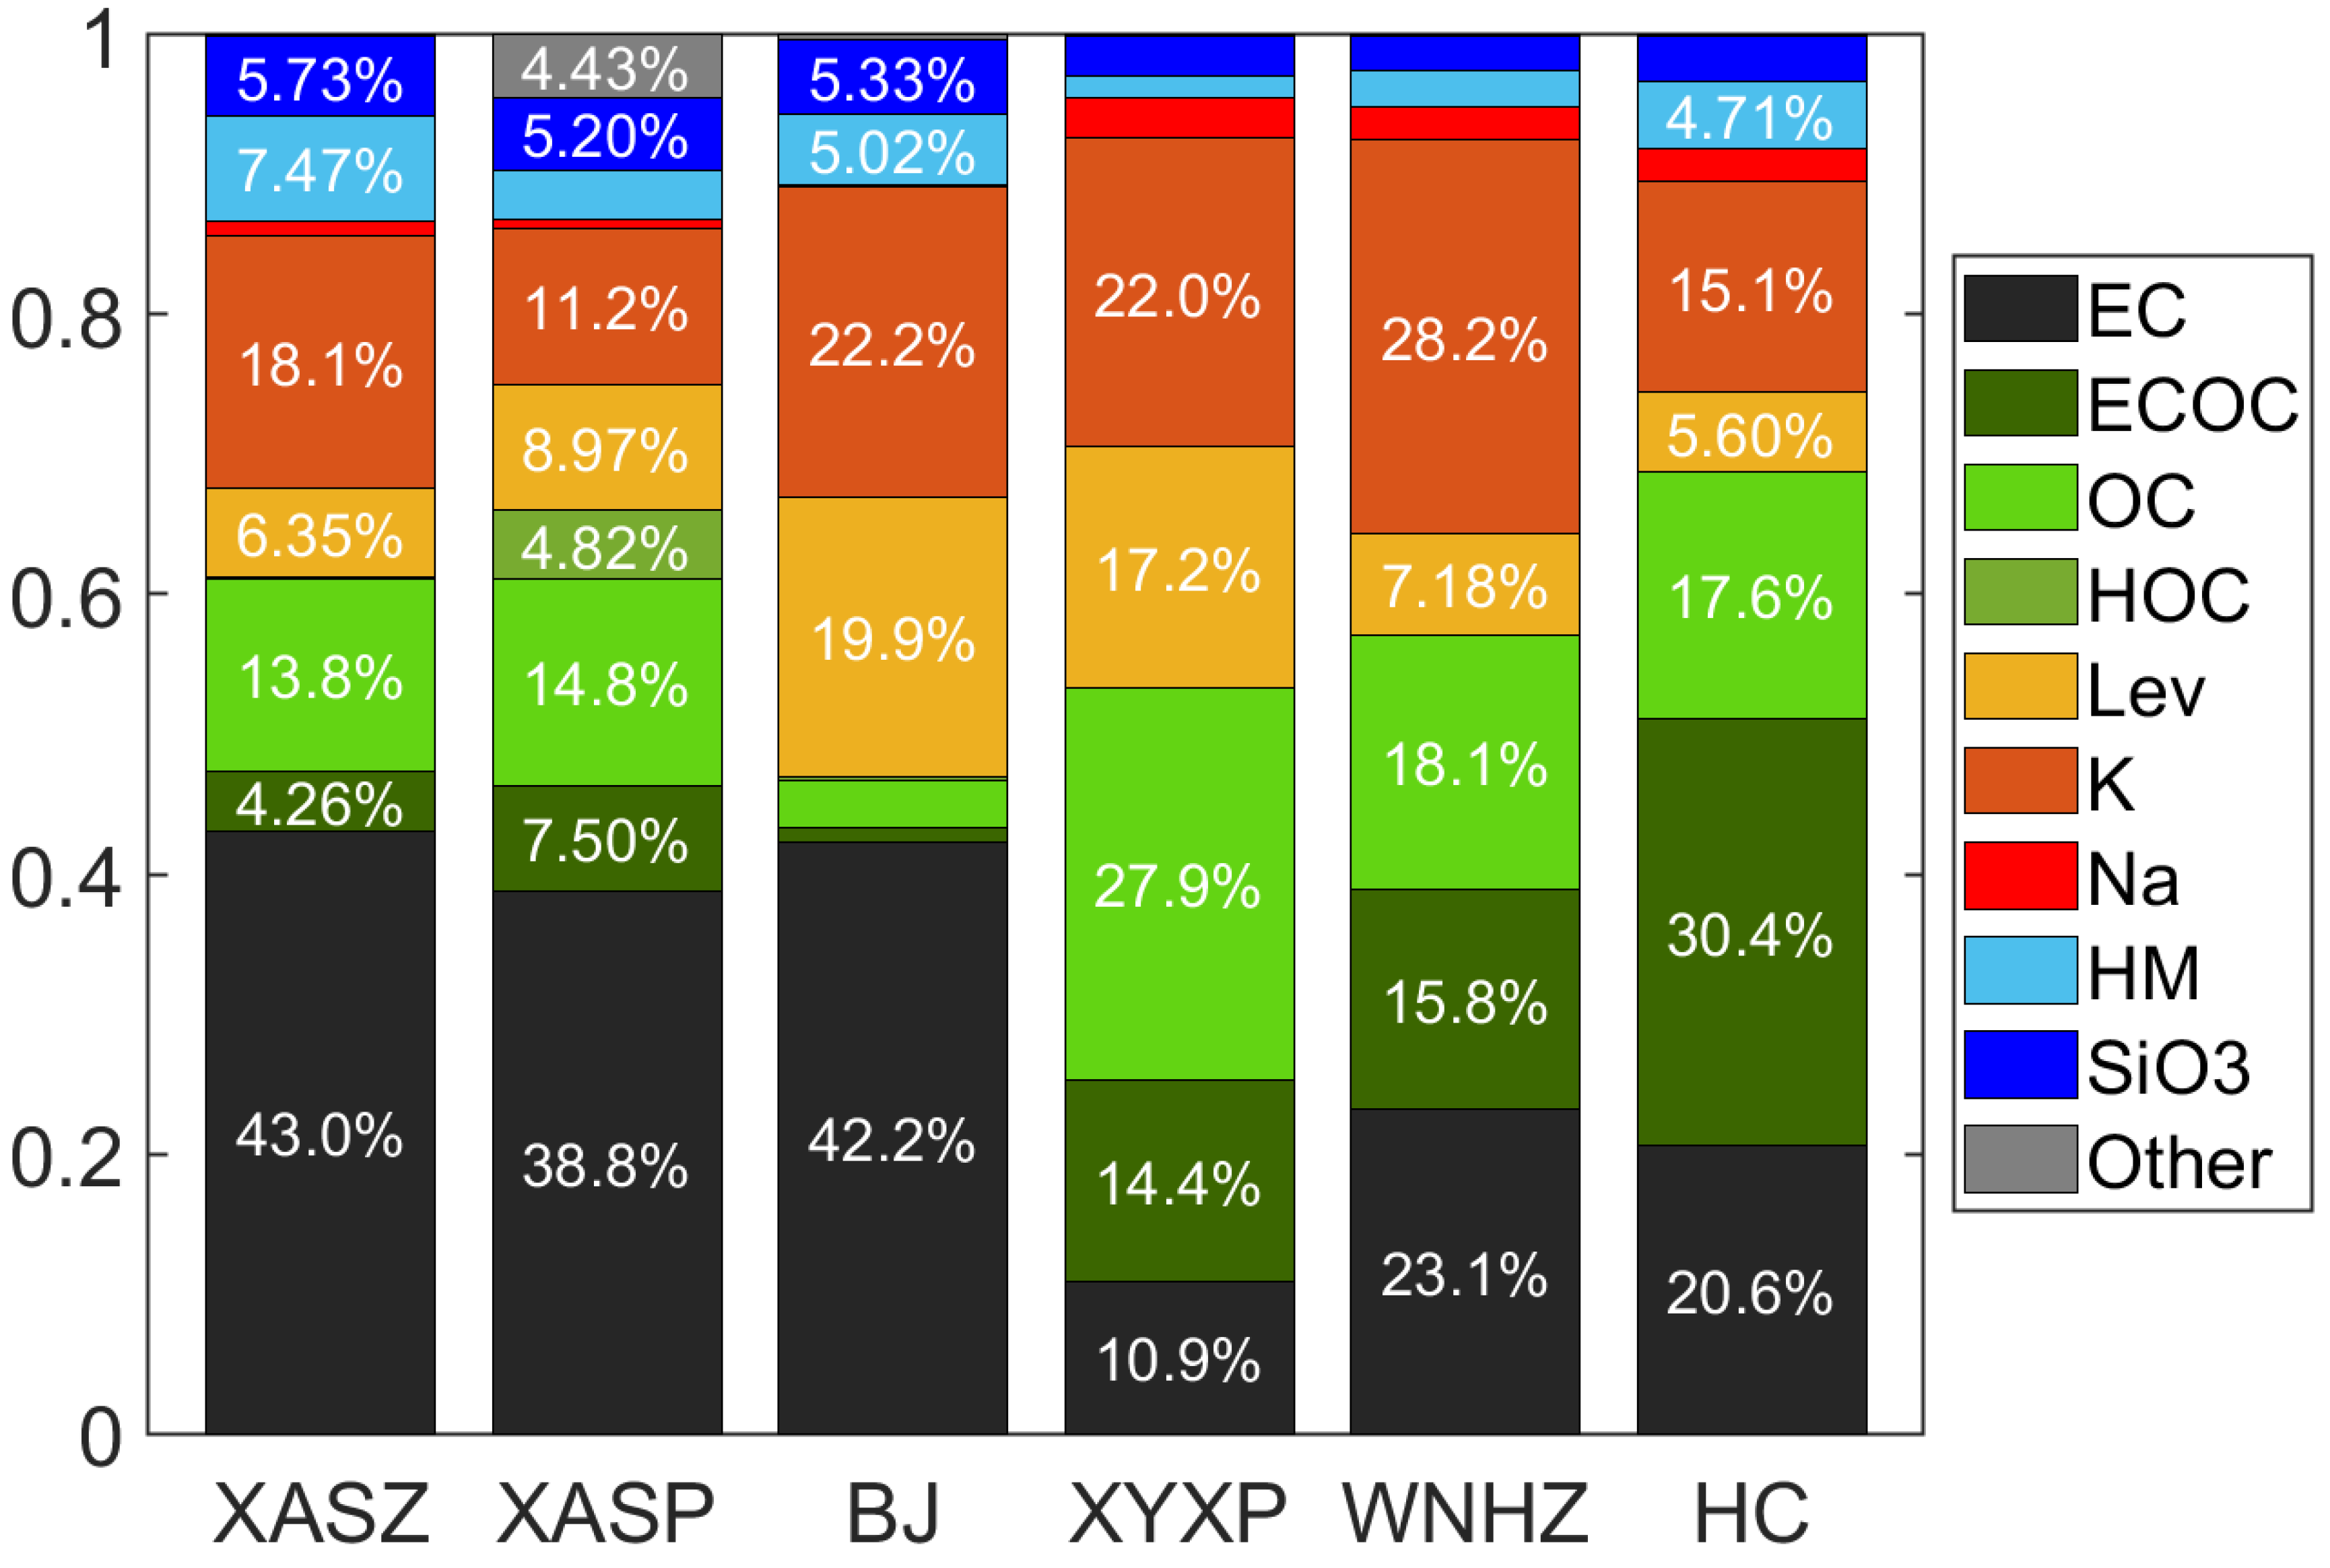
Figure 4.
Source apportionment of PM2.5 at different sites.

Figure 5.
Source apportionment of PM2.5 at different pollution levels and sites.
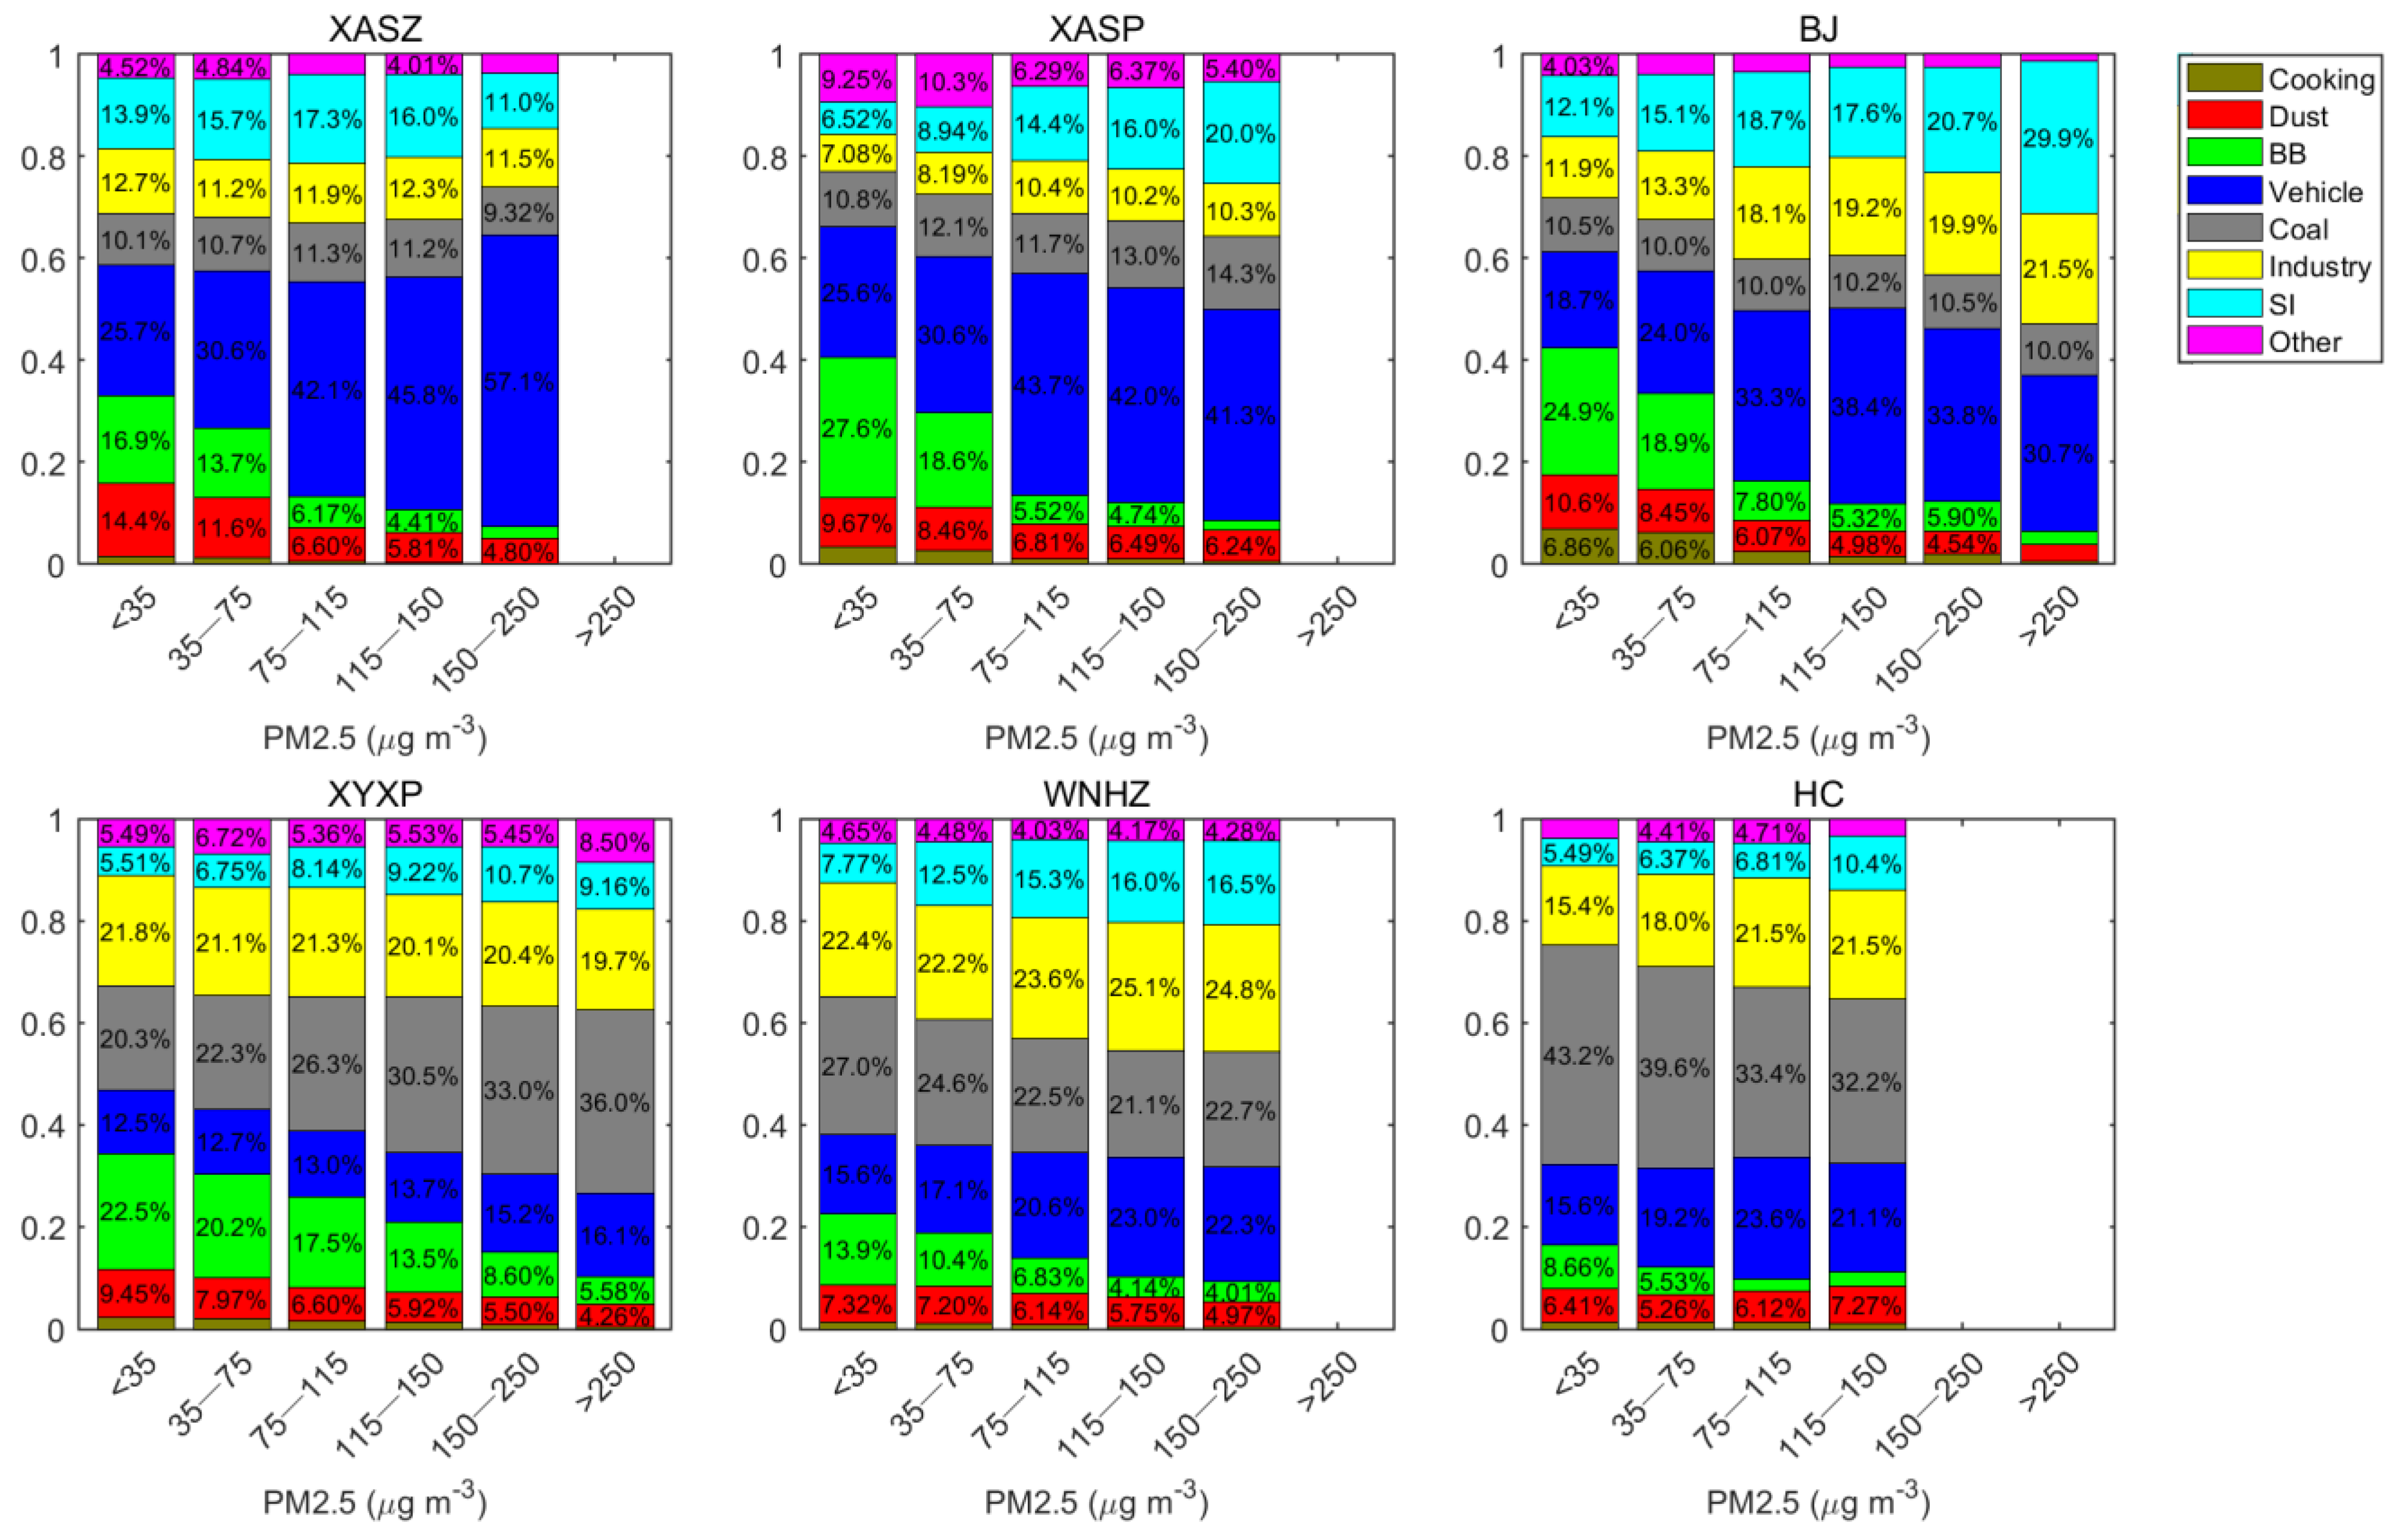
Figure 6.
Relationships between RH/wind speeds and PM2.5 level.
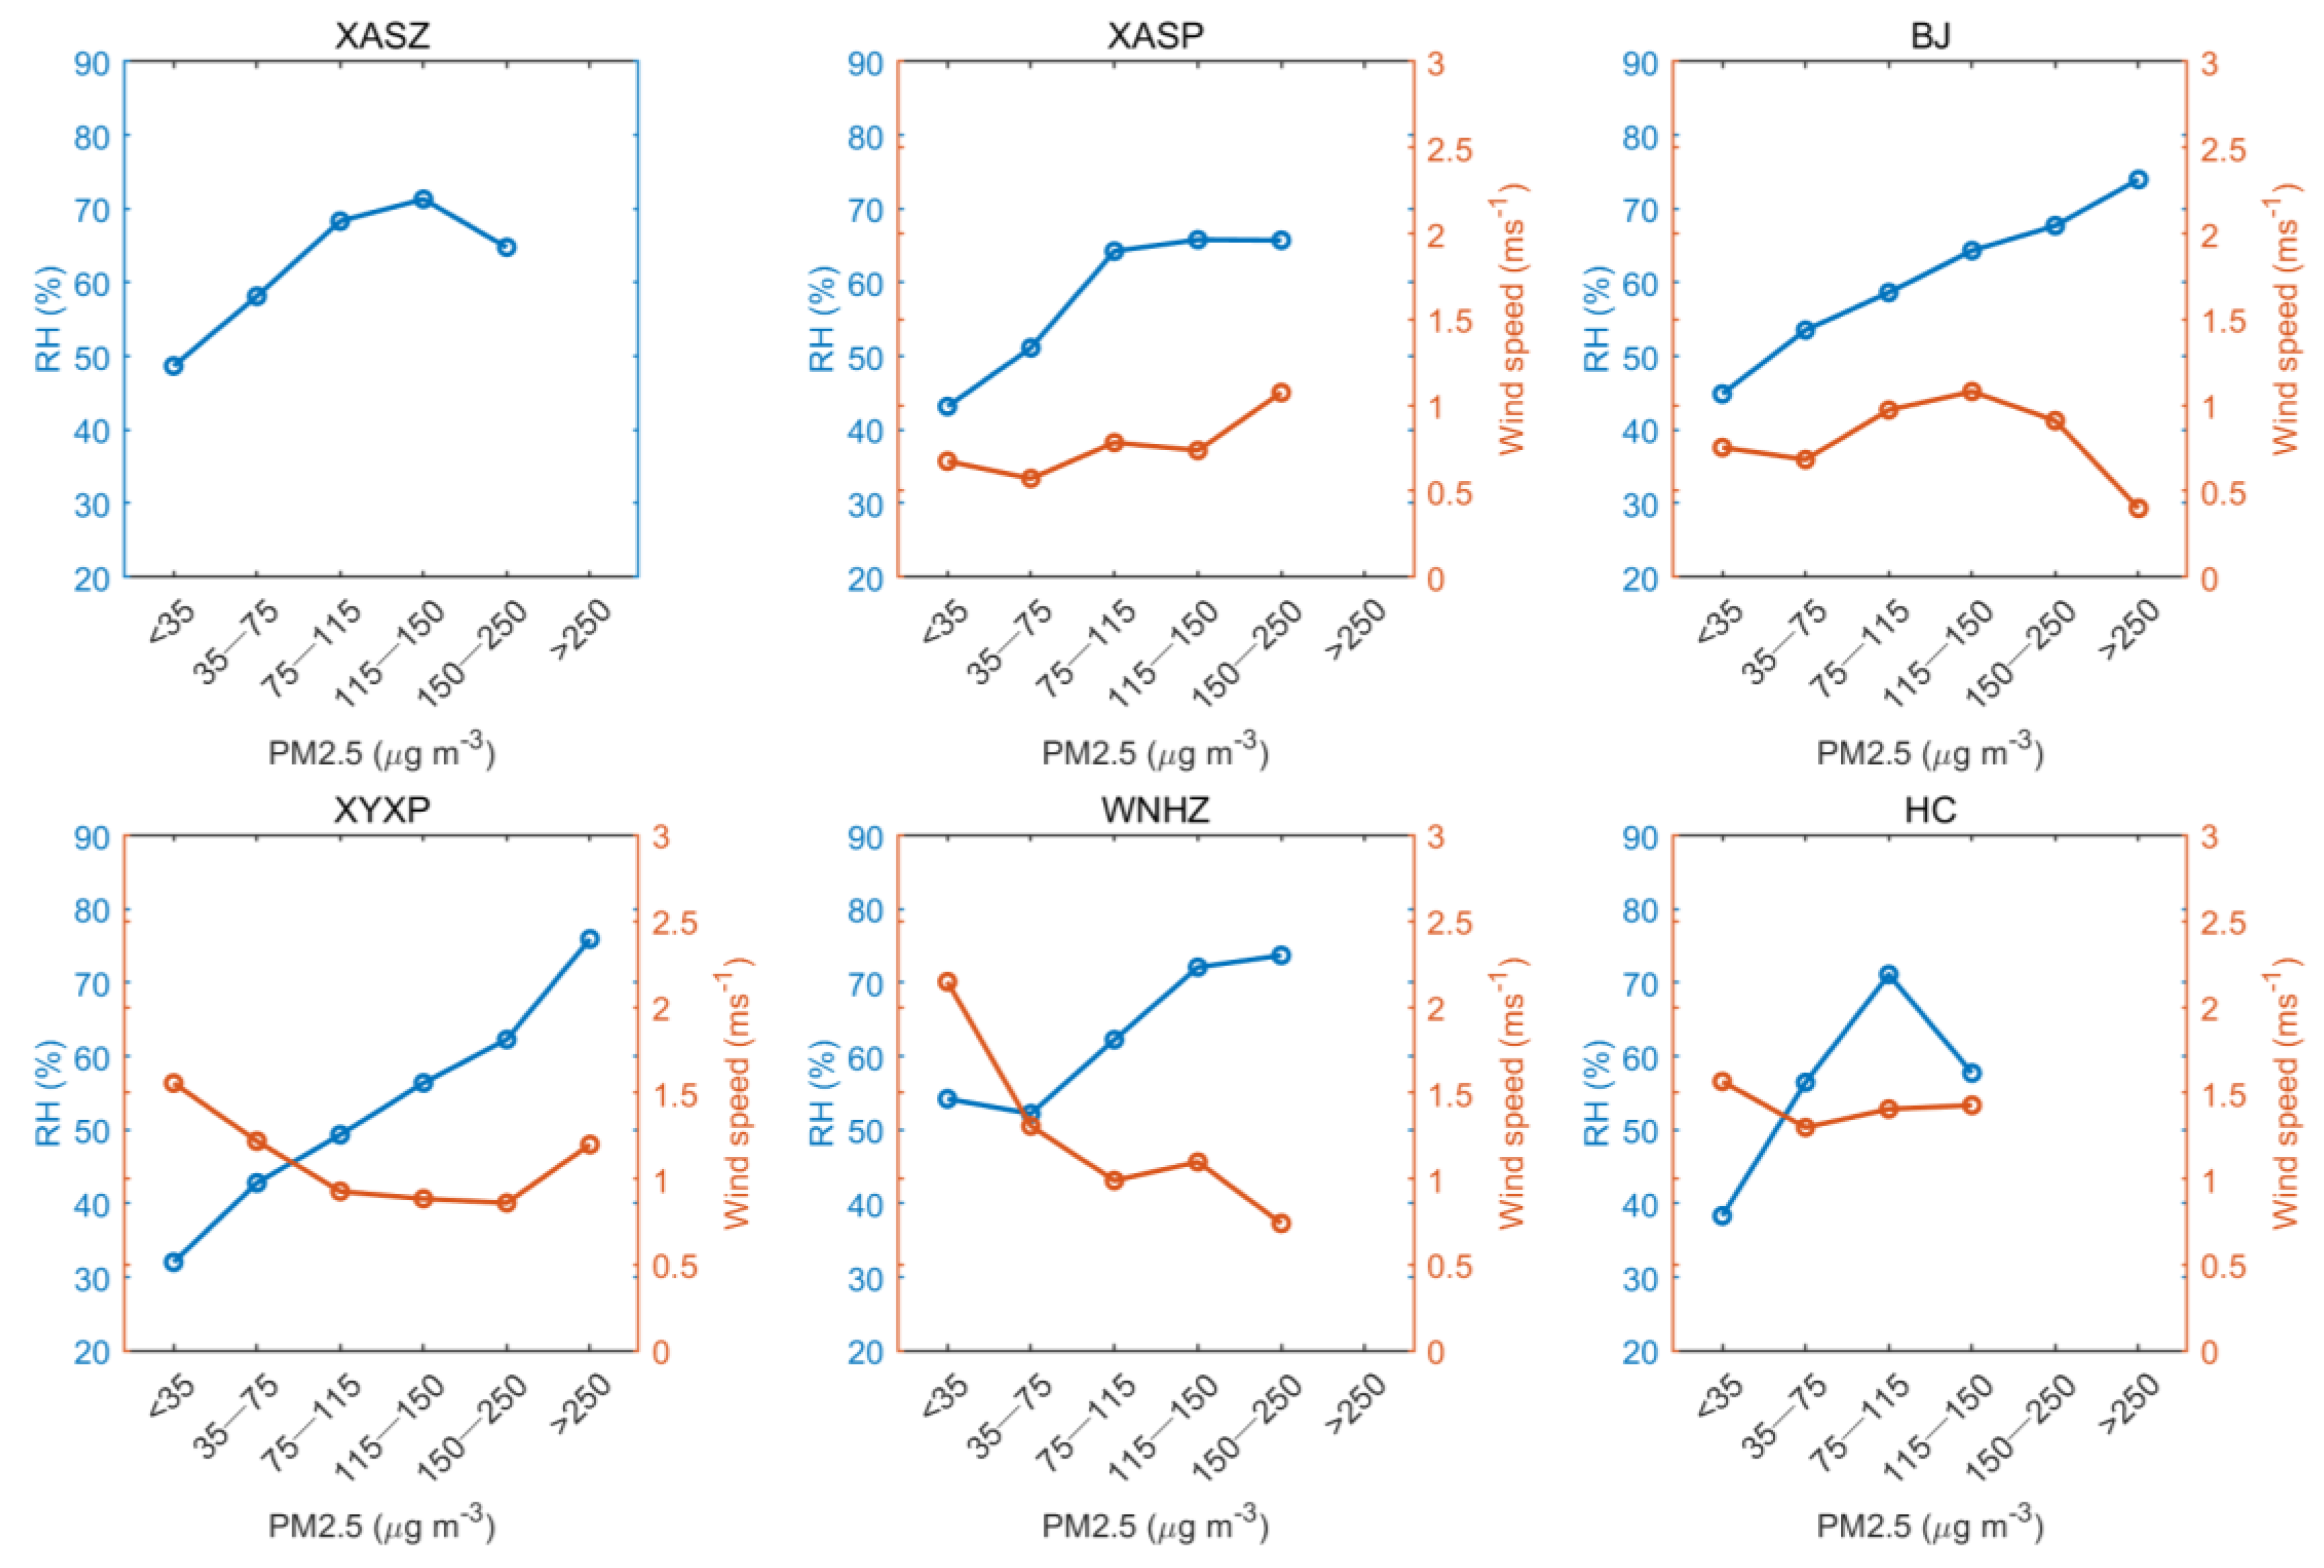
Figure 7.
Scatter plots of the SI contribution versus RH.
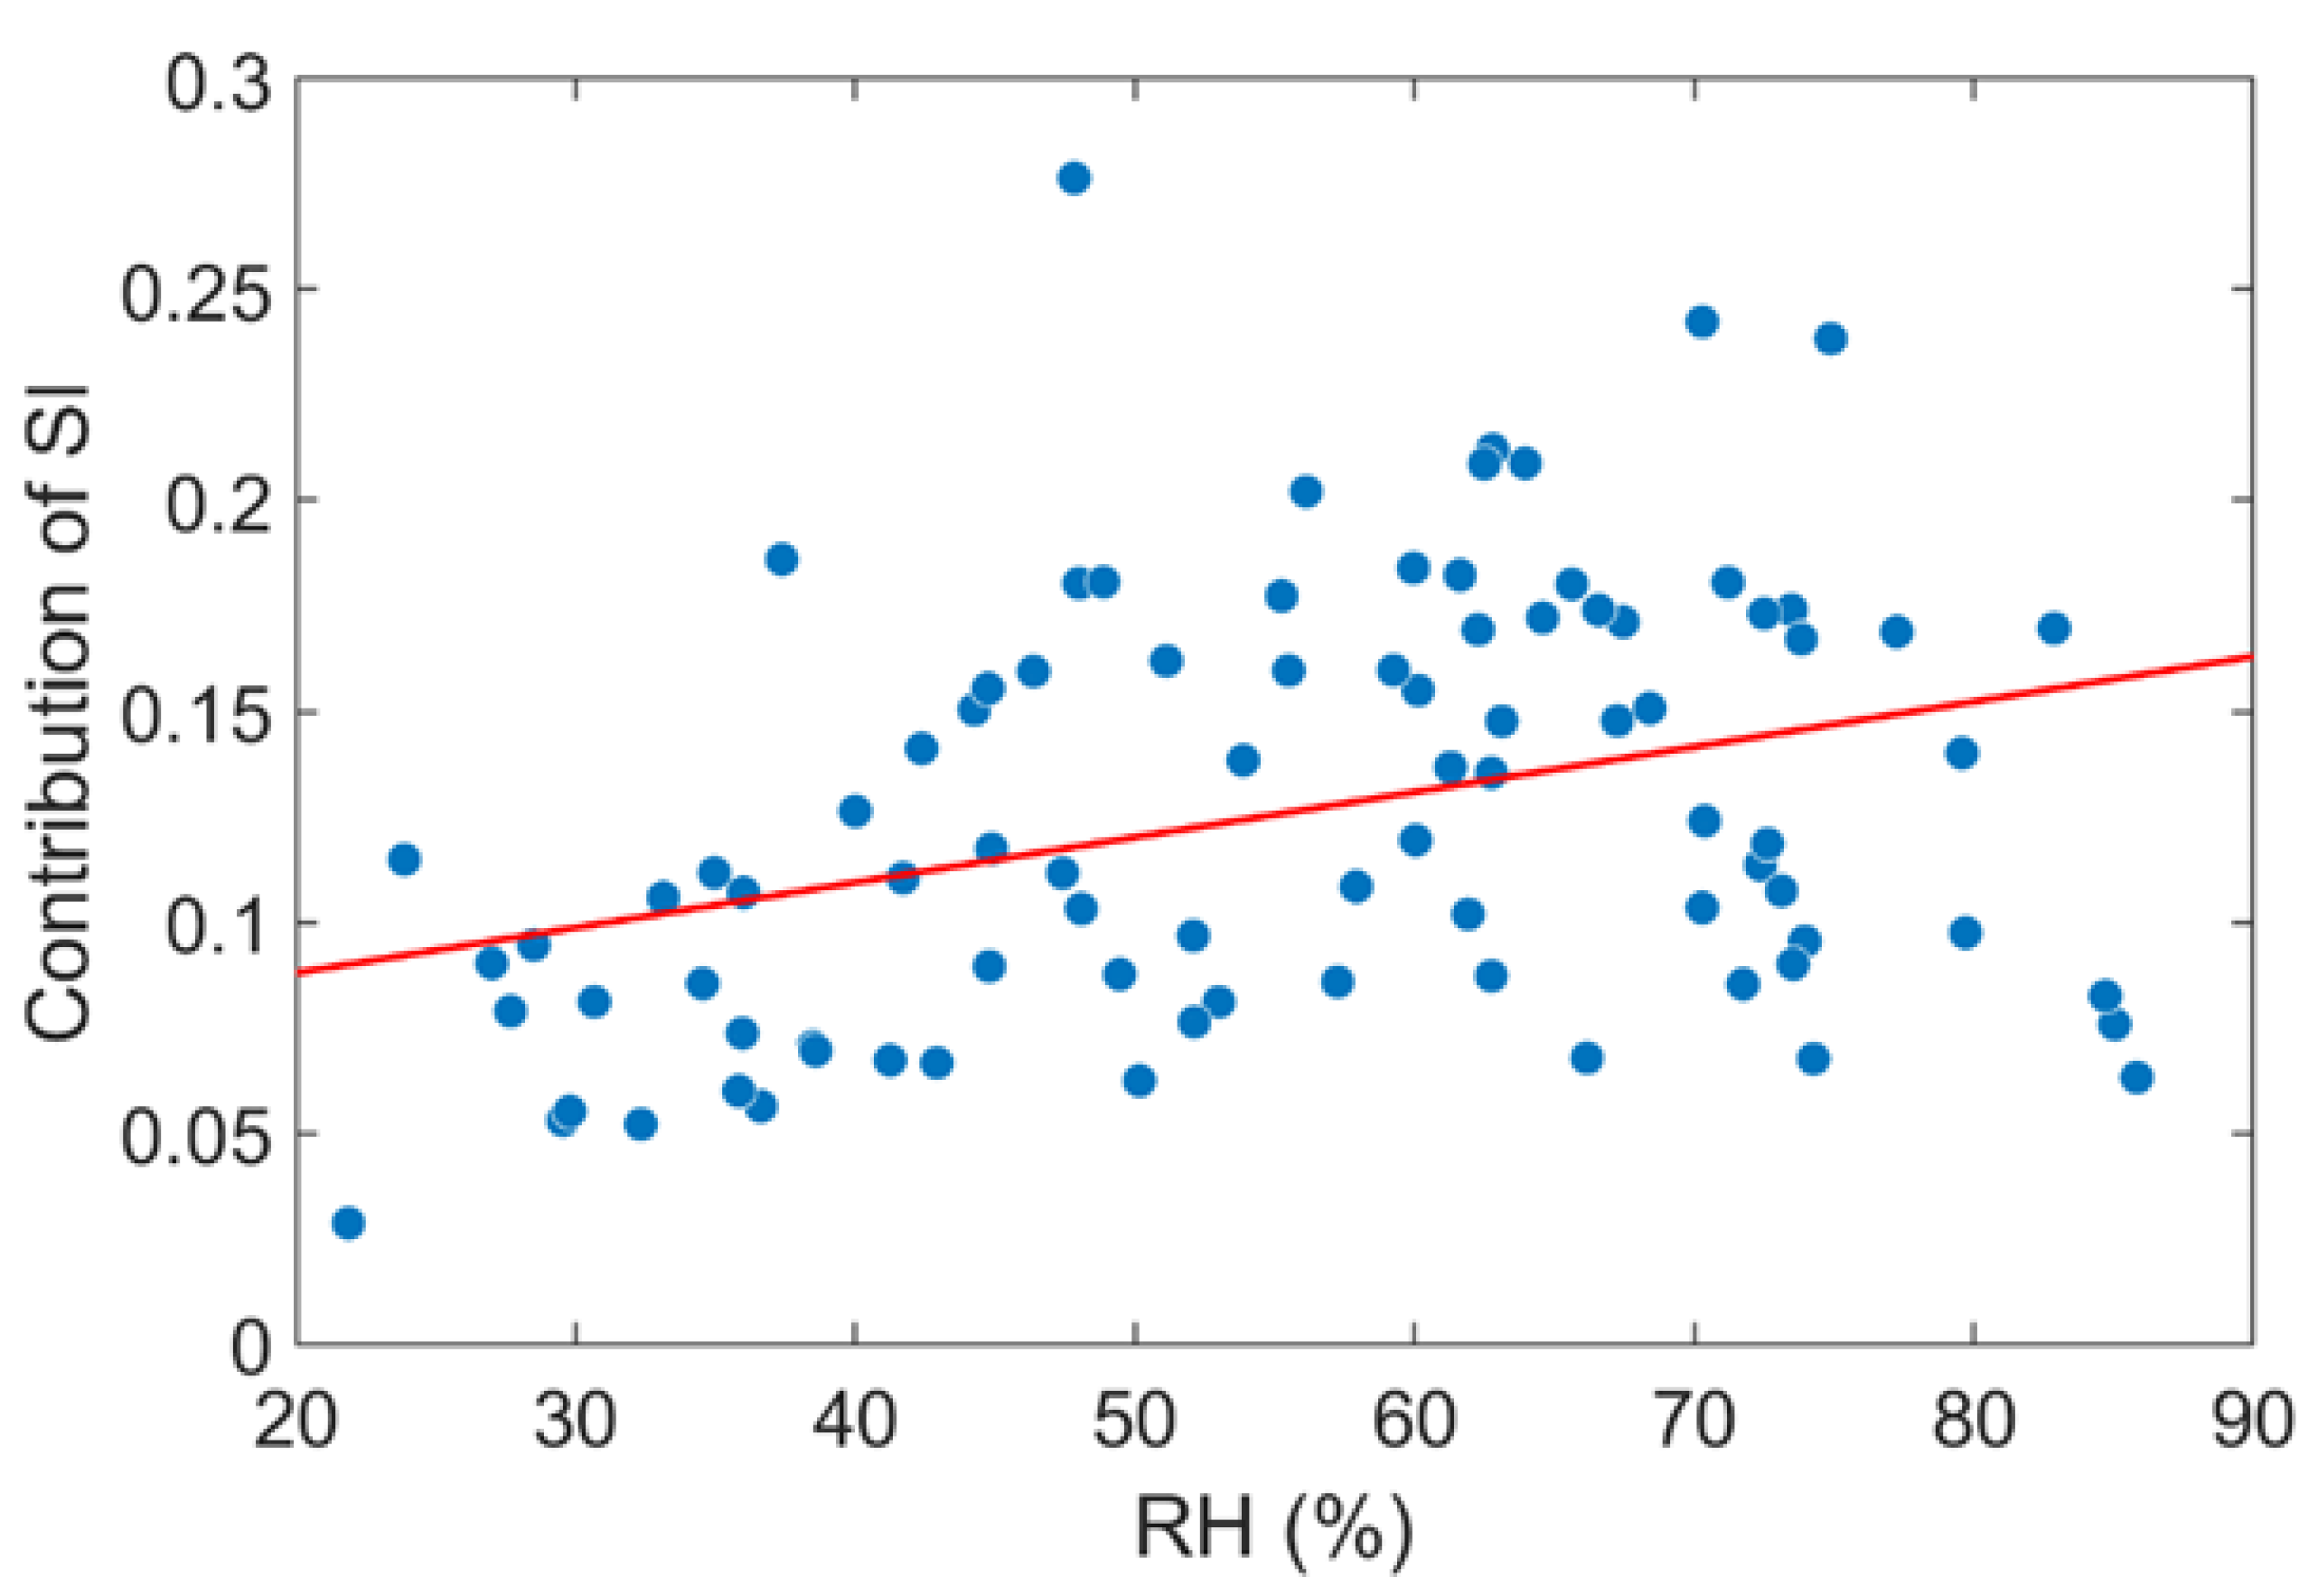
Figure 8.
Source attribution of PM2.5 at different wind speeds.

Figure 9.
Wind maps for the contribution of BB (left) and coal combustion (right) at XYXP.
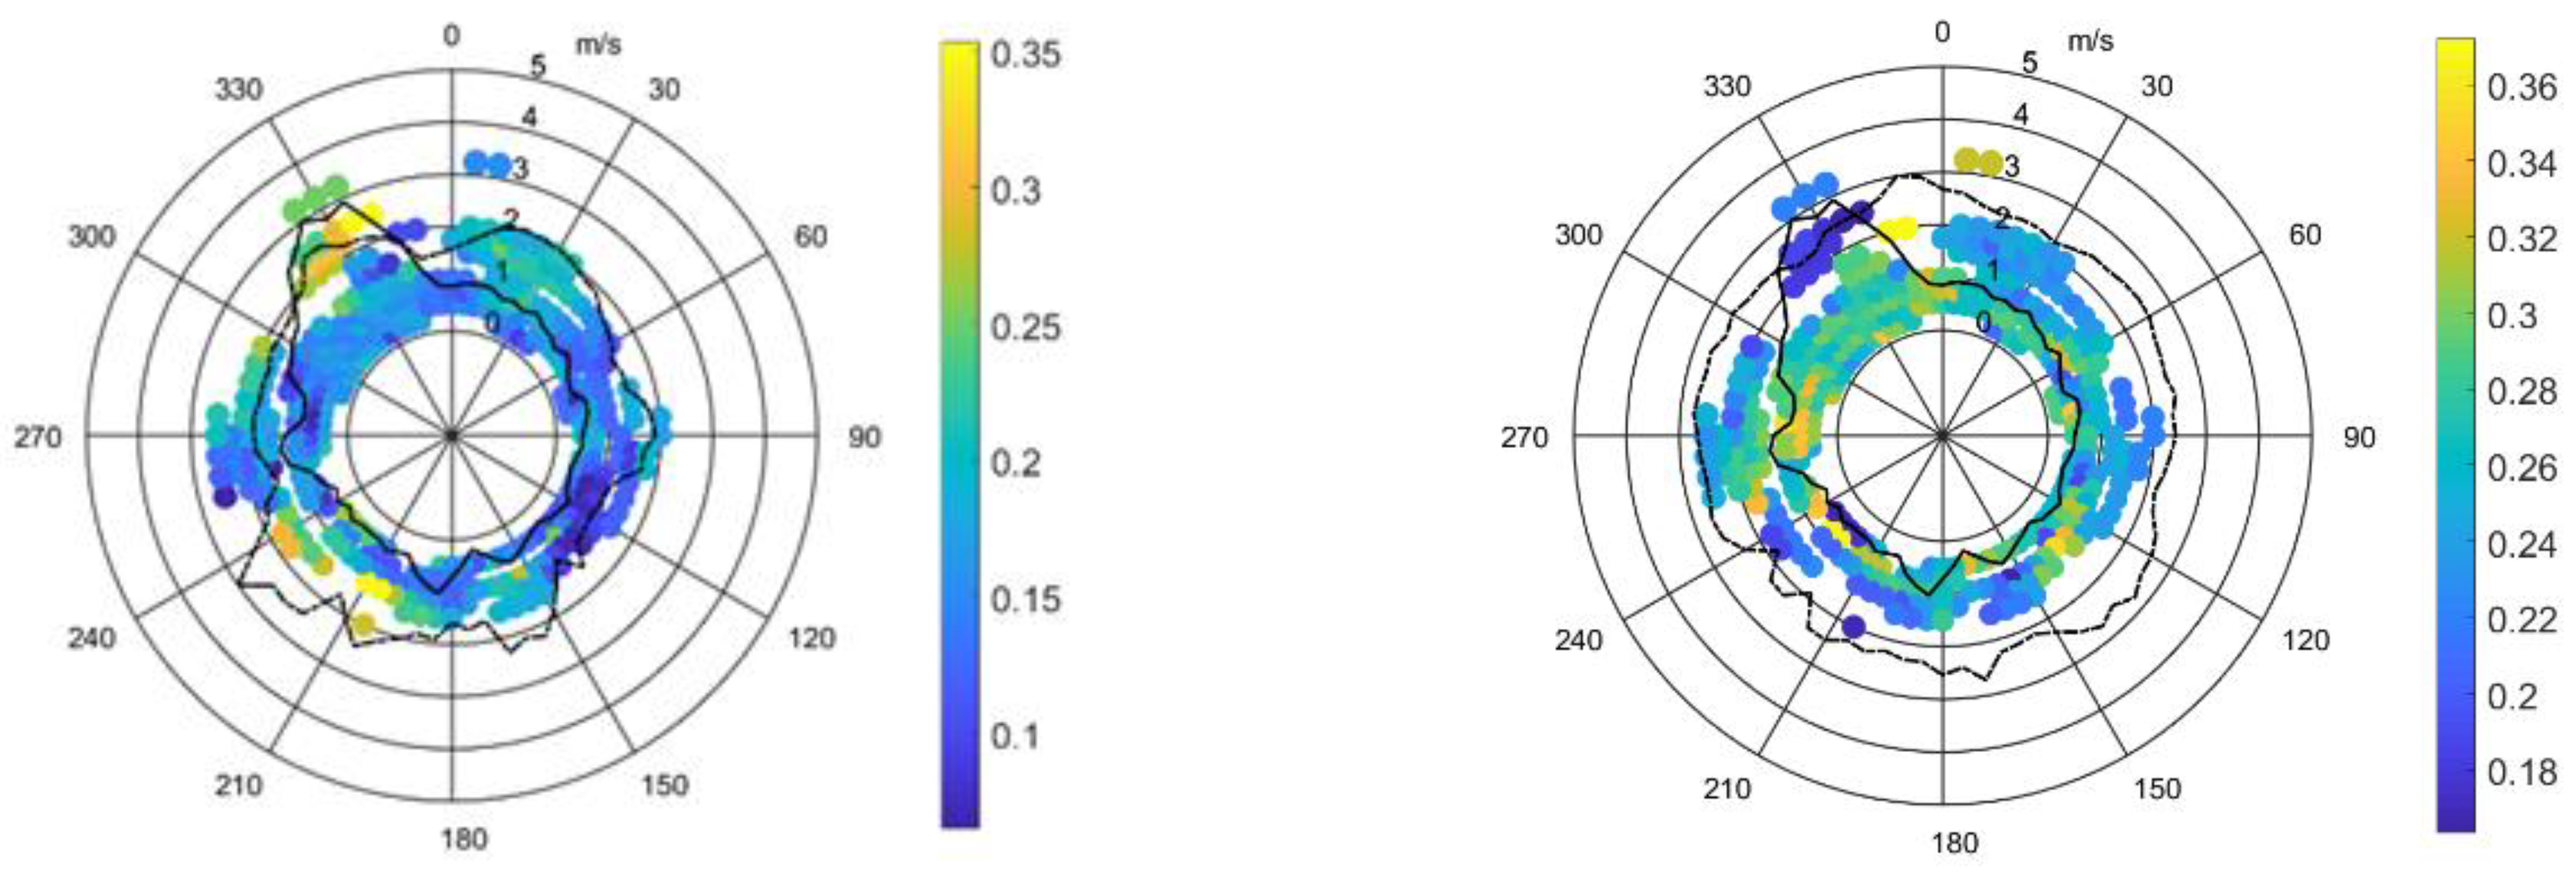
Table 1.
Detailed information of the six measurement sites.
| Site Name | City | Type | Latitude and Longitude | Period |
|---|---|---|---|---|
| XA | Xi’an | Urban | 34.350827° N, 108.949636° E | 10 February 2023–3 March 2023 |
| XASP | Xi’an | Urban | 34.158501° N, 108.889947° E | 10 February 2023–3 March 2023 |
| BJ | Baoji | Urban | 34.359815° N, 107.154069° E | 8 February 2023–1 March 2023 |
| XYXP | Xianyang | Suburban | 34.2780437° N, 108.489325° E | 1 December 2022–26 December 2022 |
| WNHZ | Weinan | Suburban | 34.4831258° N, 109.7050045° E | 28 December 2022–19 January 2023 |
| HC | Hancheng | Suburban | 35.6394631° N, 110.5818309° E | 30 January 2023–21 February 2023 |
Disclaimer/Publisher’s Note: The statements, opinions and data contained in all publications are solely those of the individual author(s) and contributor(s) and not of MDPI and/or the editor(s). MDPI and/or the editor(s) disclaim responsibility for any injury to people or property resulting from any ideas, methods, instructions or products referred to in the content. |
© 2023 by the authors. Licensee MDPI, Basel, Switzerland. This article is an open access article distributed under the terms and conditions of the Creative Commons Attribution (CC BY) license (https://creativecommons.org/licenses/by/4.0/).
Share and Cite
MDPI and ACS Style
Cao, L.; Tao, Y.; Zheng, H.; Wang, M.; Li, S.; Xu, Y.; Li, M. Chemical Composition and Source of PM2.5 during Winter Heating Period in Guanzhong Basin. Atmosphere 2023, 14, 1640. https://doi.org/10.3390/atmos14111640
AMA Style
Cao L, Tao Y, Zheng H, Wang M, Li S, Xu Y, Li M. Chemical Composition and Source of PM2.5 during Winter Heating Period in Guanzhong Basin. Atmosphere. 2023; 14(11):1640. https://doi.org/10.3390/atmos14111640
Chicago/Turabian StyleCao, Lei, Yanan Tao, Hao Zheng, Mei Wang, Shiying Li, Yongjiang Xu, and Mei Li. 2023. "Chemical Composition and Source of PM2.5 during Winter Heating Period in Guanzhong Basin" Atmosphere 14, no. 11: 1640. https://doi.org/10.3390/atmos14111640
Note that from the first issue of 2016, this journal uses article numbers instead of page numbers. See further details here.