

Atmospheric CO2 Isotopic Variations, with Estimation of Ocean and Plant Source Contributions

1
Australian Environment Foundation, P.O. Box 185, Melbourne, VIC 3126, Australia
2
Earth Insight, 8 Rae St, Hawthorn, Melbourne, VIC 3122, Australia
*
Author to whom correspondence should be addressed.
†
Retired. Formerly School of Earth Atmosphere and Environment, Monash University, Melbourne, VIC 3800, Australia.
Atmosphere 2023, 14(11), 1623; https://doi.org/10.3390/atmos14111623
Submission received: 17 August 2023
/
Revised: 12 October 2023
/
Accepted: 26 October 2023
/
Published: 29 October 2023
(This article belongs to the Special Issue Ocean–Atmosphere–Land Interactions and Their Roles in Climate Change)
Abstract
:This analysis uses both atmospheric CO2 concentrations and the accompanying δ13C isotopic measurements of CO2 over 40 years from 1978 to 2015 observed at ten different latitudes from 90° S to 82 °N. Atmospheric CO2 is separated into two components of CO2 attributable to deep ocean and to plant (including fossil fuel) sources. The isotopic values assigned to the two components are δ13C = 0‰ and −26‰, respectively. The latitude variations in residual source component CO2 show the ocean source component peaking at the equator. This contrasts with the residual plant source component that peaks in the Arctic Circle region. Seasonal comparisons show no change in the ocean component peaking at the equator and no significant changes in its variation with latitude, while the plant component shows seasonal changes of the order of 15 ppm at high latitudes. The ocean component shows clear anomalous behavior in the three years following the 1989 Pacific Ocean regime shift (a shift independently identified from the changed biological time series). By contrast, the residual plant component shows a correlation in the timing of maxima in its annual variations with the timing of El Nino events over the time span of 1985–2015. It also shows a discontinuity in annual variation coinciding with the 1995 AMO phase change. We conclude that the ocean and plant components of atmospheric CO2 relate to independent sources of atmospheric CO2 and have approximately equal magnitudes. The observations are consistent with a hypothesis that variations in the ocean components have an origin from upwelling water from deep ocean currents, and variations in plant components are dominated by a combination of fossil fuel CO2, phytoplankton productivity, and forest and peat fires, which primarily occur in the northern hemisphere.
1. Introduction
It has been previously shown that the apparent smooth and continuous rise in atmospheric CO2 concentrations can be broken into a series of trend changes associated with ocean decadal phase changes [1]. We extend that association through the separation of CO2 concentrations on the basis of carbon isotopes in order to distinguish between variations in CO2 concentrations associated with Pacific Ocean regime changes and variations associated with sea-surface temperature variations as represented in the Nino 3.4 index [2].
This paper does not study the bidirectional carbon cycle, which involves the bidirectional flux of CO2 from land to atmosphere, and ocean to atmosphere (see, for example, [3,4]). Rather, we use the observed isotopic composition of CO2 observed at ten globally distributed stations in order to obtain estimates of annual and decadal variations in atmospheric CO2 attributable to plant origins (both natural and anthropogenic processes) and to CO2 transfer into the atmosphere from upwelling deep ocean waters. This global perspective is thus different from, for example, the work of [5] who used carbon isotope studies on plant matter from a single location (Baragui River, Parana, Brazil) in order to deduce local climatic and vegetation composition changes over the past 400 years.
The measure of the ratio of 12C to 13C found in a sample of CO2 is expressed as δ13C, where the 13C/12C abundance ratio is of the order of 0.01. Variations in δ13C are attributable to variations in the molecular weight of CO2, which affect the rate of chemical reactions and photosynthesis.
There are now about 60 years of atmospheric CO2 concentration measurements available from the Scripps Institution of Oceanography (SIO) [6] and 40 years of δ13C isotope measurements of CO2 commencing in 1978. The SIO stations and years with both CO2 and δ13C measurements are listed in Table 1. The additional column shows the percentage of months with no data from 1986 to 2015. In the following analysis, we select the time period of 1986–2015 as having the most complete records. In particular, we avoid a 32-month period from 2016 to 2018 on Christmas Island, which has no data.
This analysis uses the CO2 concentration and isotope measurements after 1978 to divide the atmospheric CO2 concentration into an “ocean” and a “plant” component by assuming values for the isotopic composition for the two components. The purpose of this study is to demonstrate a means of computing the fraction of gaseous CO2 in atmospheric samples that can be attributed to a plant origin.
The isotopic approach used in this paper allows a phenomenological study of atmospheric CO2 origins from upwelling deep ocean sources, and from plant sources including both anthropogenic and natural sources that release CO2 into the atmosphere. This approach does not require assumptions or estimations of the dissolved inorganic carbon content of the ocean surface waters, nor does it quantify the uptake by the oceans of atmospheric CO2. It does, however, provide quantitative data on seasonal, annual and latitudinal variations in fractions of atmospheric CO2 attributable to ocean and plant sources.
2. Method, Model and Data
2.1. Deep Ocean and Plant Contributions to CO2
The basis of this analysis is that contributions to CO2 derived from deep ocean and from plant sources take discrete and different values. For SIO δ13C data, the standard ratio R(13C/12C)std is from the Vienna Peedee Belemnite (VPDB) isotope [7] where Rstd = 0.011180.
Deviations in the isotope ratio as measured in air samples are expressed as
δ13Cmeas = ((Rmeas/Rstd) − 1) × 1000.
For this analysis, we use two reference points as follows. For deep oceans:
as given by [8,9,10], and for plants, we use
13Cocean = 0‰
δ13Cplant = −26‰.
The plant value is representative of C3 plants [11]; phytoplankton for north and south, high latitudes [12]; and fossil fuels [13,14].
The separation of deep ocean and plant contributions can be quantified using the two relations defined in Equations (1) and (2):
where:
Ameas = Aocean + Aplant
δ13Cmeas = (δ 13Cocean × Aocean+ δ13Cplant × Aplant)/Ameas
- Ameas is the measured atmospheric concentration of CO2 in ppm;
- Aocean is the component of deep ocean origin, in ppm;
- Aplant is the component of plant origin, in ppm;
- δ13Cmeas is the isotopic value of measured atmospheric CO2;
- δ13Cocean is the isotopic value of “ocean” component atmospheric CO2;
- δ13Cplant is the isotopic value of “plant” component atmospheric CO2.
So, the separate components calculated using the measured values for atmospheric CO2, and assuming isotopic values for “deep ocean” and “plant” components, are given by Equations (3) and (4) as follows.
and
Aocean = Ameas × (δ13Cmeas − δ13Cplant)/(δ13Cocean − δ13Cplant),
Aplant = Ameas − Aocean.
Measured atmospheric concentrations are recorded in parts per million (ppm) by volume. Thus, separating an ocean and a plant source component requires converting ppm by volume to ppm by mass.
So,
and
where:
δ13C = {R(13C/12C) meas/R(13C/12C)std − 1} × 1000
R(13C/12C) meas = (1 + δ13C/1000) × R(13C/12C)std
- R(13C/12C) meas is the ratio for the sample carbon-13 to carbon-12;
- R(13C/12C)std is the ratio for the standard carbon-13 to carbon-12.
Then, the carbon mass may be calculated in atomic mass units as
Carbon = {12 + 13 × R(13C/12C) meas}/(1 + R(13C/12C) meas).
So, the mass of CO2 can be calculated, hence the conversion of ppm by volume to ppm by mass.
The mass correction is small, of the order of 0.0005 ppm compared with measurement errors of the order of 0.1 ppm. Although not significant, these mass corrections are applied to this data.
For the remainder of this paper, we use the term “ocean component” and “ocean source” to refer to that fraction of atmospheric CO2 having the isotopic signature of deep ocean water.
2.2. Ocean and Plant Source Component Analysis for Monthly Values
The monthly measurements for the South Pole and Christmas Island from 1978 to 2015 and Point Barrow from 1980 to 2015 are shown in Figure 1. The ocean and plant source components of atmospheric CO2 are found using Equations (3) and (4), respectively. The results from the monthly measurements of atmospheric CO2 concentrations and δ 13C are shown in Figure 2 and Figure 3, respectively, for the South Pole and Christmas Island from 1978 to 2015 and for Point Barrow from 1983 to 2015.
The seasonal variations seen in the measured CO2 concentrations for the South Pole, Christmas Island and Point Barrow are found in the respective plant components but not to any significant extent in the corresponding ocean components.
There are two observations that follow from this analysis:
- (a)
- A subtle increase above the trend in the measured CO2 concentrations is visible in Figure 1a for times around 1988–1991. This feature is clear in the plot of isotopic composition shown in Figure 1b (referred to as the “bubble” in later paragraphs) and overlaps in time the 1989 Regime Shift described by [15]. That 1989 event was clearly evident in biological records although only weakly shown in indices of the Pacific climate. Consistent with that prior finding of an event in biological records, we see that the “bubble” is present in the plant component of atmospheric CO2 as deduced from the isotopic analysis (Figure 2). However, the “bubble” is not evident in Figure 3, which shows the equivalent plot of the ocean component of atmospheric CO2. This feature is discussed in additional detail below in Section 4.
- (b)
- For the ocean components shown in Figure 2, Christmas Island (2° N) near the equator shows higher values for the entire time span of 1978–2015, while Point Barrow (71° N) in the Arctic shows the lowest values. We discuss the significance of these observations in the context of ocean currents, in Section 3.2.
The average annual increases for each of the stations in Figure 1, computed for the time span from 1986 to 2015, are found through a least-squares fit to the measurements; these are listed in Table 2. The most remarkable result is that, for each site, the ocean and plant average annual increases are similar, to within 0.3%.
3. Ocean and Plant Source Component Latitude Analysis
3.1. Annual Values
The behavior of the ocean and plant components are further explored through analysis of each of the ten SIO latitudes listed in Table 1.
The variation in atmospheric CO2 measurements shows increasing concentrations from the lowest values at the South Pole 90° S to a peak at Point Barrow 71° N. Figure 4 shows the residual annual variations of total CO2 less the value at the South Pole, for each station, averaged over 1986 to 2015. This is the time span where there are concentration and isotopic composition CO2 measurements available for all latitudes shown in Table 1.
The latitude variations in the residual annual variations of total CO2 concentrations are quite different when separated into ocean and plant components. The component values, standard deviations and errors of the mean are listed in Table 3 and Table 4 and shown in Figure 5. The ocean component peaks near the equator (Figure 5a). However, the plant component peaks at the Arctic Circle latitudes of Point Barrow 71° N and Alert 82° N (Figure 5b).
The analysis also shows significantly different residual values at Mauna Loa at an elevation of 3397 m compared to Kumukahi at the same latitude but at an elevation of 3 m (highlighted in Table 3 and Table 4). The ocean component residual at Mauna Loa is significantly greater than the Kumukahi residual and the sign of this difference of residuals is reversed for the corresponding plant components. These differences are shown in Figure 5.
The differences may be due to the elevation at which Mauna Loa measurements are made; we suggest that the elevation of 3397 m is above the sub-tropical inversion, having the effect that the atmosphere is locally more mixed with contributions from the equatorial region. This would have the effect of increasing the residual ocean component relative to that found at Kumukahi at an elevation of 3 m. Likewise, the residual plant component values at the elevated Mauna Loa site are mixed to a lower value than the Kumukahi residual plant value.
We also note from Figure 5 and Figure 6 that the negative values of CO2 relative concentration, and of plant source component CO2, as observed at Baring Head (latitude 41° S between the north and south islands of New Zealand), are associated with a location between the Southern Ocean and south Pacific Ocean. This is consistent with an understanding that the expanse of ocean in the southern hemisphere acts as a sink for atmospheric CO2, and further, that an absence of upwelling deep ocean currents in southern latitudes [9] is associated with an absence of an anomaly in the ocean source component of CO2 at Baring Head.
3.2. Latitude Analysis for Seasonal Values
If the ocean source component is independent of the plant source component, then the ocean source peaking at the equator should be independent of seasonal variations. Figure 6 shows residual seasonal variations restricted to the end of the boreal winter and to the end of the boreal summer. Averaging is performed for the two months of February–March, and for August–September. As for Figure 5, we obtain ocean and plant components of CO2 for all latitudes, but restricted to the two seasons. There is little change in the ocean components for the seasonally separated values relative to the residual annual averages. The stability of the ocean source CO2 concentrations can be seen by comparing the latitude seasonal changes for February–March with those of August–September (Figure 6a,b).
The residual seasonal variations in the plant component of CO2 are quite different when compared to the ocean component, as seen in plots of Figure 6b,d. Plant components show changes of up to 16 ppm from the end of the boreal winter (February–March) to end of summer (August–-September) at the far-north stations of Point Barrow and Alert.
The hypothesis for this seasonal difference is that plant source component variations in the Northern Hemisphere are due to the influence on the carbon cycle of the boreal forests. The trees start to grow in spring, drawing CO2 from the atmosphere until autumn when the end of summer growth reduces the draw-down of CO2. In addition, it is expected that decaying plants will return CO2 to the atmosphere.
The seasonal differences of end boreal winter less boreal summer are shown in Figure 7 for ocean and plant components. The ocean component (Figure 7a) shows that seasonal differences are not statistically different with the exception of Christmas Island 2° N, American Samoa 14° S and Kermadec Island 29° S. The peak in the ocean component for the boreal winter (Figure 6a) is shifted about 15° S in Figure 7a. This may be explained as a result of transport by atmospheric winds comparatively enriched in the ocean component as there are strong wind systems, particularly the trade winds in the equatorial region.
The plant component also shows evidence of atmospheric transport from the northern hemisphere to southern hemisphere during the boreal winter, seen at latitudes 15° S to 30° S (Figure 6b,d and Figure 7b). It is seen most clearly in Figure 7b at 30° S where the residual plant component is approximately 0.5 ppm above the trend, consistent with atmospheric transport from north to south.
This analysis shows that at Point Barrow, 71° N, and at Alert, 82° N, the ocean component varies only slightly by 0.3 ± 0.2 ppm and 0.1 ± 0.1 ppm from boreal winter to summer, whereas there are large variations of 16 ppm and 15 ppm for the plant component, respectively. At lower latitudes in the northern hemisphere, there are reduced differences from winter to summer. The spatial and seasonal distribution in ocean and plant source components differs by up to a factor of 50, and leads us to the conclusion that the ocean source of CO2 is an independent source of atmospheric CO2 and is decoupled from the plant source component.
3.3. Sensitivity of Latitude Analysis to Assumptions of Isotopic Composition
The separation of observations of atmospheric CO2 content into ocean and plant source components is made using assumptions that the CO2 ocean component δ13C is 0‰ and the plant component δ13C is −26‰. The sensitivity to this choice is assessed by independently varying each component δ13C by ±2. The results are shown in Figure 8 for station variations less the source contributions at the South Pole, for the time span of 1986 to 2015.
The perturbed values of δ13Cocean in Figure 8 give a maximum component variation of 0.1 ppm, while the corresponding perturbations in δ13Cplant give a maximum component variation of 0.4 ppm.
These perturbation studies demonstrate that the patterns of ocean and plant component changes with latitude are not significantly affected by variations of ±2‰ in the assumed baseline values used for δ13C.
4. Annual Differences of Ocean and Plant CO2 Components
4.1. Annual Differences for Individual Stations
Figure 1, Figure 2 and Figure 3 show plots of monthly variations in total CO2 and its isotopically separated ocean and plant components. Additional features of ocean and plant source components of CO2 can be seen in an analysis of annually averaged measured CO2 concentrations and corresponding ocean and plant components. These are shown in Figure 9, Figure 10 and Figure 11. Figure 10 and Figure 11 show that there is more annually averaged variability in the plant components compared to the ocean components. The simplest demonstration of variability comes from the standard deviations for the year-on-year changes. The results, given in Table 5, show that the ocean components are consistently less variable than the plant components. We suggest that this may be attributable to the fact that the ocean dynamics change more slowly than the atmospheric dynamics, affecting plant components.
The quantitative annual increases for atmospheric CO2 and components from 1986 to 2015 are given in Table 6. The ocean component and plant components are approximately equal at 50% of the annual CO2 concentration increase.
We note that the annual values in Table 2 are directly from monthly values that have seasonal variations, while the values in Table 6 come from annual averages; hence, the latter do not show seasonal variations. This difference is illustrated in a comparison of the plant component at Point Barrow, which has a larger standard deviation of 0.038 ppm from the monthly seasonal variations, compared with 0.02 ppm for the annual averages.
4.2. Trend Breaks in Annual Differences for the Ocean Component
The annually averaged CO2 concentration values are shown in Figure 9. It is obvious that there is a slight excursion from 1988 to 1991 for Point Barrow CO2 concentrations (the “bubble” referred to above).
For the ocean component shown in Figure 10, the Christmas Island values are above those at the South Pole and Point Barrow. Further, a straight-line fit for the South Pole component from 1979 to 2001 projected to 2018 shows a trend change in ocean component data at about year 2000.
We use the Chow Break Test [16] on each of the curves plotted in Figure 10. The Chow Break Test is used on a data series, and it uses a linear least-squares straight-line fit to show whether there is a statistically significant break for two straight lines to be a better fit than one straight line. This example shows that the ocean component for each of the South Pole, Christmas Island, Mauna Loa and Point Barrow has a break point in its trend at year 2001 ±2.
This break in the ocean component is present at all latitudes, as shown in Figure 11, where the average ocean component of CO2 increases by 0.731 ± 0.008 ppm per year for 1986 to 2000 and 1.066 ± 0.005 per year for 2002 to 2015.
In searching for an explanation, or at least an association, with the break in the ocean component, we observe that the break in ocean component CO2 after 2001 is coincident with an inflection in global lower troposphere temperatures measured by satellites [17]. The inflection is obvious in Figure 12 where separate straight-line fits for 1979 to 2000 and 2001 to 2015 are identified. Tropospheric temperatures show a rising trend of the order of 0.15 °C per decade before 2001, and a temperature plateau starting in 2000 to 2002, extending to approximately 2015 (the duration of this study).
An analysis of the global carbon cycle by [4] also shows a change in trend following the year of 2000. That analysis used measured and modeled data (but not isotopic data) to estimate the movement of CO2 from the atmosphere into the ocean and found an increase in CO2 absorbed into the ocean from about 2000 to 2019. In contrast to [4], the results in Figure 11 and Figure 12 demonstrate a change in the trend of movement of CO2 from ocean to atmosphere, which is based on observational data only.
A hypothesis consistent with the observed break in the trends of atmospheric ocean-component CO2 and tropospheric temperature around 2001 is that there is an increased upwelling of cold water in the oceans, which may then reduce global temperature and release CO2 with an increased ocean-component isotopic mix into the atmosphere.
4.3. Annual Differences in the Plant Component CO2; Correlation with a Phase Change in the AMO
The plant component CO2 also shows an observed temporal change associated with ocean and atmospheric temperature shifts. Figure 13 shows annual changes including the “bubble” for the years 1988–1992 associated with the 1989 Regime Shift described by [15]. Replotting these data in Figure 14 after trend removal shows not only the “bubble” but a correlation of plant component CO2 with increasing latitude—a regional rather than global change. The residual plant CO2 values show increases in a northerly direction from the South Pole to Point Barrow 71° N. The obvious hypothesis to explain this variation is that the source of atmospheric plant CO2 is a combination of fossil fuel CO2, phytoplankton productivity in the oceans, and forest and peat fires, which occur primarily in the northern hemisphere. Figure 14 is consistent with this combination of sources.
Figure 14 also shows a clear inflection in the residual trends of the annual change in plant component CO2 near the year of 1995. This coincides with a phase change in the Atlantic Multi-decadal Oscillation (AMO) from negative to positive, as described by [18]. That phase change is also associated with synchronous changes in numbers of small pelagic fishes [19]. These observational changes are consistent with an interpretation of decreased phytoplankton productivity after 1995, which in turn may explain the observed decrease in numbers of small pelagic fishes.
The pelagic fish time series shows an increase from 1995 to 2010 and, with phytoplankton at the bottom of the ocean food chain, implies increasing phytoplankton productivity. Such an increase would cause the increased removal of CO2 in the ocean; this outcome in turn is associated with a decrease in the plant component of atmospheric CO2. Thus, variable ocean sinks for CO2 are directly coupled to the atmosphere as the concentration and isotopic composition of the atmosphere are varied.
4.4. Correlation of Global Plant Component CO2 Variations with the ENSO
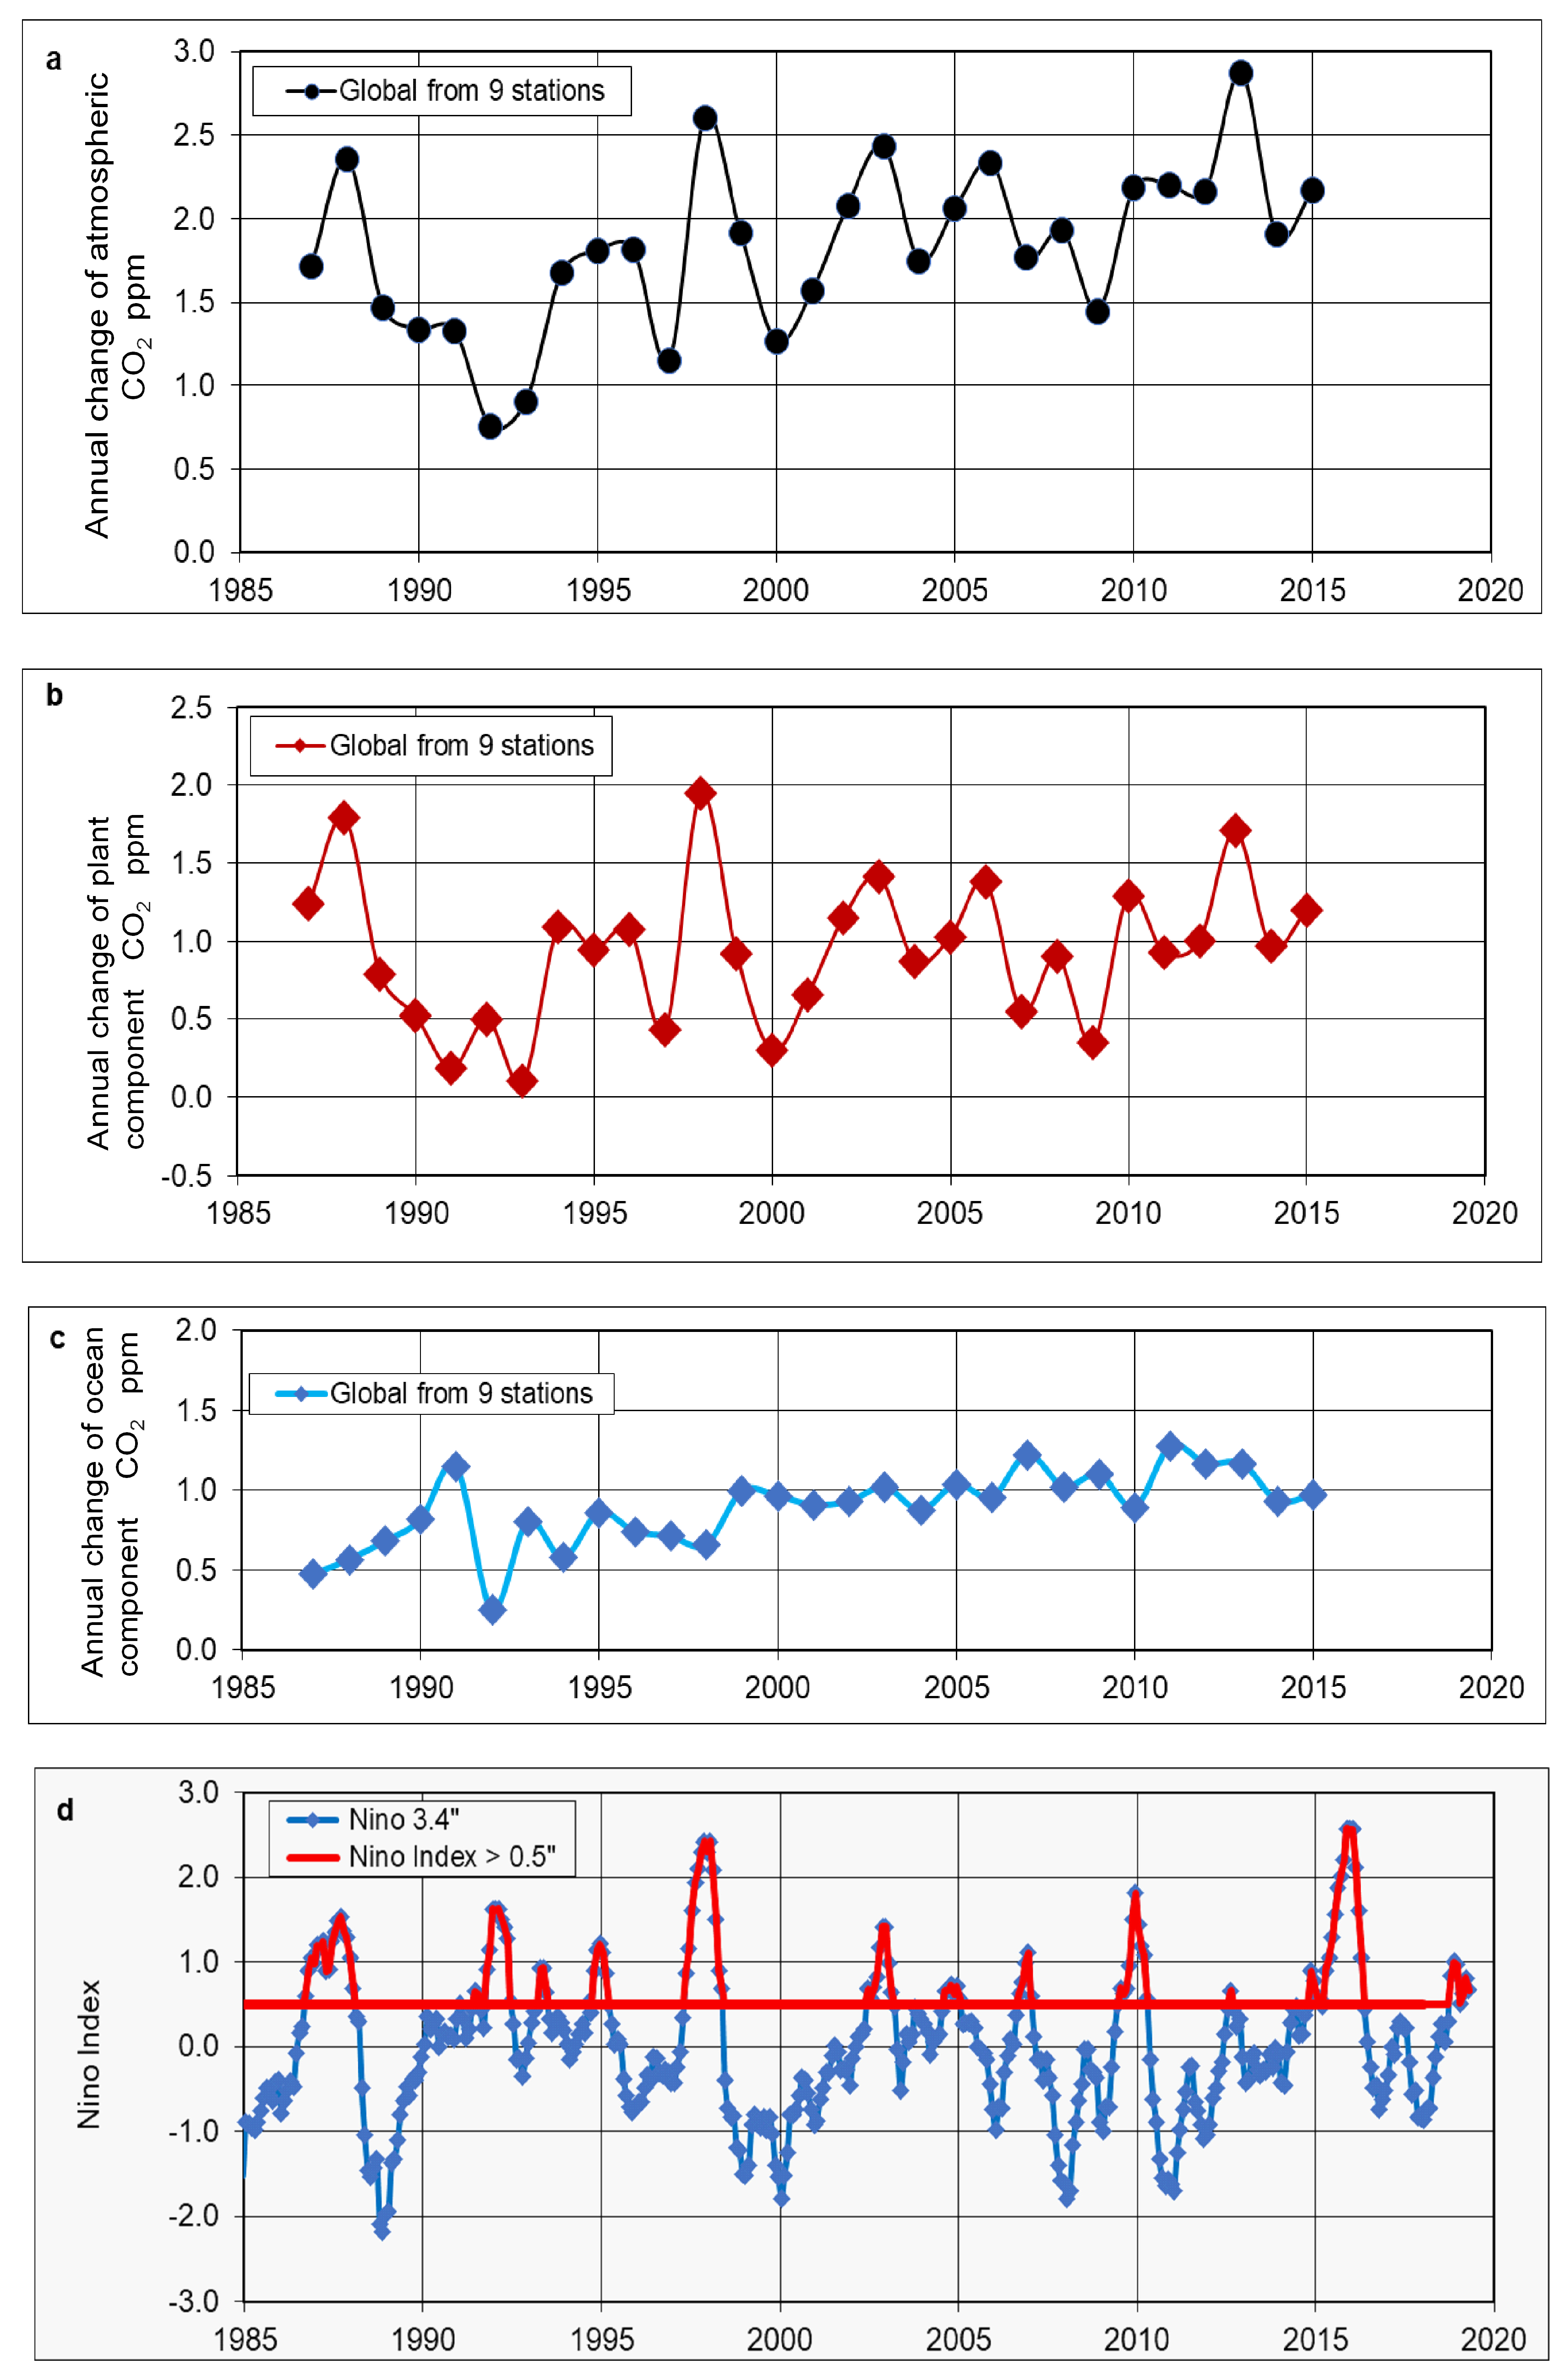
It is possible to estimate the annual changes in global atmospheric CO2 concentrations and the separate ocean and plant CO2 components, using the nine surface stations listed in Table 1 (where Mauna Loa is excluded, being at an altitude of 3397 m above sea level). The nine stations are taken to represent values in latitude bands defined by the average of the station latitudes, with the exception of the latitude extremes represented by Alert and the South Pole. The band latitudes are then used to calculate the fraction of the global surface within the bands, as shown in Table 7.
Figure 15a–c show the year-on-year annual changes in global atmospheric CO2 concentrations and annual changes in global plant and ocean CO2 components. For comparison, the El Nino southern Oscillation (ENSO) variation is shown in Figure 15d via the Nino 3.4 SST Index [2,20]. The strong 1997–1998 and 2016–2017 El Nino events are obvious. Between 1989 and 2013, there are 10 El Nino peaks, which correlate in time with peaks in the annual plant component of CO2, although the two time series are clearly not linearly related in their magnitude.
5. Discussion and Conclusions
For the time span of 1978 to 2015, the division of atmospheric CO2 concentrations into two components having separate origins from deep ocean sources and from plants including fossil fuel emissions, shows a differing geographical distribution of the components. This indicates that variations in deep ocean components and in plant components of atmospheric CO2 concentrations are attributable to independent mechanisms. These results are not significantly affected by variations in the assumed baseline values of δ13C, which characterize the isotopic composition of carbon in CO2.
We find that the ocean component and plant components as derived from isotopic data are approximately equal at 50% of the annual CO2 concentration increase. This result is similar to the outcome of a recent study [21] that used an ocean circulation model (without isotopic data) to track emitted carbon through the atmosphere–ocean system from pre-industrial times to the present (1780 to 2020). That study provided an estimate of 55% ocean source in atmospheric CO2 despite using a very different methodology compared with this paper. It is of interest that the two different approaches yield estimates of those contributions to atmospheric CO2 concentrations that are similar within a few percentage points.
Four essential conclusions may be drawn from this study using carbon isotopes.
- Annual increases in atmospheric CO2 concentrations over 1978–2015 when split into plant and deep ocean sources via the isotopic signatures show approximately equal parts when averaged over all latitudes.
- The deep ocean component of CO2 has its maximum value at the equator and we conclude that it is an independent source of atmospheric CO2. This is further demonstrated by its limited year-on-year variability. We hypothesize that the observations of changes in ocean source CO2 are attributable to the upwelling of CO2-rich water transported across the sea floor via the global thermohaline circulation of the oceans.
- The plant source CO2 in the atmosphere shows strong seasonal variability in northern latitudes up to the Arctic circle. It also shows more temporal year-by-year variability than that of the ocean source CO2 and shows maximum variations coincident with the timing of El Nino events. It also shows a change in trend associated with the 1995 AMO phase change. These spatial and temporal variations are consistent with the plant source CO2 being associated with multiple variations in fossil fuel CO2 emissions, together with natural variations in the net primary productivity of oceanic phytoplankton, and forest and peat fires.
- The differing variations by year and by latitude of plant source and deep ocean source CO2 as measured from the analysis of carbon isotopes in atmospheric CO2 samples, suggest that inclusion of such isotopic data in full carbon cycle models for the Earth may provide additional constraints on the modeling of bidirectional atmosphere–ocean transfers of CO2.
Author Contributions
Conceptualization and software, T.Q.; methodology, T.Q. and M.A.; validation, formal analysis, investigation, resources, data curation, T.Q.; writing—original draft preparation, T.Q.; writing—review and editing, T.Q. and M.A. All authors have read and agreed to the published version of the manuscript.
Funding
This research received no external funding.
Institutional Review Board Statement
Not applicable.
Informed Consent Statement
Not applicable.
Data Availability Statement
Scripps Institution of Oceanography (SIO) [6] CO2 and δ13C isotope variations of CO2 summarized in Table 1 are available at https://scrippsco2.ucsd.edu/data/atmospheric_co2/sampling_stations.html, (accessed 21 June 2023). For each observation station, we use data downloaded in files “monthly_flask_co2_alt.csv” and “monthly_flask_c13_alt.csv”, where we use column 9 (filled data interpolating over gaps in the monthly record). Global lower troposphere temperatures measured by satellites (Earth System Science Center, 2022) used in Figure 14 were accessed from columns 1, 2, 3 of https://www.nsstc.uah.edu/data/msu/v6.0/tlt/uahncdc_lt_6.0.txt (accessed 21 June 2023). The Nino 3.4 SST Index used in Figure 15d was accessed from NOAA [2] at https://psl.noaa.gov/gcos_wgsp/Timeseries/Data/nino34.long.data (accessed 21 June 2023).
Conflicts of Interest
The authors declare no conflict of interest. Author Tom Quirk is a member and former board member of the Australian Environment Foundation. The Foundation had no role in the design of the study; in the collection, analyses, or interpretation of data; in the writing of the manuscript; or in the decision to publish the results. The paper reflects the views of the authors and not the Foundation. Author Michael Asten is an associate of Earth Insight. The paper reflects the views of the scientists and not Earth Insight.
References
- Quirk, T. Did the global temperature trend change at the end of the 1990s? Asia-Pac. J. Atmos. Sci. 2012, 48, 339–344. [Google Scholar] [CrossRef]
- NOAA. Nino 3.4 SST Index. Available online: https://psl.noaa.gov/gcos_wgsp/Timeseries/Data/nino34.long.data (accessed on 15 April 2023).
- Crisp, D.; Dolman, H.; Tanhua, T.; McKinley, G.A.; Hauck, J.; Bastos, A.; Sitch, S.; Eggleston, S.; Aich, V. How well do we understand the land-ocean-atmosphere carbon cycle? Rev. Geophys. 2022, 60, e2021RG000736. [Google Scholar] [CrossRef]
- Gruber, N.; Bakker, D.C.E.; DeVries, T.; Gregor, L.; Hauck, J.; Landschützer, P.; McKinley, G.A.; Muller, J.D. Trends and variability in the ocean carbon sink. Nat. Rev. Earth Environ. 2023, 4, 119–134. [Google Scholar] [CrossRef]
- Machado, K.S.; Froehner, S. Changes in atmospheric CO2 levels recorded by the isotopic signature of n-alkanes from plants. Glob. Planet. Chang. 2017, 148, 72–78. [Google Scholar] [CrossRef]
- Keeling, C.D.; Piper, S.C.; Bacastow, R.B.; Wahlen, M.; Whorf, T.P.; Heimann, M.; Meijer, H.A. Exchanges of Atmospheric CO2 and 13CO2 with the Terrestrial Biosphere and Oceans from 1978 to 2000. In Global Aspects; SIO Reference Series; No. 01-06; Scripps Institution of Oceanography: San Diego, CA, USA, 2001; 88p, Available online: https://scrippsco2.ucsd.edu/data/atmospheric_co2/sampling_stations.html (accessed on 21 June 2023).
- Hoffman, D.W.; Rasmussen, C. Absolute carbon stable isotope ratio in the Vienna Peedee Belemnite isotope reference determined by 1H NMR spectroscopy. Anal. Chem. 2022, 94, 5240–5247. [Google Scholar] [CrossRef] [PubMed]
- Kroopnick, P.M. The distribution of 13C of ΣCO2 in the world oceans. Deep-Sea Res. 1985, 32, 57–84. [Google Scholar] [CrossRef]
- Ohmoto, H. Stable isotope geochemistry of ore deposits. Rev. Mineral. 1986, 16, 491–559. [Google Scholar]
- Kozyr, A. Carbon Dioxide, Hydrographic, and Chemical Data Obtained during the R/V Knorr Repeat Hydrography Cruise in the Atlantic Ocean: CLIVAR CO2 Sections A20_2003 (22 September–20 October 2003) and A22_2003 (23 October–13 November, 2003); ORNL/CDIAC-154; NDP-089; Carbon Dioxide Information Analysis Center, Oak Ridge National Laboratory, U.S. Department of Energy: Oak Ridge, TN, USA, 2008.
- NOAA. The Global Conveyor Belt. Available online: https://oceanservice.noaa.gov/education/tutorial_currents/05conveyor2.html (accessed on 21 June 2023).
- O’Leary, M. Carbon isotopes in photosynthesis fractionation techniques may reveal new aspects of carbon dynamics in plants. BioScience 1988, 38, 328–336. [Google Scholar]
- Goericke, R.; Fry, B. Variations of marine plankton fi13C with latitude, temperature, and dissolved CO2 in the world ocean. Glob. Biogeochem. Cycles 1994, 8, 85–90. [Google Scholar] [CrossRef]
- Warwick, P.D.; Ruppert, L.F. Carbon and oxygen isotopic composition of coal and carbon dioxide derived from laboratory coal combustion: A preliminary study. Int. J. Coal Geol. 2016, 166, 128–135. [Google Scholar] [CrossRef]
- Hare, S.R.; Mantua, N.J. Empirical evidence for North Pacific regime shifts in 1977 and 1989. Prog. Ocean. 2000, 47, 103–145. [Google Scholar] [CrossRef]
- Chow, G. Tests of equality between sets of coefficients in two linear regressions. Econometrica 1960, 28, 591–605. [Google Scholar] [CrossRef]
- Earth System Science Center. Global Temperature Report, Monthly Average Data. 2022. Available online: https://www.nsstc.uah.edu/data/msu/v6.0/tlt/uahncdc_lt_6.0.txt (accessed on 21 June 2023).
- Alexander, M.A.; Halimeda, K.; Nye, J.A. Climate variability during warm and cold phases of the Atlantic Multidecadal Oscillation (AMO) 1871–2008. J. Mar. Syst. 2014, 133, 14–26. [Google Scholar] [CrossRef]
- Alheit, J.; Licandro, P.; Coombs, S.; Garcia, A.; Giráldez, A.; Santamaría, M.T.G.; Slotte, A.; Tsikliras, A.C. Atlantic Multi-decadal Oscillation (AMO) modulates dynamics of small pelagic fishes and ecosystem regime shifts in the eastern North and Central Atlantic. J. Mar. Syst. 2014, 131, 21–35. [Google Scholar] [CrossRef]
- Rayner N., A.; Parker, D.E.; Horton, E.B.; Folland, C.K.; Alexander, L.V.; Rowell, D.P.; Kent, E.C.; Kaplan, A. Global analyses of sea surface temperature, sea ice, and night marine air temperature since the late nineteenth century. J. Geophys. Res. 2003, 108, 4407. [Google Scholar] [CrossRef]
- Holzer, M.; DeVries, T. Source-labeled anthropogenic carbon reveals a large shift of preindustrial carbon from the ocean to the atmosphere. Glob. Biogeochem. Cycles 2022, 36, e2022GB007405. [Google Scholar] [CrossRef]
Figure 1.
Monthly atmospheric CO2 at the South Pole 90° S, Christmas Island 2° N and Point Barrow 71° N, for 1978 to 2015. (a) CO2 concentration in ppm. (b) CO2 isotopic composition δ13C ‰.
Figure 1.
Monthly atmospheric CO2 at the South Pole 90° S, Christmas Island 2° N and Point Barrow 71° N, for 1978 to 2015. (a) CO2 concentration in ppm. (b) CO2 isotopic composition δ13C ‰.
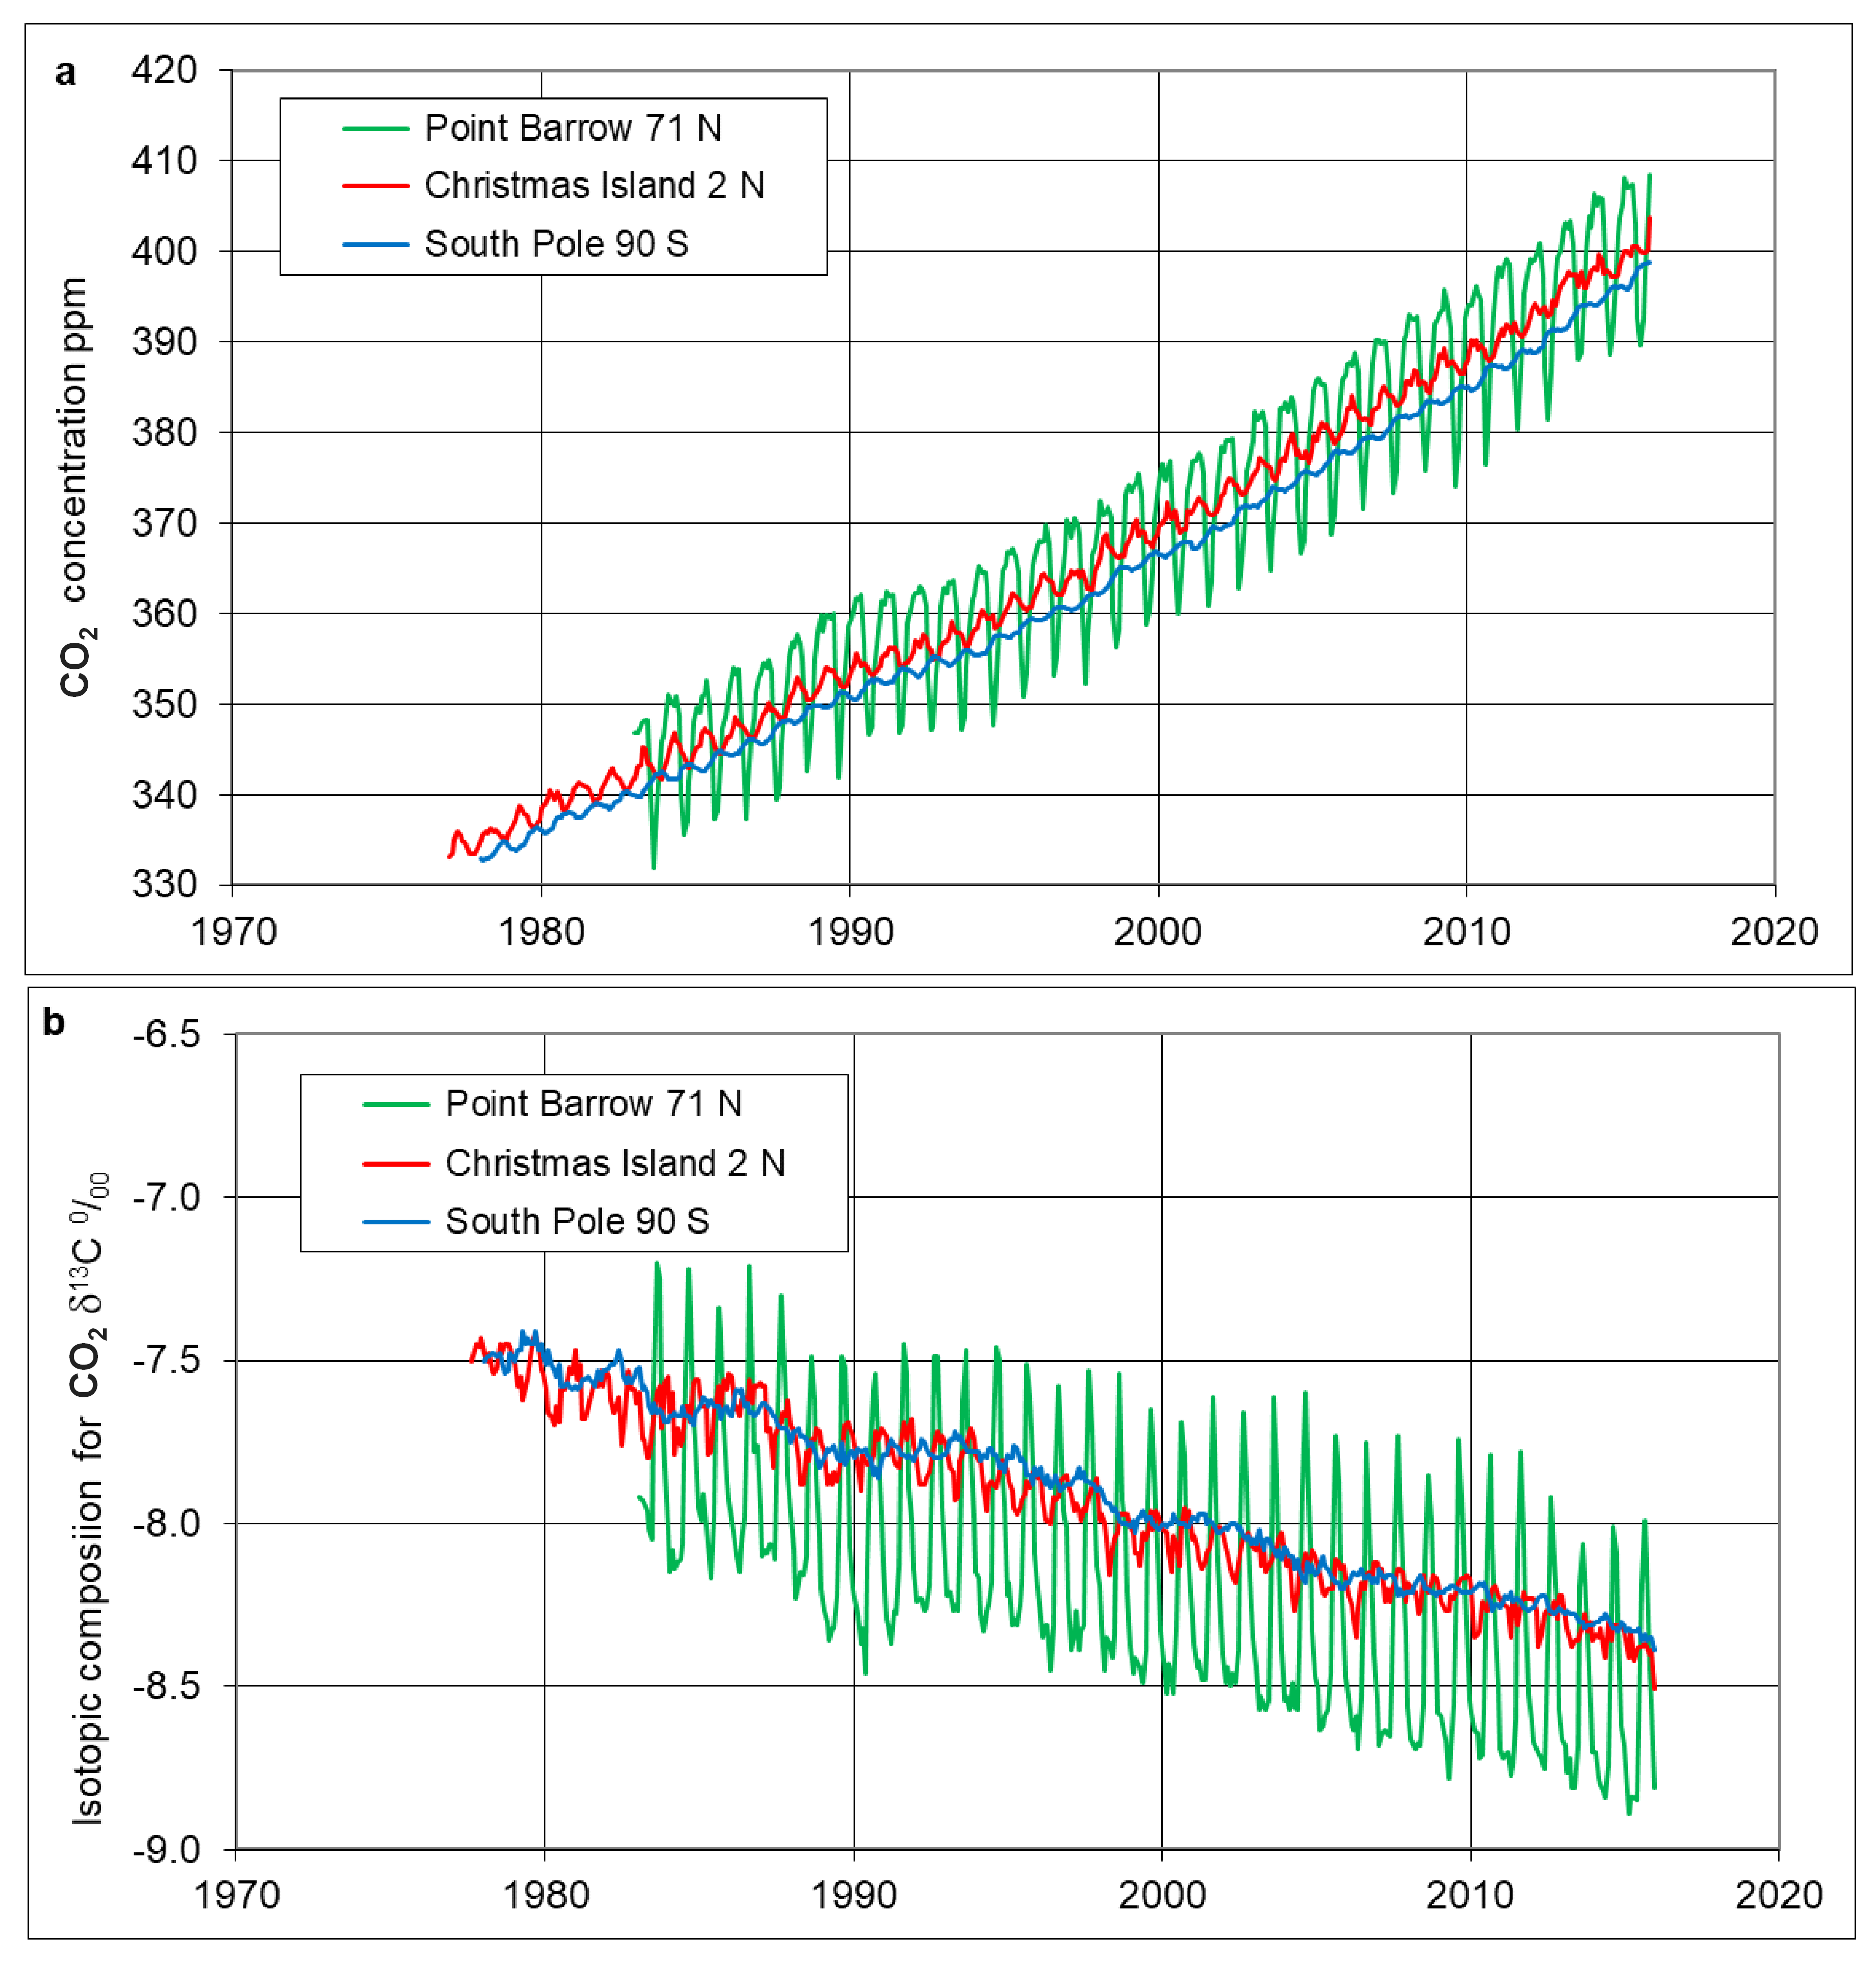
Figure 2.
Monthly ocean component CO2 concentrations at the South Pole, Christmas Island and Point Barrow for 1978 to 2015.
Figure 2.
Monthly ocean component CO2 concentrations at the South Pole, Christmas Island and Point Barrow for 1978 to 2015.
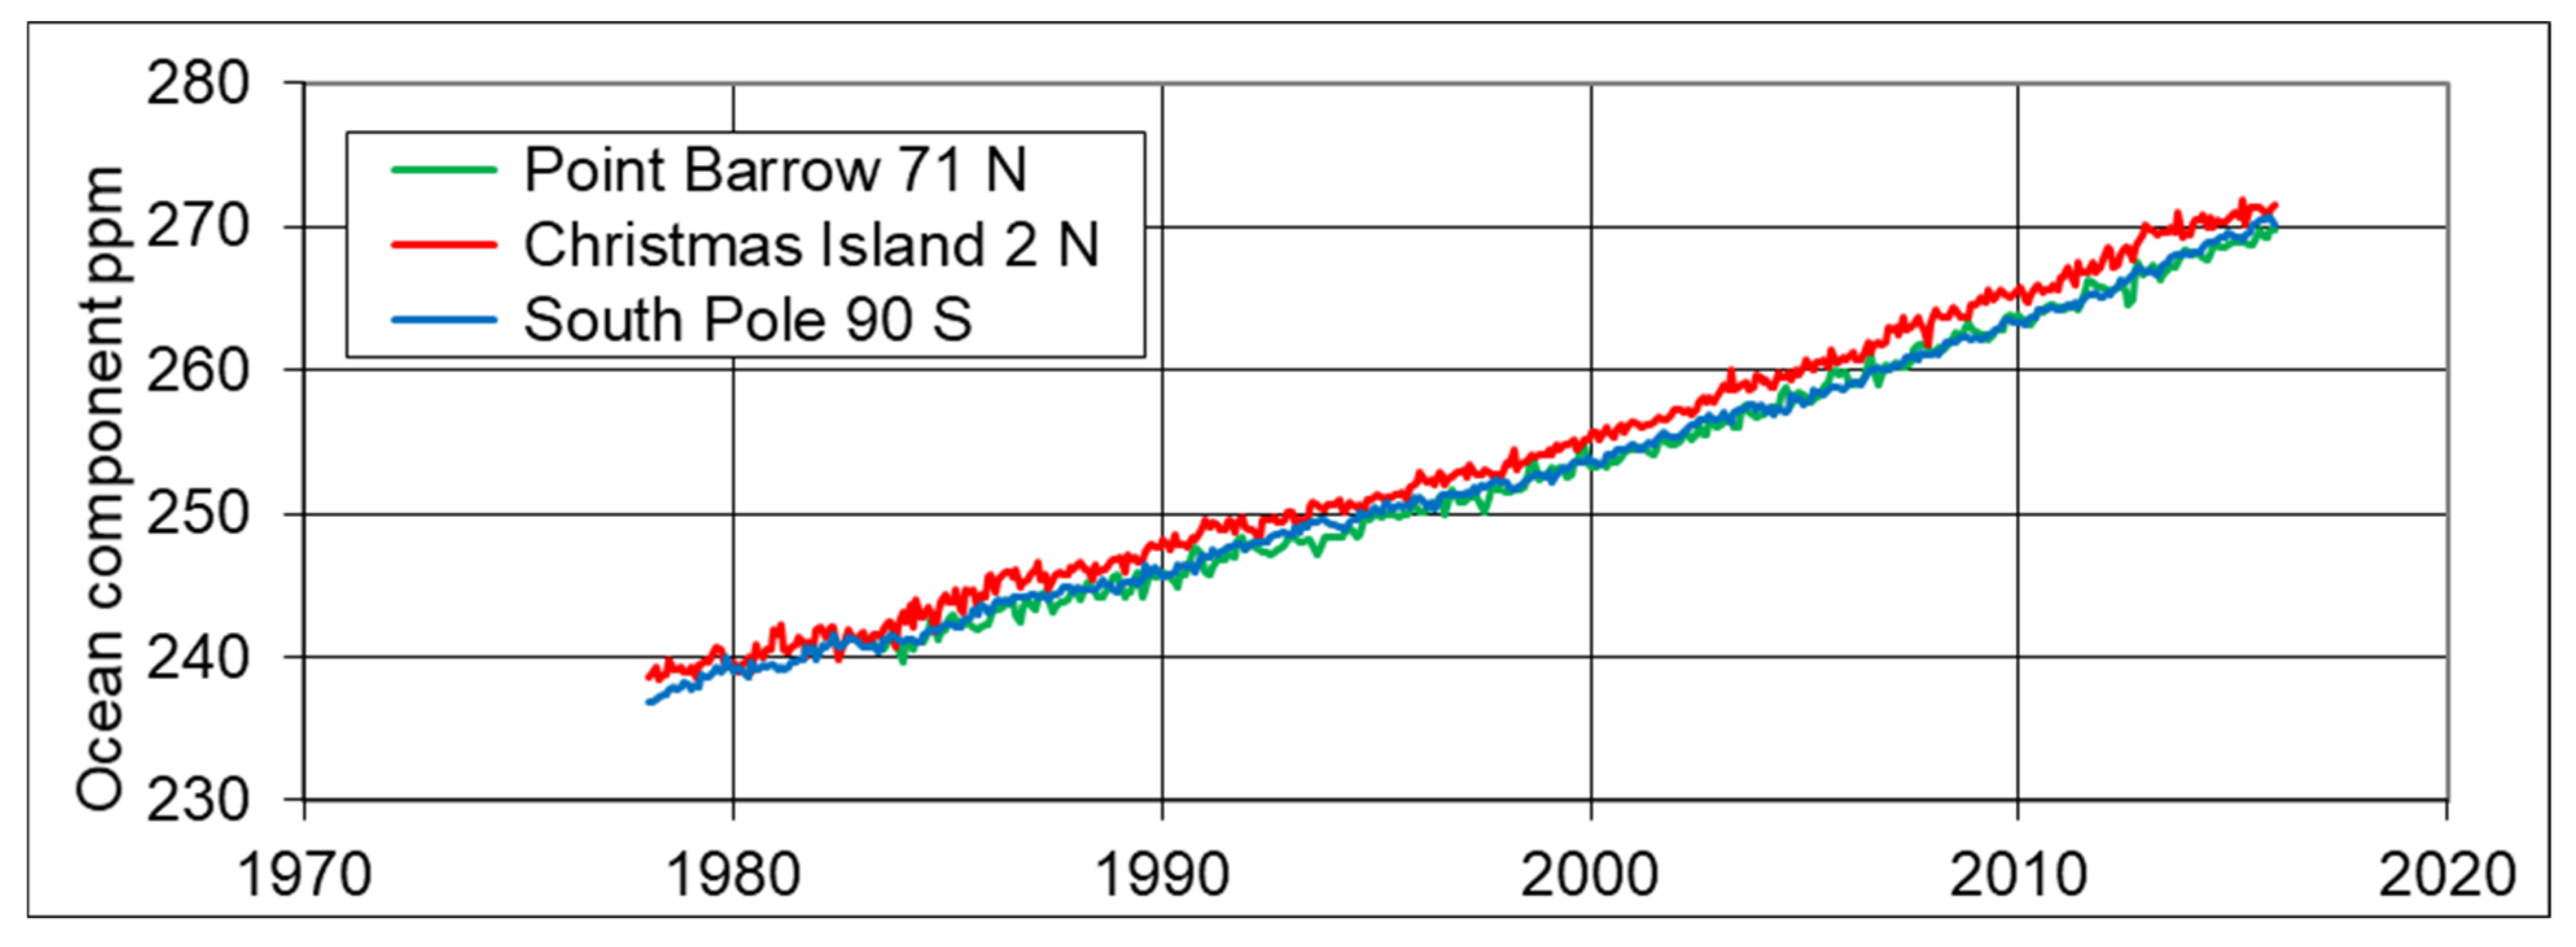
Figure 3.
Monthly plant component CO2 concentrations at the South Pole, Christmas Island and Point Barrow for 1978 to 2015. An increase is evident around 1989 (the “bubble”).
Figure 3.
Monthly plant component CO2 concentrations at the South Pole, Christmas Island and Point Barrow for 1978 to 2015. An increase is evident around 1989 (the “bubble”).
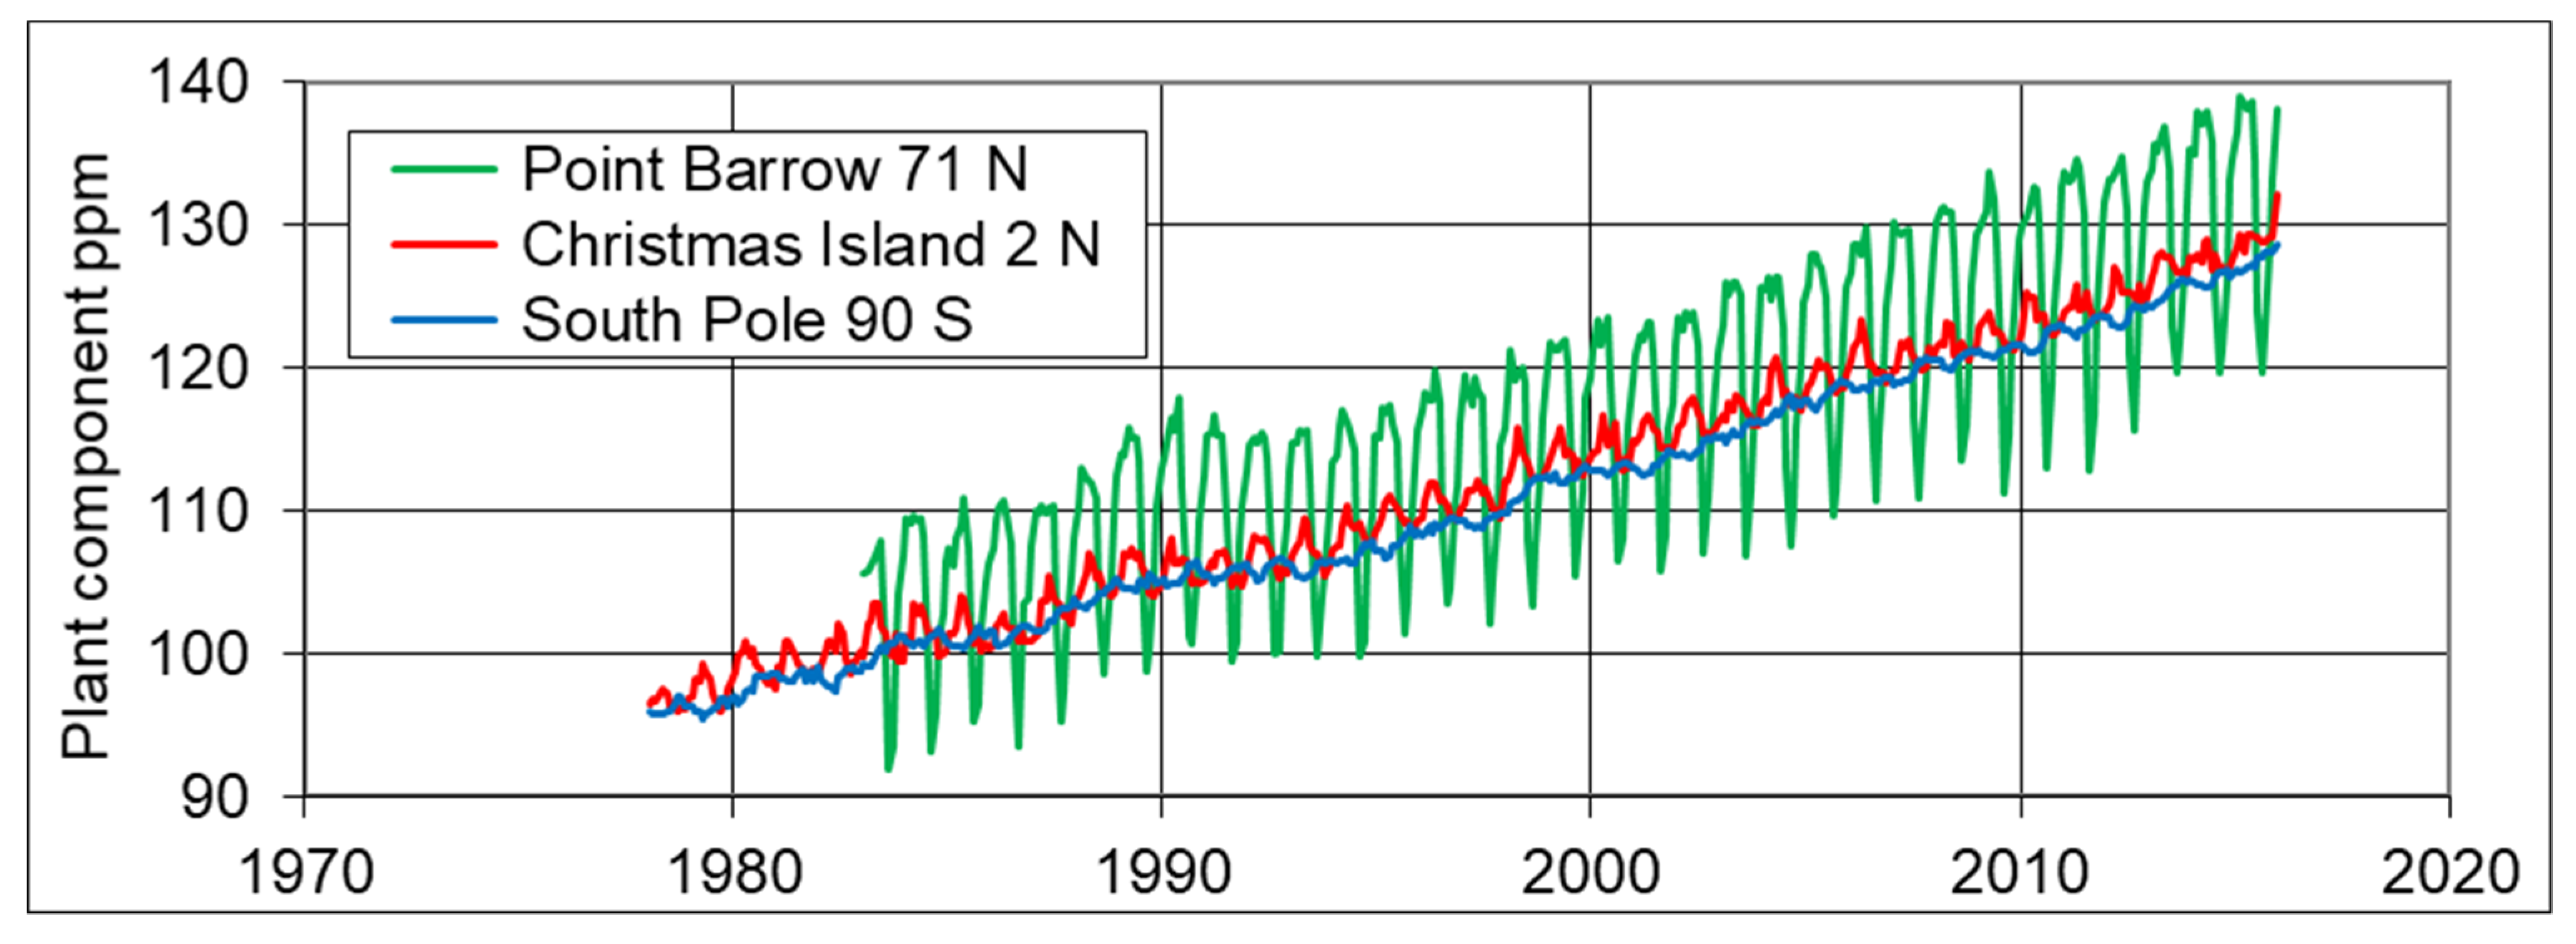
Figure 4.
Residual annual variations in total CO2 less the value at the South Pole, averaged for 1986 to 2015, for each of the ten stations listed in Table 1. Black vertical bars show standard deviations associated with blue data points.
Figure 4.
Residual annual variations in total CO2 less the value at the South Pole, averaged for 1986 to 2015, for each of the ten stations listed in Table 1. Black vertical bars show standard deviations associated with blue data points.
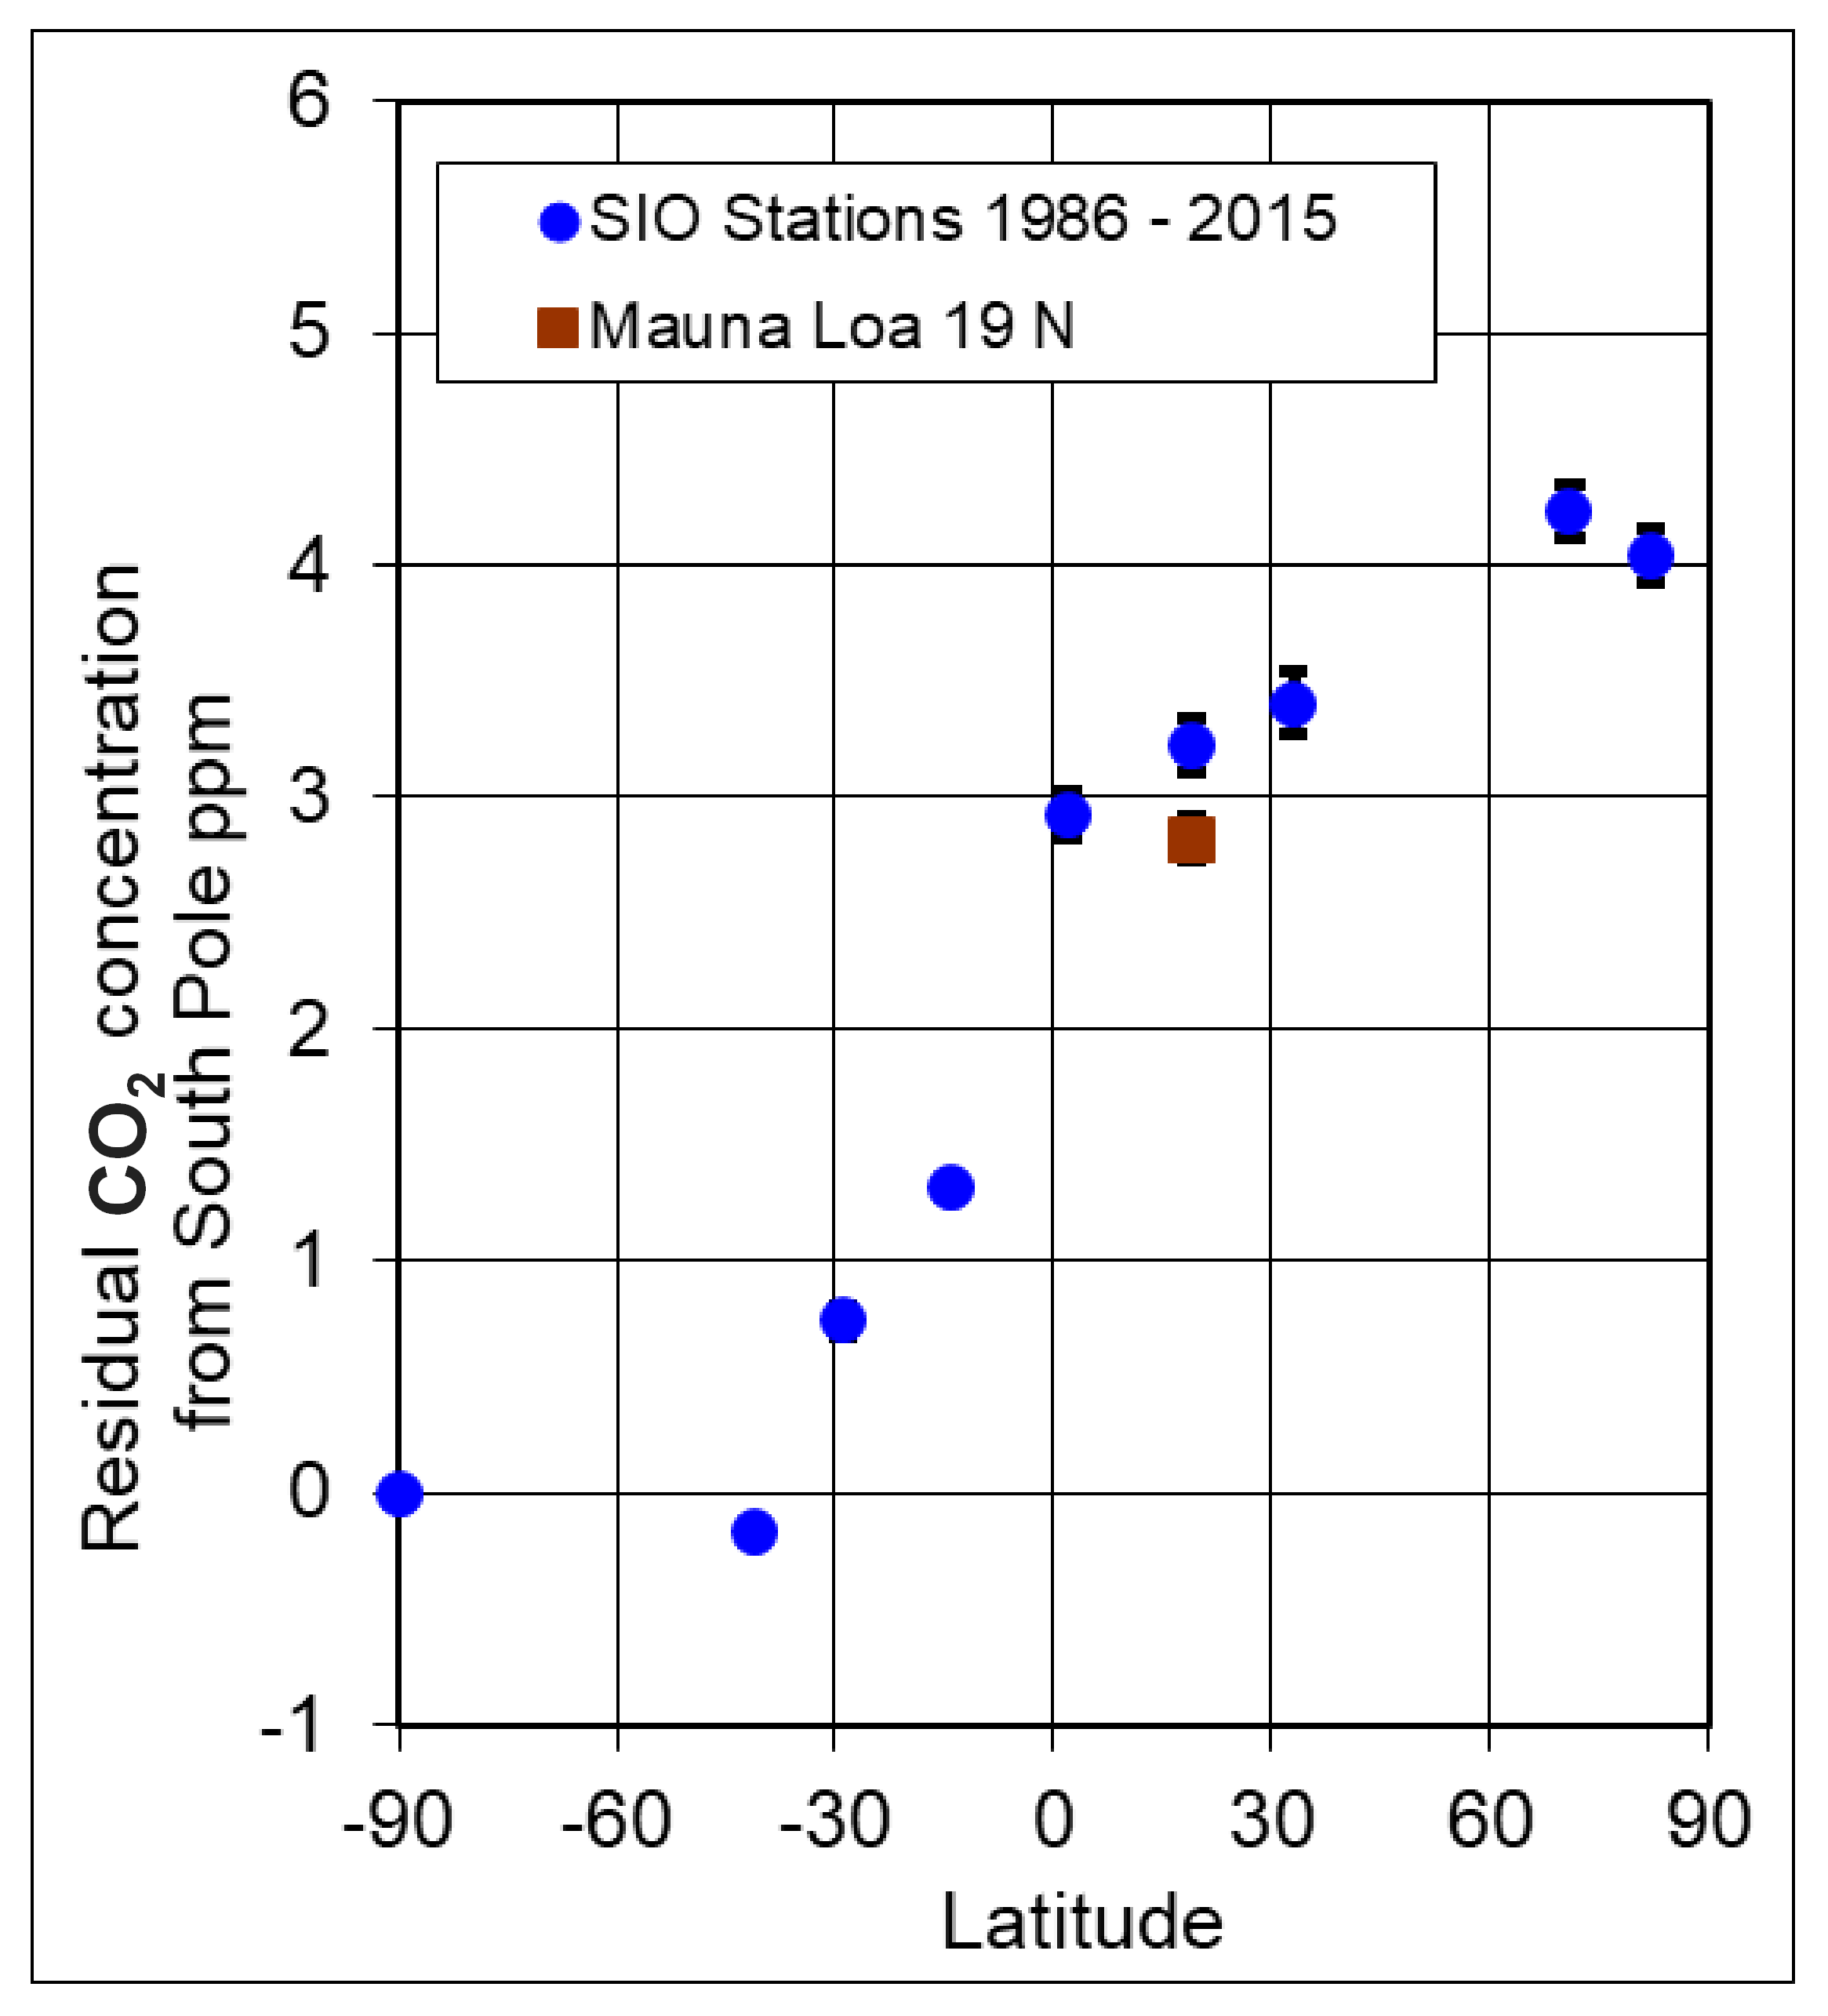
Figure 5.
Residual annual variations in CO2 source components, less the value at the South Pole, averaged for 1986 to 2015. (a) The ocean component and (b) the plant component.
Figure 5.
Residual annual variations in CO2 source components, less the value at the South Pole, averaged for 1986 to 2015. (a) The ocean component and (b) the plant component.

Figure 6.
Residual seasonal variations in CO2 source components, less the value at the South Pole, averaged for 1986 to 2015. (a) Ocean source for end boreal winter, average of February and March (b) plant source for end boreal winter, (c) ocean source for end boreal summer, average of August and September and (d) plant source for end boreal summer.

Figure 7.
Seasonal differences for end boreal winter less end boreal summer. Black vertical bars show standard deviations associated with blue data points. (a) The residual ocean component and (b) the residual plant component.
Figure 7.
Seasonal differences for end boreal winter less end boreal summer. Black vertical bars show standard deviations associated with blue data points. (a) The residual ocean component and (b) the residual plant component.
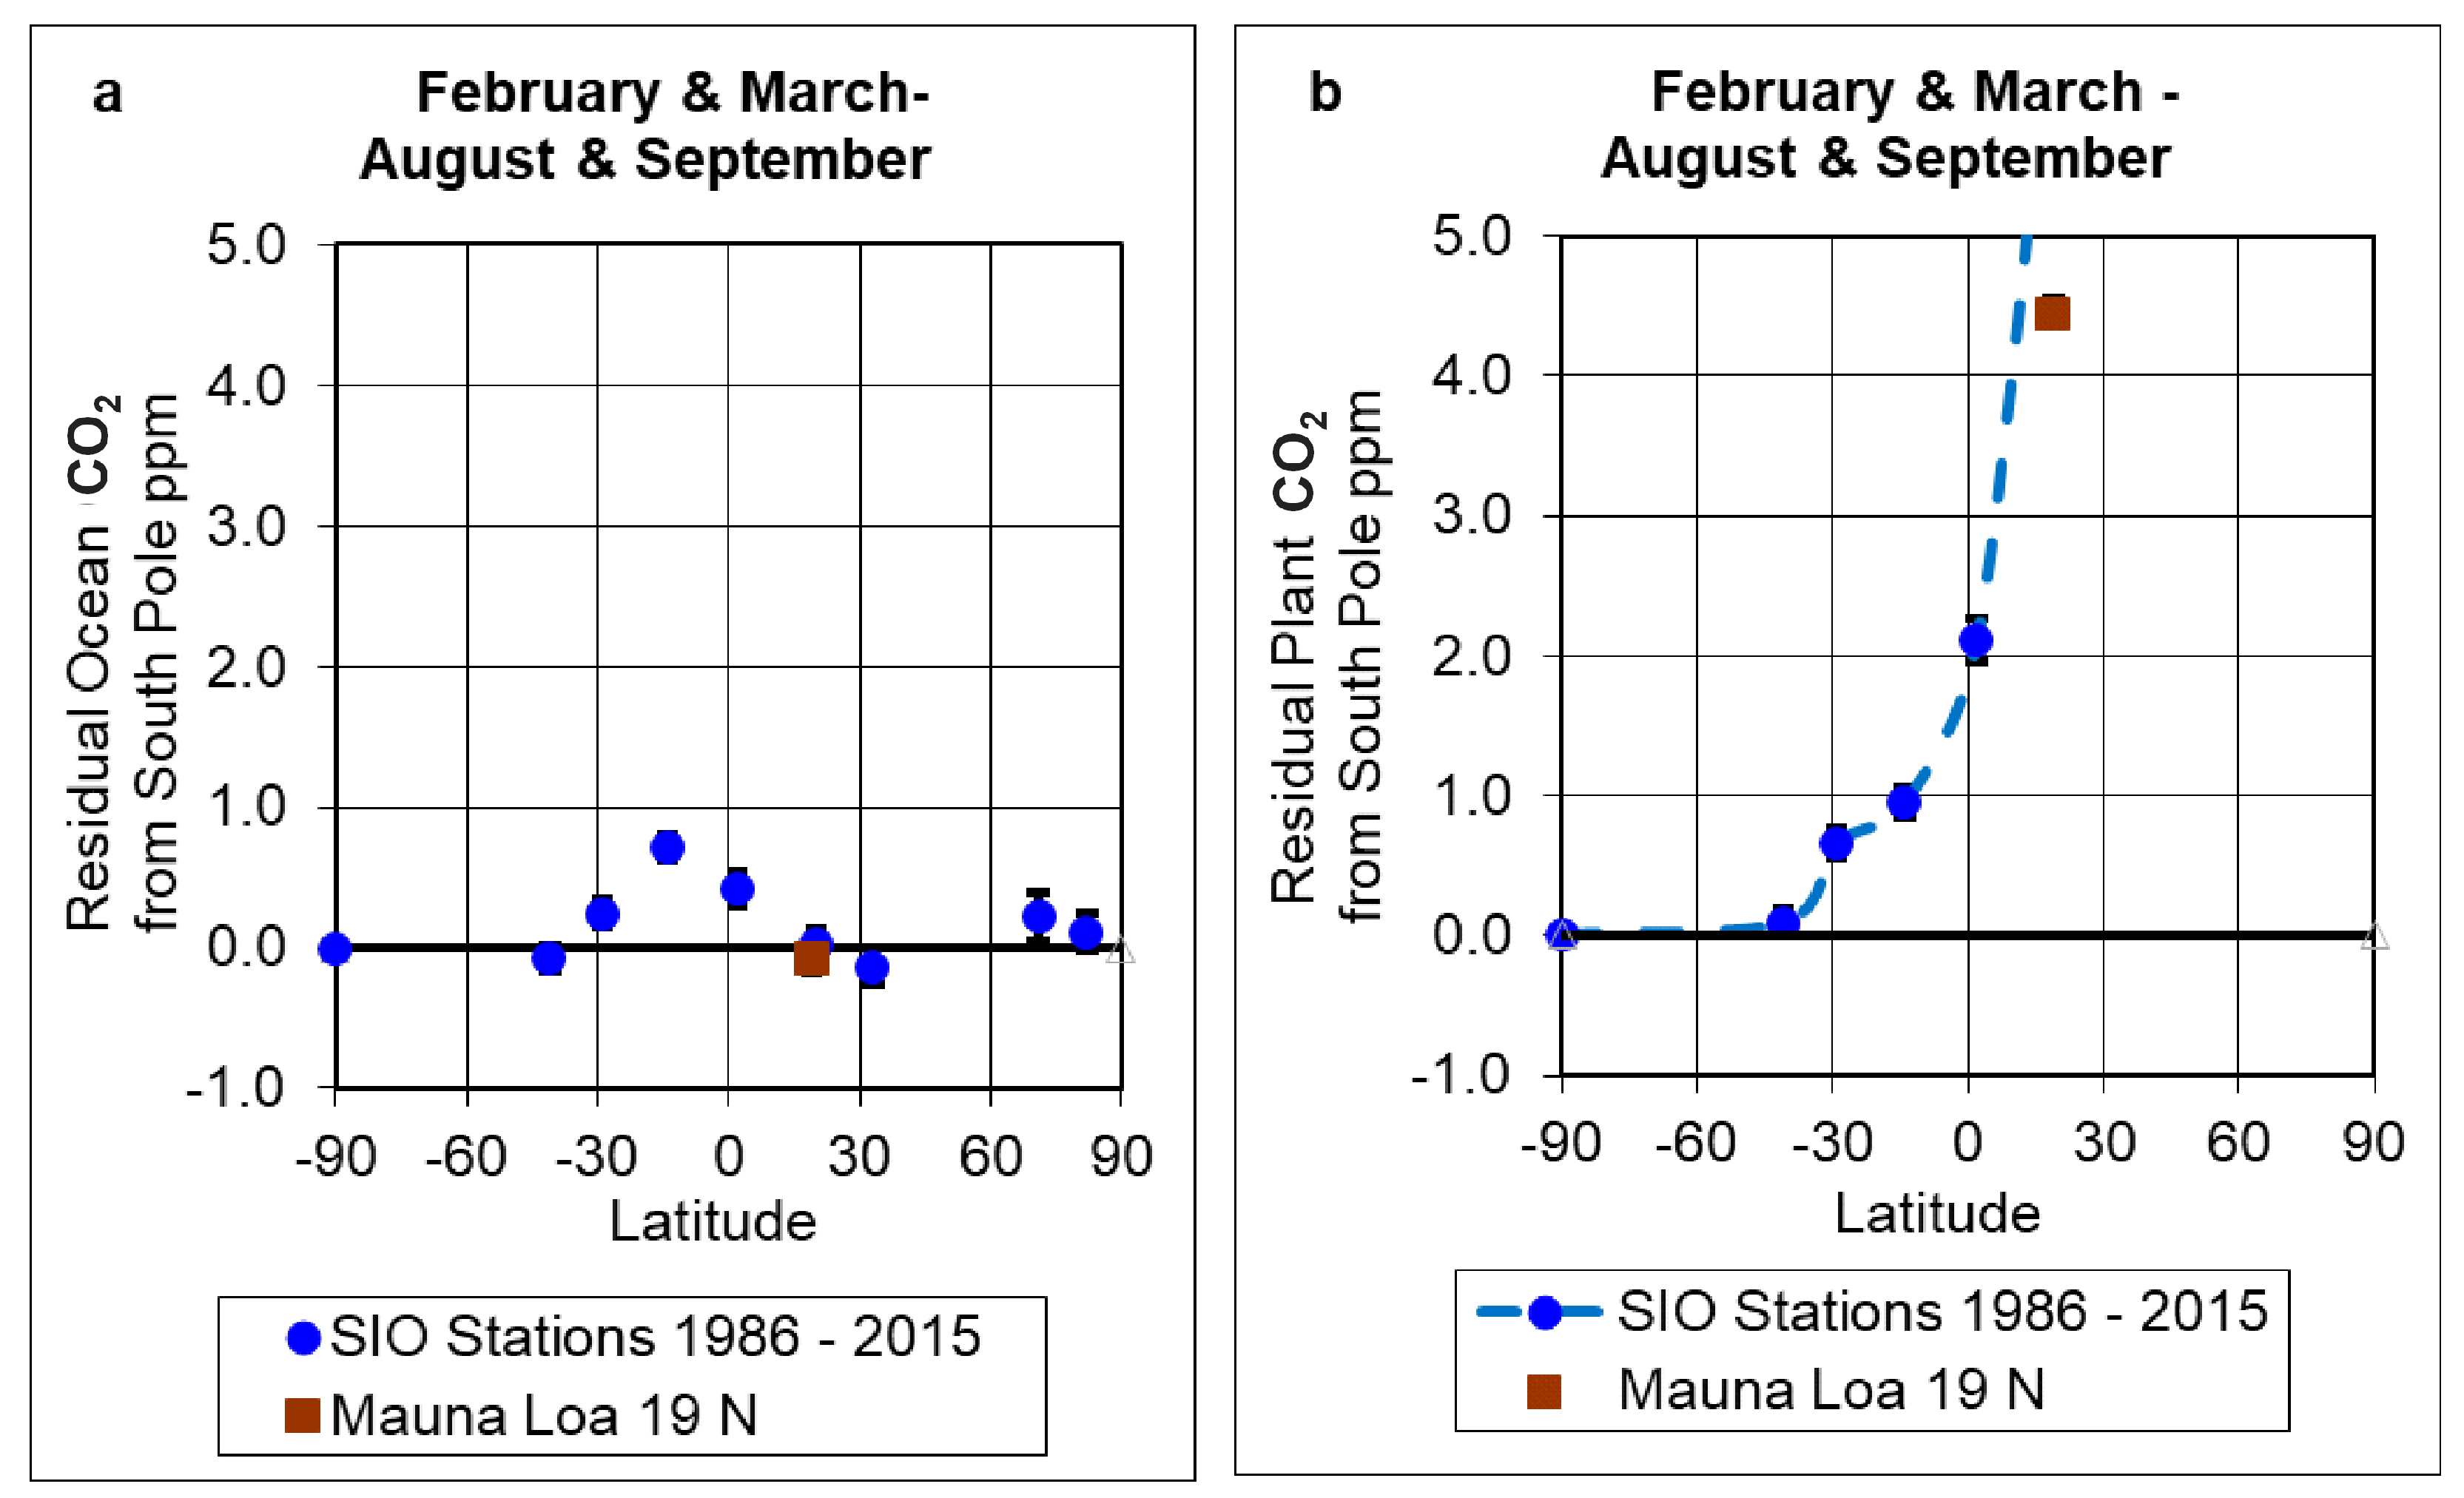
Figure 8.
Sensitivity of computed residual annual variations in CO2 source components, less the value at the South Pole, averaged for 1986 to 2015. (a) Residual ocean component using δ13Cocean = 0‰ (as for Figure 5a), plus computed values where δ13Cocean is perturbed by ±2. (b) Residual ocean component using δ13Cplant = −26‰, and also perturbed by ±2. (c) Residual plant component using δ13Cocean = 0 (as for Figure 5b), plus computed values where the δ13Cocean value of 0‰ is perturbed by ±2. (d) Residual plant component using the value δ13Cplant = −26‰, and also perturbed by ±2.
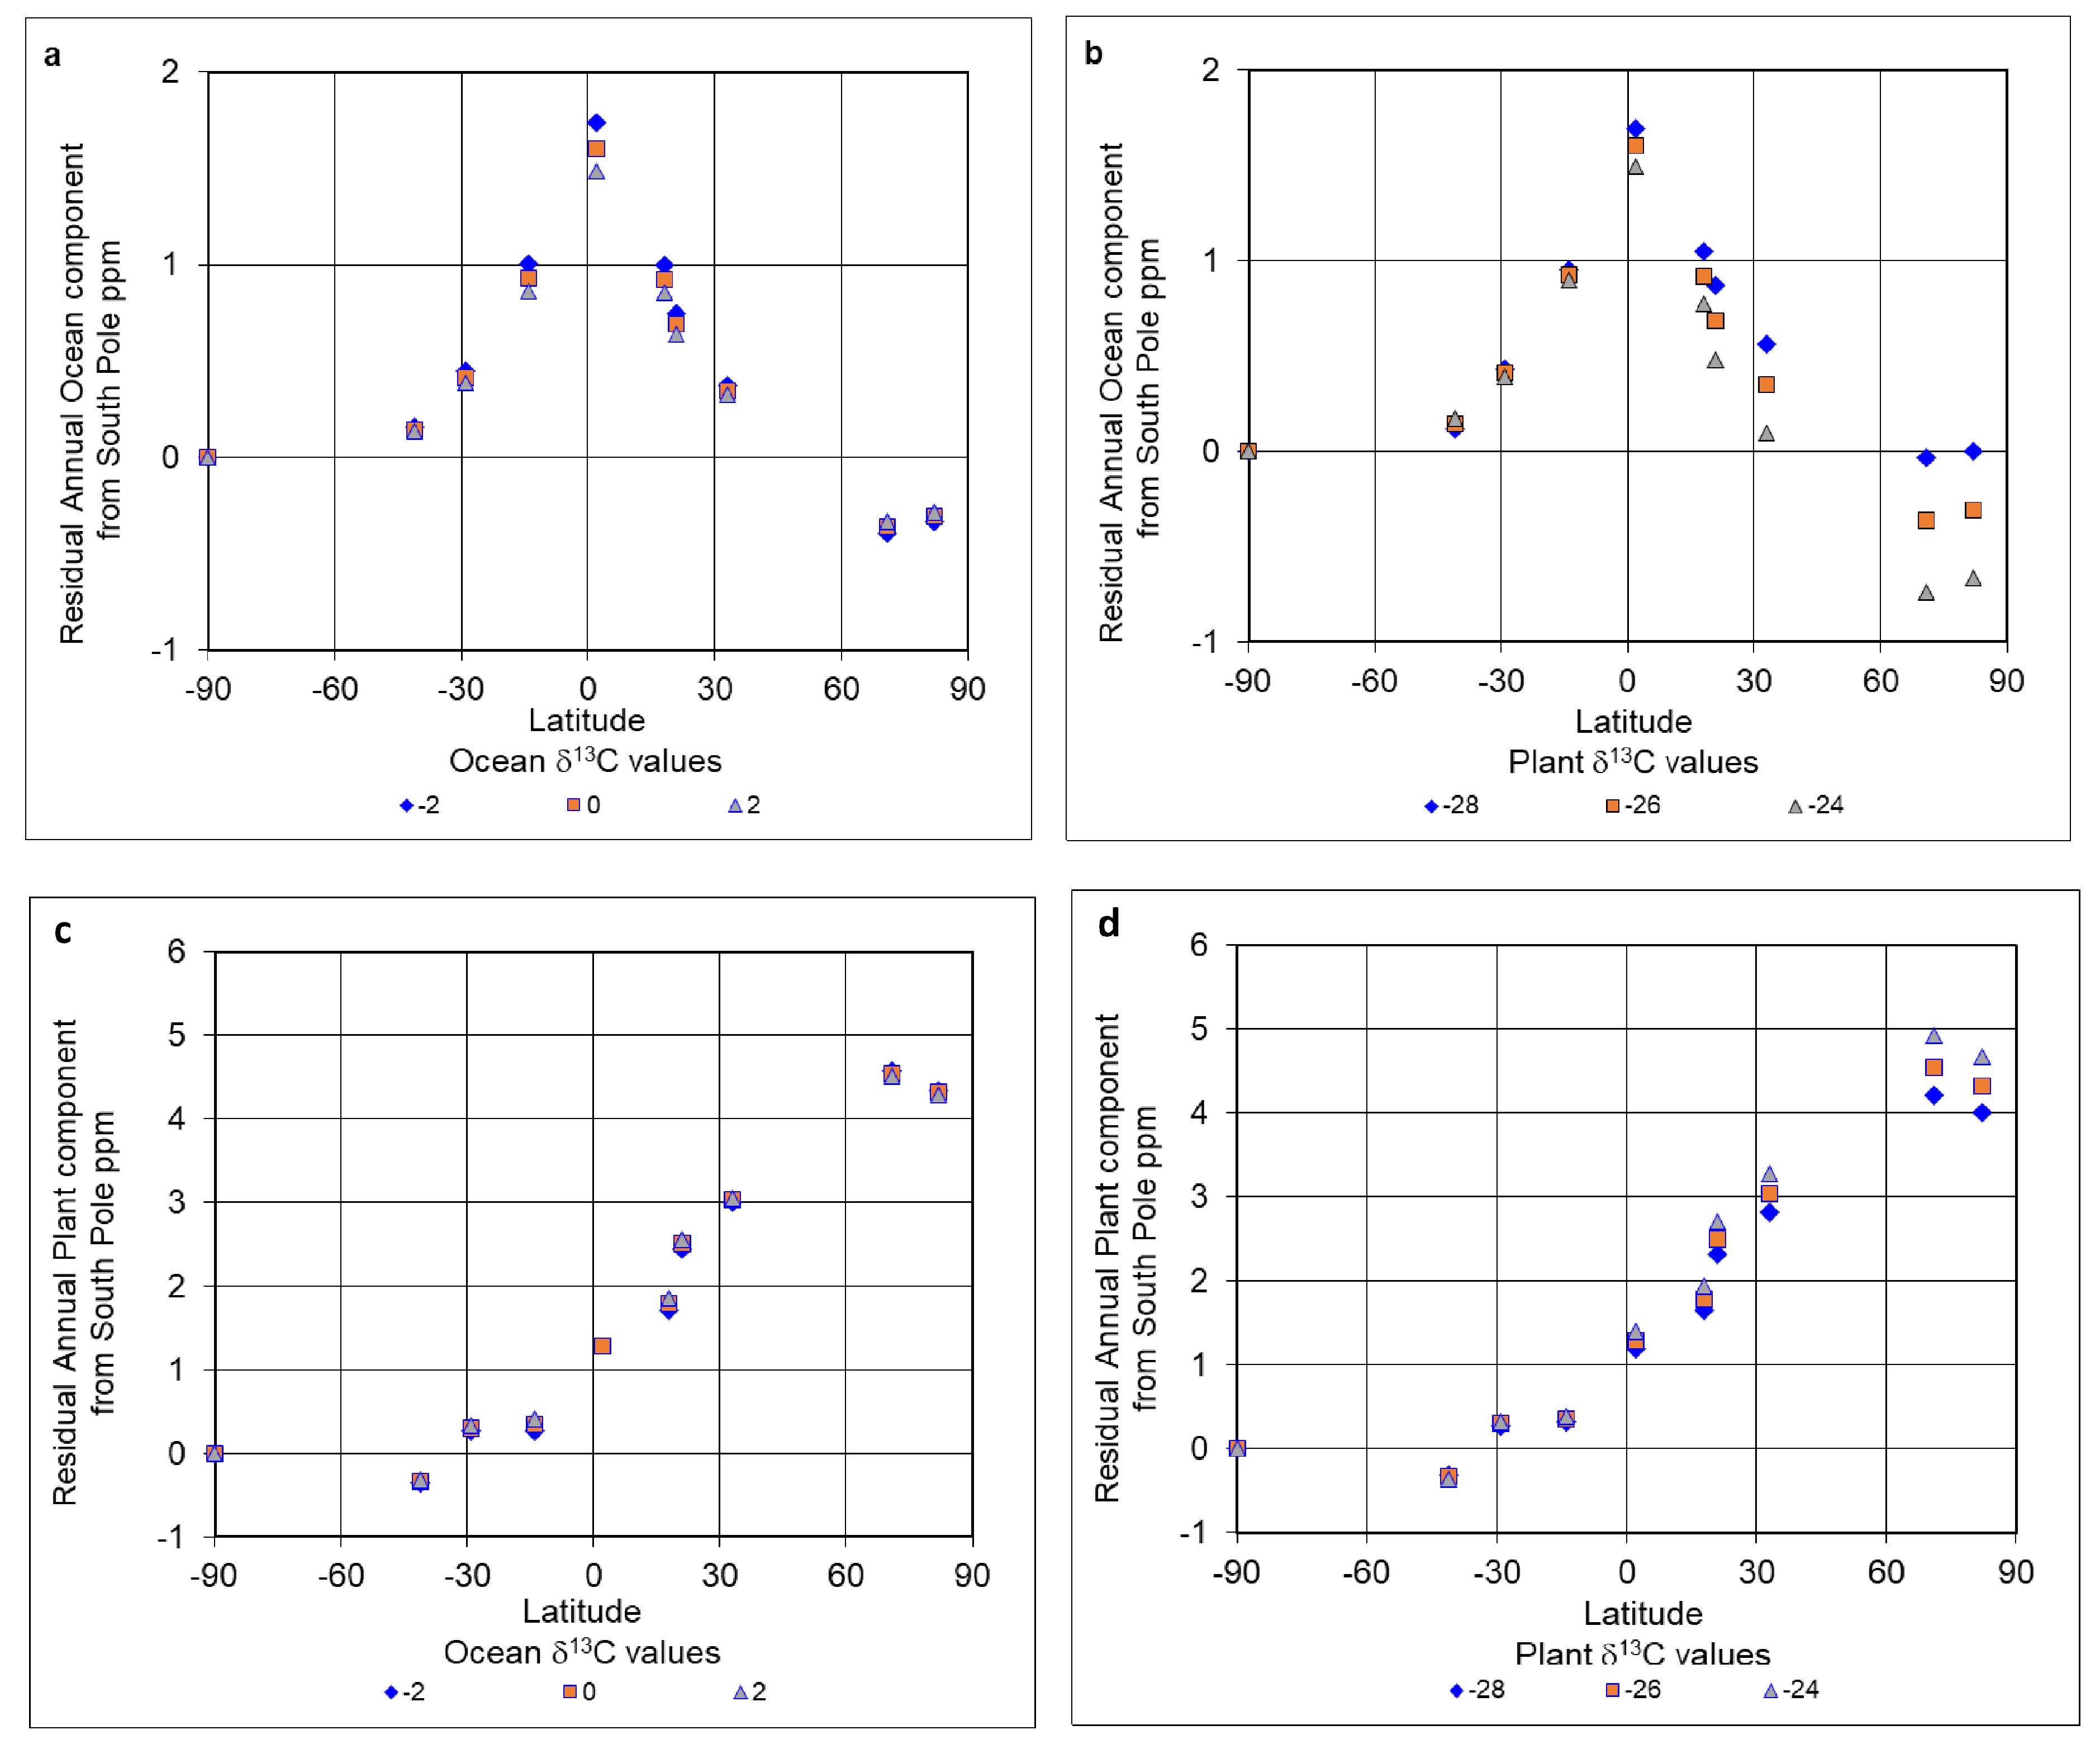
Figure 9.
Annually averaged CO2 measurements for the South Pole, Christmas Island, Mauna Loa and Point Barrow.
Figure 9.
Annually averaged CO2 measurements for the South Pole, Christmas Island, Mauna Loa and Point Barrow.
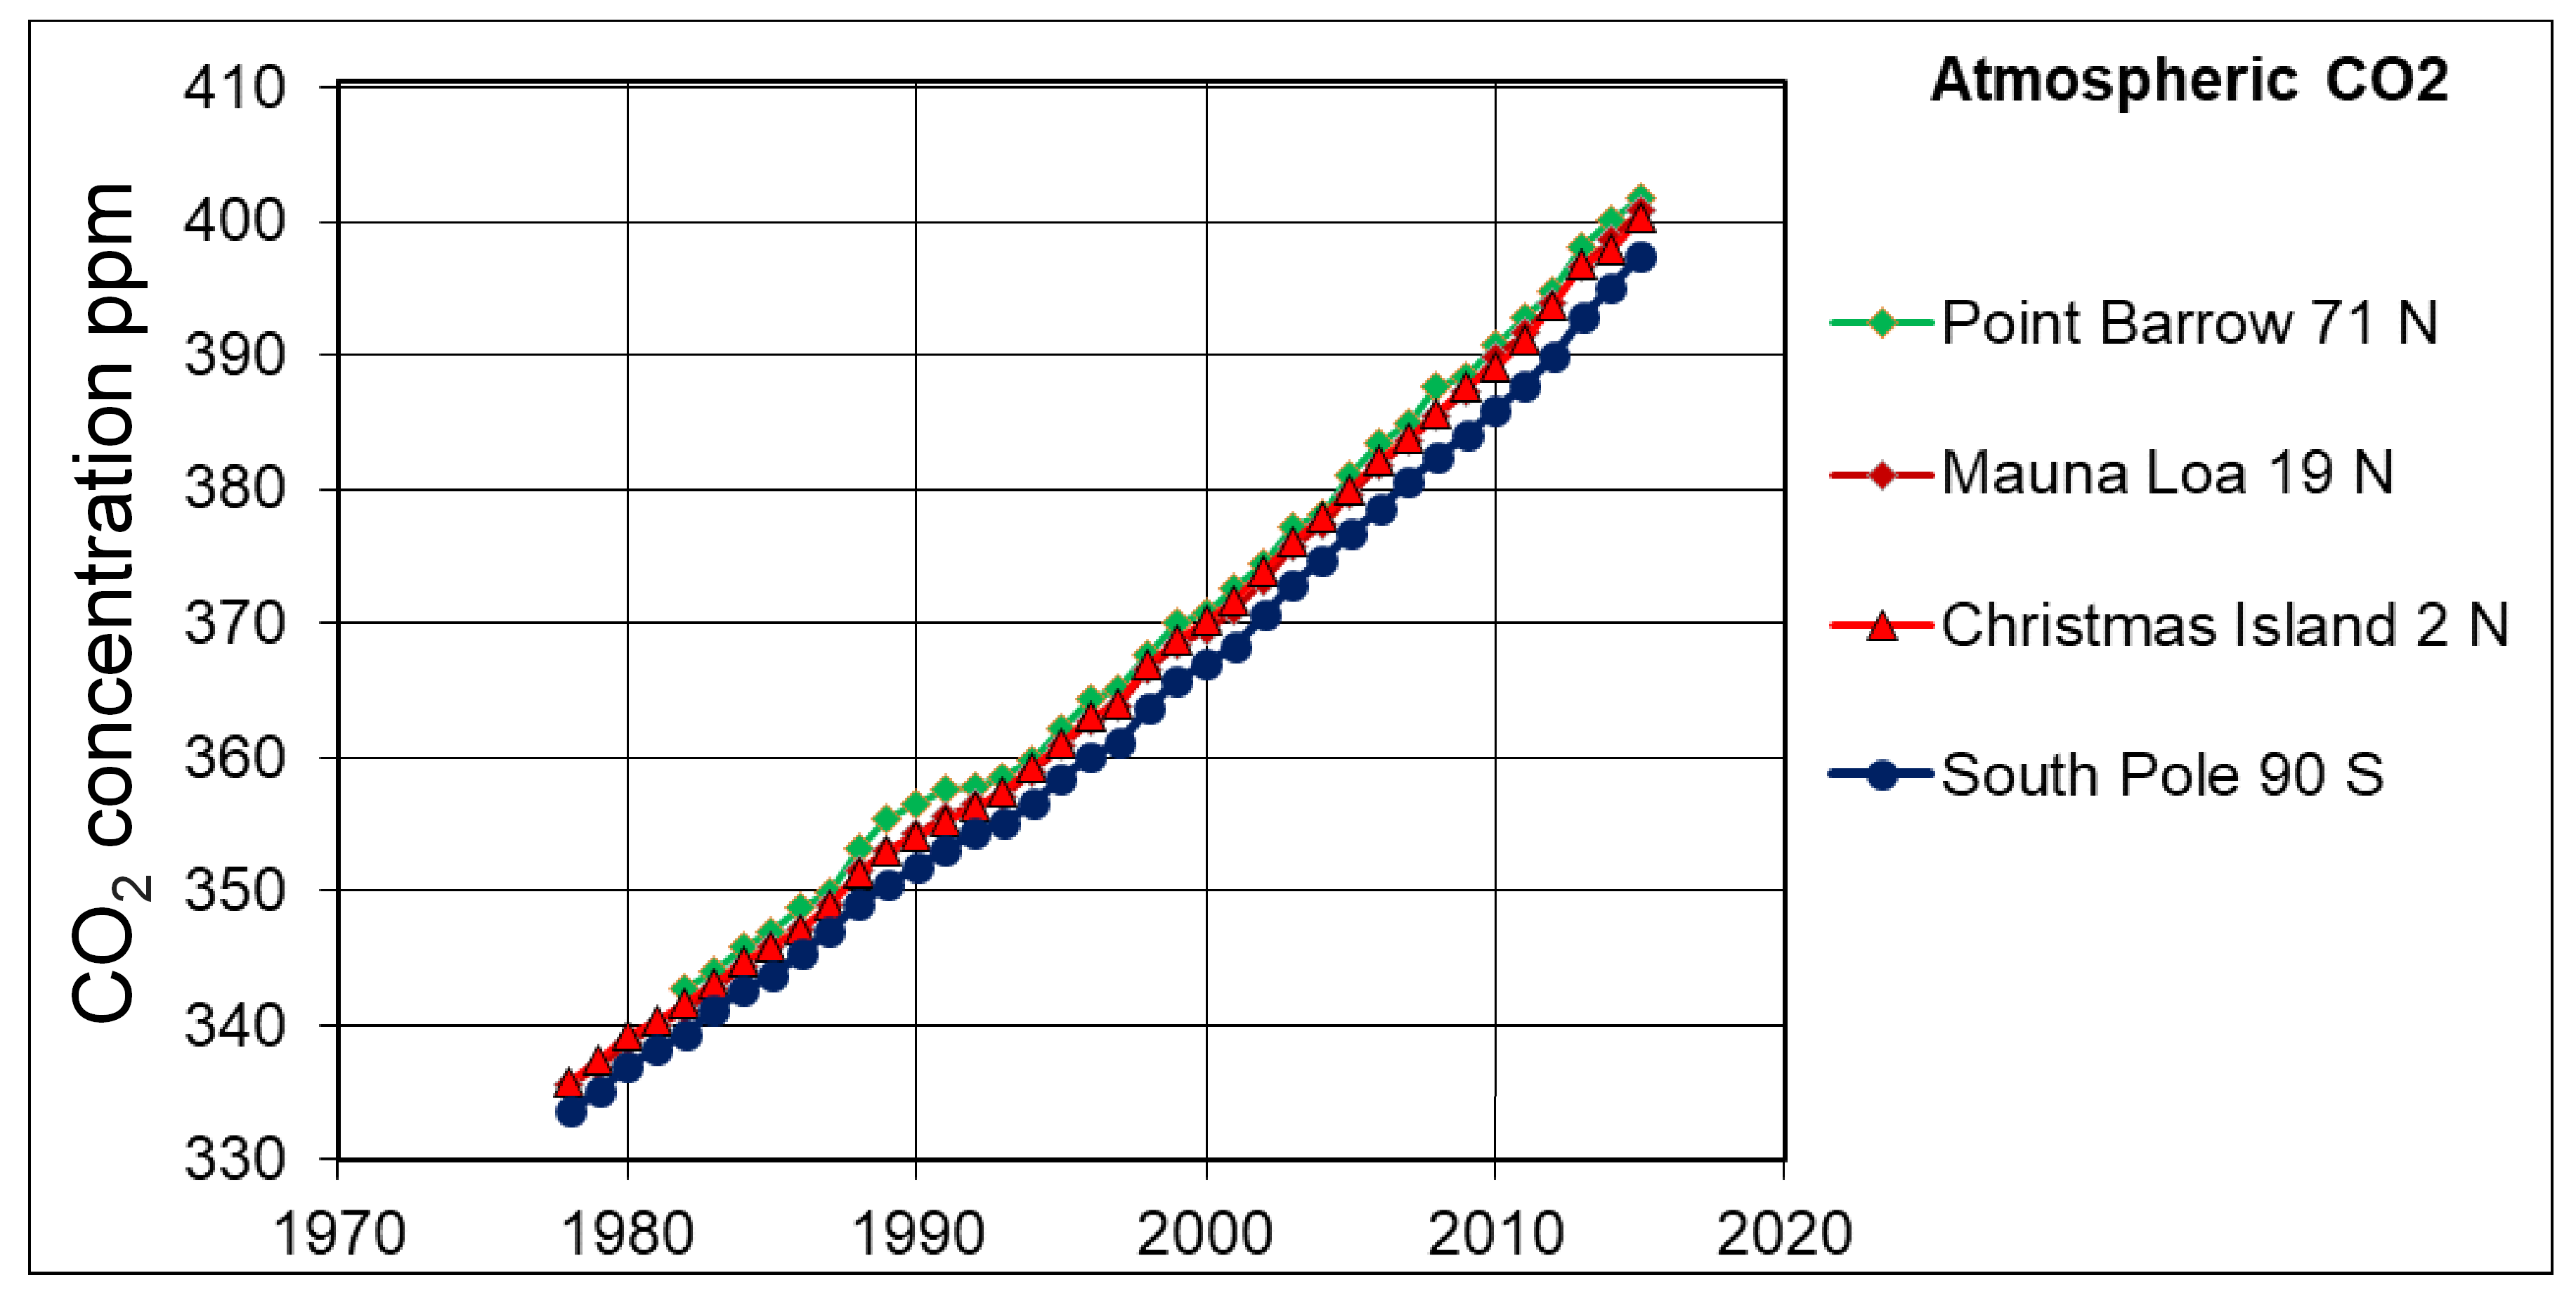
Figure 10.
Ocean component values obtained from annually averaged CO2 observations for the South Pole, Christmas Island, Mauna Loa and Point Barrow. Note the straight-line fit (black line) for the South Pole from 1979 to 2000, which is projected to 2015.
Figure 10.
Ocean component values obtained from annually averaged CO2 observations for the South Pole, Christmas Island, Mauna Loa and Point Barrow. Note the straight-line fit (black line) for the South Pole from 1979 to 2000, which is projected to 2015.

Figure 11.
Annual increases in ocean component CO2, averaged for all stations. The increase is 0.73 ppm per year for 1986 to 2000 and 1.07 ppm per year for 2002 to 2015.
Figure 11.
Annual increases in ocean component CO2, averaged for all stations. The increase is 0.73 ppm per year for 1986 to 2000 and 1.07 ppm per year for 2002 to 2015.
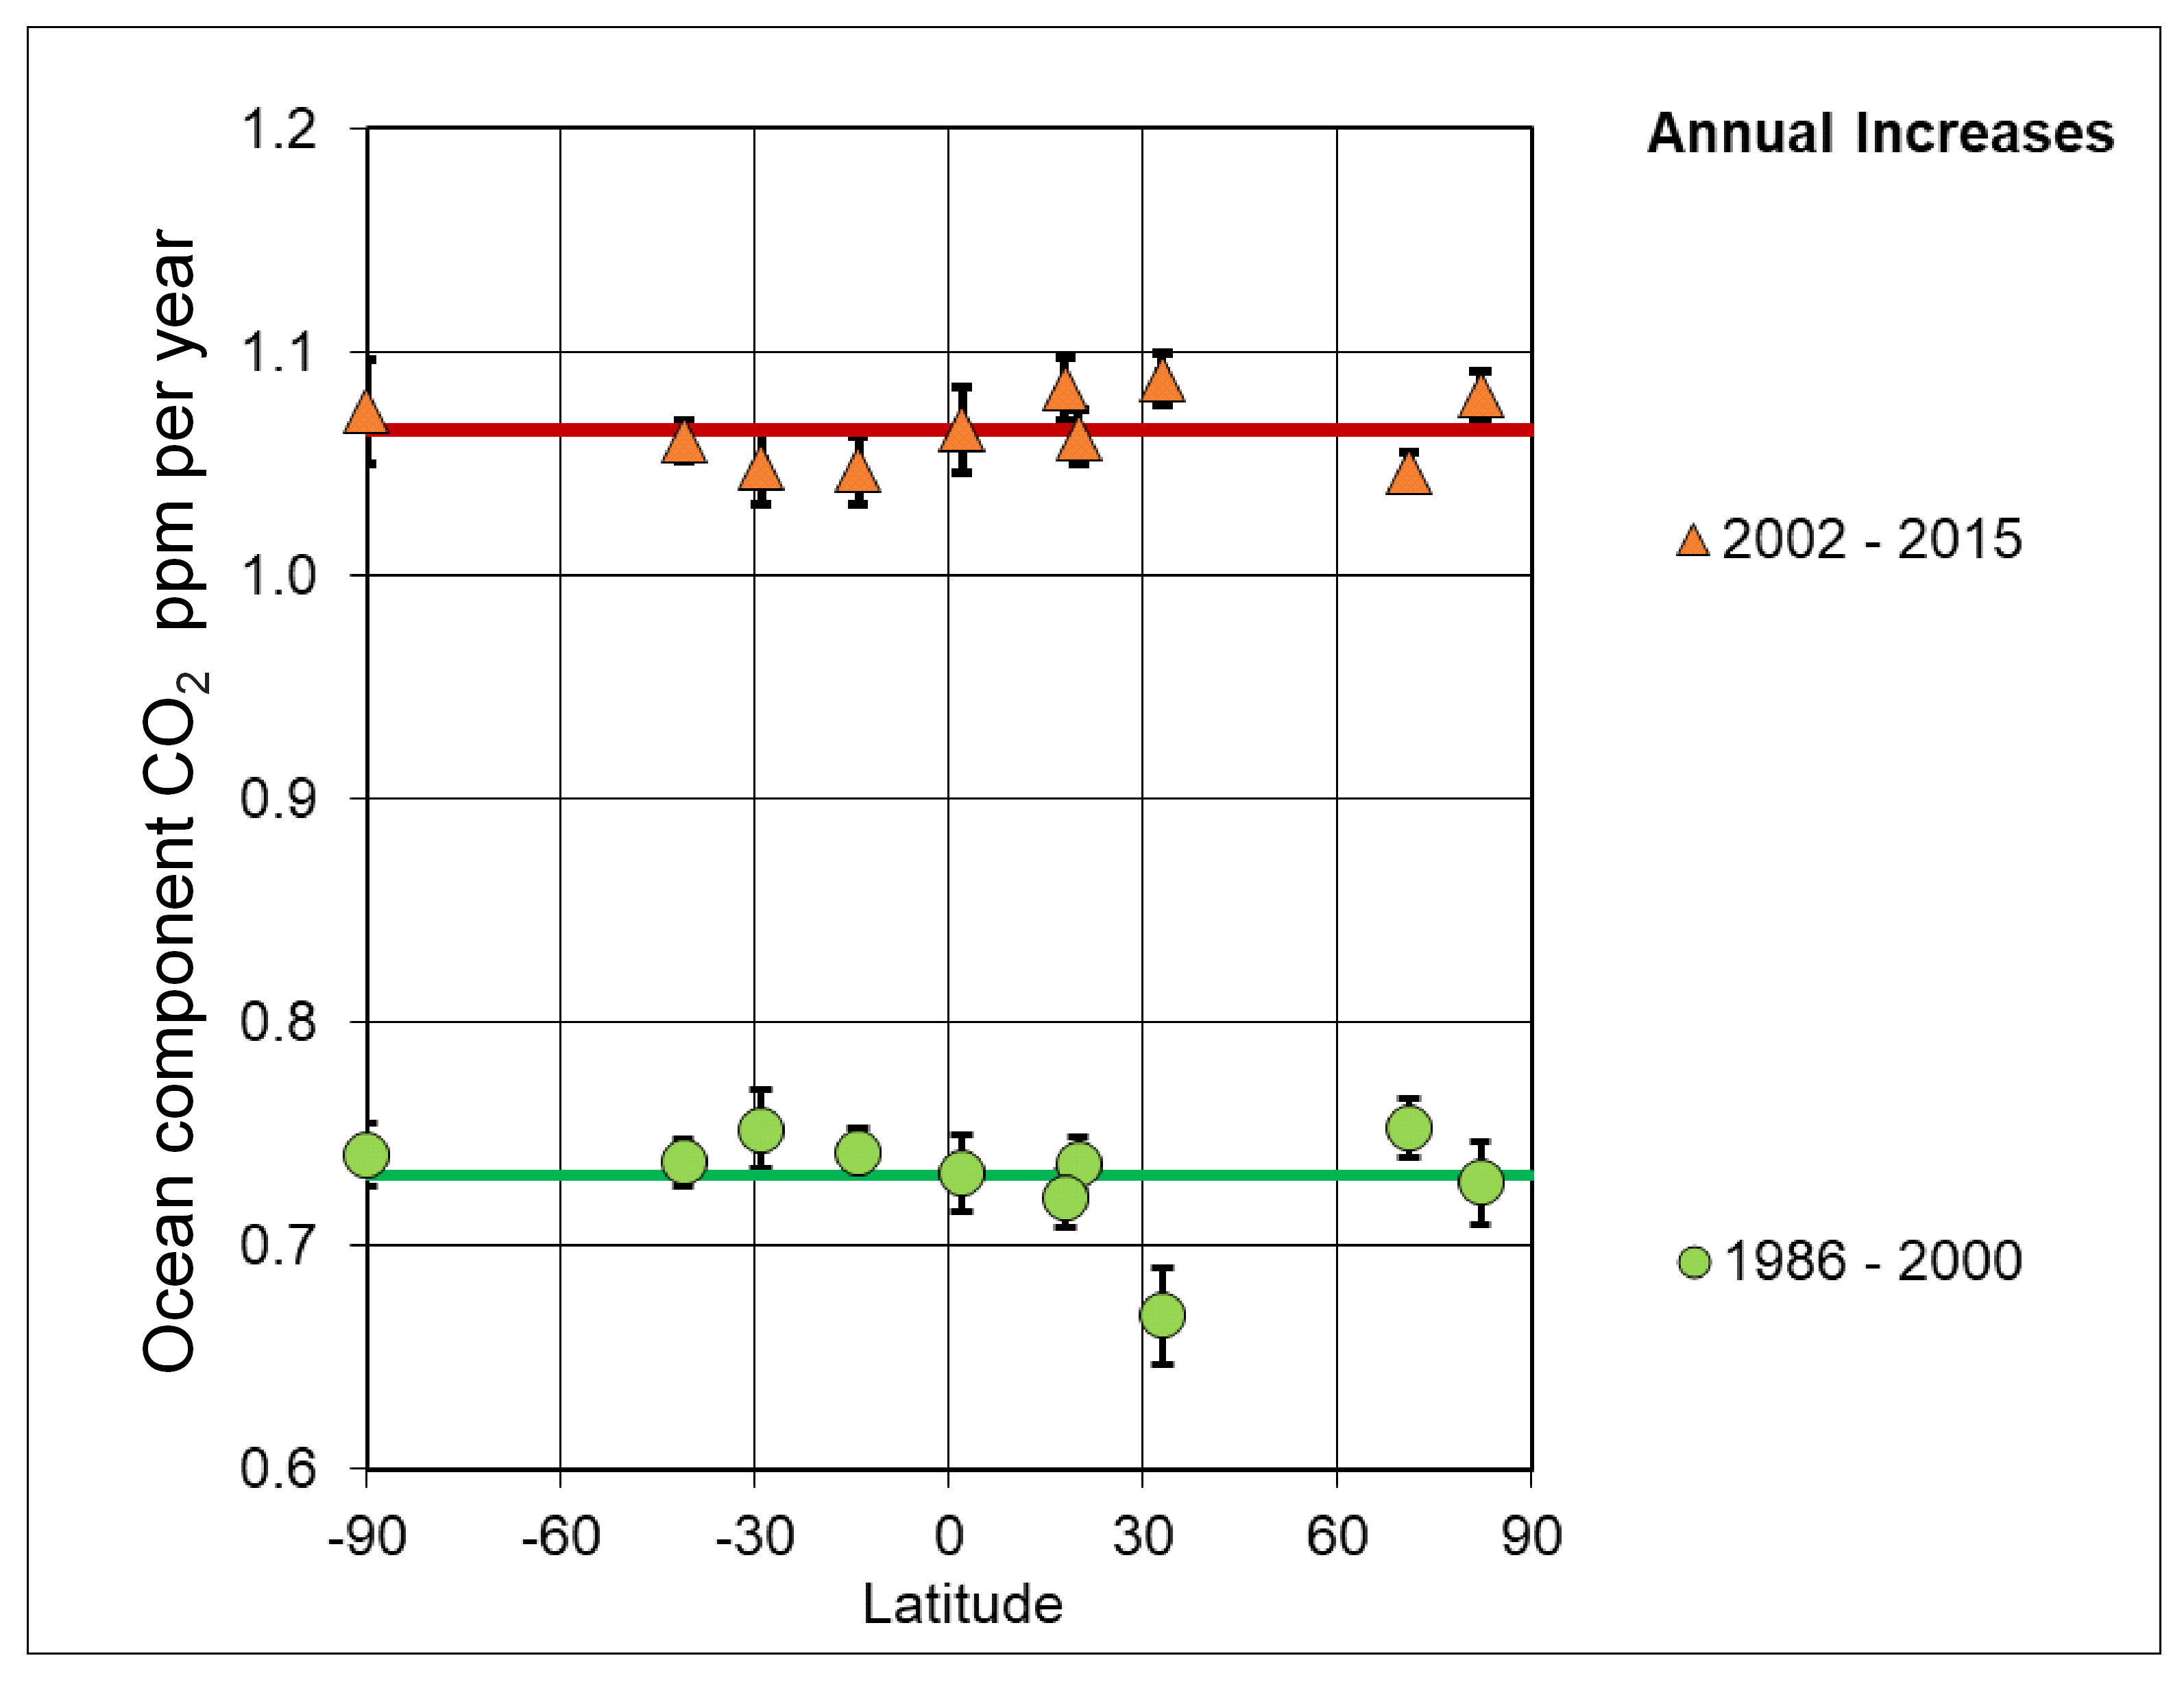
Figure 12.
Global lower troposphere anomaly from UAH satellite measurements [17]. Solid straight lines are least-squares fits for 1979 to 2000 and 2001 to 2015.
Figure 12.
Global lower troposphere anomaly from UAH satellite measurements [17]. Solid straight lines are least-squares fits for 1979 to 2000 and 2001 to 2015.
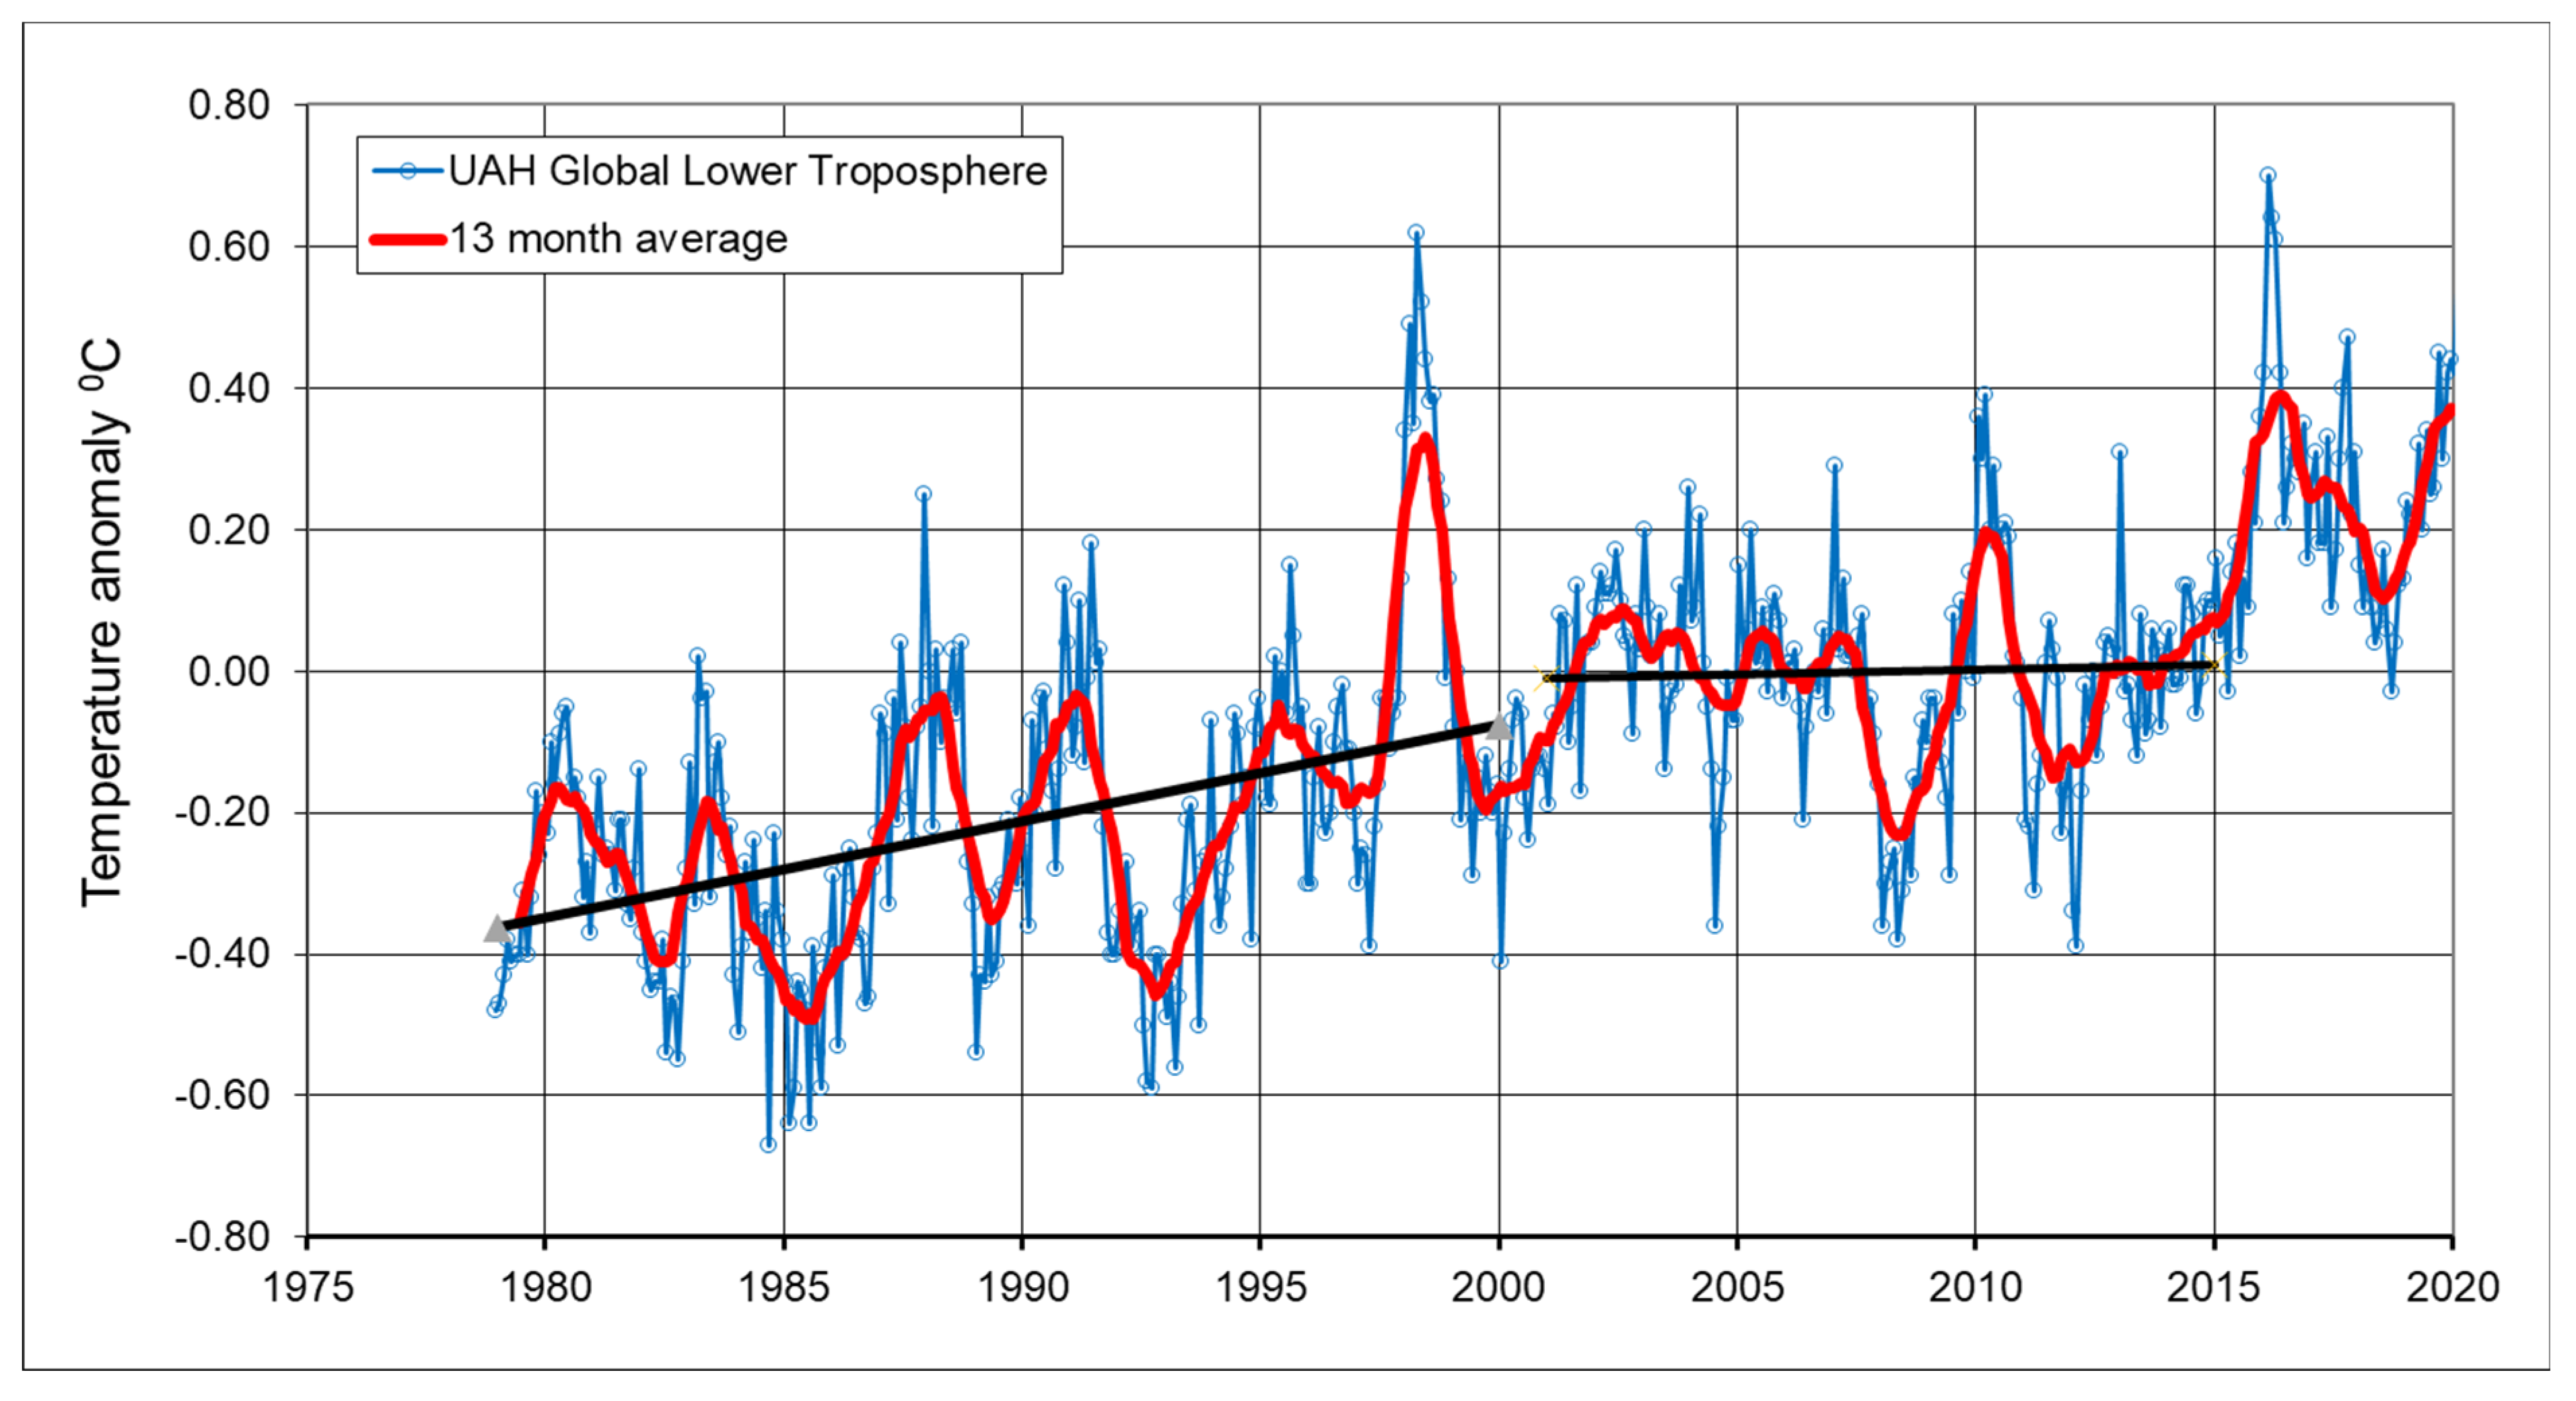
Figure 13.
Annual plant component CO2 for the South Pole, Christmas Island, Mauna Loa and Point Barrow. The 1989 regime shift (“bubble”) in plant component atmospheric CO2 is most apparent for the northernmost latitude, and for the years 1988 to 1992. The black straight line is a least-squares fit to the plant component CO2 from 1978 to 2018 at the South Pole.

Figure 14.
Residual annual values from the straight-line fit to the South Pole measurements shown in Figure 13. The vertical dashed line at 1995 denotes the time of the phase change in the AMO as given by [18]. Note also the presence of the “bubble” in the years of 1988 to 1992.
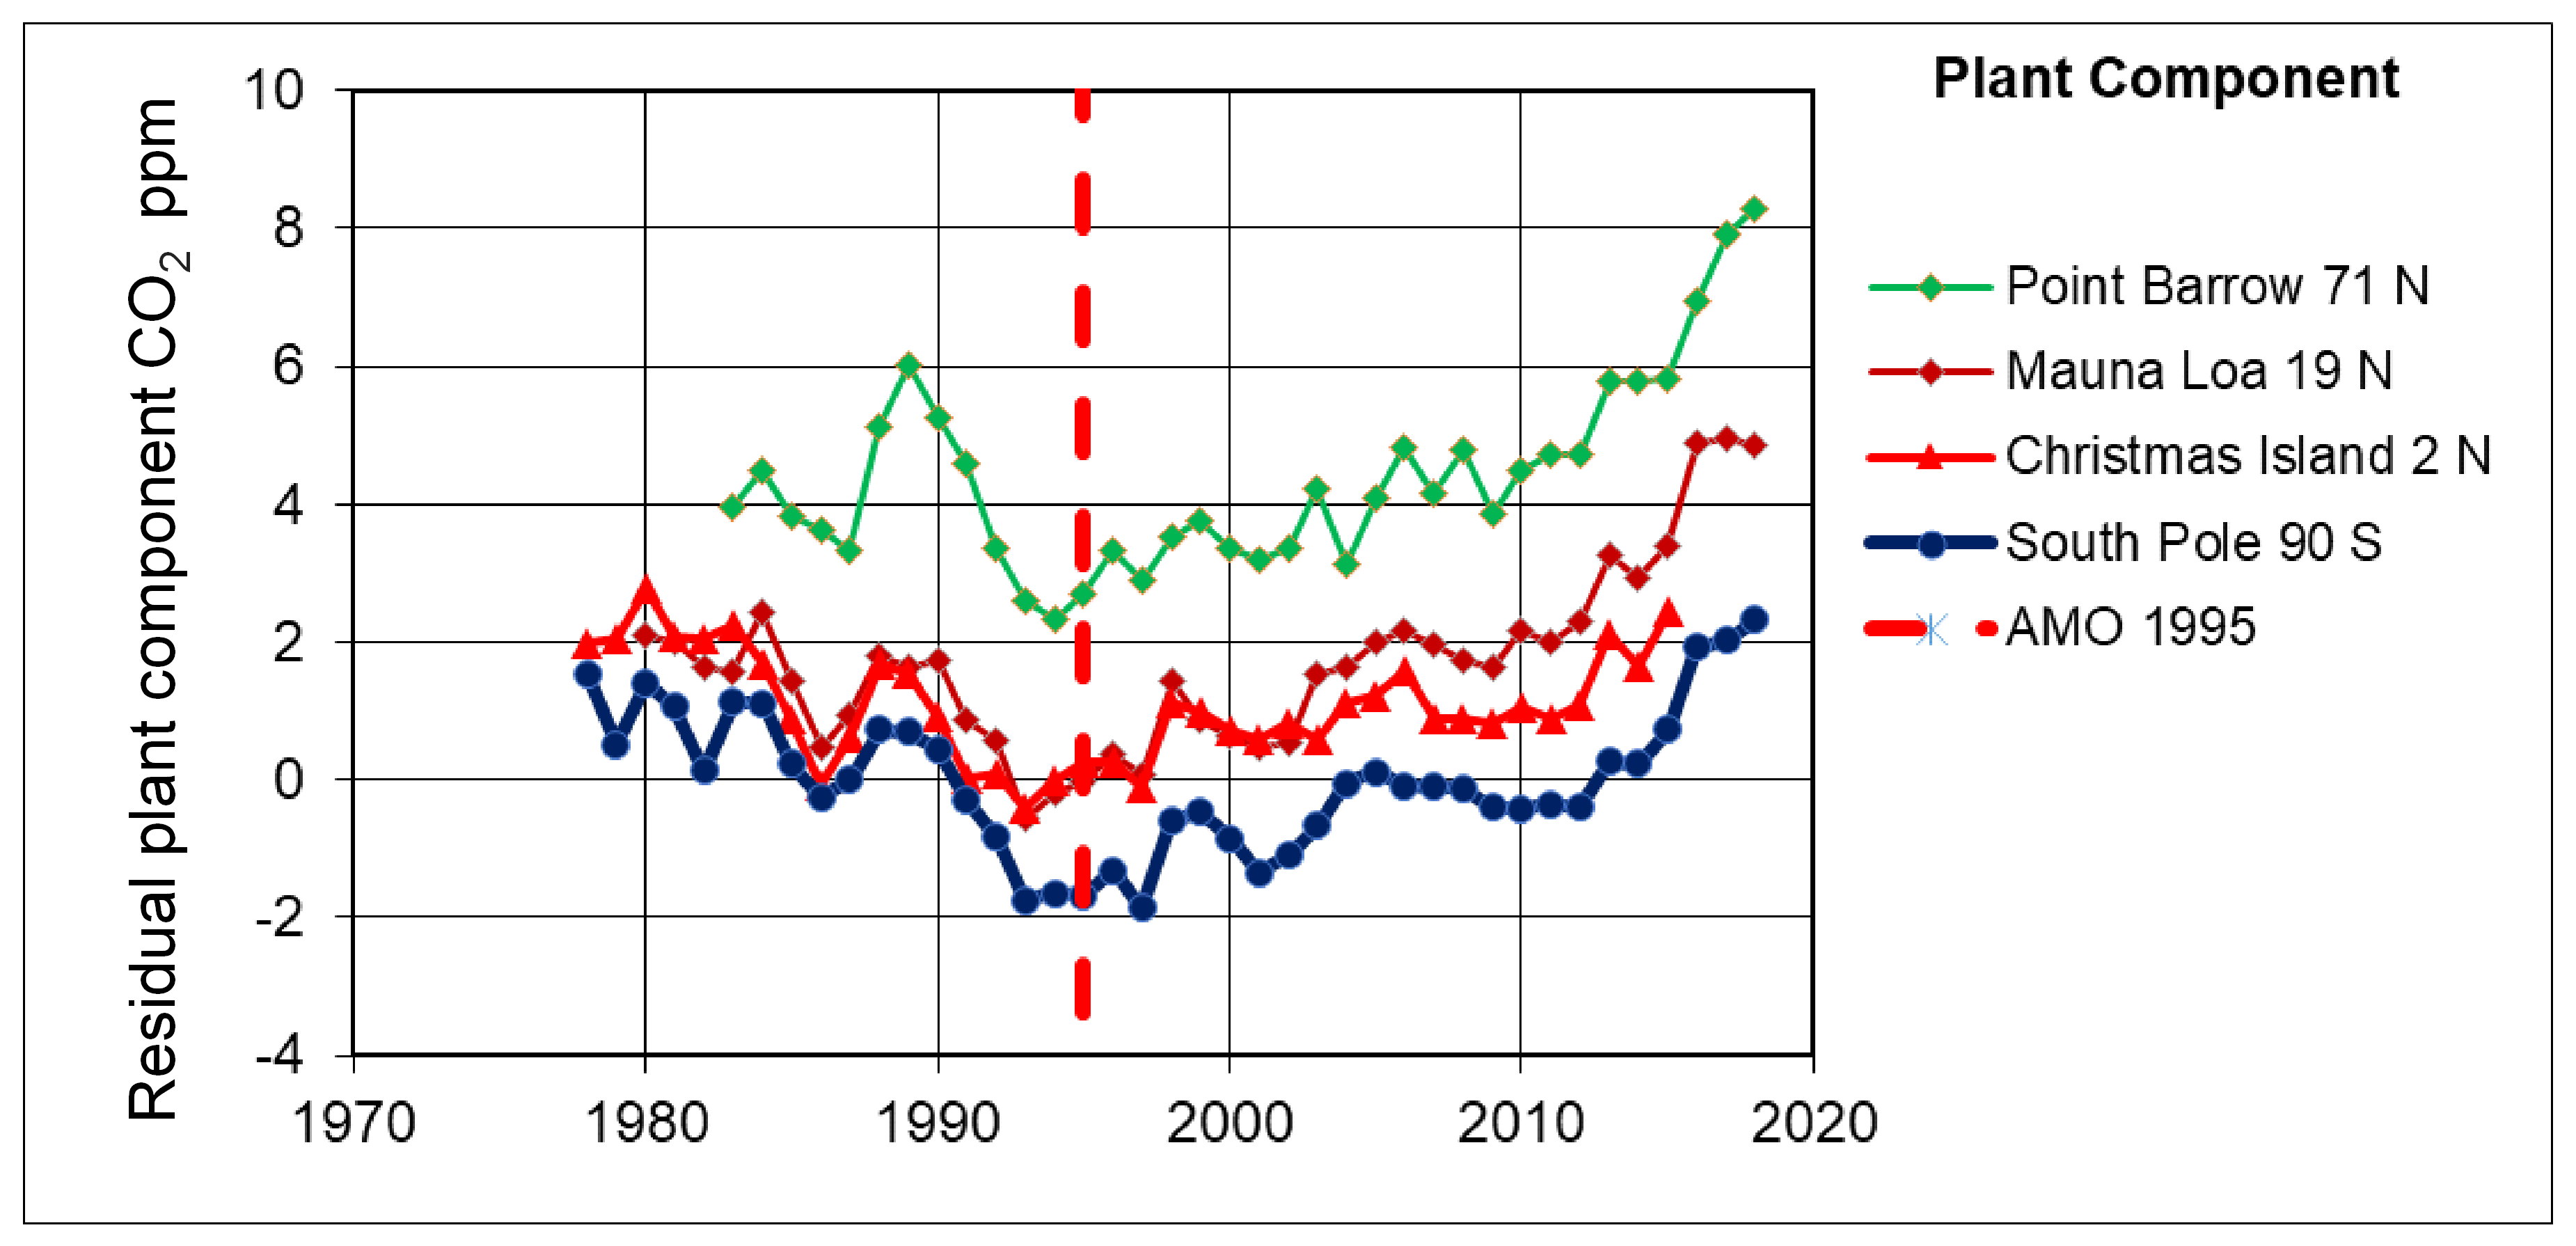
Figure 15.
Annual changes in atmospheric CO2 concentrations with ocean and plant components of CO2 in the atmosphere, averaged for 9 stations listed in Table 7. (a) Atmospheric CO2 concentrations, (b) plant component CO2, (c) ocean component CO2 and (d) Nino 3.4 Index. Red lines correspond with El Nino conditions (index > 0.5).

Table 1.
SIO stations and years for CO2 and δ13C measurements, from [6].
Table 1.
SIO stations and years for CO2 and δ13C measurements, from [6].
| Latitude | Longitude | Elevation | Years with | % Months with no Data | ||
|---|---|---|---|---|---|---|
| (meters) | CO2 and d13C | All | 1986–2015 | |||
| Alert | 82° N | 63° W | 210 | 1986–2018 | 4.55% | 4.72% |
| Point Barrow | 71° N | 157° W | 11 | 1983–2018 | 4.17% | 4.72% |
| La Jolla | 33° N | 117° W | 10 | 1979–2018 | 14.38% | 10.28% |
| Kumukahi | 19° N | 155° W | 3 | 1981–2018 | 1.10% | 0.28% |
| Mauna Loa | 19° N | 156° W | 3397 | 1981–2018 | 2.19% | 0.00% |
| Christmas Island * | 2° N | 157° W | 2 | 1978–2018 | 32.11% | 26.67% |
| American Samoa | 14° S | 171° W | 30 | 1985–2018 | 3.92% | 3.33% |
| Kermadec | 29° S | 178° W | 2 | 1985–2018 | 53.43% | 51.94% |
| Baring Head | 41° S | 175° E | 85 | 1986–2018 | 40.91% | 39.17% |
| South Pole | 90° S | 2810 | 1978–2018 | 7.52% | 3.06% | |
* Note that Christmas Island is part of the Republic of Kiribati in the Pacific Ocean.
Table 2.
Annual CO2 increases using monthly data, averaged over the years of 1986 to 2015.
| Annual Increases in ppm | |||
|---|---|---|---|
| Stations | CO2 Concentration | Ocean Component | Plant Component |
| South Pole 90° S | 1.769 +/− 0.008 | 0.886 +/− 0.005 | 0.883 +/− 0.005 |
| Christmas Island 2° N | 1.819 +/− 0.009 | 0.910 +/− 0.005 | 0.909 +/− 0.007 |
| Point Barrow 71° N | 1.800 +/− 0.038 | 0.902 +/− 0.005 | 0.898 +/− 0.038 |
Table 3.
Residual ocean component values for 1986 to 2015.
| SIO Stations | Latitude | Longitude | Elevation (Meters) | Residual Values from South Pole Value in ppm | ||
|---|---|---|---|---|---|---|
| Mean | Standard Deviation | Error of Mean | ||||
| Alert | 82° N | 63° W | 210 | −0.29 | 0.33 | 0.06 |
| Point Barrow | 71° N | 157° W | 11 | −0.30 | 0.39 | 0.06 |
| La Jolla | 33° N | 117° W | 10 | 0.36 | 0.40 | 0.07 |
| Kumukahi | 19° N | 155° W | 3 | 0.70 | 0.39 | 0.07 |
| Mauna Loa | 19° N | 156° W | 3397 | 0.99 | 0.24 | 0.04 |
| Christmas Island | 2° N | 157° W | 2 | 1.62 | 0.42 | 0.08 |
| American Samoa | 14° S | 171° W | 30 | 0.94 | 0.26 | 0.05 |
| Kermadec | 29° S | 178° W | 2 | 0.43 | 0.34 | 0.06 |
| Baring Head | 41° S | 175° E | 85 | 0.16 | 0.27 | 0.05 |
| South Pole | 90° S | 2810 | 0.00 | |||
Table 4.
Residual plant component values for 1986 to 2015.
| SIO Stations | Latitude | Longitude | Elevation (Meters) | Residual Values from South Pole Value in ppm | ||
|---|---|---|---|---|---|---|
| Mean | Standard Deviation | Error of Mean | ||||
| Alert | 82° N | 63° W | 210 | 4.33 | 0.57 | 0.10 |
| Point Barrow | 71° N | 157° W | 11 | 4.54 | 0.58 | 0.11 |
| La Jolla | 33° N | 117° W | 10 | 3.04 | 0.74 | 0.14 |
| Kumukahi | 19° N | 155° W | 3 | 2.52 | 0.52 | 0.09 |
| Mauna Loa | 19° N | 156° W | 3397 | 1.83 | 0.59 | 0.11 |
| Christmas Island | 2° N | 157° W | 2 | 1.31 | 0.48 | 0.09 |
| American Samoa | 14° S | 171° W | 30 | 0.37 | 0.30 | 0.05 |
| Kermadec | 29° S | 178° W | 2 | 0.31 | 0.33 | 0.06 |
| Baring Head | 41° S | 175° E | 85 | −0.32 | 0.24 | 0.04 |
| South Pole | 90° S | 2810 | 0.00 | |||
Table 5.
Station variability, measured as standard deviations of annually averaged CO2, ocean and plant components.
Table 5.
Station variability, measured as standard deviations of annually averaged CO2, ocean and plant components.
| Year-on-Year Changes: Standard Deviations in ppm | |||
|---|---|---|---|
| Stations | CO2 Concentration | Ocean Component | Plant Component |
| South Pole 90° S | 0.46 +/− 0.08 | 0.31 +/− 0.06 | 0.48 +/− 0.09 |
| Christmas Island 2° N | 0.57 +/− 0.10 | 0.38 +/− 0.07 | 0.53 +/− 0.10 |
| Mauna Loa 19° N | 0.54 +/− 0.10 | 0.32 +/− 0.06 | 0.59 +/− 0.10 |
| Point Barrow 71° N | 0.86 +/− 0.14 | 0.28 +/− 0.05 | 0.74 +/− 0.14 |
Table 6.
Annual CO2 increases using annual data, averaged over the years of 1986 to 2015.
| Annual Increases in ppm | |||
|---|---|---|---|
| Stations | CO2 Concentration | Ocean Component | Plant Component |
| South Pole 90° S | 1.77 +/− 0.03 | 0.89 +/− 0.02 | 0.88 +/− 0.02 |
| Christmas Island 2° N | 1.82 +/− 0.03 | 0.91 +/− 0.02 | 0.91 +/− 0.02 |
| Mauna Loa 19° N | 1.82 +/− 0.03 | 0.88 +/− 0.02 | 0.94 +/− 0.02 |
| Point Barrow 71° N | 1.81 +/− 0.03 | 0.90 +/− 0.02 | 0.91 +/− 0.02 |
Table 7.
Latitude bands for global CO2 concentrations.
| Station | Latitude | Latitude Band | Band width Degrees | Fraction of Global Surface |
|---|---|---|---|---|
| Alert | 82° N | 90° N to 76.5° N | 13.5 | 1.38% |
| Point Barrow | 71° N | 76.5° N to 52° N | 24.5 | 9.22% |
| La Jolla | 33° N | 52° N to 26° N | 26.0 | 17.48% |
| Kumukahi | 19° N | 26° N to 10.5° N | 15.5 | 12.81% |
| Christmas Island | 2° N | 10.5° N to 6° S | 16.5 | 14.34% |
| American Samoa | 14° S | 6° S to 21.5° S | 15.5 | 13.10% |
| Kermadec Island | 29° S | 21.5° S to 35° S | 13.5 | 10.35% |
| Baring Head | 41° S | 35° S to 65.5° S | 30.5 | 16.82% |
| South Pole | 90° S | 65.5° S to 90° S | 24.5 | 4.50% |
| Total | 180.0 | 100.00% |
Disclaimer/Publisher’s Note: The statements, opinions and data contained in all publications are solely those of the individual author(s) and contributor(s) and not of MDPI and/or the editor(s). MDPI and/or the editor(s) disclaim responsibility for any injury to people or property resulting from any ideas, methods, instructions or products referred to in the content. |
© 2023 by the authors. Licensee MDPI, Basel, Switzerland. This article is an open access article distributed under the terms and conditions of the Creative Commons Attribution (CC BY) license (https://creativecommons.org/licenses/by/4.0/).
Share and Cite
MDPI and ACS Style
Quirk, T.; Asten, M. Atmospheric CO2 Isotopic Variations, with Estimation of Ocean and Plant Source Contributions. Atmosphere 2023, 14, 1623. https://doi.org/10.3390/atmos14111623
AMA Style
Quirk T, Asten M. Atmospheric CO2 Isotopic Variations, with Estimation of Ocean and Plant Source Contributions. Atmosphere. 2023; 14(11):1623. https://doi.org/10.3390/atmos14111623
Chicago/Turabian StyleQuirk, Tom, and Michael Asten. 2023. "Atmospheric CO2 Isotopic Variations, with Estimation of Ocean and Plant Source Contributions" Atmosphere 14, no. 11: 1623. https://doi.org/10.3390/atmos14111623
Note that from the first issue of 2016, this journal uses article numbers instead of page numbers. See further details here.