Analyzing the Influence of Vehicular Traffic on the Concentration of Pollutants in the City of São Paulo: An Approach Based on Pandemic SARS-CoV-2 Data and Deep Learning

 , , , ,
  and
and 
Abstract
:1. Introduction
2. Experimental Site and Instrumentation
2.1. São Paulo
2.1.1. CETESB Stations
2.1.2. SPU Lidar Station
2.1.3. Rainfall Rate and Vertical Temperature Profile
2.1.4. CETESB QUALAR Platform
3. Theory and Methods
3.1. Atmospheric Boundary Layer Height
ABLH Daily Cycle from Elastic Lidar Data
3.2. Ventilation Coefficient
3.3. Thermal Inversions
3.4. Prediction of Pollutant Concentrations
4. Results and Discussion
4.1. Analysis of Meteorological Variables
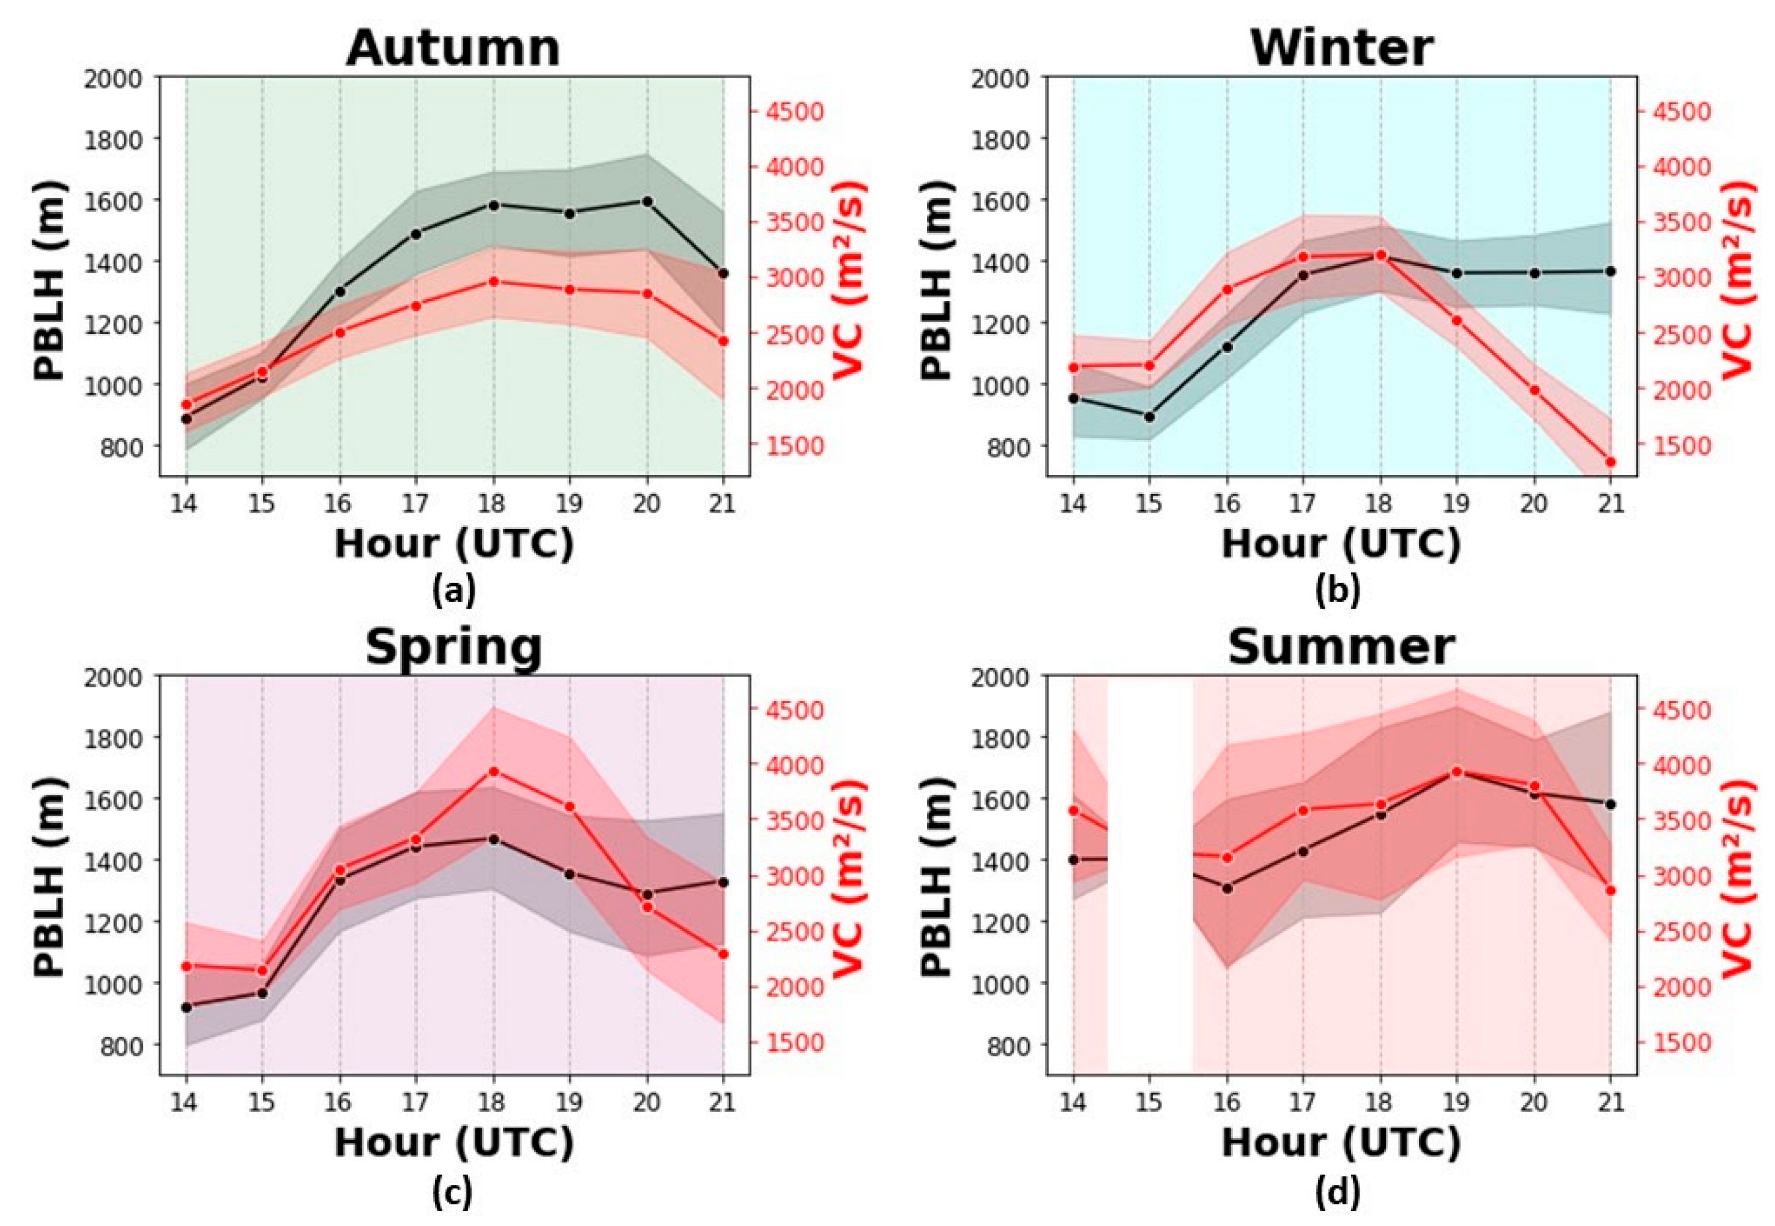
4.1.1. The PBLH and VC
4.1.2. Thermal Inversions
4.1.3. Air Surface Temperature, Relative Humidity, and Precipitation
4.2. Analysis of the Measured Pollutant Concentrations
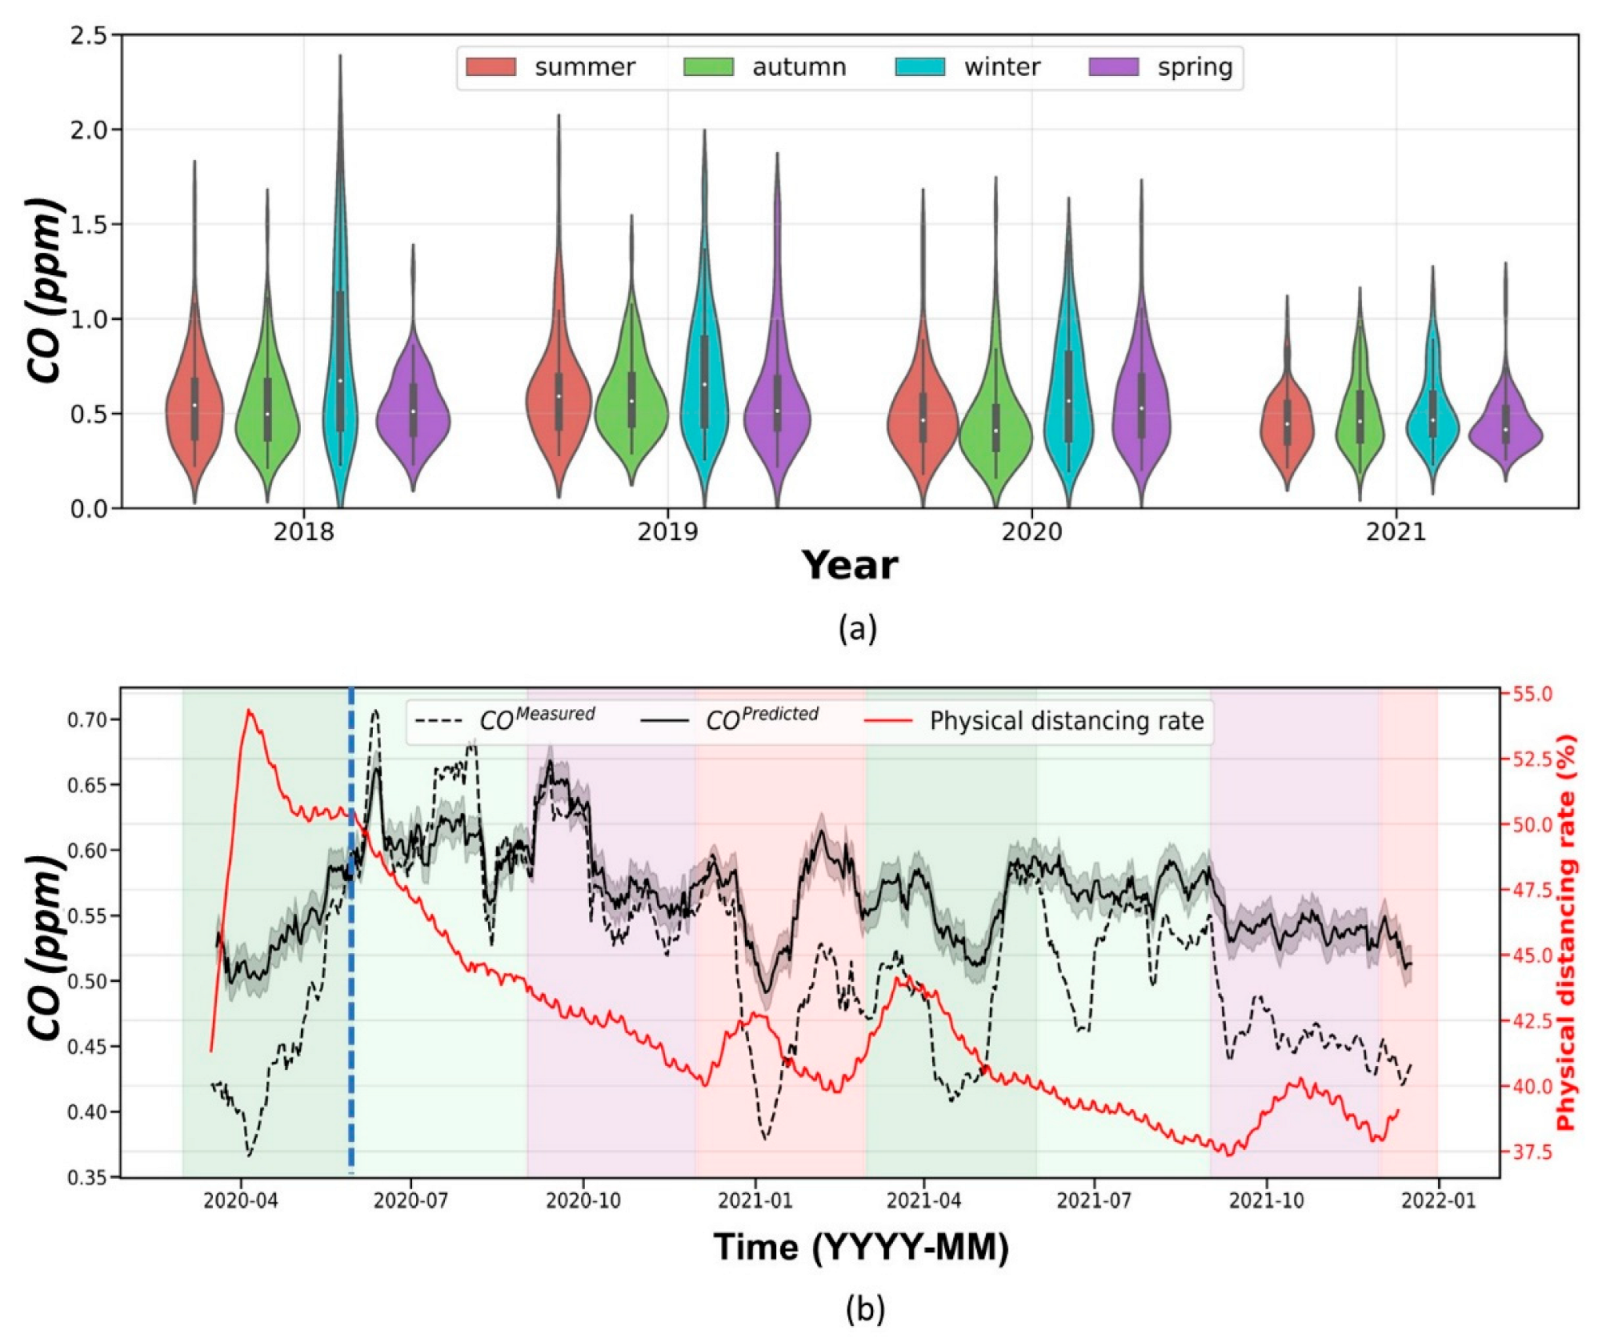
4.2.1. CO
4.2.2. NO2
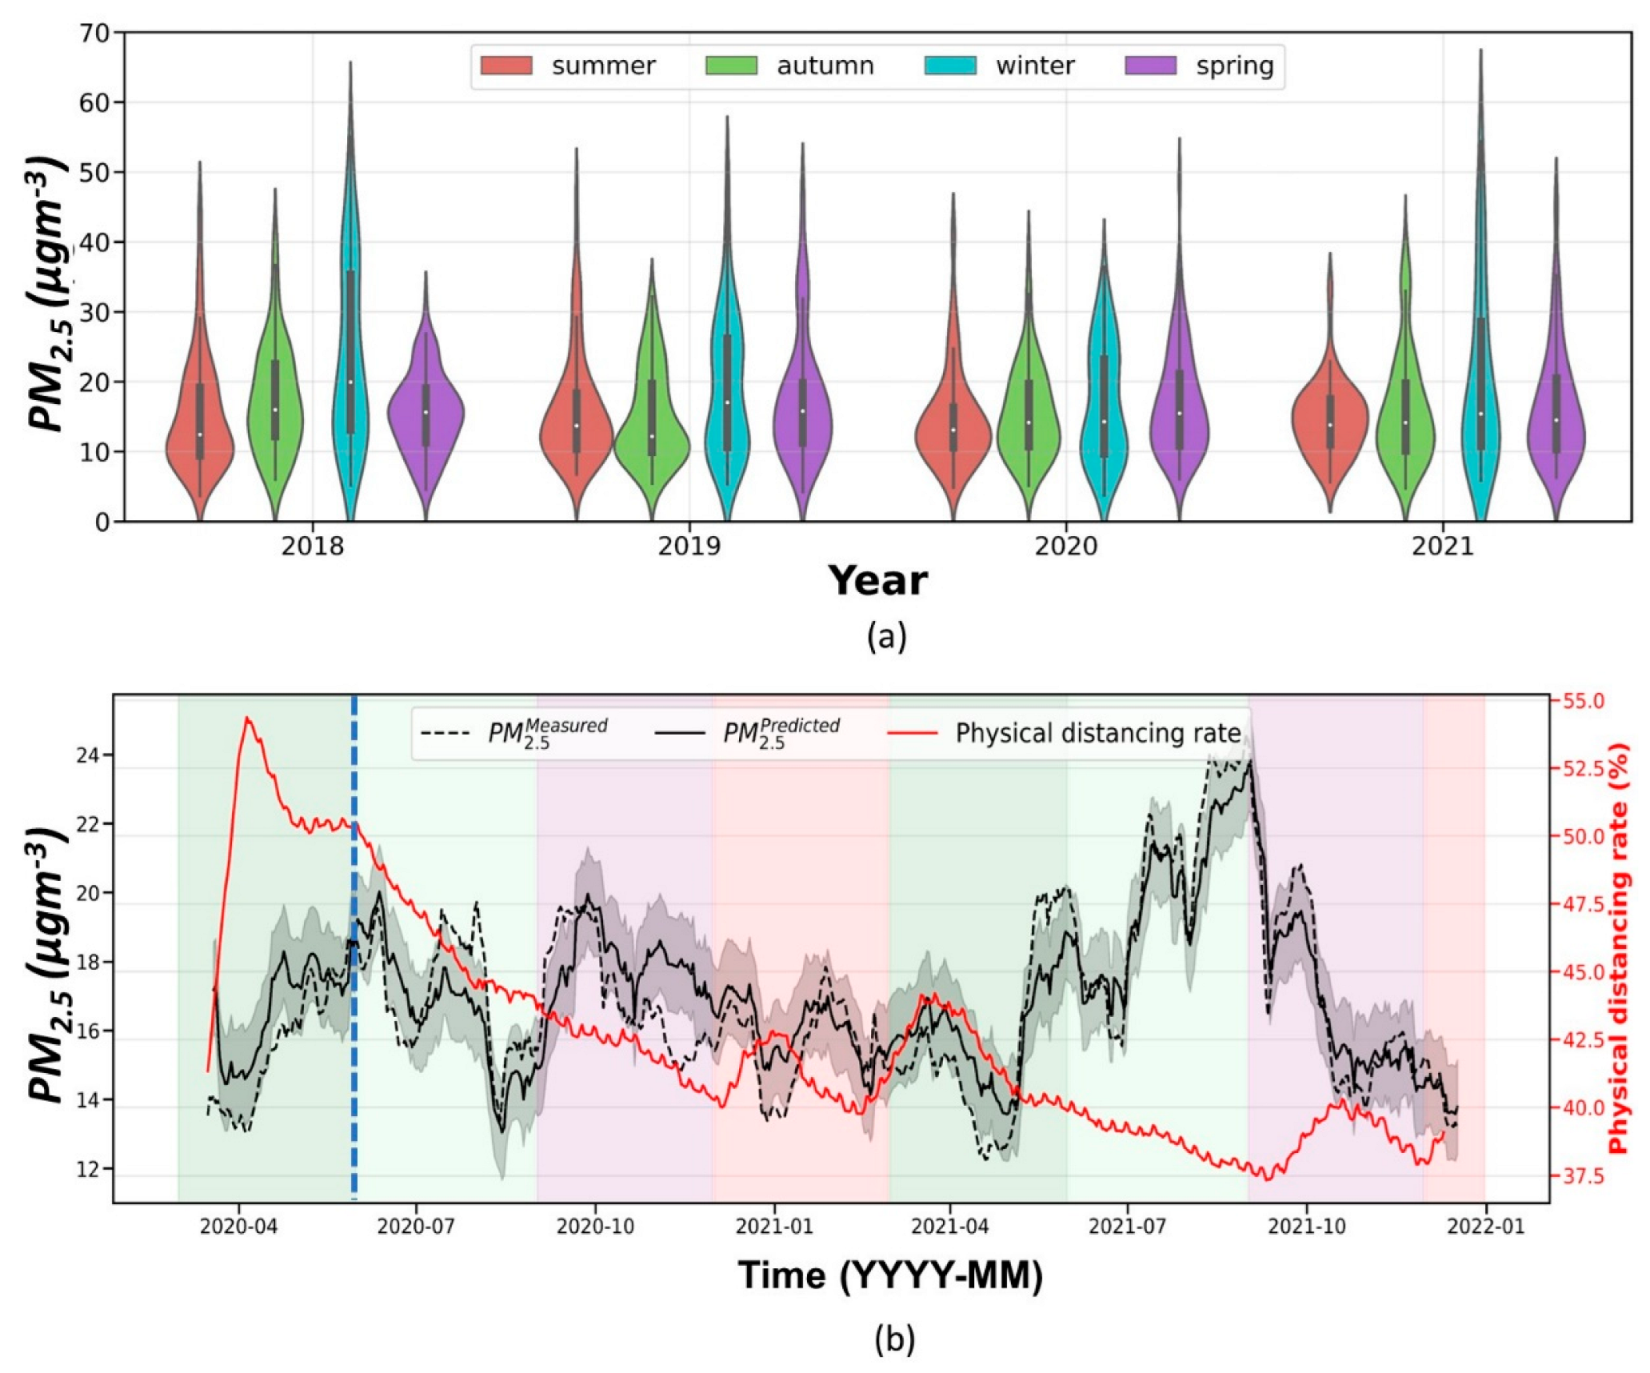
4.2.3. PM2.5
4.2.4. PM10
5. Discussion
6. Conclusions
Author Contributions
Funding
Institutional Review Board Statement
Informed Consent Statement
Data Availability Statement
Acknowledgments
Conflicts of Interest
References
- Sokhi, R.S.; Moussiopoulos, N.; Baklanov, A.; Bartzis, J.; Coll, I.; Finardi, S.; Friedrich, R.; Geels, C.; Grönholm, T.; Halenka, T.; et al. Advances in air quality research—Current and emerging challenges. Atmos. Chem. Phys. 2022, 22, 4615–4703. [Google Scholar] [CrossRef]
- Manisalidis, I.; Stavropoulou, E.; Stavropoulos, A.; Bezirtzoglou, E. Environmental and Health Impacts of Air Pollution: A Review. Front. Public Health 2020, 8, 14. [Google Scholar] [CrossRef]
- Adam, M.G.; Tran, P.T.M.; Balasubramanian, R. Air quality changes in cities during the COVID-19 lockdown: A critical review. Atmos. Res. 2021, 264, 105823. [Google Scholar] [CrossRef] [PubMed]
- Ścisło, Ł.; Łacny, Ł.; Guinchard, M. COVID-19 lockdown impact on CERN seismic station ambient noise levels. Open Eng. 2021, 11, 1233–1240. [Google Scholar] [CrossRef]
- Caniato, M.; Bettarello, F.; Gasparella, A. Indoor and outdoor noise changes due to the COVID-19 lockdown and their effects on individuals’ expectations and preferences. Sci. Rep. 2021, 11, 16533. [Google Scholar] [CrossRef]
- Li, C.; Li, X.; Zhu, C. Night-Time Skyglow Dynamics during the COVID-19 Epidemic in Guangbutun Region of Wuhan City. Remote Sens. 2022, 14, 4451. [Google Scholar] [CrossRef]
- Silva, A.C.T.; Branco, P.T.B.S.; Sousa, S.I.V. Impact of COVID-19 Pandemic on Air Quality: A Systematic Review. Int. J. Environ. Res. Public Health 2022, 19, 1950. [Google Scholar] [CrossRef]
- Dantas, G.; Siciliano, B.; França, B.; da Silva, C.M.; Arbilla, G. The impact of COVID-19 partial lockdown on the air quality of the city of Rio de Janeiro, Brazil. Sci. Total Environ. 2020, 729, 139085. [Google Scholar] [CrossRef]
- Moreira, G.A.; Andrade, I.S.; Cacheffo, A.; Yoshida, A.C.; Gomes, A.A.; Silva, J.J.; Lopes, F.J.S.; Landulfo, E. COVID-19 outbreak and air quality: Analyzing the influence of physical distancing and the resumption of activities in São Paulo municipality. Urban. Clim. 2021, 37, 100813. [Google Scholar] [CrossRef]
- Wang, P.; Chen, K.; Zhu, S.; Wang, P.; Zhang, H. Severe air pollution events not avoided by reduced anthropogenic activities during the COVID-19 outbreak. Resour. Conserv. Recycl. 2020, 158, 104814. [Google Scholar] [CrossRef]
- Zalakeviciute, R.; Vasquez, R.; Bayas, D.; Buenano, A.; Mejia, D.; Zegarra, R.; Diaz, A.; Lamb, B. Drastic Improvements in Air Quality in Ecuador during the COVID-19 Outbreak. Aerosol Air Qual. Res. 2020, 20, 1783–1792. [Google Scholar] [CrossRef]
- Sharma, S.; Zhang, M.; Gao, J.; Zhang, H.; Kota, S.H. Effect of restricted emissions during COVID-19 on air quality in India. Sci. Total Environ. 2020, 728, 138878. [Google Scholar] [CrossRef] [PubMed]
- Collivignarelli, M.C.; Abbà, A.; Bertanza, G.; Pedrazzani, R.; Ricciardi, P.; Miino, M.C. Lockdown for COVID-2019 in Milan: What are the effects on air quality? Sci. Total Environ. 2020, 732, 139280. [Google Scholar] [CrossRef] [PubMed]
- Otmani, A.; Benchrif, A.; Tahri, M.; Bounakhla, M.; Chakir, E.M.; Bouch, M.E.; Krombi, E. Impact of Covid-19 lockdown on PM10, SO2, and NO2 concentrations in Salé City (Morocco). Sci. Total Environ. 2020, 735, 139541. [Google Scholar] [CrossRef] [PubMed]
- Sicard, P.; De Marco, A.; Agathokleous, E.; Feng, Z.; Xu, X.; Paoletti, E.; Rodriguez, J.J.D.; Calatayud, V. Amplified ozone pollution in cities during the COVID-19 lockdown. Sci. Total Environ. 2020, 735, 139542. [Google Scholar] [CrossRef] [PubMed]
- Bekbulat, B.; Apte, J.S.; Millet, D.B.; Robinson, A.L.; Wells, K.C.; Presto, A.A.; Marshall, J.D. Changes in criteria air pollution levels in the US before, during, and after Covid-19 stay-at-home orders: Evidence from regulatory monitors. Sci. Total Environ. 2021, 769, 144693. [Google Scholar] [CrossRef]
- IBGE. Instituto Brasileiro de Geografia e Estatística. 2022. Available online: http://ibge.gov.br (accessed on 1 January 2022).
- Andrade, M.F.; Kumar, P.; Freitas, E.D.; Ynoue, R.Y.; Martins, J.; Martins, L.D.; Nogueira, T.; Perez-Martinez, P.; Miranda, R.M.; Albuquerque, T.; et al. Air quality in the megacity of São Paulo: Evolution over the last 30 years and future perspectives. Atmos. Environ. 2017, 159, 66–82. [Google Scholar] [CrossRef]
- CETESB. Qualidade do Ar no Estado de São Paulo 2018. 2019. Available online: https://cetesb.sp.gov.br/ar/wp-content/uploads/sites/28/2019/07/Relat%C3%B3rio-de-Qualidade-do-Ar-2018.pdf (accessed on 1 June 2021).
- São Paulo Municipality. 2022. Available online: https://www.prefeitura.sp.gov.br/ (accessed on 1 January 2022).
- Siciliano, B.; Carvalho, G.; da Silva, C.M.; Arbilla, G. The Impact of COVID-19 Partial Lockdown on Primary Pollutant Concentrations in the Atmosphere of Rio de Janeiro and São Paulo Megacities (Brazil). Bull. Environ. Contam. Toxicol. 2020, 105, 2–8. [Google Scholar] [CrossRef]
- Nakada, L.Y.K.; Urban, R.C. COVID-19 pandemic: Impacts on the air quality during the partial lockdown in São Paulo state, Brazil. Sci. Total Environ. 2020, 730, 139087. [Google Scholar] [CrossRef]
- Moreira, G.A.; Oliveira, A.P.; Sánchez, M.P.; Codato, G.; Lopes, F.J.S.; Landulfo, E.; Filho, E.P.M. Performance assessment of aerosol-lidar remote sensing skills to retrieve the time evolution of the urban boundary layer height in the Metropolitan Region of São Paulo City, Brazil. Atmos. Res. 2022, 277, 106290. [Google Scholar] [CrossRef]
- CETESB. Padrões de Qualidade do Ar. 2020. Available online: https://cetesb.sp.gov.br/ar/padroes-de-qualidade-do-ar/ (accessed on 10 June 2021).
- Assembleia Legislativa do Estado de São Paulo. Decreto Nº 59.113, de 23 de Abril de 2013. Estabelece Novos Padrões de Qualidade do ar e dá Providências Correlatas; Assembleia Legislativa: São Paulo, Brazil, 2013. Available online: https://cetesb.sp.gov.br/qualidade-ar/wp-content/uploads/sites/28/2013/12/decreto-59113de230413.pdf (accessed on 1 January 2022).
- Moreira, G.A.; Lopes, F.J.S.; Guerrero-Rascado, J.L.; Silva, J.J.; Gomes, A.A.; Landulfo, E.; Alados-Arboledas, L. Analyzing the atmospheric boundary layer using high-order moments obtained from multiwavelength lidar data: Impact of wavelength choice. Atmos. Meas. Tech. 2019, 12, 4261–4276. [Google Scholar] [CrossRef]
- INMET. Instituto Nacional de Meteorologia. 2020. Available online: http://www.inmet.gov.br/ (accessed on 1 January 2022).
- CETESB. Qualidade do ar (QUALAR). 2023. Available online: https://cetesb.sp.gov.br/ar/qualar/ (accessed on 4 August 2023).
- Stull, R.B. An Introduction to Boundary Layer Meteorology; Springer: Dordrecht, The Netherlands, 1988. [Google Scholar]
- Granados-Muñoz, M.J.; Navas-Guzmán, F.; Bravo-Aranda, J.A.; Guerrero-Rascado, J.L.; Lyamani, H.; Fernández-Gálvez, J.; Alados-Arboledas, L. Automatic determination of the planetary boundary layer height using lidar: One-year analysis over southeastern Spain. J. Geophys. Res. 2012, 117, D18208. [Google Scholar] [CrossRef]
- Moreira, G.A.; Guerrero-Rascado, J.L.; Bravo-Aranda, J.A.; Foyo-Moreno, I.; Cazorla, A.; Alados, I.; Lyamani, H.; Landulfo, E.; Alados-Arboledas, L. Study of the planetary boundary layer height in an urban environment using a combination of microwave radiometer and ceilometer. Atmos. Res. 2020, 240, 104932. [Google Scholar] [CrossRef]
- Triebe, O.; Hewamalage, H.; Pilyugina, P.; Laptev, N.; Bergmeir, C.; Rajagopal, R. NeuralProphet: Explainable Forecasting at Scale. arXiv 2021, arXiv:2111.15397. [Google Scholar] [CrossRef]
- Moreira, G.A.; da Silva Andrade, I.; Cacheffo, A.; da Silva Lopes, F.J.; Calzavara Yoshida, A.; Gomes, A.A.; da Silva, J.J.; Landulfo, E. Influence of a Biomass-Burning Event in PM2.5 Concentration and Air Quality: A Case Study in the Metropolitan Area of São Paulo. Sensors 2021, 21, 425. [Google Scholar] [CrossRef]
- Pivello, V.R.; Vieira, I.; Christianini, A.V.; Ribeiro, D.B.; Menezes, L.S.; Berlinck, C.N.; Melo, F.P.L.; Marengo, J.A.; Tornquist, C.G.; Tomas, W.M.; et al. Understanding Brazil’s catastrophic fires: Causes, consequences and policy needed to prevent future tragedies. Perspect. Ecol. Conserv. 2021, 19, 3. [Google Scholar] [CrossRef]


| Seasons | <200m | 200–500 m | >500 m | |||||||||
|---|---|---|---|---|---|---|---|---|---|---|---|---|
| 2018 | 2019 | 2020 | 2021 | 2018 | 2019 | 2020 | 2021 | 2018 | 2019 | 2020 | 2021 | |
| summer | 4 | 13 | 0 | 0 | 16 | 15 | 14 | 14 | 45 | 26 | 44 | 45 |
| autumn | 5 | 5 | 6 | 9 | 31 | 24 | 28 | 29 | 34 | 34 | 49 | 36 |
| winter | 22 | 12 | 17 | 20 | 28 | 25 | 30 | 29 | 33 | 23 | 35 | 36 |
| spring | 3 | 4 | 4 | 1 | 23 | 21 | 20 | 26 | 42 | 50 | 25 | 41 |
Disclaimer/Publisher’s Note: The statements, opinions and data contained in all publications are solely those of the individual author(s) and contributor(s) and not of MDPI and/or the editor(s). MDPI and/or the editor(s) disclaim responsibility for any injury to people or property resulting from any ideas, methods, instructions or products referred to in the content. |
© 2023 by the authors. Licensee MDPI, Basel, Switzerland. This article is an open access article distributed under the terms and conditions of the Creative Commons Attribution (CC BY) license (https://creativecommons.org/licenses/by/4.0/).
Share and Cite
Moreira, G.d.A.; Cacheffo, A.; Andrade, I.d.S.; Lopes, F.J.d.S.; Gomes, A.A.; Landulfo, E. Analyzing the Influence of Vehicular Traffic on the Concentration of Pollutants in the City of São Paulo: An Approach Based on Pandemic SARS-CoV-2 Data and Deep Learning. Atmosphere 2023, 14, 1578. https://doi.org/10.3390/atmos14101578
Moreira GdA, Cacheffo A, Andrade IdS, Lopes FJdS, Gomes AA, Landulfo E. Analyzing the Influence of Vehicular Traffic on the Concentration of Pollutants in the City of São Paulo: An Approach Based on Pandemic SARS-CoV-2 Data and Deep Learning. Atmosphere. 2023; 14(10):1578. https://doi.org/10.3390/atmos14101578
Chicago/Turabian StyleMoreira, Gregori de Arruda, Alexandre Cacheffo, Izabel da Silva Andrade, Fábio Juliano da Silva Lopes, Antonio Arleques Gomes, and Eduardo Landulfo. 2023. "Analyzing the Influence of Vehicular Traffic on the Concentration of Pollutants in the City of São Paulo: An Approach Based on Pandemic SARS-CoV-2 Data and Deep Learning" Atmosphere 14, no. 10: 1578. https://doi.org/10.3390/atmos14101578