
Prediction of Storm Surge Water Level Based on Machine Learning Methods
School of Geodesy and Geomatics, Wuhan University, Wuhan 430079, China
*
Author to whom correspondence should be addressed.
Atmosphere 2023, 14(10), 1568; https://doi.org/10.3390/atmos14101568
Submission received: 13 September 2023
/
Revised: 4 October 2023
/
Accepted: 13 October 2023
/
Published: 16 October 2023
(This article belongs to the Special Issue Forecasting and Modeling of Tropical Cyclones and Their Induced Wind and Precipitation)
Abstract
:Storm surge disasters result in severe casualties and economic losses. Accurate prediction of storm surge water level is crucial for disaster assessment, early warning, and effective disaster management. Machine learning methods are relatively more efficient and straightforward compared to numerical simulation approaches. However, most of the current research on storm surge water level prediction based on machine learning methods is primarily focused on point predictions. In this study, we explore the feasibility of spatial water level prediction using the ConvLSTM model. We focus on the coastal area of Guangdong Province and employ MIKE21(2019) software to simulate historical typhoons that have made landfall in the region from 1991 to 2018. We construct two datasets: one for direct water level prediction and the other for indirect water level prediction based on water level changes. Utilizing the ConvLSTM network, we employ it to forecast storm surges on both datasets, effectively capturing both temporal and spatial characteristics and thus ensuring the production of dependable results. When directly predicting water levels, we achieve an MAE (mean absolute error) of 0.026 m and an MSE (mean squared error) of 0.0038 m2. In contrast, the indirect prediction approach yields even more promising results, with an MAE of 0.014 m and an MSE of 0.0007 m2. Compared to traditional numerical simulation methods, the ConvLSTM-based approach is simpler, faster, and able to predict water levels accurately without boundary conditions or topographies. Furthermore, we consider worst-case scenarios by predicting the maximum water increase value using the random forest model. Our results indicate that the random forest model can serve as a valuable reference for forecasting the maximum water increase value of typhoon storm surges, supporting effective emergency responses to disasters.
1. Introduction
Storm surges are catastrophic events driven by the convergence of intense atmospheric disturbances, such as strong winds and sudden shifts in atmospheric pressure, combined with tidal influences. Sea surface temperature and sea level have shown a significant upward trend in the past 30 years due to global warming [1]. The number of typhoon storm surges caused by extremely high sea levels is increasing and the rise of sea surface temperatures will lead to more typhoons in the Pacific Northwest, which will lead to more serious storm surge disasters and flooding disasters [2,3,4]. The risk of typhoon storm surges is increasing, and coastal and offshore areas are highly sensitive and vulnerable to climate change [5]. The economic losses caused by disasters are increasingly serious. With a long coastline, China is one of the few countries affected by both temperate storm surge and typhoon storm surge disasters. Storm surges frequently precipitate grave ramifications, encompassing the peril of ship capsizing, disruption to offshore fish farming, and contamination of freshwater resources. In addition, due to the low pressure and high wind speed of the storm, abnormally high sea water levels will be triggered near coastal areas, which may lead to overflow or dam break flooding [6,7]. This can inundate farmland and houses, resulting in severe casualties and economic losses. The prediction of storm surge water level can provide a good aid for disaster assessment and disaster warning, which can be of great help for disaster management. Currently, three main approaches are employed for storm surge predictions: numerical simulations, statistical analyses, and machine learning methods.
Traditional storm surge forecasting methods are mainly numerical simulation methods and statistical analysis methods. Tan, C. and Fang, W. [8] created an example of a wind hazard map in the form of wind speeds under a 100-year return period and corresponding uncertainties based on a statistical analysis of reconstructed historical wind fields over seven of the world’s ocean basins. In the United States, the SLOSH model [9] factors in key elements like typhoon strength, speed, and trajectory, playing a pivotal role in storm surge prediction. The UK has developed a two-dimensional numerical sea model, which is widely used in the forecast of temperate storm surges [10]. In addition, several mature commercial software applications for hydrodynamic simulations have been developed internationally, such as MIKE21 [11], Delft3D [12], ADCRIC [13], FVCOM [14], etc. The numerical simulation of storm surge requires access to precise coastal boundaries, elevation data, wind fields, and other more basic data that are difficult to obtain. At the same time, the calculation of high-resolution numerical simulation requires substantial computational resources and requires operators to master the dynamic laws of storm surge disasters, which are complex and difficult to understand. In contrast, machine learning methods, such as artificial neural networks (ANNs) [15], long short-term memory (LSTM) models [16], and support vector machines (SVMs) [17], offer advantages. In addition, unlike neural network model designs, many hybrid models are proposed to optimize the key parameters of existing models with the help of different optimization algorithms, such as extended marine predators algorithm-based ANNs (ANN-EMPAs) [18], relevance vector machine tuned with improved Manta-Ray foraging optimization (RVM-IMRFO) [19], random vector functional link based on quantum-based avian navigation optimizer algorithm (RVFL-QANA) [20], the hybrid adaptive neuro-fuzzy inference system coupled with the new hybrid heuristic algorithm techniques (ANFIS-WCAMFO) [21], extreme learning machines merged jellyfish search optimizer (ELM-JFO) [22], and support vector regression based on the combination of the particle search swarm optimization and the grey wolf optimizer (SVR-PSOGWO) [23]. In recent years, many scholars have investigated various machine learning algorithms for storm surge prediction. Kim et al. [24] investigated the sensitivity of real-time storm surge forecasting to local measurements in an artificial neural network by inputting multiple factors for prediction experiments: sea level, sea level pressure, sink rate, wind speed, wind direction, and typhoon location; increasing the number of measurement stations and the number of typhoon events. They have found that more attributes, stations, and events resulted in more accurate storm surge predictions in the neural network. Liu, Y et al. [25] developed a storm surge proximity prediction model for a single station using the LSTM network, and considered the combination of four different input parameters to analyze the tide level height in the future 1–3 h, taking into account meteorological elements and tide level factors of the previous time series. Hong, S et al. [26] used satellite images of the typhoon in the dataset and detected the center of the typhoon using the joint starting unit of a convolutional neural network (CNN). However, while these machine learning methods show promise, most are limited to forecasting water levels at individual stations or specific moments. Traditional machine learning methods struggle to capture the temporal and spatial dynamics of typhoons simultaneously.
The emergence of ConvLSTM [27] has addressed a significant challenge in spatiotemporal prediction. Initially designed for precipitation proximity prediction, ConvLSTM has demonstrated superior capabilities over traditional LSTM and CNN-LSTM [28] models in capturing spatiotemporal relationships. The method replaces the input-to-state and state-to-state parts of the LSTM with a convolutional form through feed-forward calculation. This innovation replaces full connections with convolution operations, facilitating the efficient extraction of not only temporal relationships but also spatial features. The ConvLSTM has found utility in a wide range of spatiotemporal problems. For instance, Yang, X et al. [29] built a multi-source data-driven rainfall fusion model using the ConvLSTM network based on Global Precipitation Observation Program (GPM) data, watershed topographic data, and rainfall observations from national meteorological stations in the Yalong River basin. Using this model, they generated a 0.05° resolution daily rainfall fusion dataset for the Yalong River basin. Zhou, S et al. [30] employed ConvLSTM for significant wave height prediction. Their model, trained on the dataset under typhoon sea conditions, demonstrated the ability to forecast significant wave heights under such conditions. Kim, S et al. [31] utilized the ConvLSTM network to predict the track of tropical cyclones using spatiotemporal atmospheric simulation data. Xie, W et al. [32] used ConvLSTM for autoregressive forecasts based on the sea surface height field and forecasts based on forecast wind fields and initial sea surface height fields, which closely replicated the results of numerical model simulations in short-term forecasts.
In this study, we used the historical typhoon storm surge data that made landfall in Guangdong Province from 2008 to 2018, and ConvLSTM was used for the spatiotemporal prediction of the storm surge water level. In addition, the current forecasting models are mostly used to process forecasting. However, while these are valuable for general forecasting, they may fall short in ensuring the effectiveness of the emergency response. To address this, we integrated worst-case scenario planning. We selected ten factors, including minimum center pressure, maximum wind speed, center pressure at landing, wind speed at landing, typhoon intensity at landing, landing location, landing direction, and others, to construct the random forest model [33]. This model predicts the maximum water increase value of typhoon-induced storm surges at a specific target location.
2. Materials and Methods
2.1. Study Area
Guangdong Province, located on the low latitude coast of East Asia in the northern hemisphere, with a warm and humid climate, faces frequent flooding events and is prone to typhoon impacts. Guangdong’s terrain is diverse, with highlands in the north and lowlands in the south. It can be divided into four distinct areas: northern mountainous regions, eastern hilly areas, the Pearl River Delta, and western mountainous terraces. The Pearl River Delta region is densely populated and industrialized. Its coastal cities are along muddy coasts with broad widths and small slopes and suffer serious losses from storm surge disasters. The eastern Guangdong and western Guangdong regions are in the coastal zone near the Pearl River Delta region, with obvious location advantages and rapid economic development during recent years. Its coast type is bedrock coast and is steep, with many islands and rocky reefs and a ‘zigzag’ coastline that is vulnerable to typhoon storm surge disasters. Northern Guangdong is mainly mountainous and has no coastal cities. Compared to the other parts of the province, it is relatively less progressive in economic and social development and is vulnerable to wind and rain disasters resulting from typhoons [34]. The coastal cities in Guangdong Province are densely populated. Storm surge disasters in densely populated and low-lying coastal areas have significant social and economic impacts [35]. Therefore, this paper focused on the coastal areas of Guangdong Province, the extent of which is shown in the red box in Figure 1 below.
2.2. Research Methods
The prediction of short-term water level trends and extremely high water level values are important bases for emergency decision making, so this study focused on forecasting the future water level and extremely high water level values during storm surge events. To achieve this, we employed the MIKE21 software to simulate historical typhoon data for typhoons that landed in Guangdong Province between 1991 and 2018. Leveraging the ConvLSTM network, known for its ability to capture spatiotemporal information, we predicted water levels during storm surges. This included both direct water level predictions and indirect predictions based on water level changes. At the same time, we considered the effectiveness of emergency response and used the random forest model to predict the maximum water level of storm surges. The research route is shown in Figure 2.
In this paper, we employed the MIKE21 numerical simulation software to generate the data necessary for training our machine learning model. The MIKE 21 system is a thorough modeling tool designed for simulating hydraulics and hydraulic-related processes in estuaries, coastal waterways, and oceans. It is applicable to any two-dimensional free-surface flow where stratification is not present. This versatile software encompasses various modules for simulating hydrodynamics, advection–dispersion, short waves, sediment transport, water quality, eutrophication, and heavy metals [36]. The MIKE series of software, including MIKE21, offers a user-friendly interface. Users can create grids based on terrain data, implement hot starts to continue interrupted calculations seamlessly and establish control structures like piers, culverts, gates, turbines, etc. The simulation results can be dynamically visualized within the software. Additionally, they can be exported in formats compatible with common Geographic Information System (GIS) software, such as shapefile, facilitating further processing and visualization using external tools. In this study, the FLOW MODEL module of MIKE21 software was used in our numerical simulation of typhoon storm surge. This software is based on the hydrodynamic model for numerical simulation of water waves, currents, and environments in estuaries, coasts, bays, lakes, rivers, and oceans, and has been widely used in some large projects in many countries and regions, such as the South–North Water Transfer Project and the Yangtze River Estuary Comprehensive Management Project.
The historical typhoon path data required by the MIKE21 numerical simulation software were obtained from the China Meteorological Typhoon Online, available at: http://typhoon.nmc.cn/ (accessed on 1 August 2023). The administrative boundaries data of Guangdong Province were obtained from the 2015 China’s Township Administrative Division Boundary Data downloaded from the Resource and Environment Science and Data Center of the Chinese Academy of Sciences [37]. The coastal DEM (Digital Elevation Model) data of Guangdong Province were obtained from the global relief model ETOPO1 downloaded from the National Centers for Environmental Information [38]. Using the MIKE21 software, we conducted simulations for historical typhoons that made landfall in Guangdong Province between 1991 and 2018. This simulation generated the hourly water level data surface file, which we subsequently exported in ‘XYZ’ format for the study area’s hourly water level data.
To make spatiotemporal predictions of water levels, it is crucial for the prediction model to effectively capture both spatial and temporal information from temporal imagery. To achieve this, we chose the ConvLSTM network which has advantages in extracting spatiotemporal information. The ConvLSTM network represents an improvement of the LSTM network. The LSTM was first proposed in 1997. Compared to standard feedforward neural networks, its feedback connections establish correlations on the timing of input sequences, making it widely used in processing various timing problems. The cell structures of LSTM and ConvLSTM are shown in Figure 3 [27,39,40].
A comparison of the two cell structures shows that ConvLSTM integrates spatial feature extraction into the LSTM network. It achieves this by replacing a portion of LSTM’s connection operations with convolutional operations, which excel in extracting spatial features from data. Larger convolution kernels have wider perceptual fields, which make them suitable for capturing target features with faster motion, while smaller convolution kernels are better suited for the capture of target features with slower motion. Therefore, ConvLSTM uses convolution operations to generate a good spatial representation of each frame and uses LSTM to encode temporal variations within the sequence [41]. ConvLSTM’s unique strength lies in its dual capacity for temporal modeling and spatial characterization. This makes it particularly suitable for forecasting physical quantities characterized by strong spatiotemporal correlations. In this paper, we comprehensively utilized the calculation results generated by the Mike 21(2019) software to construct four different datasets. We trained ConvLSTM models on these four datasets separately and validated and compared their predictive capabilities.
In our pursuit of predicting maximum water levels, we opted for a random forest algorithm. Initially introduced by Leo Breiman and Adele Cutler, this algorithm has found wide-ranging applications across domains such as medicine, ecology, economics, and management. It excels in both classification and regression tasks by refining and analyzing the information of sample data, making it particularly effective in handling complex, multi-criteria, nonlinear problems with remarkable adaptability. The random forest algorithm first extracts multiple sample sets through the bagging method and then uses a collection of decision trees as meta-learners to create a consolidated classification or regression model. In classification tasks, the mode rule determines the outcome, while regression problems rely on averaging to arrive at the ultimate result.
2.3. Data Processing and Model Construction
2.3.1. Construction of the ConvLSTM Model
We employed MIKE21 software to conduct simulations for the historical typhoons that made landfall in Guangdong province between 1991 and 2018, output hourly water level data surface files, and exported the hourly water level data of the study area in XYZ format. However, it is important to note that the data output by the MIKE21 software does not conform to a regular grid structure, making it incompatible for direct input into the ConvLSTM neural network. To address this issue, we undertook an interpolation process for the hourly water level data produced by the MIKE21 software. The goal was to transform this data into a grid image with dimensions of 100 × 200, ensuring compatibility with the ConvLSTM neural network.
Given the substantial time required for a single training run of the ConvLSTM model, in order to obtain better prediction results faster, we pre-trained the LSTM network with a shorter training time to determine the optimal input sequence length. We first selected 20 points evenly distributed within the study area, extracted the water level data of these points from the MIKE21 output data, constructed sequence datasets with differing lengths, and input them into the LSTM model for training. The constructed LSTM model comprised two LSTM layers, each with 50 neurons, followed by a fully connected layer. We employed a mean squared error (MSE) loss function and utilized the Adam optimizer for training. To ensure robustness, we repeated the training process for each point three times. We assessed the model’s performance using metrics such as mean squared error (MSE) and mean absolute error (MAE) on the test dataset. The statistical results are depicted in Figure 4. According to Figure 4, the trained LSTM model performs better when the length of the input sequence is 7, 8, 9, or 10. After weighing these results comprehensively, we determined the ideal input sequence length for the ConvLSTM model to be 9.
When predicting water levels for storm surges, there are two distinct approaches: one involves the direct prediction of water level values, while the other relies on the indirect prediction of water level values based on changes in water levels. To explore both methods, we conducted experiments that necessitated the construction of two distinct datasets. Drawing from the sequence length determined in the preceding step, we first construct our Water Level Dataset. This involved selecting temporally adjacent water level image data to create a series of image sequences, each with a length of 10. The initial 9 sequences served as input sequences, while the 10th sequence served as the corresponding label. The time interval between adjacent sequences is 1 h. Following this, we proceeded to construct the Water Level Changes Dataset. We use the hourly water level data to perform the first difference to obtain the water level change data at each moment compared to the previous moment and select the time-adjacent water level change data to form a series of 10 image sequences to construct the dataset. The Water Level Dataset comprises 3724 sequences, while the Water Level Change Dataset comprises 3690 sequences.
After obtaining the two datasets, our next step was to construct a model designed to predict the subsequent image in a sequence using the initial nine images. This model architecture comprises three ConvLSTM layers and one Conv2D layer. The ConvLSTM layers are configured with convolutional kernel sizes of 3 × 3, 3 × 3, and 1 × 1, respectively, employ the ‘ReLu’ activation function, and utilize 64 filters. Meanwhile, the Conv2D layer features a convolutional kernel size of 3 × 3, utilizes the ‘sigmoid’ activation function, and operates with 64 filters. To maintain consistent feature map sizes throughout the intermediate processes, each layer employs the ‘padding’ setting. During training, our model employs the mean squared error (MSE) as the loss function, utilizes the ‘Adam’ optimizer with a dynamically adjusted learning rate, and a batch size of 8. Additionally, our model incorporates an early stopping strategy to optimize performance.
2.3.2. Construction of the Random Forest Model
The formation and trend of storm surges are intricate natural phenomena influenced by a multitude of factors. The value of typhoon storm surge water increase is influenced by various elements, including wind, air pressure, typhoon intensity, typhoon paths, sea conditions, and more, which are extremely complex processes. In this study, while considering both natural and topographical variables, we have carefully selected ten key factors for examination: minimum center pressure, maximum wind speed, center pressure at landing, wind speed at landing, typhoon intensity at landing, landing location, landing direction (angle between the typhoon’s path and coastline as it approaches), minimum pressure at the location where the maximum water increase is to be predicted, maximum wind speed at the location where the maximum water increase is to be predicted, and duration.
Among the selected features, both typhoon intensity and landfall location are character-type data, requiring quantification. Following the guidelines of the national standard “Grade of tropical cyclones” (GB/T 19201-2006), the typhoon intensity is categorized into six levels based on the maximum mean wind speed near the center of the typhoon bottom. These levels are tropical depression (TD), tropical storm (TS), severe tropical storm (STS), typhoon (TY), severe typhoon (STY), and super typhoon (SuperTY). For the sake of convenience of computation, we mapped these intensity levels to numerical values from 1 to 6, respectively. In addition, based on the administrative boundaries of China, the coastline of Guangdong Province was divided according to its municipal level and assigned integer codes in order from north to south. It is important to note that all other features are numerical in nature and do not require any further processing.
Once the input factors were determined, the next critical step involved establishing the parameters for the random forest model. Key parameters for the random forest model include the following:
- The maximum number of decision trees (n_estimators). Selecting an appropriate maximum number of decision trees is crucial, as too few or too many trees can lead to underfitting or overfitting, respectively.
- The maximum number of features considered when dividing the nodes of the decision tree (max_features). Typically, this parameter is set to ‘auto’ or ‘log2.’ However, in scenarios with a substantial number of features, it becomes important to choose an appropriate value to balance the trade-off between the speed and quality of decision tree generation.
- The maximum depth allowed for the decision tree (max_depth). In cases with extensive data and numerous features, decision trees can become excessively large. To prevent overfitting, it is essential to limit the maximum depth of the decision tree.
- The minimum samples required for node splitting (min_samples_split). This parameter governs when internal nodes of the decision tree can continue to split. If the sample size at a node falls below this threshold, further division is halted.
- The minimum number of samples contained at the leaf node (min_samples_leaf). When the number of samples at a leaf node drops below this value, both the node and its brother nodes are pruned.
Configuring these parameters effectively is crucial to optimizing the performance of the random forest model.
The random forest model employs random sampling with replacement, leading to instances where a portion of the training set (approximately 37%) is excluded from a decision tree’s sample set. This unselected segment is termed out-of-bag data (OOB), and the process of evaluating the model using the out-of-bag data is called OOB estimation. The resulting OOB score is an important parameter for judging the generalization ability of the random forest model. A higher OOB score indicates better predictive performance and improved generalization ability. Therefore, we prioritized the OOB score as the key factor in selecting the parameters for our random forest model. During the parameter determination process, we utilized the grid search algorithm to identify the parameter set that yielded the highest OOB scores. The final selection of parameters is as follows (Table 1).
3. Results and Discussion
3.1. Spatiotemporal Water Level Prediction Based on the ConvLSTM Model
We divided both the Water Level Dataset and the Water Level Change Dataset into a training set and a validation set in a 9:1 ratio. Subsequently, we employed the same ConvLSTM model to train on these two datasets for water level prediction and water level change prediction, respectively. All the models were trained on the same hardware, an RTX 3090 NVIDIA GPU with 24 GB of VRAM. The training time for the ConvLSTM model took around 5 h.
After the above steps, we obtained two models trained on different training sets. To assess the reliability and effectiveness of these models, we chose the storm surge water gain process of Super-Typhoon Usagi (International No.: 1319) as a test case. Super-Typhoon Usagi made landfall off the southern coast of Shanwei City, Guangdong Province, in 2013 and was one of the most intense western North Pacific Tropical Cyclones of that year [42]. Importantly, the data related to this typhoon were not included in the training of our ConvLSTM models. In addition, the actual water level measurement data of Henglan Island Station (114.182° E, 22.110° N) during Typhoon Usagi were selected to validate the model’s predictions. These actual water level measurement data at the tide check station were obtained from the integrated water level dataset at the National Marine Data Center.
3.1.1. Results of One-Step Prediction
We conducted tests on the two trained models following the previously outlined approach, and both models demonstrated excellent performance on the test datasets. To assess the accuracy of these network models, we evaluated their predictions for the next hour by comparing them with the true data, utilizing mean absolute error (MAE) and mean squared error (MSE) metrics.
For illustrative purposes, let us consider the prediction results for 20 September 2013, at 10:00 a.m. as an example. The prediction results of the model trained on the Water Level Dataset are shown in Figure 5, and the prediction results of the model trained on the Water Level Change Dataset are shown in Figure 6:
To assess the predictive capabilities of the two models, we calculated the MAE by comparing the predictions of the ConvLSTM model and the true values. The spatial distribution of the MAE for the model trained on the Water Level Dataset is shown in Figure 7, and the MAE distribution for the model trained on the Water Level Change Dataset is displayed in Figure 8.
It can be seen from Figure 5 and Figure 6 that the prediction results of both models can obtain the results that are generally consistent with the simulation results of the MIKE21 software. From Figure 7 and Figure 8, it can be seen that the absolute error value of the prediction of both models is less than 0.2 m in the majority of areas, and only sporadically greater than 0.2 m. Notably, areas near the coastline tend to exhibit larger absolute error values in the predictions of both models.
The above results are the global results of the prediction of water level data in the study area. In order to comprehensively evaluate the reliability of the model, we arbitrarily selected a point and extracted its prediction results from the global prediction results. We then combined these with the simulation results of the MIKE21 software to show the prediction and true values of the local point during the whole typhoon, which are shown in Figure 9 and Figure 10.
As can be seen in Figure 9 and Figure 10, the results of both prediction methods are in good agreement with the MIKE21 simulation results on the test set. At the same time, we also confirmed that the relatively accurate single-point prediction results can be extracted from the global space prediction results. Furthermore, we have generated residual violin plots illustrating the discrepancies between the predicted values and the actual values for both models at this point, as depicted in Figure 11. Comparing the two violin plots reveals that the model trained on the Water Level Dataset exhibits greater dispersion and variation in its residuals. In contrast to the model trained on the Water Level Dataset, the model trained on the Water Level Change Dataset demonstrates higher accuracy.
In order to quantitatively compare the strengths and weaknesses of the two models trained on distinct datasets, we selected two performance indicators, MAE and MSE, for a comprehensive statistical analysis of their predictive results on the test dataset. The results are summarized in Table 2.
Upon reviewing the values in the table, it becomes apparent that the indirect prediction of water level based on forecasting water level changes yields superior results compared to direct water level prediction. Because the activation function of the neural network model we built is always a bounded function, the value range within the domain of water level change is smaller and more concentrated than that of the water level value, which is more favorable to use the model for prediction.
Furthermore, we conducted experiments to evaluate the MAE and MSE of model predictions on the training set using the model trained on datasets of different sizes. As shown in Figure 12, with the increase in dataset size, both models exhibited decreasing MAE and MSE values. Notably, the model trained on the Water Level Dataset displayed a more substantial variation in its predictions as the dataset size increased compared to the model trained on the Water Level Change Dataset. This suggests that the ConvLSTM model can achieve satisfactory predictions with a smaller dataset when trained on the Water Level Change Dataset.
3.1.2. Results of Multi-Step Prediction
The above results are based on using the hourly water level or water level change data of the current time and the past 8 h to predict the water level or water level change data of the next 1 h. Now we use the hourly water level or water level change data of the current time and the past 8 h to predict the water level or water level change data of the following 12 h by recursive multi-step forecasting method. To assess the performance of both models in predicting longer timeframes, we employ MAE as a statistical metric. Using 10:00 a.m. on 20 September 2013 as the initial moment, we investigate the models’ effectiveness in predicting extended time periods.
As can be seen from Figure 13, the model trained on the Water Level Change Dataset consistently exhibits superior performance compared to the model trained on the Water Level Dataset when predicting longer time spans. Using data of the current time and the previous 8 h to predict the water level or water level change in the next 6 h has relatively good reliability. However, as the prediction time becomes longer, the prediction results are generally becoming worse.
3.1.3. Verification Using Measured Data
In the previous section, the prediction results of the two models were statistically compared, and the prediction results of the model trained on the Water Level Change Dataset performed better, and the prediction results of the water level could not be directly compared due to the inconsistency of reference level benchmark between the solution results of the Mike21 software and the data of tide gauge station. Therefore, in this section, the prediction was based on the model trained on the Water Level Change Dataset, and the model was validated using the actual water level measurements at Henglan Island Station during Typhoon Usagi to investigate whether the predictions of the model are consistent with the actual measurements.
We extracted the water level change prediction results of Henglan Island Station during Typhoon Usagi from the space prediction results of the model and compared them with the actual water level measurement data of Henglan Island Station. The results are shown in the following Figure 14 and Figure 15.
As can be seen from Figure 14 and Figure 15, the predicted values of the water level change at Henglan Island Station are roughly in line with the actual water level measurement data, and the predicted results are credible. However, the model’s predictions exhibit an underestimation of the water level changes. In addition, the MAE of the predicted values at Henglan Island Station was 0.059 m, with 80% of the absolute values of the difference between predicted and measured values being less than 10 cm and 90% of the absolute values of the difference between predicted and measured values being less than 20 cm. These results underscore the ConvLSTM model’s capability to credibly forecast storm-surge-induced water level changes.
3.1.4. Prediction Results after Adding Feature Channels
We want to use as few features as possible to realize the forecast while ensuring accuracy. However, for the sake of completeness of the experiment, we emulated the driving mechanisms of the MIKE21 software and attempted to incorporate features of sea-level wind and pressure to test the impact of more features on the predicted results.
We added sea-level wind speed and air pressure to the Water Level Dataset to construct the Ocean Multi-Parameter Dataset and added sea surface wind speed change and air pressure change to the Water Level Change Dataset to construct the Ocean Multi-Parameter Change Dataset. Then, based on the model construction method in Section 2.3.1, we constructed the model by changing the input data of channel 1 in the model to three channels, while keeping the other parameters unchanged. After the training on the Ocean Multi-Parameter Dataset and the Ocean Multi-Parameter Change Dataset, we obtained two models trained on different datasets. To assess the influence of the sea-level wind and air pressure on the prediction, we took the difference between the spatial distributions of models trained on Ocean Multi-Parameter Dataset and Water Level Dataset, as well as between the MAE spatial distributions of models trained on Ocean Multi-Parameter Change Dataset and Water Level Change Dataset. The results are shown in Figure 16.
As can be seen in Figure 16, the addition of wind and air pressure data has led to improved prediction accuracy across most regions. The accuracy of water level predictions has witnessed a more significant enhancement compared to water level change predictions. Nonetheless, it is essential to note that the addition of wind and air pressure information has also brought about increased prediction errors in certain areas. Specifically, in the deeper inland regions of the sea and some peripheral areas within the study area, the model’s prediction errors have expanded, resulting in decreased accuracy.
3.2. Maximum Water Level Prediction Based on Random Forest Algorithm
3.2.1. Model Validation
We trained the random forest model using the parameters specified in Table 1 on the training samples and subsequently validated it on the test samples. Figure 17 shows the prediction results for the training samples, while Table 3 shows the prediction results for the test samples.
It can be seen that the model’s prediction accuracy for the training samples is high, and the curves basically match. The predictions of test samples are basically consistent with the true value, indicating that the predicted value can reflect the true value to some extent. The prediction model has a high generalization ability; however, it is important to note that the limited sample size imposes constraints on achieving even higher predictive performance. Despite this limitation, this model still can be used as a reference for real-time prediction of the maximum water level increase caused by typhoon and storm surge disasters in the affected area and provides a reference for local governments and departments in emergency response.
3.2.2. Feature Importance
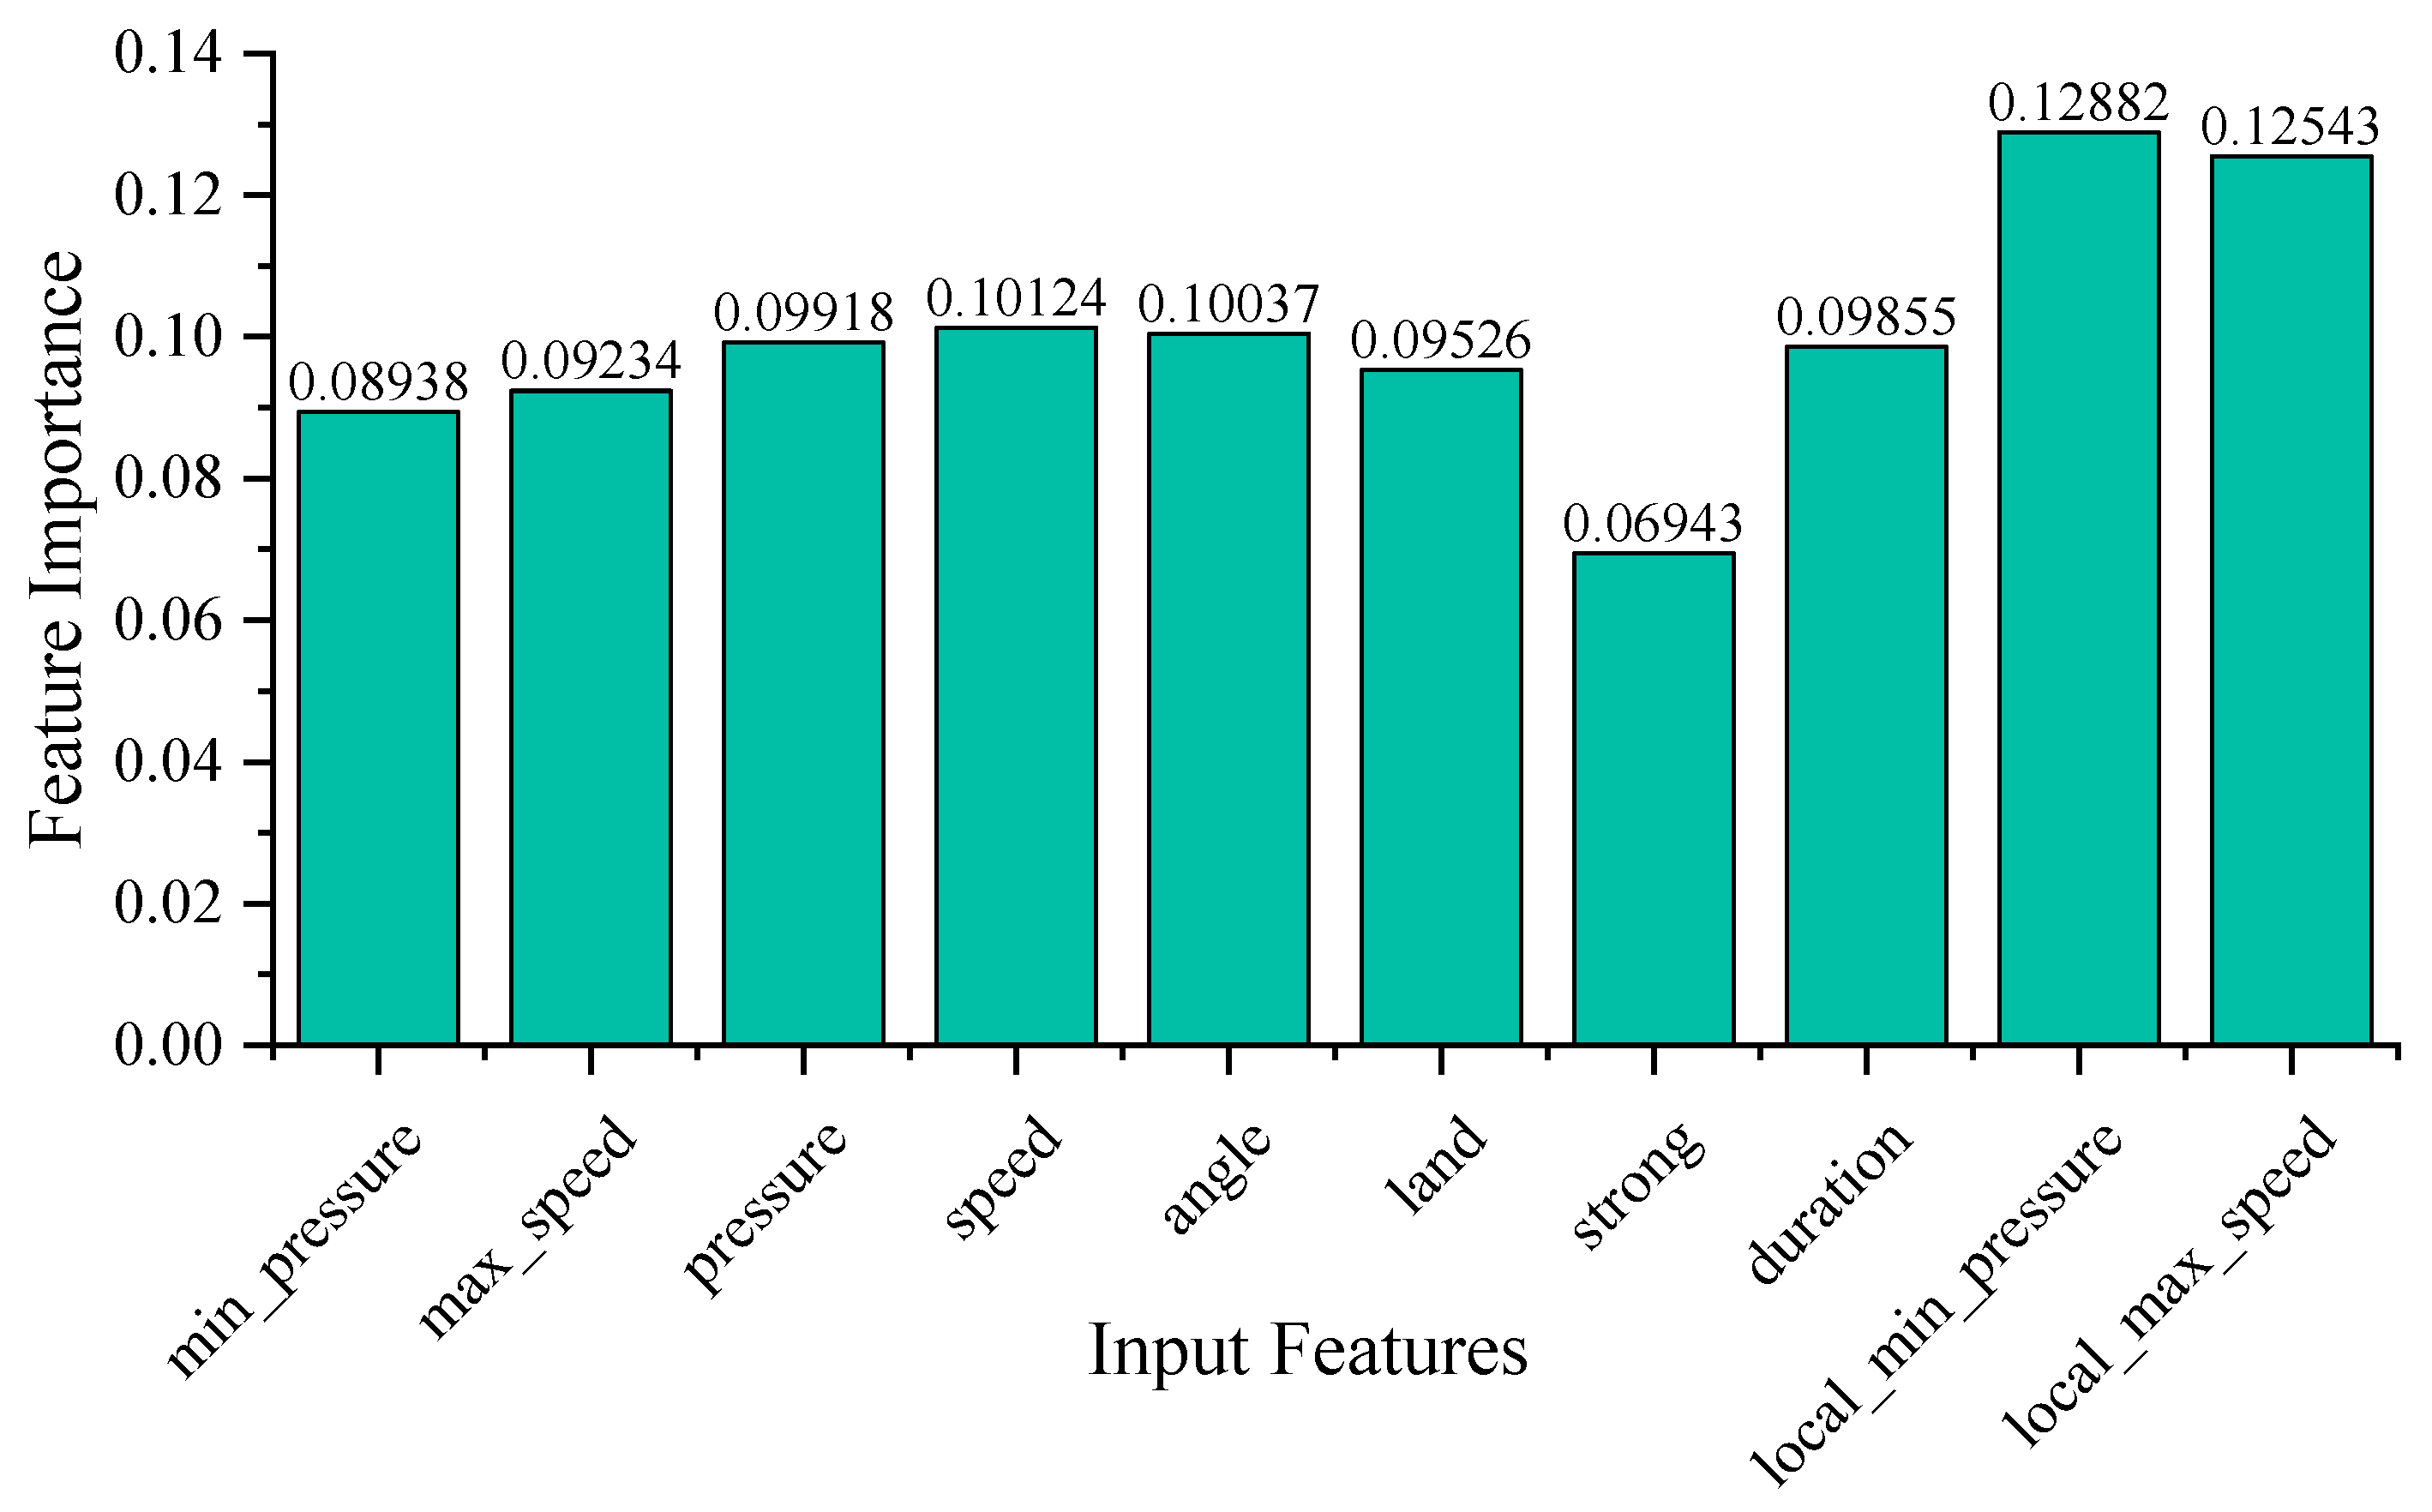
We selected ten key features for predicting the maximum water level increase: minimum center pressure (min_pressure), maximum wind speed (max_speed), center pressure at landing (pressure), wind speed at landing (speed), typhoon intensity at landing (strong), landing location (land), landing direction (angle), minimum pressure at the target location (local_min_pressure), maximum wind speed at the target location (local_max_speed), and duration. To analyze the features that affect the maximum water level increase in the typhoon storm surge, we computed the feature importance as shown in Figure 18.
As can be seen in Figure 18, the factors that have the greatest impact on the maximum water increase are the maximum wind speed and minimum central pressure at the location where the maximum water increase is to be predicted, which is consistent with public perception. Secondly, the two factors of landing direction and landing location also exhibit significant impacts on the maximum water increase. Typhoons with identical inherent characteristics (e.g., pressure, wind speed, intensity) but landing at distinct locations and angles produce varying water level effects. This variation can be attributed to the divergent terrain conditions at different landing sites, indirectly emphasizing the role of topographical factors in influencing maximum water level increase. The similarity in the importance scores of features “min_pressure” and ”max_speed”, “pressure” and ” speed”, and “local_min_pressure” and ”local_max_speed” can be attributed to their strong correlations. These closely correlated pairs of features tend to contribute almost equally to the model’s performance, resulting in closely aligned importance scores. “strong”, “pressure”, and “speed” are also highly correlated features. However, the distinct classification levels set them apart. While typhoon intensity is categorized on a limited scale of only six levels, the finer granularity of air pressure and wind speed provides a more intricate spectrum of information. So, these two latter features have the capacity to form nodes at a deeper level within a decision tree or random forest model. This deeper segmentation allows them to unearth finer patterns and intricate relationships within the dataset. Consequently, air pressure and wind speed may garner higher importance scores within the model, as they possess the capability to capture more nuanced nuances and dependencies within the data.
4. Conclusions
In the context of storm surge water level prediction, the primary concerns revolve around forecasting future water levels and determining the maximum water level. The future trend of the water level and the maximum value of the water level serve as crucial pillars for disaster relief and emergency response efforts. Accurate predictions in these aspects can significantly mitigate the potential damage posed by storm surges to both lives and property. Most of the current research on storm surge water level prediction based on machine learning methods is primarily focused on point predictions. However, in this paper, we leveraged the ConvLSTM machine learning model, utilizing data encompassing water levels, air pressure, and wind speed, to construct predictive models for spatial water levels and water level changes. From the results shown above, all the trained models have demonstrated the capability to make reliable predictions concerning storm surge water levels. Compared to the complexity of the hydrodynamic model in the MIKE21 software, the ConvLSTM model is simple and easy to use and can make good short-term predictions for relevant departments or personnel to refer to in the absence of terrain, boundary conditions, and other factors. In addition, we used data from 35 historical typhoons that made landfall in Guangdong Province from 1991 to 2018 and selected ten factors—minimum center pressure, maximum wind speed, center pressure at landing, wind speed at landing, typhoon intensity at landing, landing location, landing direction, minimum pressure at the location where the maximum water level is to be predicted, maximum wind speed at the location where the maximum water level is to be predicted, and duration—to construct the random forest model for predicting the maximum water increase value of typhoon storm surge at target location. Model validation results affirm that the random forest model developed in this study can serve as a valuable reference for forecasting maximum water levels in typhoon-induced storm surges. However, the limited amount of data affects the credibility of model validation and the establishment of the significance of the model’s performance. In the future work of this thesis, it is necessary to investigate the implementation of synthetic typhoon data generation methods to augment our dataset, particularly for use with random forest models. Additionally, we plan to explore and evaluate alternative spatiotemporal prediction models beyond ConvLSTM to assess their performance and suitability for our specific application. These efforts are expected to contribute to a deeper understanding of prediction methodologies and potentially enhance the accuracy and robustness of our predictive models in the context of typhoon-related water level forecasting.
Author Contributions
Conceptualization, Q.Z.; Data curation, Y.L., Q.Z. and N.L.; Investigation, Y.L., C.H. and N.L.; Methodology, Y.L.; Project administration, Q.Z.; Resources, C.H. and N.L.; Software, Y.L., C.H. and N.L.; Supervision, Q.Z. and C.H.; Writing—original draft, Y.L.; Writing—review and editing, Q.Z. All authors have read and agreed to the published version of the manuscript.
Funding
This work was supported in part by the National Key Research and Development Program of China under Grant 2022YFC3105100.
Institutional Review Board Statement
Not applicable.
Informed Consent Statement
Not applicable.
Data Availability Statement
Data sharing is not applicable to this article due to privacy.
Acknowledgments
We are grateful to the National Science and Technology Resources Sharing Service Platform-National Marine Data Center (http://mds.nmdis.org.cn/, accessed on 1 August 2023) for providing data support. Additionally, we extend our sincere gratitude to Tsinghua University for providing access to the MIKE21 software.
Conflicts of Interest
The authors declare no conflict of interest.
References
- Wu, S.; Luo, Y.; Wang, H.; Gao, J.; Li, C. Climate change impacts and adaptation in China: Current situation and future prospect. Kexue Tongbao/Chin. Sci. Bull. 2016, 61, 1042–1054. [Google Scholar] [CrossRef]
- Webster, P.J.; Holland, G.J.; Curry, J.A.; Chang, H.-R. Changes in tropical cyclone number, duration, and intensity in a warming environment. Science 2005, 309, 1844–1846. [Google Scholar] [CrossRef] [PubMed]
- Hoyos, C.D.; Agudelo, P.A.; Webster, P.J.; Curry, J.A. Deconvolution of the factors contributing to the increase in global hurricane intensity. Science 2006, 312, 94–97. [Google Scholar] [CrossRef] [PubMed]
- Michaels, P.J.; Knappenberger, P.C.; Davis, R.E. Sea-surface temperatures and tropical cyclones in the Atlantic basin. Geophys. Res. Lett. 2006, 33, L09708. [Google Scholar] [CrossRef]
- Hsiao, S.-C.; Chiang, W.-S.; Chen, W.-B. Storm tide and wave simulations and assessment. J. Mar. Sci. Eng. 2021, 9, 84. [Google Scholar] [CrossRef]
- Lin, N.; Emanuel, K.; Oppenheimer, M.; Vanmarcke, E. Physically based assessment of hurricane surge threat under climate change. Nat. Clim. Change 2012, 2, 462–467. [Google Scholar] [CrossRef]
- Du, H.; Yu, P.; Zhu, L.; Fei, K.; Gao, L. Assessing the performances of parametric wind models in predicting storm surges in the Pearl River Estuary. J. Wind Eng. Ind. Aerodyn. 2023, 232, 105265. [Google Scholar] [CrossRef]
- Tan, C.; Fang, W. Mapping the wind hazard of global tropical cyclones with parametric wind field models by considering the effects of local factors. Int. J. Disaster Risk Sci. 2018, 9, 86–99. [Google Scholar] [CrossRef]
- Jelesnianski, C.P. SLOSH: Sea, Lake, and Overland Surges from Hurricanes; US Department of Commerce, National Oceanic and Atmospheric Administration: Washington, DC, USA, 1992; Volume 48.
- Heaps, N.S. A two-dimensional numerical sea model. Philos. Trans. R. Soc. London. Ser. A Math. Phys. Sci. 1969, 265, 93–137. [Google Scholar]
- Warren, I.; Bach, H.K. MIKE 21: A modelling system for estuaries, coastal waters and seas. Environ. Softw. 1992, 7, 229–240. [Google Scholar] [CrossRef]
- Roelvink, J.; Van Banning, G. Design and development of DELFT3D and application to coastal morphodynamics. Oceanogr. Lit. Rev. 1995, 11, 925. [Google Scholar]
- Luettich, R.A.; Westerink, J.J. Formulation and Numerical Implementation of the 2D/3D ADCIRC Finite Element Model Version 44. XX; Luettich, R., Ed.; University of North Carolina: Chapel Hill, NC, USA, 2004; Volume 20. [Google Scholar]
- Chen, C.; Beardsley, R.C.; Cowles, G.; Qi, J.; Lai, Z.; Gao, G. An Unstructured Grid, Finite-Volume Coastal Ocean Model: FVCOM User Manual; SMAST/UMASSD: New Bedford, MA, USA, 2006; pp. 6–8. [Google Scholar]
- Palani, S.; Liong, S.-Y.; Tkalich, P. An ANN application for water quality forecasting. Mar. Pollut. Bull. 2008, 56, 1586–1597. [Google Scholar] [CrossRef]
- Yu, Y.; Si, X.; Hu, C.; Zhang, J. A review of recurrent neural networks: LSTM cells and network architectures. Neural Comput. 2019, 31, 1235–1270. [Google Scholar] [CrossRef] [PubMed]
- Khan, M.S.; Coulibaly, P. Application of support vector machine in lake water level prediction. J. Hydrol. Eng. 2006, 11, 199–205. [Google Scholar] [CrossRef]
- Ikram, R.M.A.; Ewees, A.A.; Parmar, K.S.; Yaseen, Z.M.; Shahid, S.; Kisi, O. The viability of extended marine predators algorithm-based artificial neural networks for streamflow prediction. Appl. Soft Comput. 2022, 131, 109739. [Google Scholar] [CrossRef]
- Adnan, R.M.; Mostafa, R.R.; Dai, H.-L.; Heddam, S.; Kuriqi, A.; Kisi, O. Pan evaporation estimation by relevance vector machine tuned with new metaheuristic algorithms using limited climatic data. Eng. Appl. Comput. Fluid Mech. 2023, 17, 2192258. [Google Scholar] [CrossRef]
- Mostafa, R.R.; Kisi, O.; Adnan, R.M.; Sadeghifar, T.; Kuriqi, A. Modeling potential evapotranspiration by improved machine learning methods using limited climatic data. Water 2023, 15, 486. [Google Scholar] [CrossRef]
- Adnan, R.M.; Mostafa, R.R.; Islam, A.R.M.T.; Kisi, O.; Kuriqi, A.; Heddam, S. Estimating reference evapotranspiration using hybrid adaptive fuzzy inferencing coupled with heuristic algorithms. Comput. Electron. Agric. 2021, 191, 106541. [Google Scholar] [CrossRef]
- Adnan, R.M.; Dai, H.-L.; Mostafa, R.R.; Islam, A.R.M.T.; Kisi, O.; Heddam, S.; Zounemat-Kermani, M. Modelling groundwater level fluctuations by ELM merged advanced metaheuristic algorithms using hydroclimatic data. Geocarto Int. 2023, 38, 2158951. [Google Scholar] [CrossRef]
- Ikram, R.M.A.; Mostafa, R.R.; Chen, Z.; Islam, A.R.M.T.; Kisi, O.; Kuriqi, A.; Zounemat-Kermani, M. Advanced hybrid metaheuristic machine learning models application for reference crop evapotranspiration prediction. Agronomy 2022, 13, 98. [Google Scholar] [CrossRef]
- Kim, S.Y.; Matsumi, Y.; Shiozaki, S.; Ota, T. A study of a real-time storm surge forecast system using a neural network at the Sanin Coast, Japan. In Proceedings of the 2012 Oceans, Hampton Roads, VA, USA, 14–19 October 2012; pp. 1–7. [Google Scholar]
- Liu, Y.; Zhang, L.; Li, L.; Liu, Y.; Chen, B.; Zhang, W. Storm surge nowcasting based on multivariable LSTM neural network model. Mar. Sci. Bull. 2020, 39, 689–694. [Google Scholar]
- Hong, S.; Kim, S.; Joh, M.; Song, S.-k. Globenet: Convolutional neural networks for typhoon eye tracking from remote sensing imagery. arXiv 2017, arXiv:1708.03417. [Google Scholar]
- Shi, X.; Chen, Z.; Wang, H.; Yeung, D.-Y.; Wong, W.-K.; Woo, W.-c. Convolutional LSTM network: A machine learning approach for precipitation nowcasting. In Proceedings of the 28th International Conference on Neural Information Processing Systems, Montreal, QC, Canada, 7–12 December 2015; MIT Press: Montreal, QC, Canada, 2015; Volume 1, pp. 802–810. [Google Scholar]
- Lu, W.; Li, J.; Li, Y.; Sun, A.; Wang, J. A CNN-LSTM-based model to forecast stock prices. Complexity 2020, 2020, 6622927. [Google Scholar] [CrossRef]
- Yang, X.; Zhang, J.; Zhou, J.; Fang, W. Multi-source rainfall fusion method based on ConvLSTM. J. Huazhong Univ. Sci. Technol. (Nat. Sci. Ed.) 2022, 50, 33–39. [Google Scholar] [CrossRef]
- Zhou, S.; Xie, W.; Lu, Y.; Wang, Y.; Zhou, Y.; Hui, N.; Dong, C. ConvLSTM-Based Wave Forecasts in the South and East China Seas. Front. Mar. Sci. 2021, 8, 740. [Google Scholar] [CrossRef]
- Kim, S.; Kang, J.-S.; Lee, M.; Song, S.-k. DeepTC: ConvLSTM network for trajectory prediction of tropical cyclone using spatiotemporal atmospheric simulation data. In Proceedings of the Workshop on Modeling and Decision-Making in the Spatiotemporal Domain, 32nd Conference on Neural Information Processing Systems (NeurIPS 2018), Montreal, QC, Canada, 30 September 2018. [Google Scholar]
- Xie, W.; Xu, G.; Dong, C. Research on storm surge floodplain prediction based on ConvLSTM machine learning. Trans. Atmos. Sci. 2022, 45, 674–687. [Google Scholar] [CrossRef]
- Breiman, L. Random forests. Mach. Learn. 2001, 45, 5–32. [Google Scholar] [CrossRef]
- Guo, T.; Li, G.; He, L. Risk assessment of typhoon storm surge based on a simulated annealing algorithm and the least squares method: A case study in Guangdong Province, China. Nat. Hazards Res. 2022, 2, 249–258. [Google Scholar] [CrossRef]
- Jongman, B.; Ward, P.J.; Aerts, J.C. Global exposure to river and coastal flooding: Long term trends and changes. Glob. Environ. Change 2012, 22, 823–835. [Google Scholar] [CrossRef]
- Ying, X.; Zheng, Z.; Ni, J.; Zhao, K. Numerical simulation study on the dynamic impact of typhoon “Mangkhut” storm surge on the sea area near the Hong Kong-Zhuhai-Macao bridge. Phys. Chem. Earth Parts A/B/C 2022, 128, 103269. [Google Scholar] [CrossRef]
- Xu, X. 2015 China’s Township Administrative Division Boundary Data; Resource and Environmental Science Data Registration and Publishing System: Beijing, China, 2023. [Google Scholar] [CrossRef]
- Amante, C.; Eakins, B.W. ETOPO1 Arc-Minute Global Relief Model: Procedures, Data Sources and Analysis; National Centers for Environmental Information: Asheville, NC, USA, 2009. [CrossRef]
- Graves, A. Generating sequences with recurrent neural networks. arXiv 2013, arXiv:1308.0850. [Google Scholar]
- Moishin, M.; Deo, R.C.; Prasad, R.; Raj, N.; Abdulla, S. Designing deep-based learning flood forecast model with ConvLSTM hybrid algorithm. IEEE Access 2021, 9, 50982–50993. [Google Scholar] [CrossRef]
- Han, L.; Ji, Q.; Jia, X.; Liu, Y.; Han, G.; Lin, X. Significant Wave Height Prediction in the South China Sea Based on the ConvLSTM Algorithm. J. Mar. Sci. Eng. 2022, 10, 1683. [Google Scholar] [CrossRef]
- Liu, S.; Tao, D.; Zhao, K.; Minamide, M.; Zhang, F. Dynamics and predictability of the rapid intensification of Super Typhoon Usagi (2013). J. Geophys. Res. Atmos. 2018, 123, 7462–7481. [Google Scholar] [CrossRef]
Figure 1.
The scope of the study area.

Figure 2.
Research route.

Figure 3.
The cell structures of LSTM and ConvLSTM. (a) LSTM; (b) ConvLSTM. denotes the input gate, denotes the forget gate, denotes the output gate, denotes the cell state at the current moment, denotes the past cell status, denotes the final output, denotes the weight matrices, denotes the bias terms, denotes the sigmoid function, × denotes the Hadamard product, and denotes the convolution.
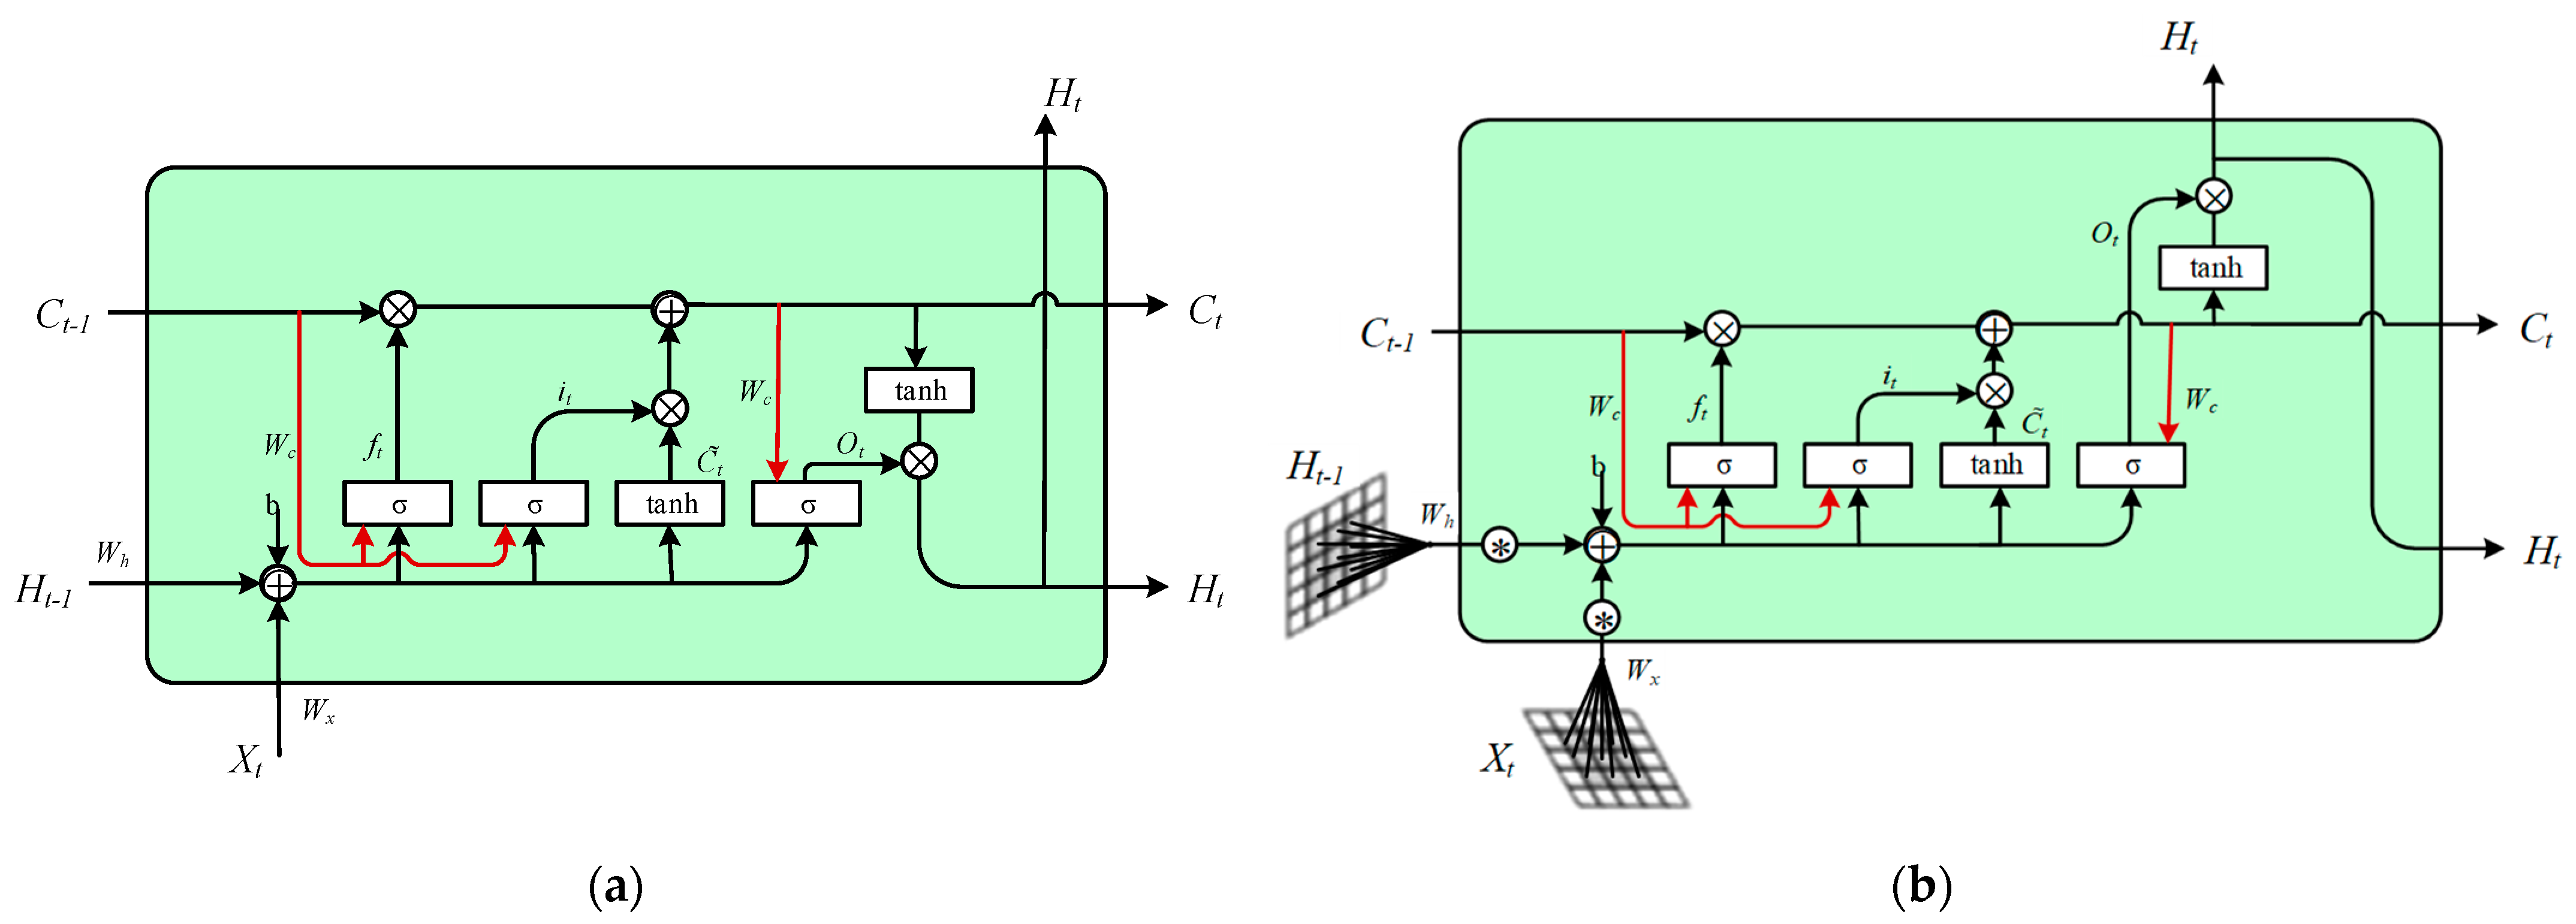
Figure 4.
MSE and MAE statistics of models trained on datasets with different sequence lengths.
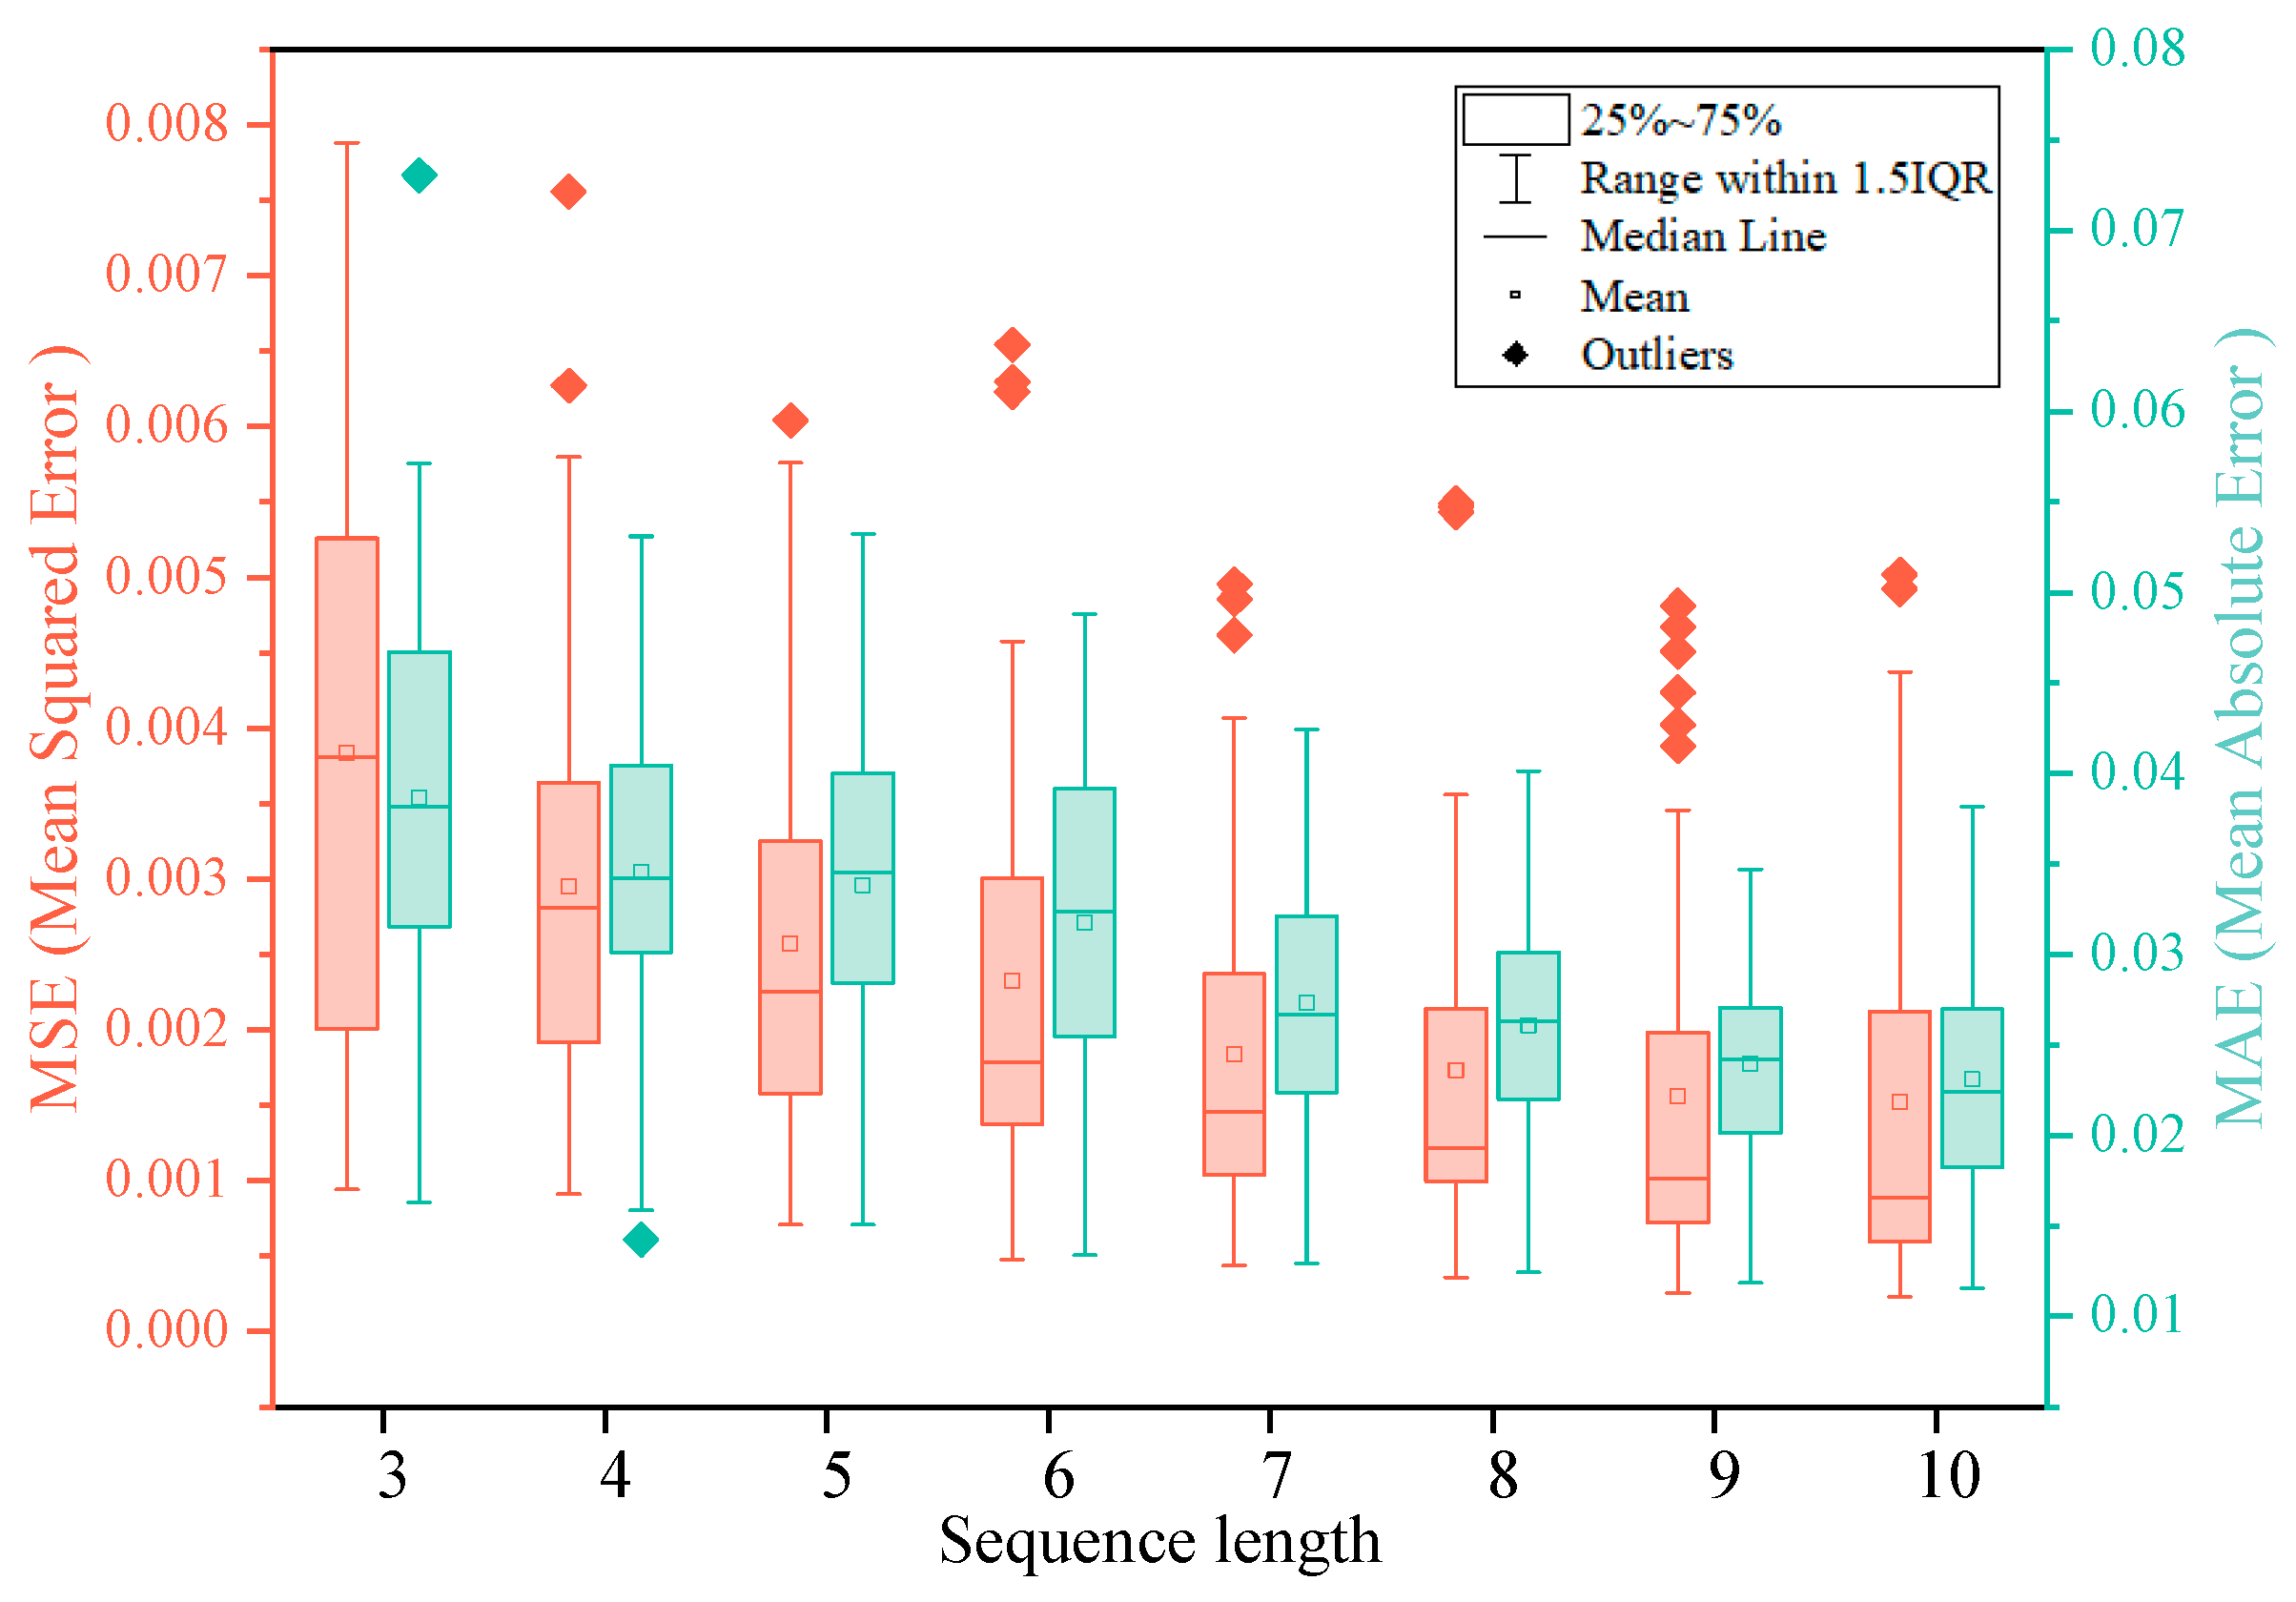
Figure 5.
The prediction result of the model trained on the Water Level Dataset: (a) true value; (b) prediction value.
Figure 5.
The prediction result of the model trained on the Water Level Dataset: (a) true value; (b) prediction value.
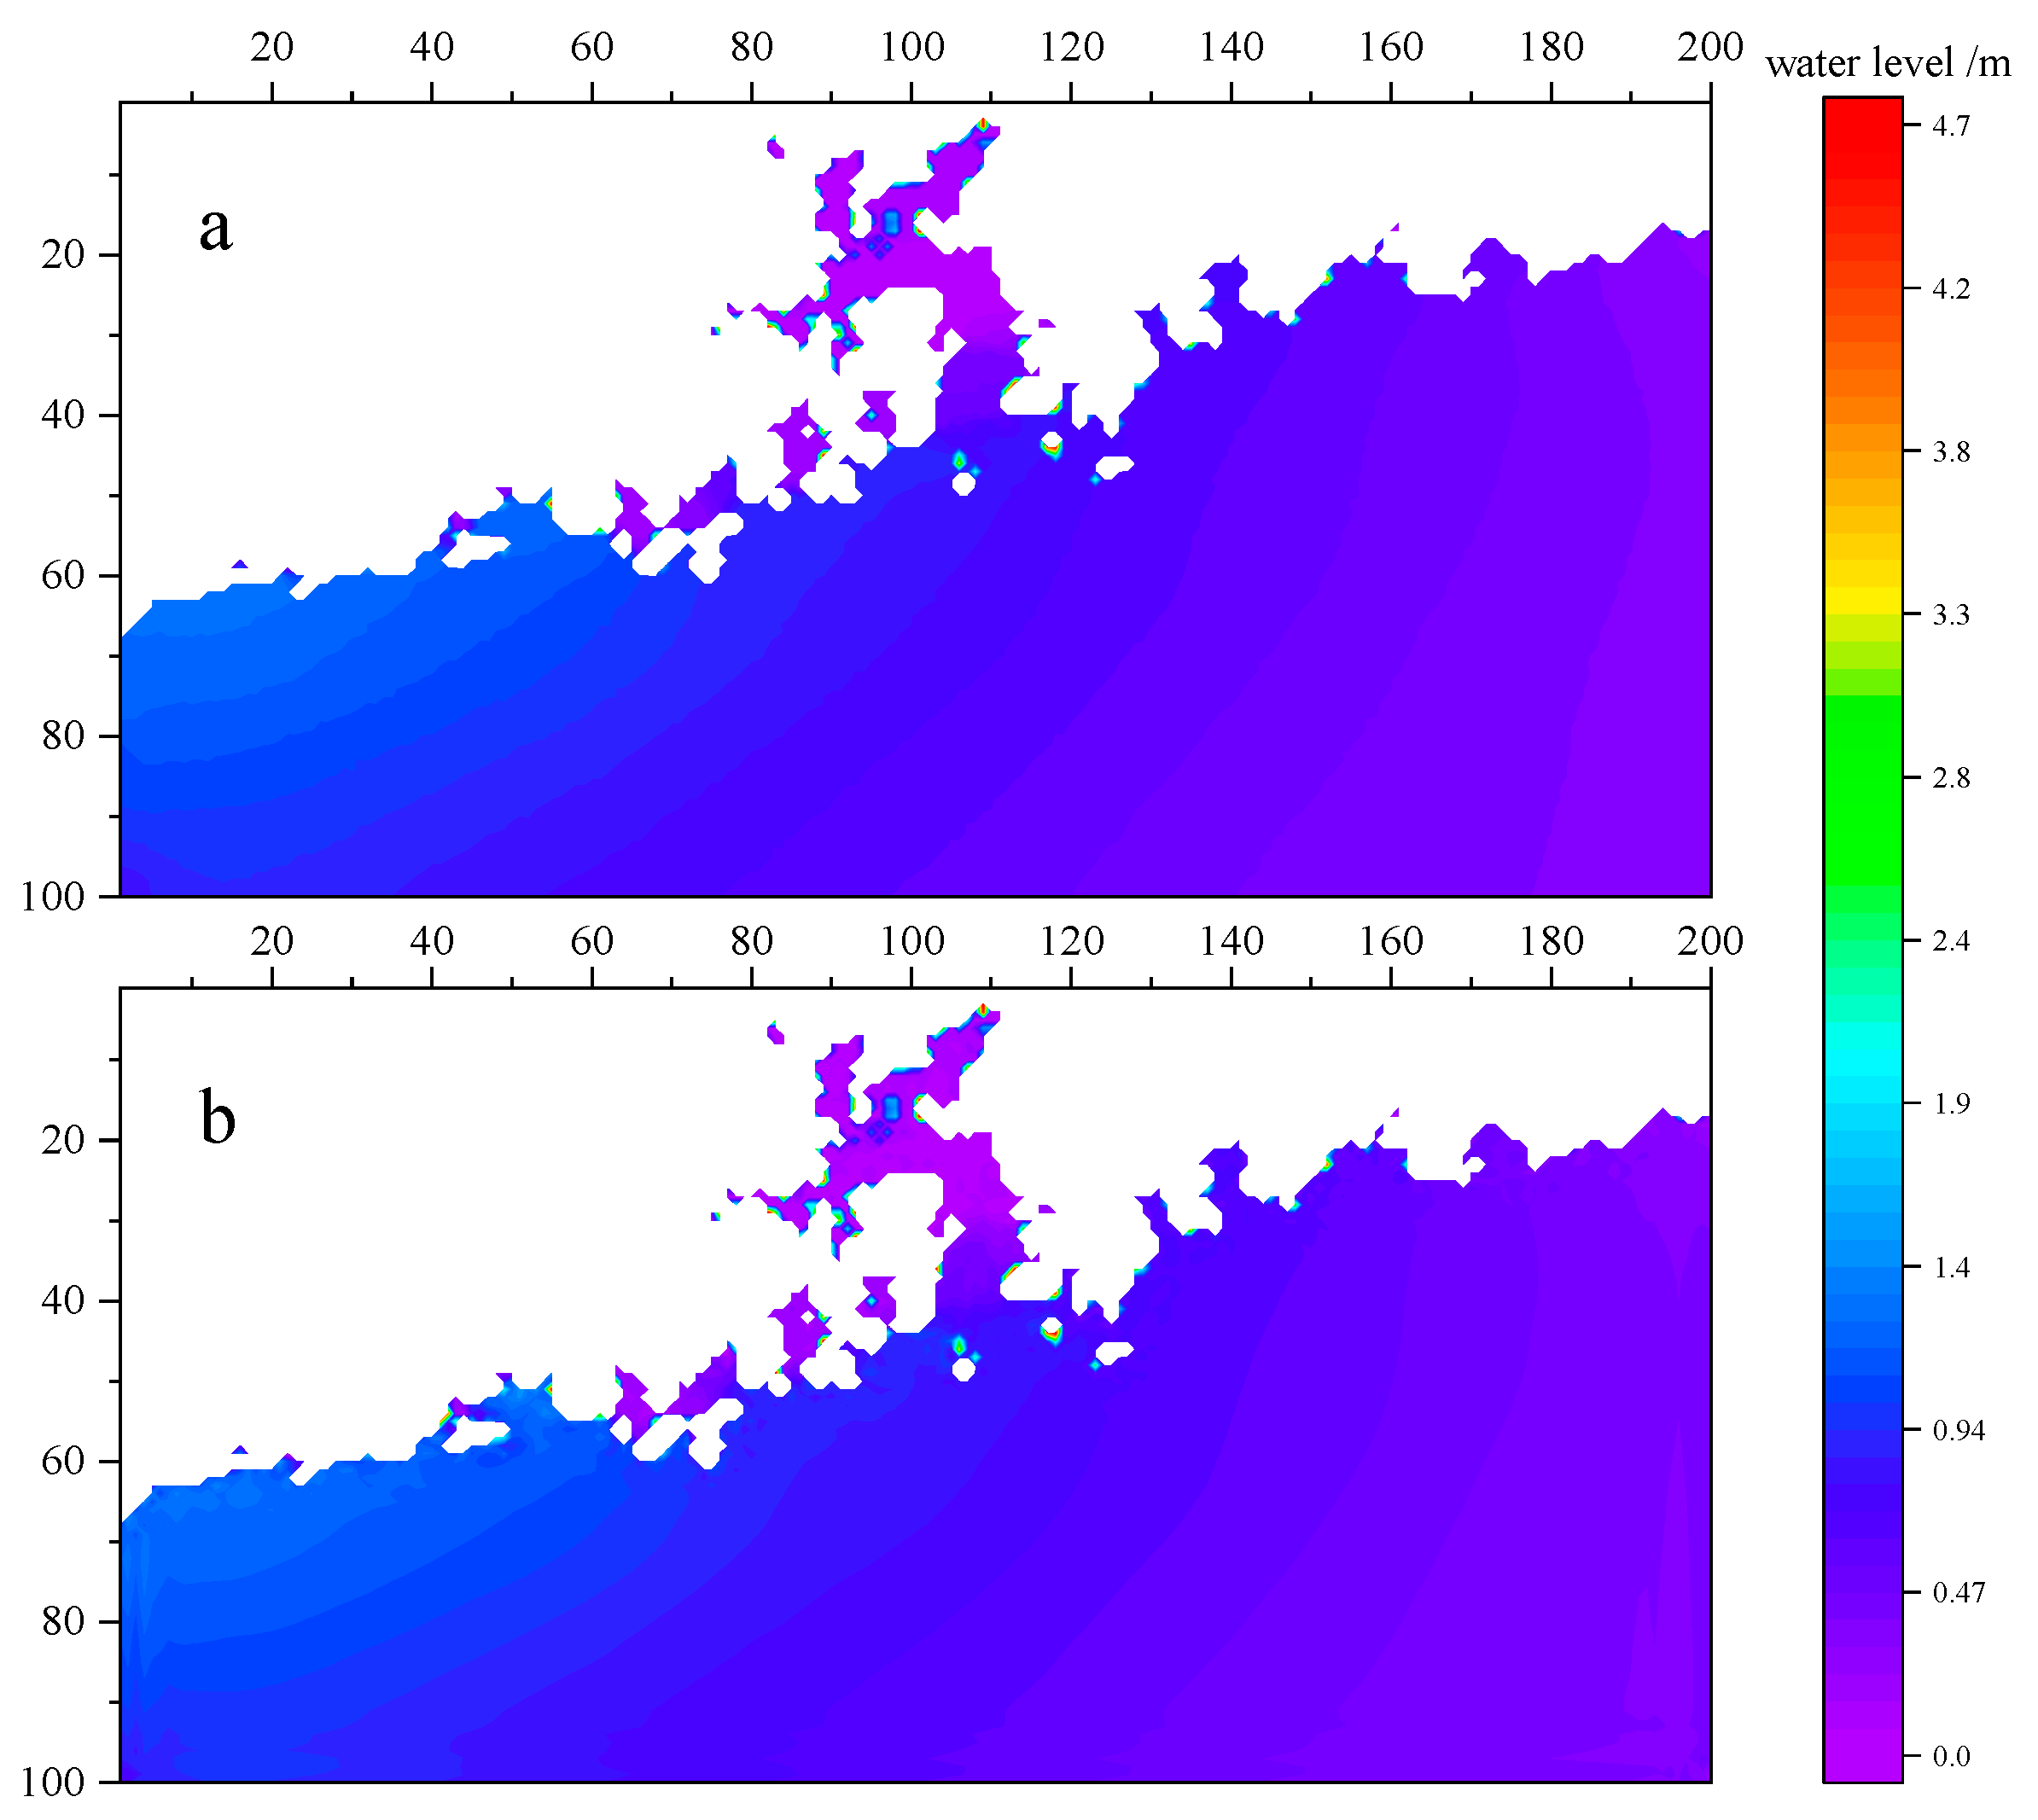
Figure 6.
The prediction result of the model trained on the Water Level Change Dataset: (a) true value; (b) prediction value.
Figure 6.
The prediction result of the model trained on the Water Level Change Dataset: (a) true value; (b) prediction value.

Figure 7.
The spatial distribution of the MAE for the prediction of the model trained on the Water Level Dataset.
Figure 7.
The spatial distribution of the MAE for the prediction of the model trained on the Water Level Dataset.

Figure 8.
The spatial distribution of the MAE for the prediction of the model trained on the Water Level Change Dataset.
Figure 8.
The spatial distribution of the MAE for the prediction of the model trained on the Water Level Change Dataset.
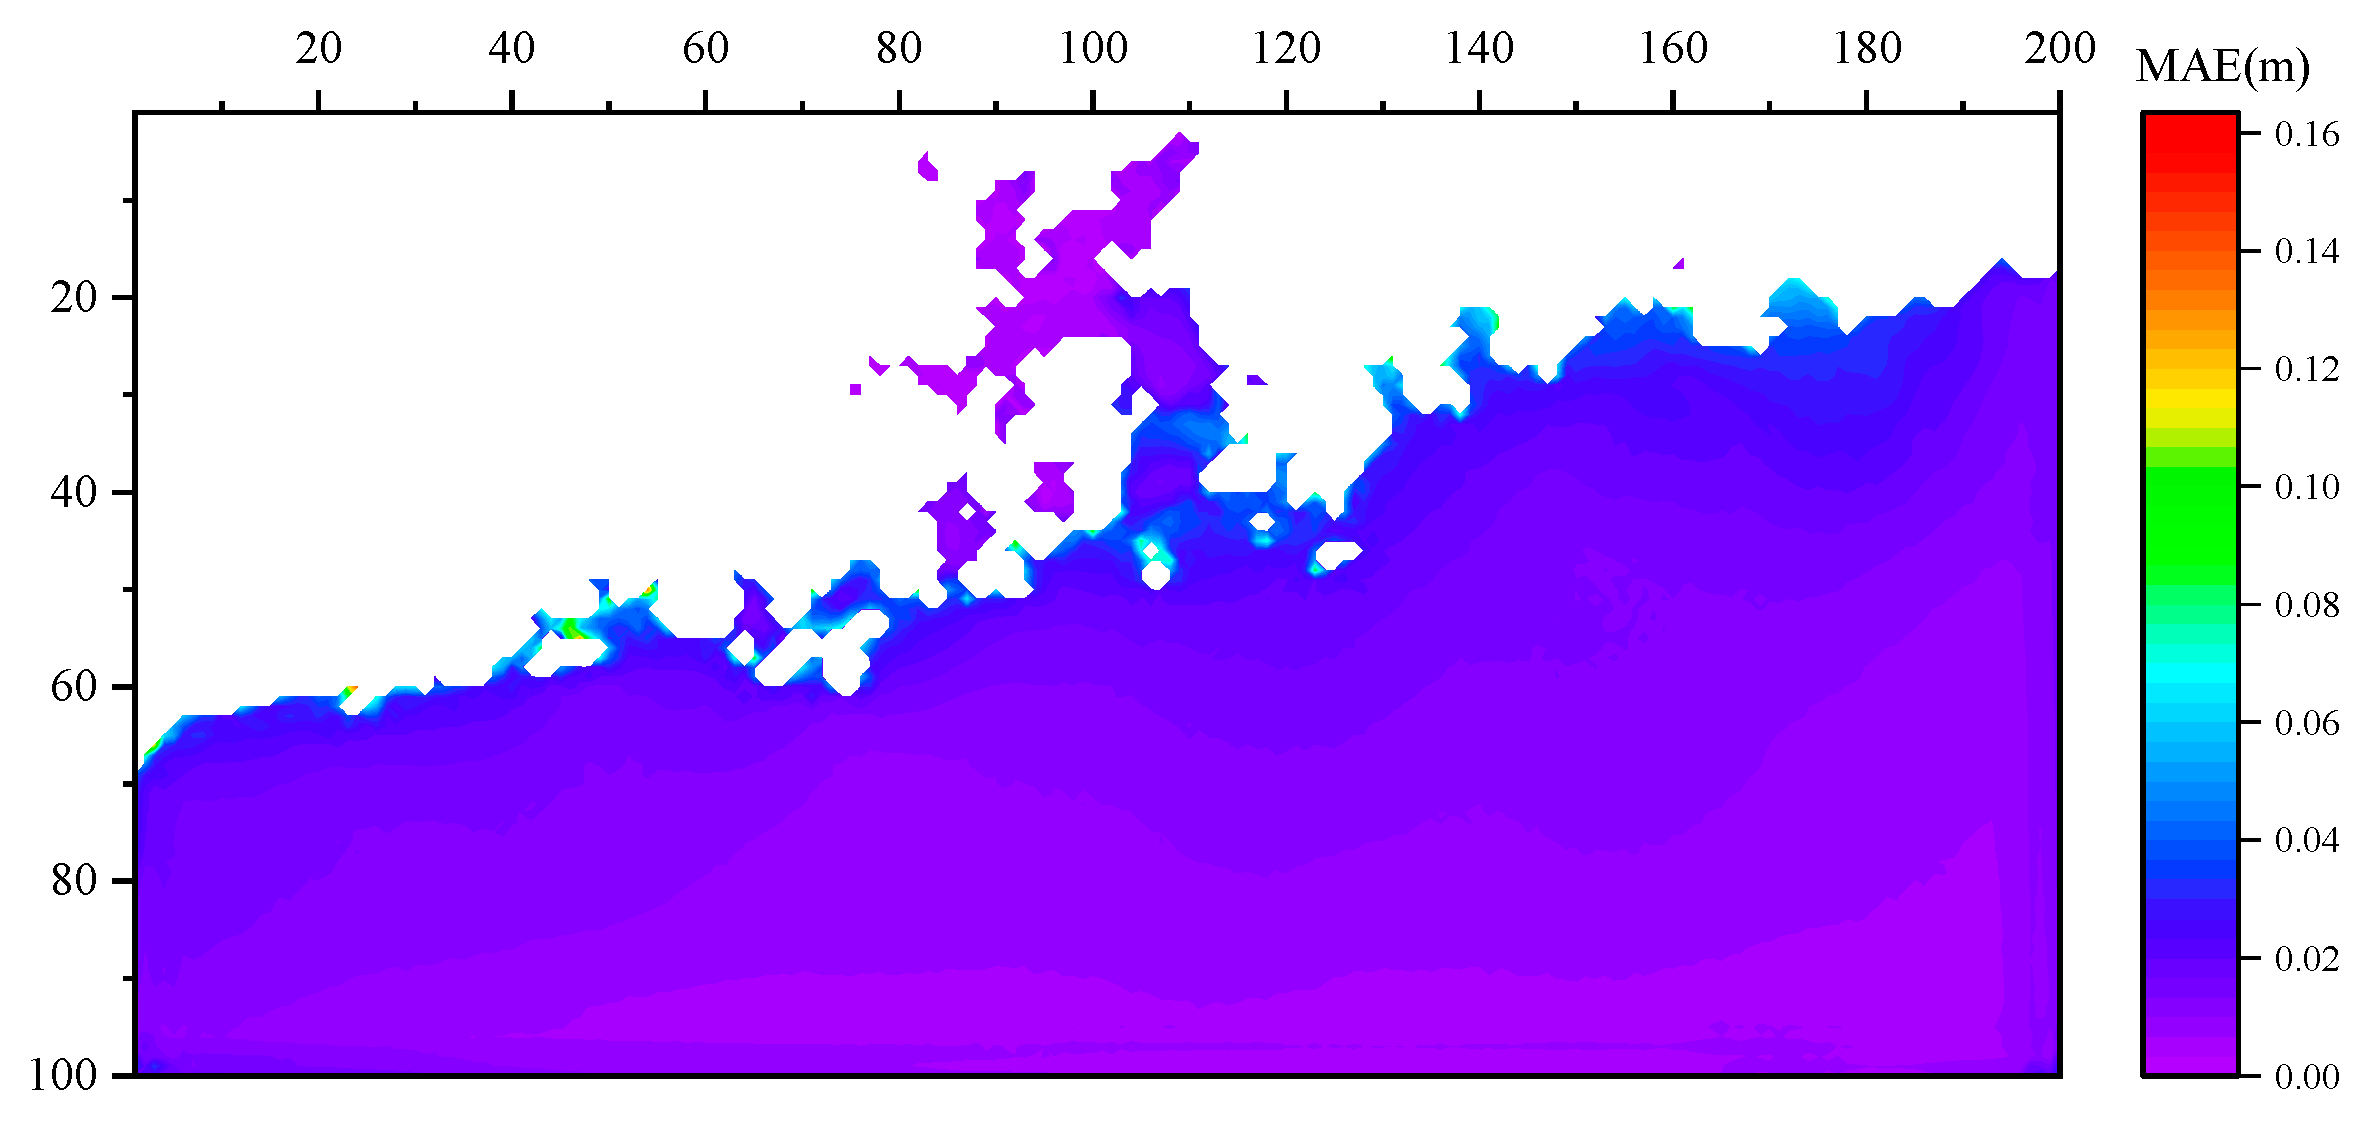
Figure 9.
The prediction results of the model trained on the Water Level Dataset for this local point.
Figure 9.
The prediction results of the model trained on the Water Level Dataset for this local point.
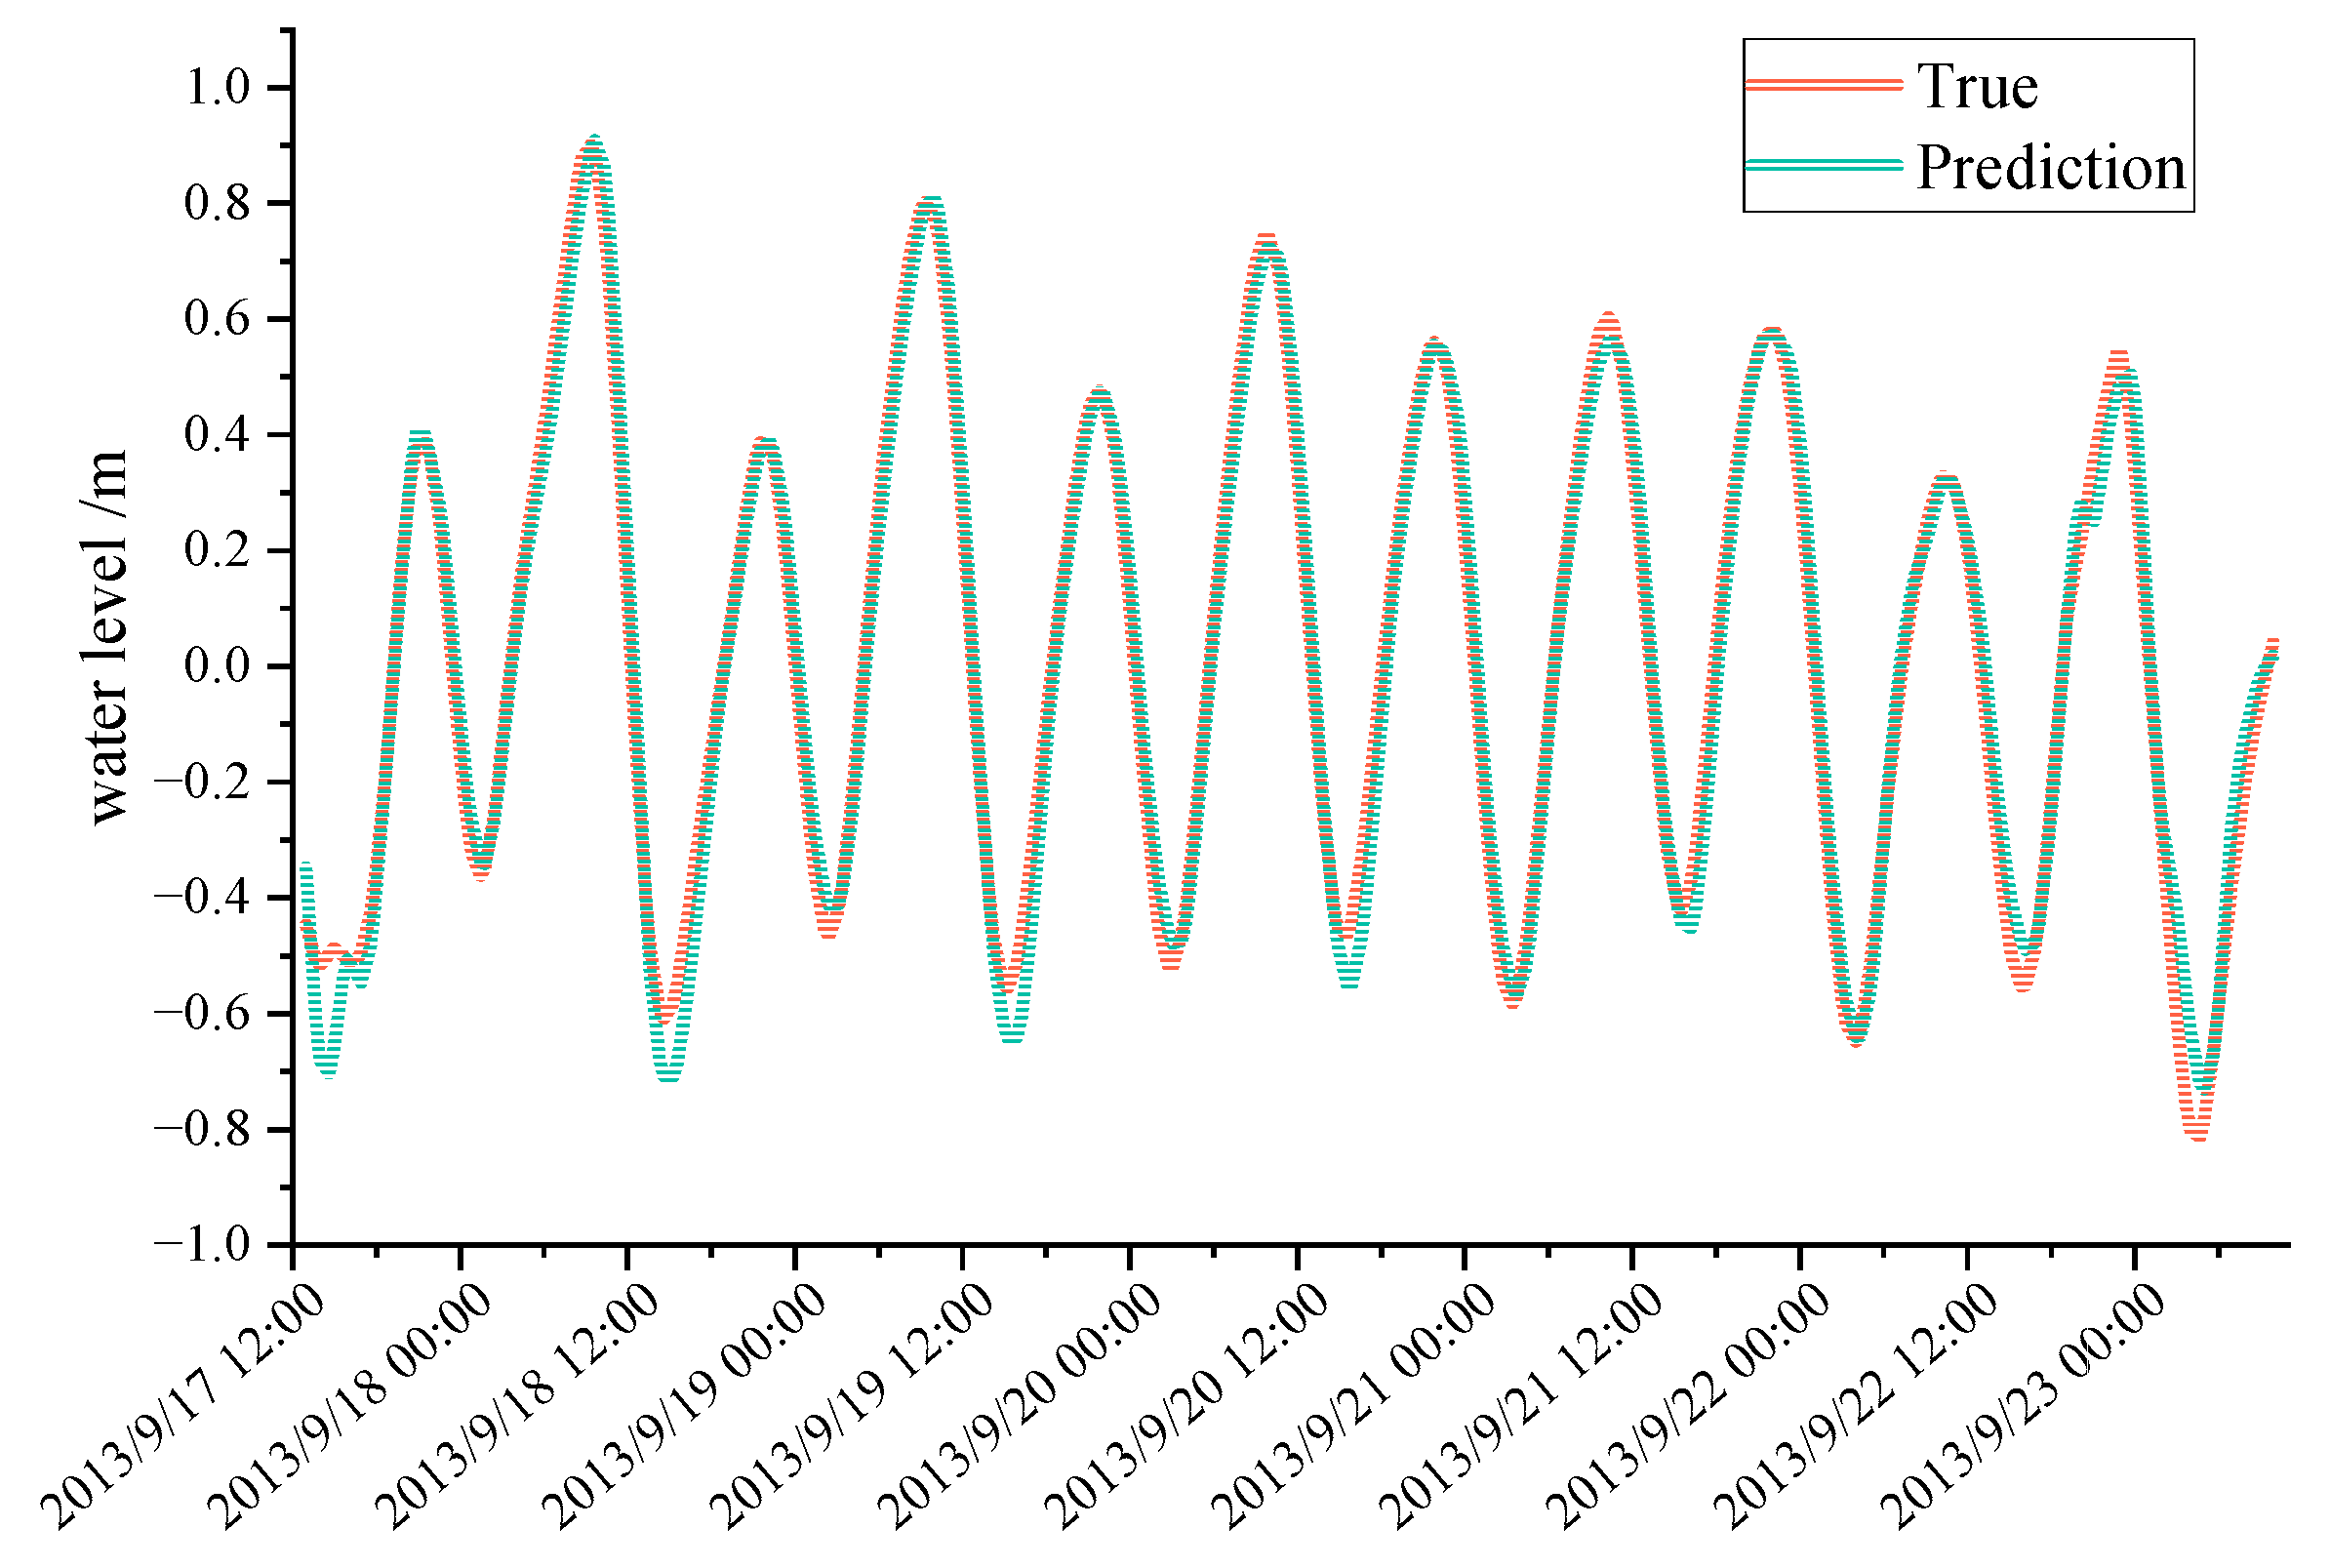
Figure 10.
The prediction results of the model trained on the Water Level Change Dataset for this local point.
Figure 10.
The prediction results of the model trained on the Water Level Change Dataset for this local point.
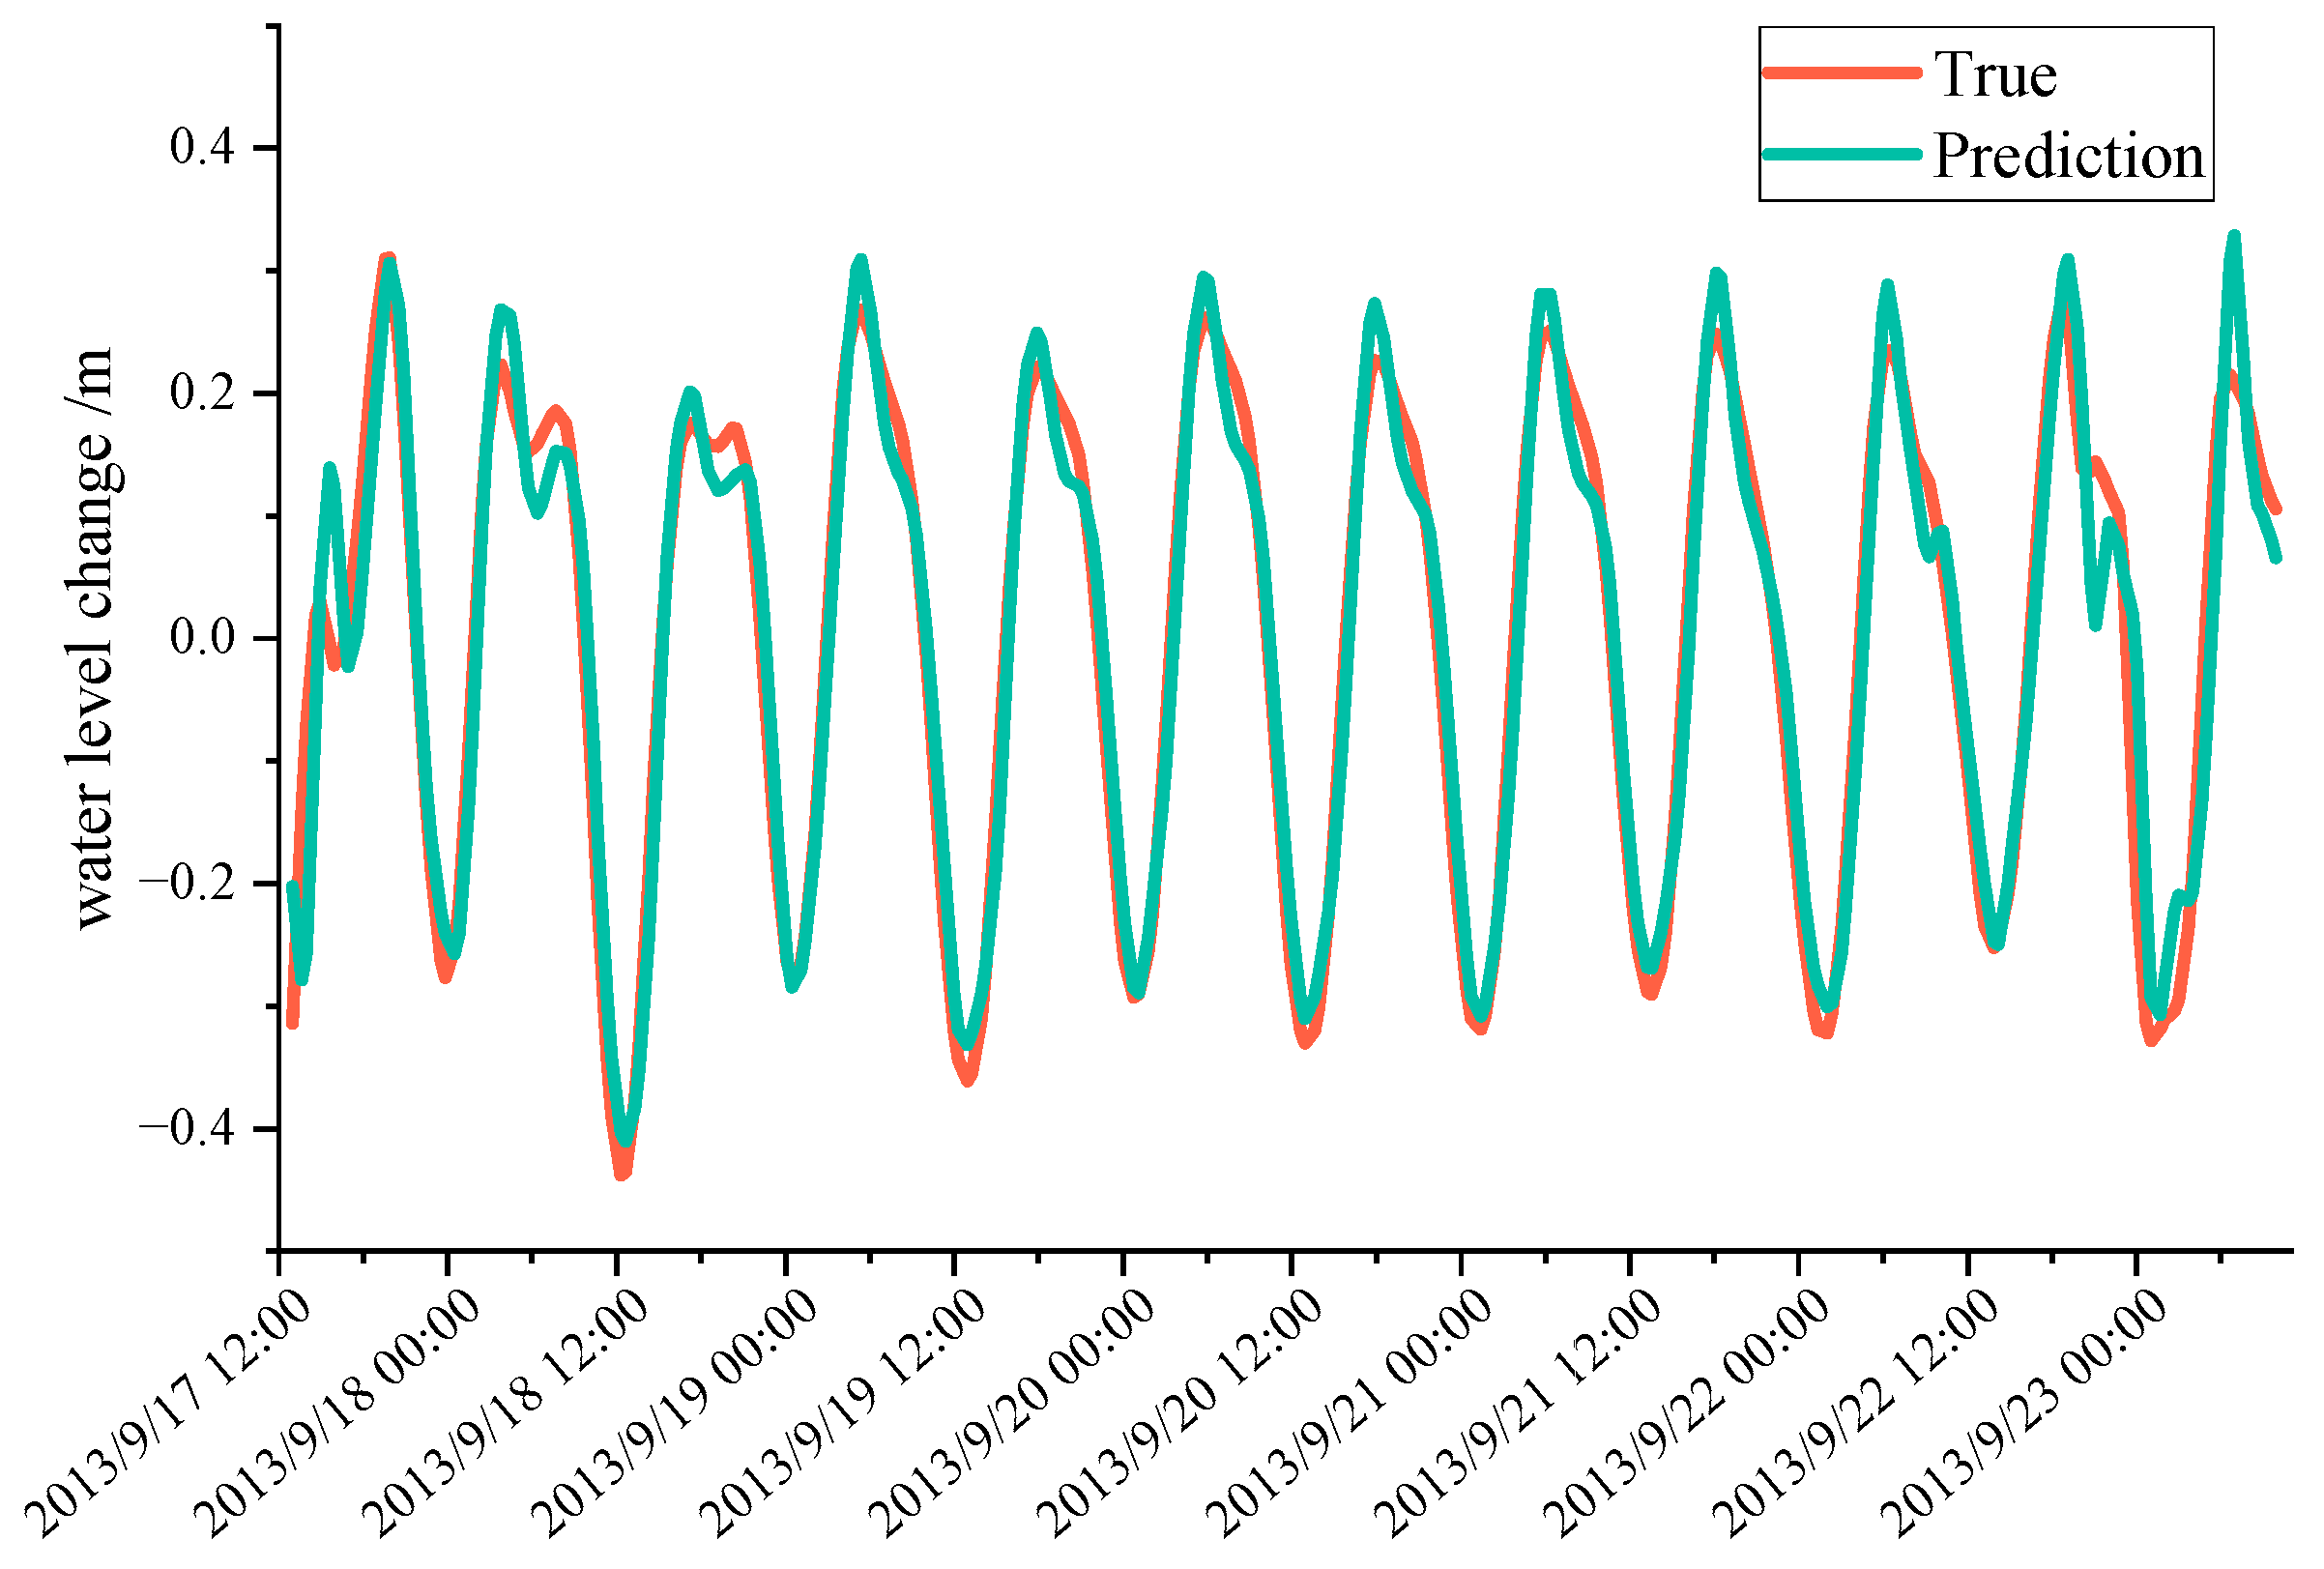
Figure 11.
Residual violin plots of both models.
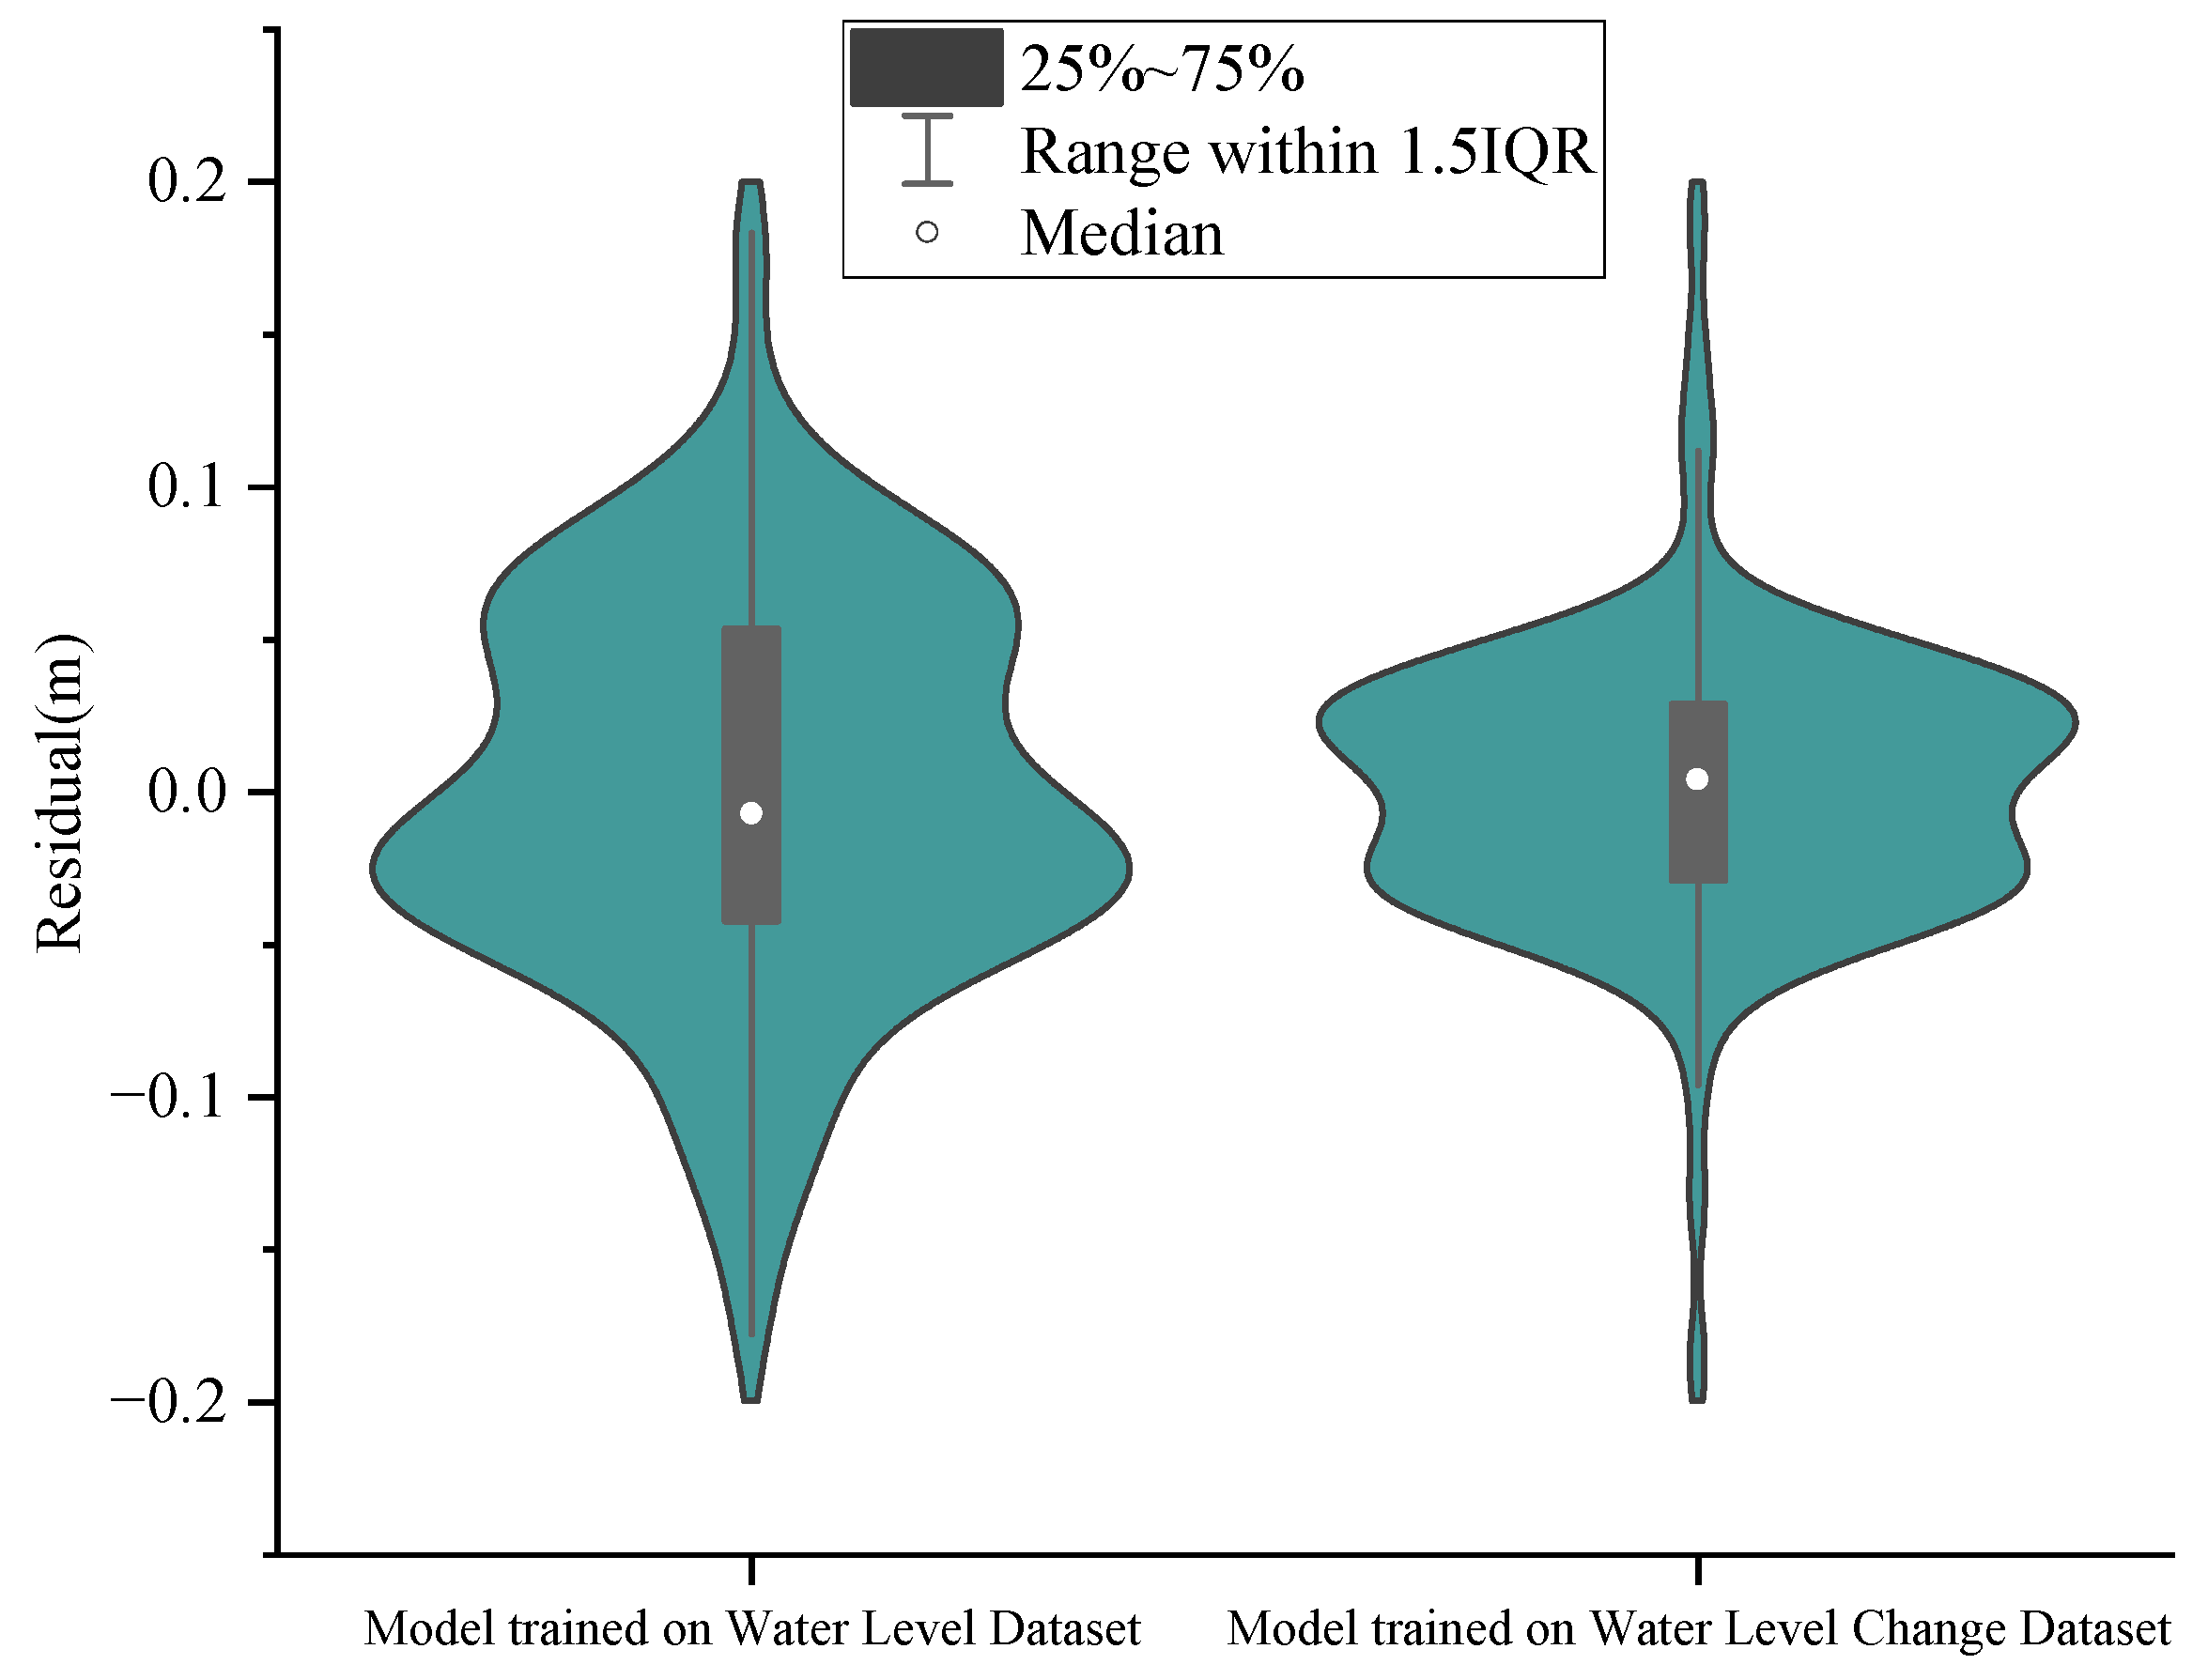
Figure 12.
Changes in MAE and MSE with dataset size.
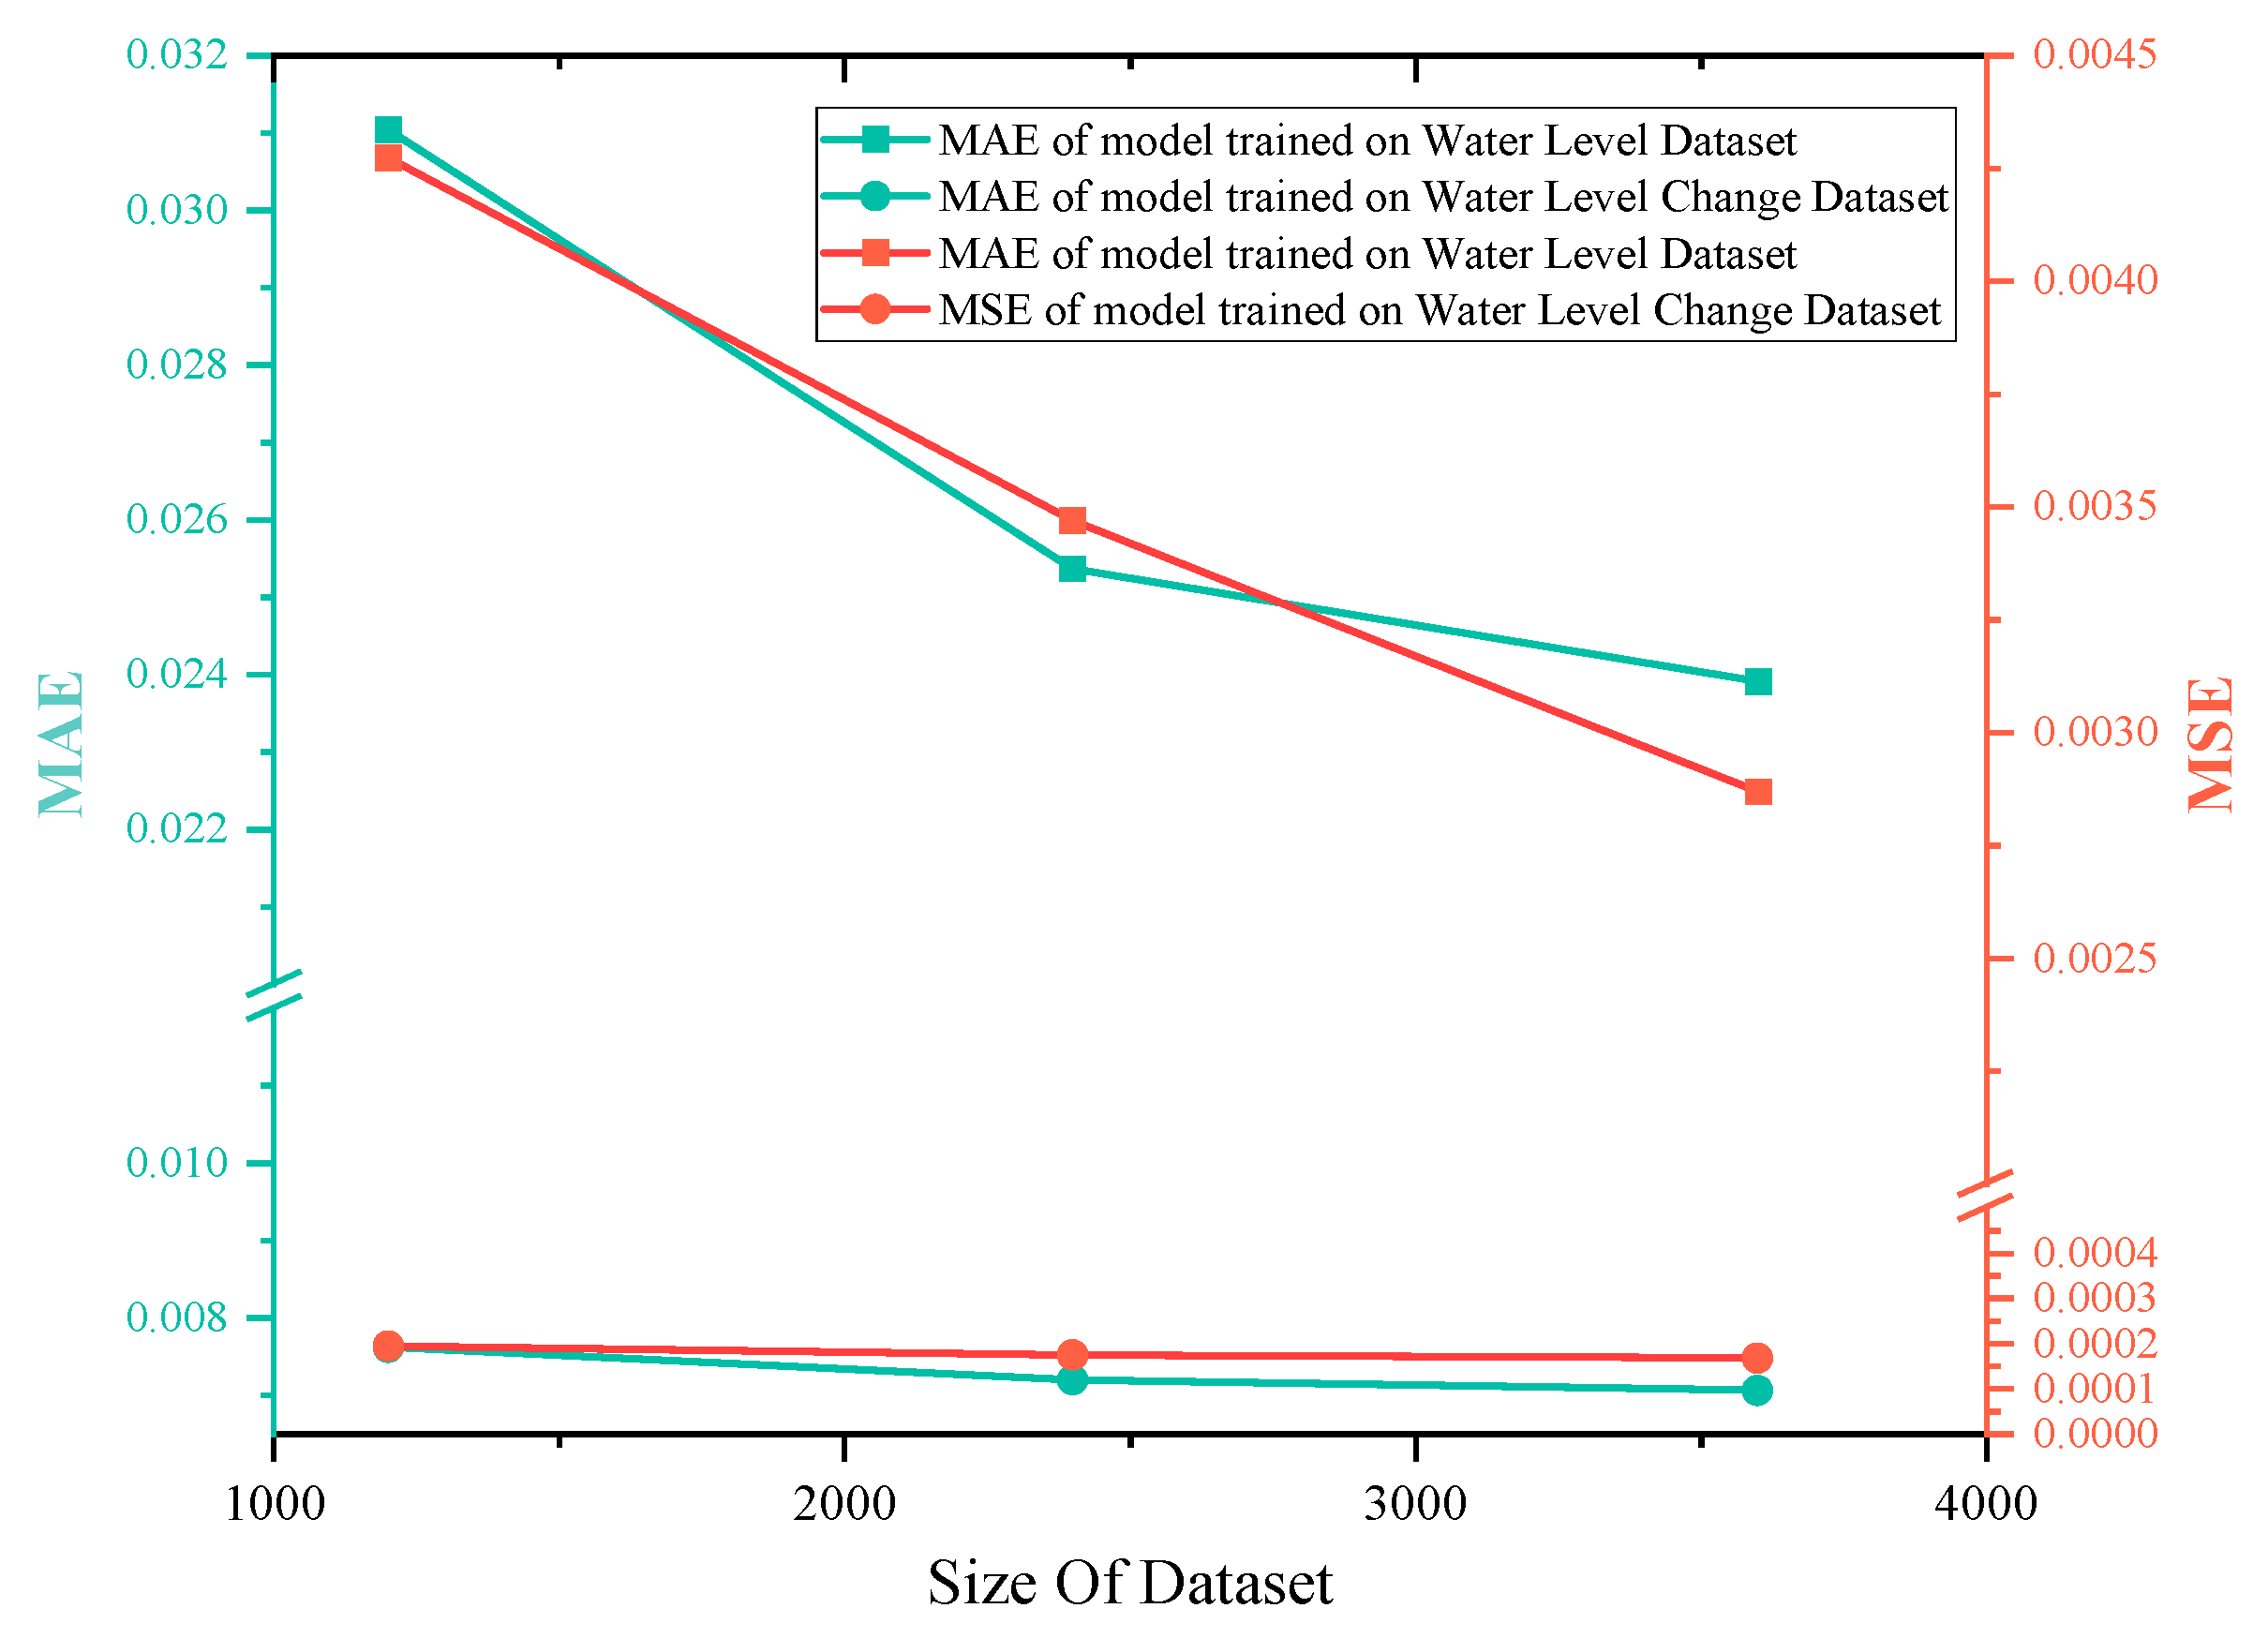
Figure 13.
The MAE values of multi-step predictions predicted by the two models.
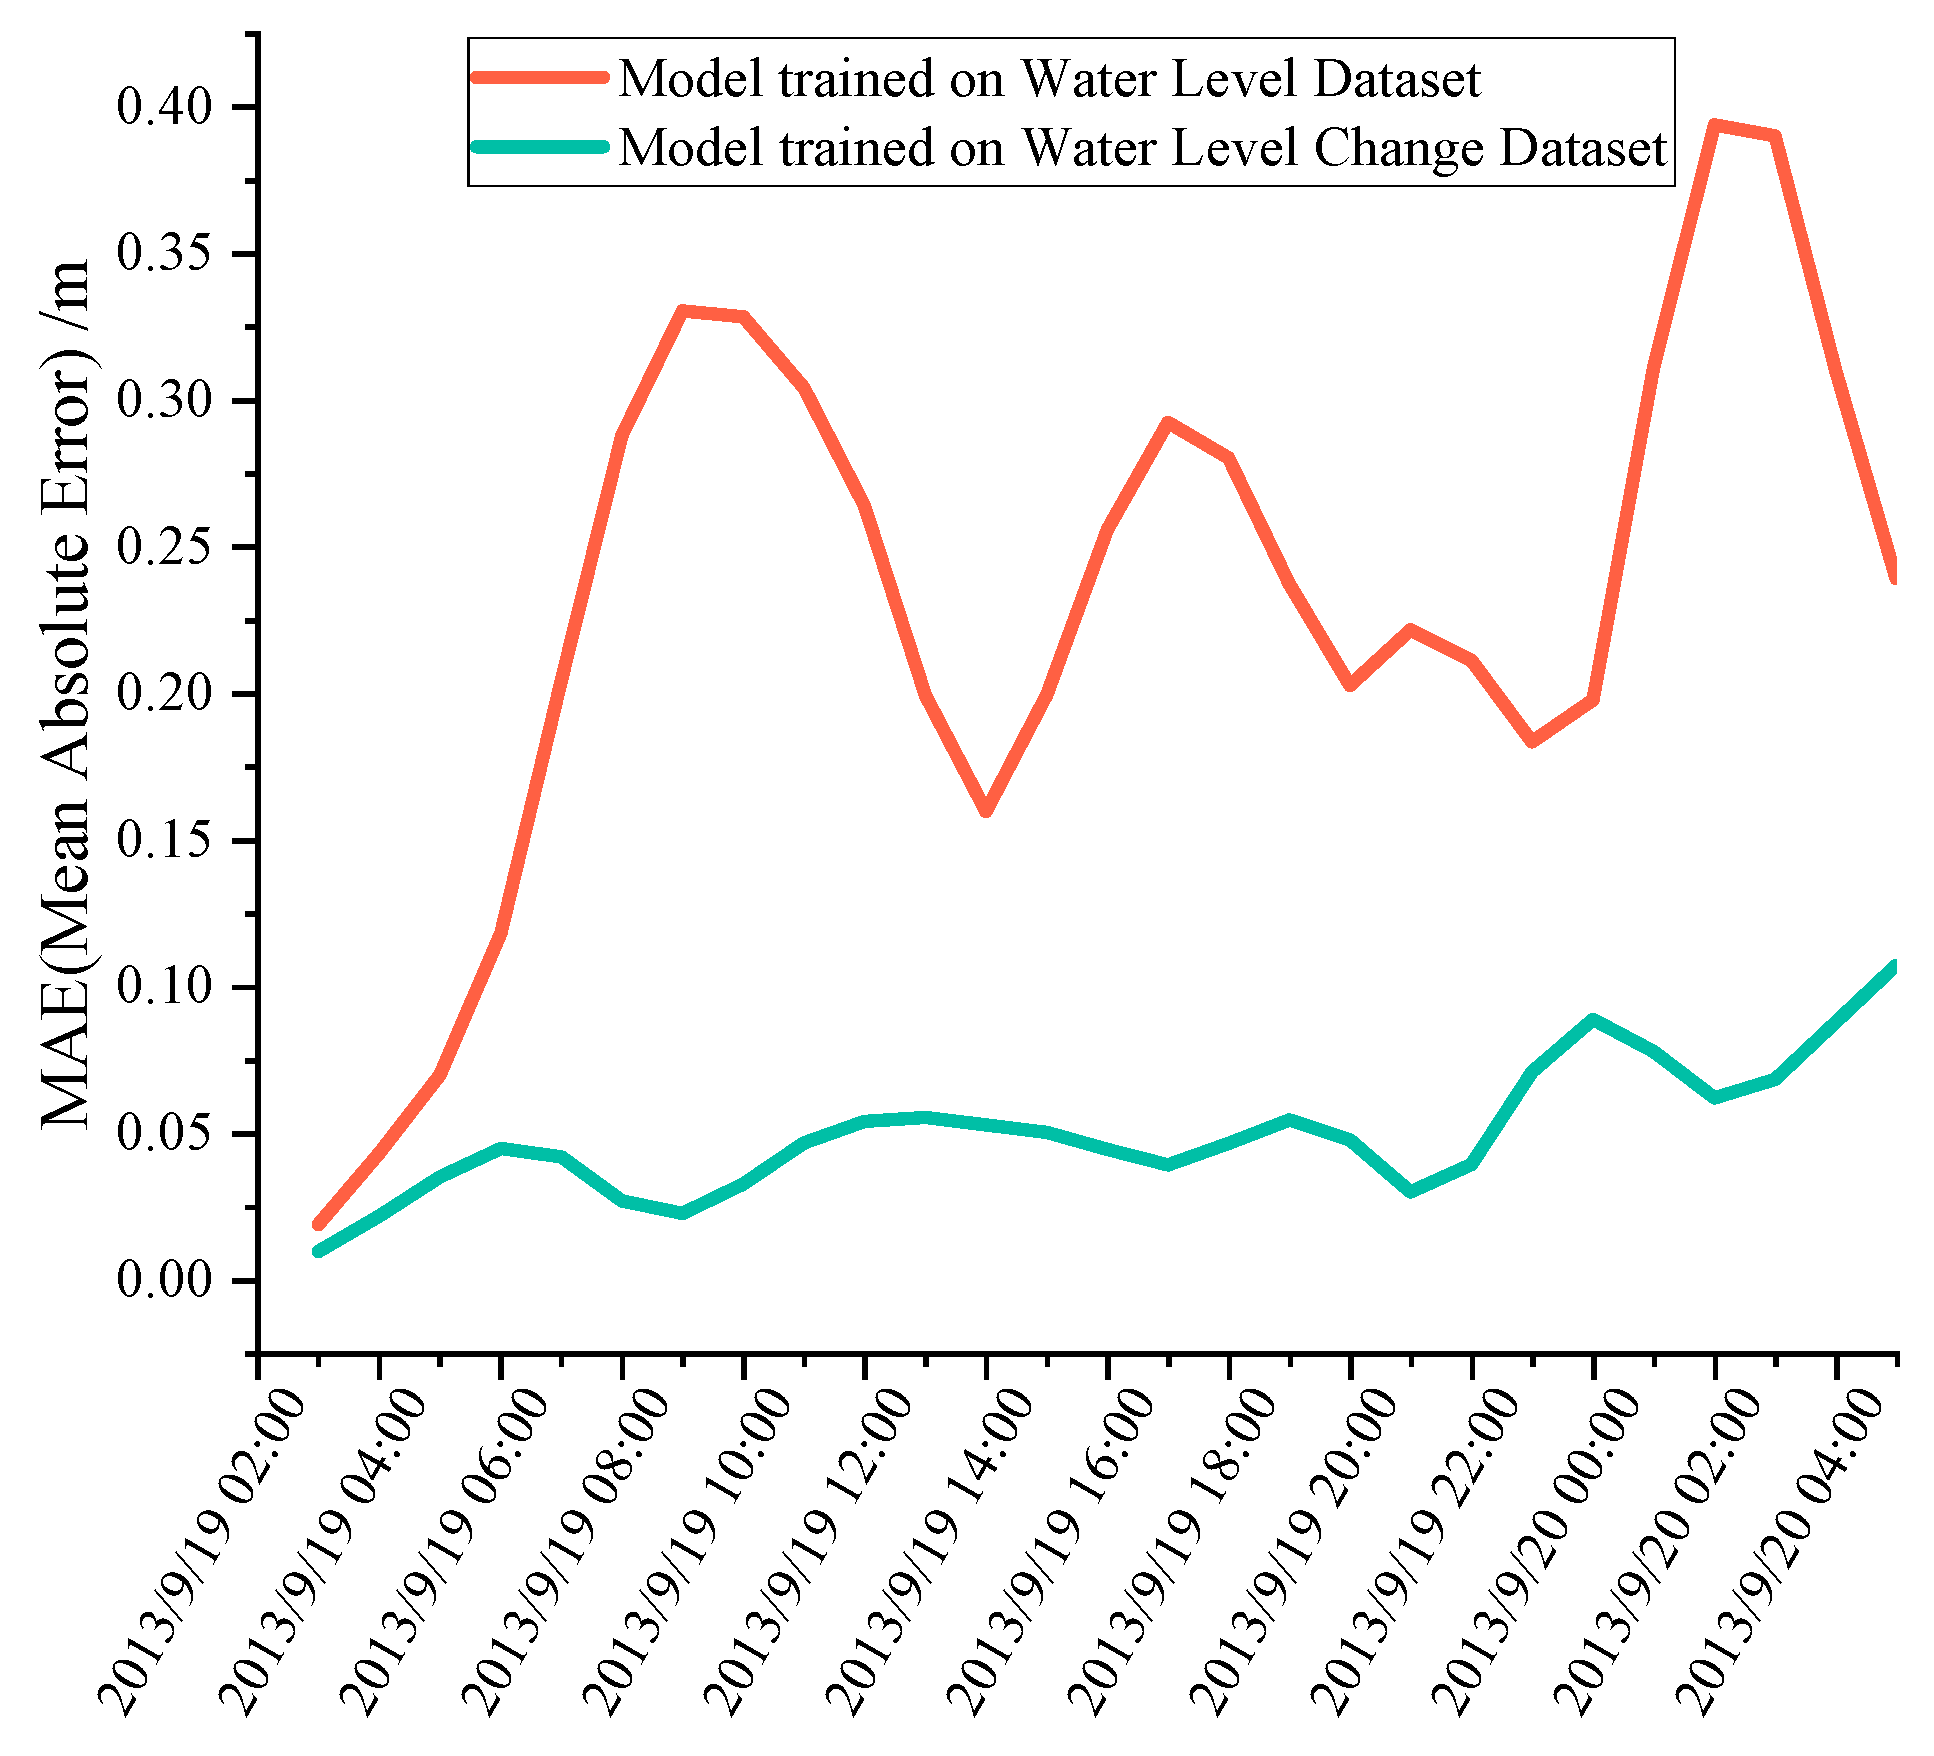
Figure 14.
Predictions of water level change at Henglan Island station.

Figure 15.
Scatterplot of the observed and predicted water level change value at Henglan Island station.
Figure 15.
Scatterplot of the observed and predicted water level change value at Henglan Island station.

Figure 16.
The spatial distribution of MAE difference. (a) The MAE of the model trained on Ocean Multi-Parameter Dataset minus the MAE of the model trained on Water Level Dataset; (b) the MAE of the model trained on Ocean Multi-Parameter Change Dataset minus the MAE of the model trained on Water Level Change Dataset.

Figure 17.
The prediction results of the training samples.
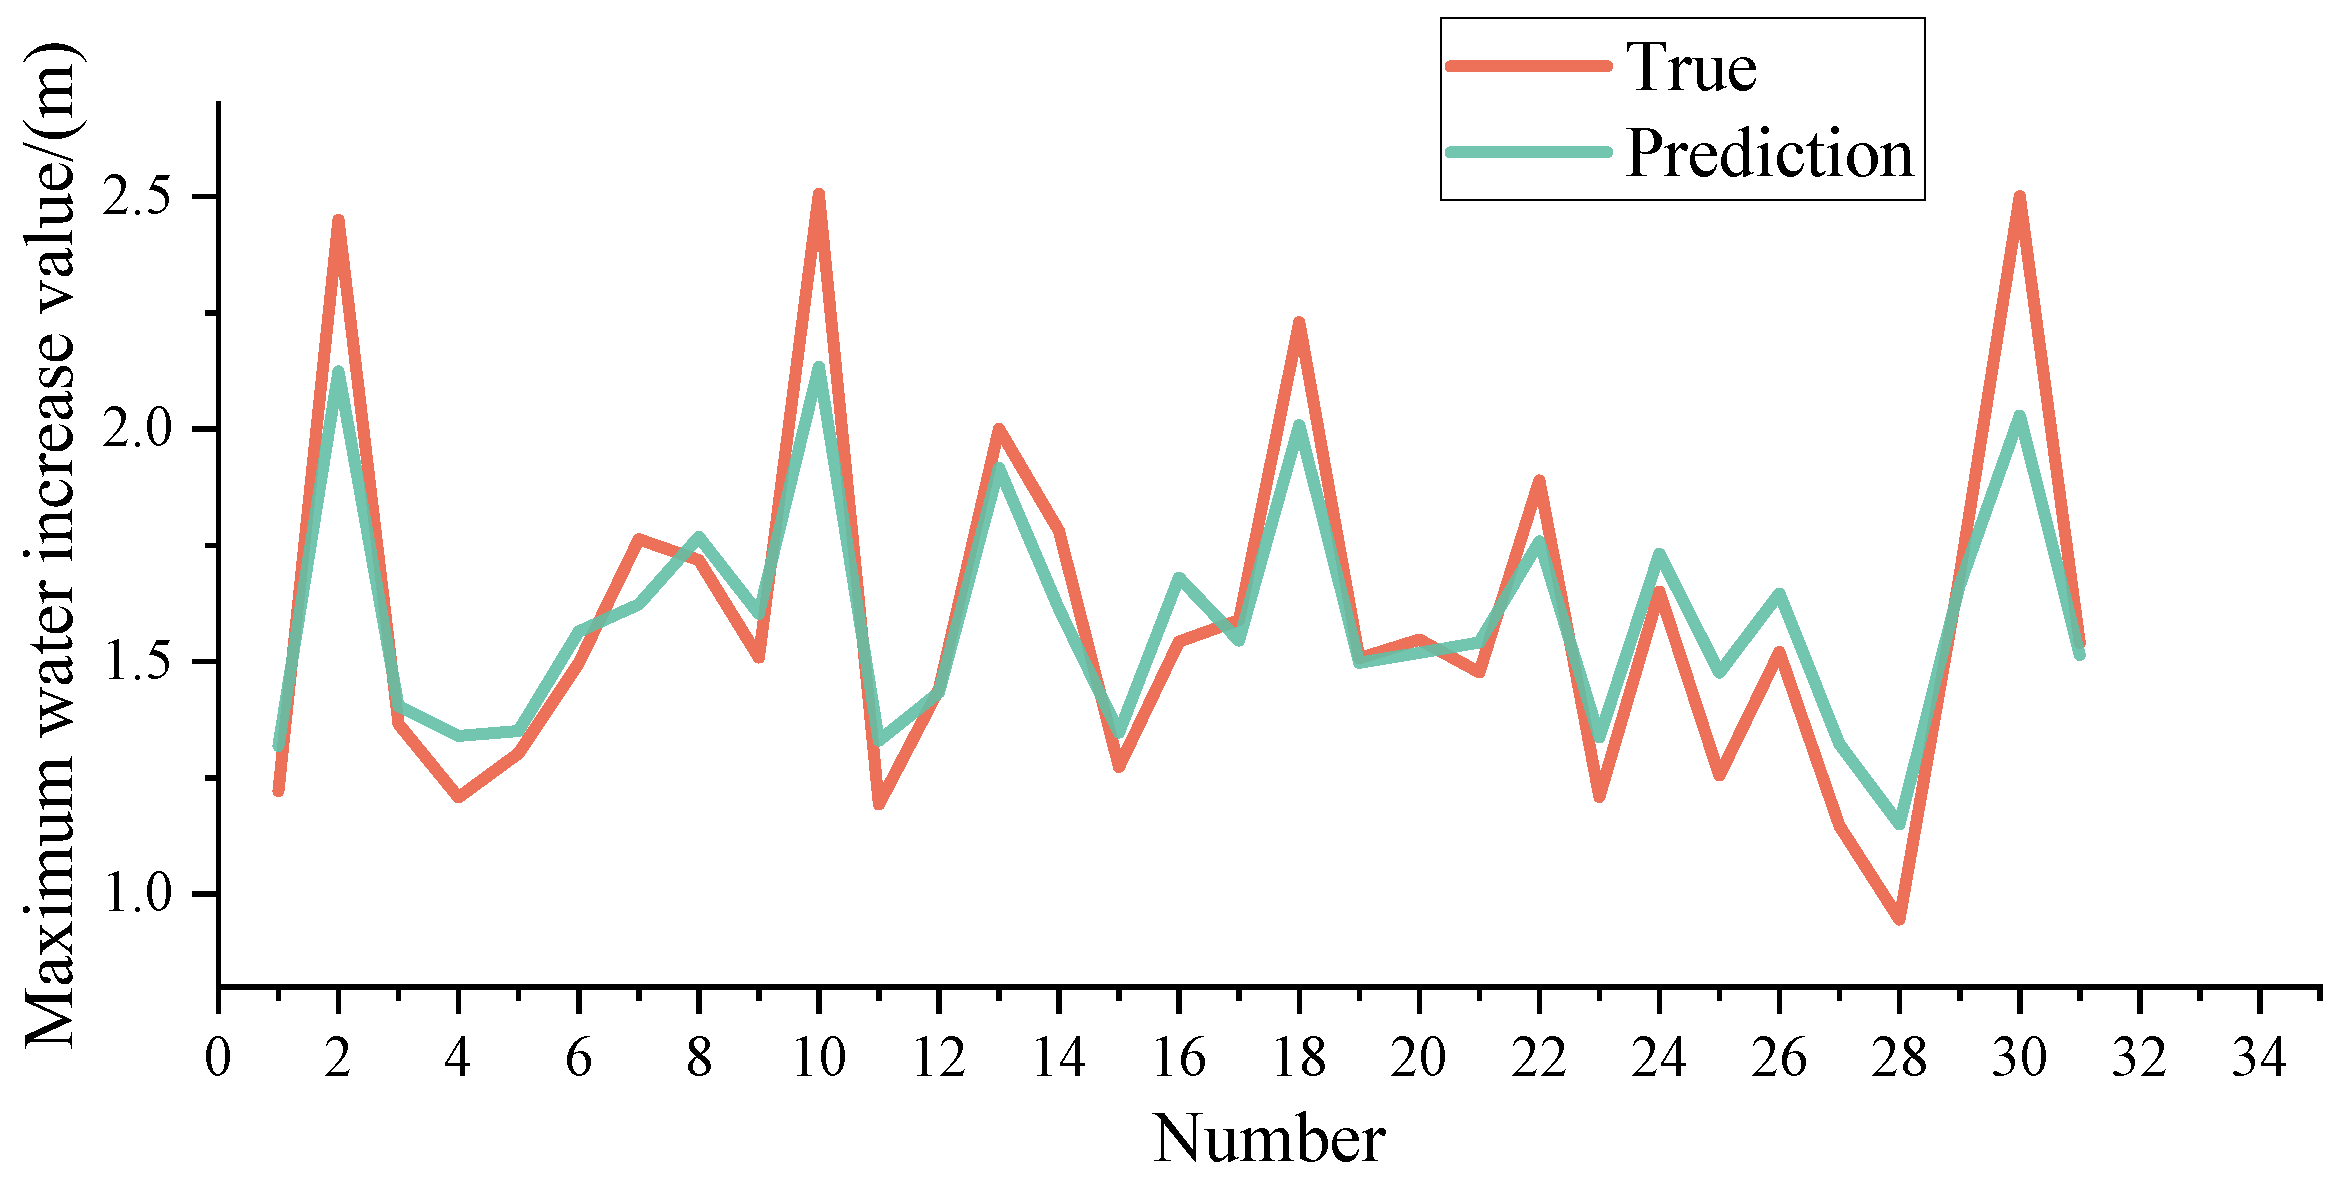
Figure 18.
The feature importance of the input feature.

Table 1.
Random forest model parameter.
| n_Estimators | Max_Features | Max_Depth | Min_Samples_Split | Min_Samples_Leaf |
|---|---|---|---|---|
| 400 | 1 | 15 | 2 | 1 |
Table 2.
Comparison table of mean absolute error (MAE) and mean squared error (MSE) of the two models.
Table 2.
Comparison table of mean absolute error (MAE) and mean squared error (MSE) of the two models.
| MAE (m) | MSE (m2) | |
|---|---|---|
| Model trained on Water Level Dataset | 0.026 | 0.0038 |
| Model trained on Water Level Change Dataset | 0.014 | 0.0007 |
Table 3.
The prediction results of the test samples.
| Typhoon Code | True (m) | Prediction (m) |
|---|---|---|
| 199318 | 1.415 | 1.756 |
| 201622 | 1.783 | 1.764 |
| 201003 | 1.403 | 1.574 |
| 200809 | 1.415 | 1.421 |
Disclaimer/Publisher’s Note: The statements, opinions and data contained in all publications are solely those of the individual author(s) and contributor(s) and not of MDPI and/or the editor(s). MDPI and/or the editor(s) disclaim responsibility for any injury to people or property resulting from any ideas, methods, instructions or products referred to in the content. |
© 2023 by the authors. Licensee MDPI, Basel, Switzerland. This article is an open access article distributed under the terms and conditions of the Creative Commons Attribution (CC BY) license (https://creativecommons.org/licenses/by/4.0/).
Share and Cite
MDPI and ACS Style
Liu, Y.; Zhao, Q.; Hu, C.; Luo, N. Prediction of Storm Surge Water Level Based on Machine Learning Methods. Atmosphere 2023, 14, 1568. https://doi.org/10.3390/atmos14101568
AMA Style
Liu Y, Zhao Q, Hu C, Luo N. Prediction of Storm Surge Water Level Based on Machine Learning Methods. Atmosphere. 2023; 14(10):1568. https://doi.org/10.3390/atmos14101568
Chicago/Turabian StyleLiu, Yun, Qiansheng Zhao, Chunchun Hu, and Nianxue Luo. 2023. "Prediction of Storm Surge Water Level Based on Machine Learning Methods" Atmosphere 14, no. 10: 1568. https://doi.org/10.3390/atmos14101568
Note that from the first issue of 2016, this journal uses article numbers instead of page numbers. See further details here.