Article

Assessing the Impact of Combined Heat and Power Plants (CHPPs) in Central Asia: A Case Study in Almaty for PM2.5 Simulations Using WRF-AERMOD and Ground Level Verification

1
Department of Civil and Environmental Engineering, Nazarbayev University, 010000 Astana, Kazakhstan
2
Department of Analytical, Colloid Chemistry and Technology of Rare Elements, Faculty of Chemistry and Chemical Technology, Al-Farabi Kazakh National University, 71 Al-Farabi Avenue, 050040 Almaty, Kazakhstan
3
Airs Air Quality Managament Services LLC, 06530 Ankara, Turkey
*
Author to whom correspondence should be addressed.
Atmosphere 2023, 14(10), 1554; https://doi.org/10.3390/atmos14101554
Submission received: 22 August 2023 / Revised: 19 September 2023 / Accepted: 22 September 2023 / Published: 12 October 2023
(This article belongs to the Section Atmospheric Techniques, Instruments, and Modeling)

Abstract

:
According to the World Health Organization, Kazakhstan is one of the most polluted countries in the world. PM2.5, a major air pollutant, is six times higher than the recommended value of 5 mg/m3. The government has implemented measures to reduce air pollution, such as introducing green energy-powered buses for public transportation, but the results have not been sufficient. Therefore, it is necessary to investigate the sources of PM2.5. This study involved simulating the Combined Heat and Power Plants (CHPPs) emissions in Almaty using AERMOD and WRF for two weeks in January 2021. Two scenarios were performed: controlled and uncontrolled. The results showed that if the control mechanism of the CHPP functions at maximum efficiency, the impact of the CHPP emissions on the total emission concentration will be negligible, which is about 6% on average. However, for uncontrolled CHPPs, the emissions will contribute from 30% to 39% on average to the total PM2.5 concentration when compared with data from US Embassy monitoring stations and public air quality monitoring network, which use Pms5003 PM2.5 sensors.

1. Introduction

Over the last decade, concerns have exploded over developing countries in Central Asia since the atmospheric particulate matter that has an aerodynamic diameter below 2.5 µm (PM2.5) was classified as a first-grade carcinogen risk by the World Health Organization (WHO) in 2013 [1]. Much research that has been carried out in this regard has shown that the health impact of PM2.5 is deserving of high-level attention [2,3].
The exponential increase in energy consumption in the forms of heat and electricity in Almaty has led to a poorer Air Quality Index (AQI) in the city [4]. Industrial greenhouse gas emissions have decreased in the member countries of the Organization for Economic Co-operation and Development [5]. However, the region of Central Asia has seen an increase in emissions of greenhouse gases in the last two decades. In 2019, Kazakhstan was ranked the 29th most-polluted country in the world [6], with the most-polluted city being Almaty. Due to the lack of monitoring systems in most cities in Kazakhstan, their air pollution rankings are unknown. The International Energy Agency (IEA) reports that Kazakhstan primarily relies on heating and Combined Heat and Power Plants (CHPPs) for energy generation. However, according to government plans, Kazakhstan is also moving towards cleaner energy sources and aims to have over 50% of its energy generation come from non-fossil fuel sources by 2050 [7].
Cogeneration of energy is a promising technology in the energy sector due to its low carbon emissions, according to the United States Environmental Protection Agency (EPA), when compared with the conventional system of generating electricity and heat separately [8]. A combined heat and power plant system allows electricity and heat production simultaneously. According to the Environmental Protection Agency (EPA), a CHPP can achieve efficiency above 80% compared to 50% for thermal generation [8]. The benefits of CHPPs include environmental benefits, including low emissions of greenhouse gases such as carbon dioxide (CO2), oxides (NOx), and sulfur dioxide (SO2) [9]. Energy production costs are also lower than the conventional system of generating electricity and heat separately. While there are other sources of air pollution in Almaty, combined heat and power plants still contribute significantly to the total PM2.5 concentration [10]. In 2021, the CHPPs in Almaty accounted for about 30% of the total energy production in the city. Hence, there is a need to quantitatively assess the impact of CHPPs in Almaty regarding PM2.5 concentration.
The high concentration of air pollutants in Almaty in the last decade has become a major concern for the health and well-being of its citizens [11]. The increase in air pollution has been linked to a wide range of health problems, including respiratory illnesses, cardiovascular disease, and even premature death [11]. As such, it is vital to conduct a thorough investigation to determine the primary sources of the pollutants and take necessary measures to reduce their emissions. The sources of atmospheric particles in Almaty can be both natural and human-made. Natural sources include dust and soil erosion, while human-made sources of air pollutants in Almaty include transportation (traffic), industrial activities, the burning of fossil fuels, etc. [4]. Identifying the primary sources of pollutants will require a comprehensive approach that involves data collection, analysis, and modeling. By doing so, it would be possible to develop effective strategies and policies to mitigate the risks posed by air pollution and protect the health of Almaty’s inhabitants. Thus, the rise in air pollution in Almaty, particularly the high concentration of PM2.5, requires urgent attention. A thorough investigation is needed to identify the sources of natural and human-made pollutants to reduce their emissions and protect the health of the city’s residents.
Air pollution modeling allows researchers to model different scenarios of air pollution from different sources, including power plants, vehicles, industries, and domestic heating, to be able to ascertain the nature of pollutants in a geographical location [12]. Air pollution modeling is a fast-growing research area that is gaining attention among environmental engineers and scientists because it allows researchers to understand various pollution scenarios, quantitatively investigate the impact of various sources of pollutants, and test different theories [13]. Modeling can also help us to understand the interaction between weather (meteorology) and ambient air pollution [14].
Air pollution modeling usually involves Meteorology and Emission simulation, which results in the concentration estimates of the pollutants. The Weather Research and Forecasting (WRF) Model has gained popularity in air pollution and meteorological modeling and is an approved meteorological modeling software by the US EPA [15]. WRF can be coupled with various dispersion models such as the Atmospheric Dispersion Modelling System (AERMOD), Community Multiscale Air Quality model (CMAQ), and the Advanced, Integrated Lagrangian Puff Modeling System also known as CALPUFF [16].
The WRF-AERMOD model, which is a widely recognized and validated tool for simulating the dispersion of PM2.5, was utilized in our research. The model was coupled with the weather research and forecasting model to ensure accuracy. The impact of emissions from the combined heat and power plants in Almaty on the overall concentration of PM2.5 in the surrounding area was investigated as our primary objective. Furthermore, the coupled model was employed to analyze the spatial distribution characteristics of PM2.5 throughout the city. This allowed a better understanding of the sources and patterns of PM2.5 pollution to be gained, which can inform targeted interventions to improve air quality in the region.

2. Materials and Methods

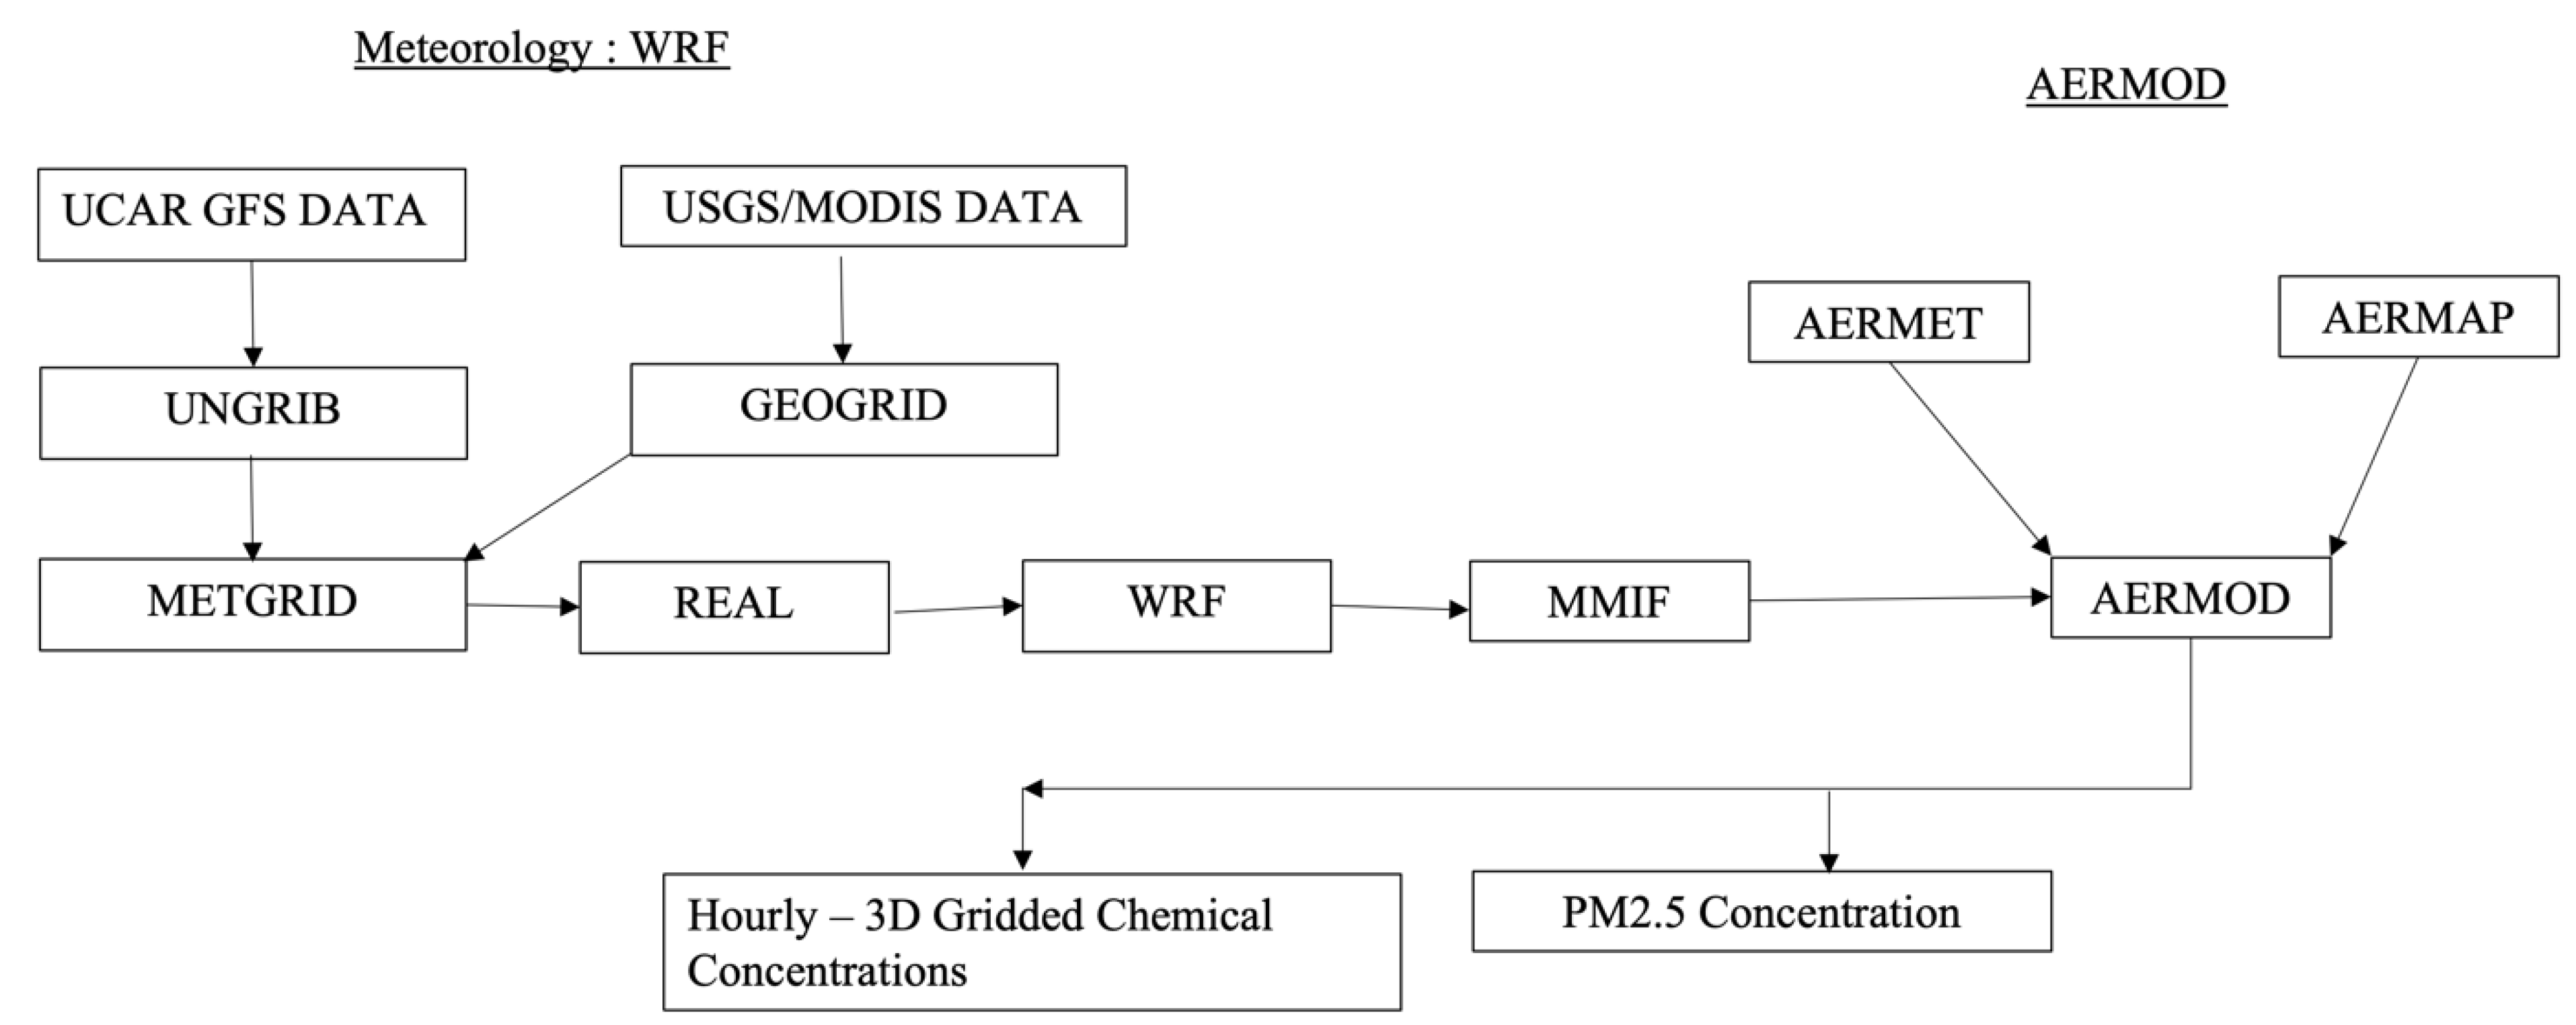
2.1. WRF-AERMOD Coupled Model

The weather research and forecasting model (WRF) coupled with the air dispersion model (AERMOD) has been an effective tool in the air pollution research field because of the compatibility of data among the models. In this study, WRF was used to simulate the meteorology over the city of Almaty, which was then used to obtain the concentration of PM2.5 using the air dispersion model, AERMOD. The methodology is summarized in Figure 1.

2.1.1. Weather Research and Forecasting Model (WRF)

WRF is characterized as “a next-generation mesoscale numerical weather forecast system” by the National Center for Atmospheric Research (NCAR). It can be utilized for both research and operational forecasting initiatives in the atmosphere. The WRF is primarily used to compute various meteorological processes and occurrences and typically outputs meteorological data, such as air temperature, relative humidity, atmospheric pressure, solar radiation, and long-wave radiation, gained and lost on the surface [17]. Over the years, WRF has been modified to be more suitable for various purposes and scenarios. The computational ability of WRF has also been modified over the years such that it now offers a more flexible operational and forecasting platform; it also contains recent developments in numerics, physics, and assimilation of data, all of which are the collective efforts of a diverse research community [15]. The domain setup used in the meteorological simulation is shown in Table 1.

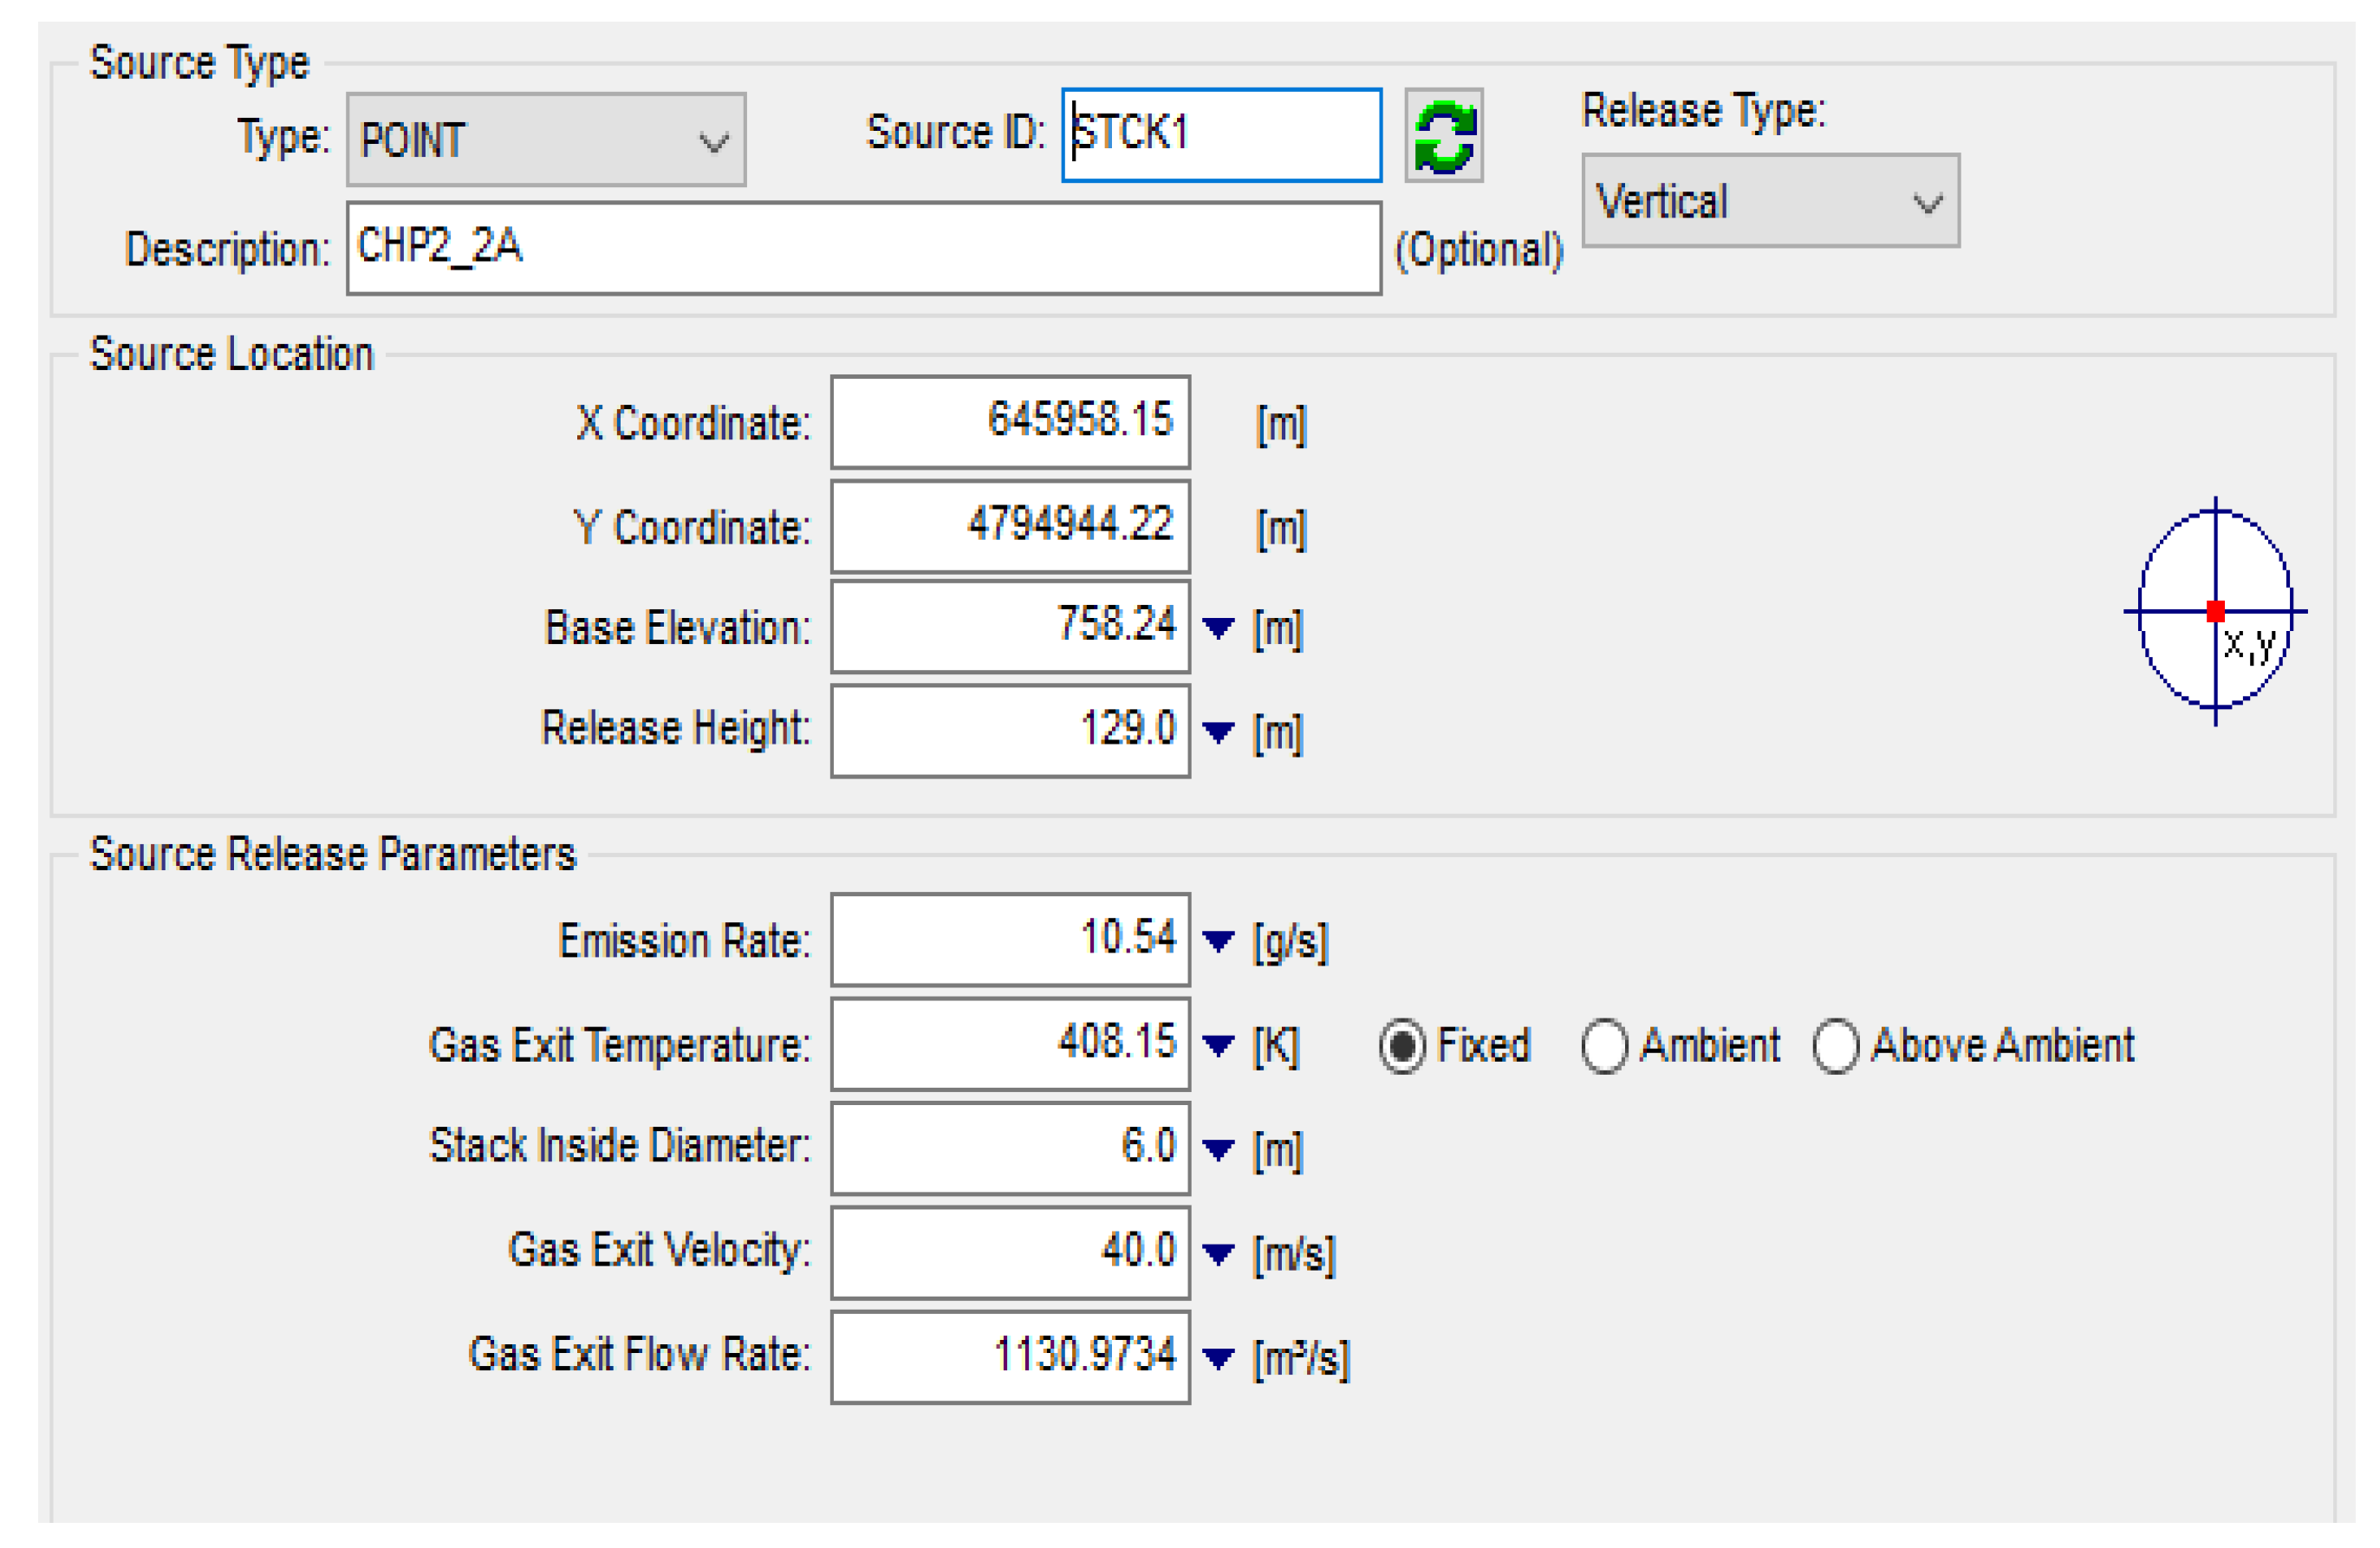
2.1.2. Air Dispersion Model (AERMOD)

The Air Dispersion Model, AERMOD, was introduced by the American Meteorological Society/Environmental Protection Agency Regulatory Model Improvement Committee (AERMIC). It is a complex modeling system that is based on the planetary boundary layer theory, turbulence structure, and scaling concepts. AERMOD can be used to study the emission and/or pollution of flat and elevated sources, including complicated and simple terrains. AERMOD comprises two major data processors: AERMET and AERMAP. AERMET is a meteorological processor used to simulate the meteorological condition of the study area using planetary boundary layer structure, while AERMAP is used to process the terrain of the study area. It accesses complex land areas from the USGS database. AERMOD combines the output of the AERMAP, AERMET (in this case, WRF was used), and the emission data calculated by the sources. Figure 2 shows the AERMOD point source calculation table used for one of the sources (CHPP-2).

2.2. Data Collection

To simulate the meteorology of the study area using WRF, meteorological data were obtained from the United States Geographical Survey (USGS) in the form of GRIB files from 1–15 January 2021. January was chosen because, according to the observed data of the United States Embassy in Almaty, January had the highest concentration of PM2.5 cumulatively [18]. The WRF simulation output is then processed using the Mesoscale Model Interface Program (MMIF), which converts the prognostic meteorological output field into gridded formats required as a direct input by AERMOD.
Three types of data are required to perform the simulation using AERMOD software: The gridded meteorology files from WRF (processed by MMIF), the emission data from all sources considered in the research, and, in this case, the two power plants (CHPP 2 and 3). The emission data from the two power plants under consideration were calculated using Equation (1):
E = A ×   Ef × ( 1 E R 100 )
where:
E = Emissions (g/s);
A = Activity rate (Tons/h) (Combustion capacity of the power plants);
Ef = Emission Factor (obtained from EPA’s AP-142, Table 1.1-7);
ER = Overall emission reduction efficiency (%).
Where ER is not known, the emission is estimated as E = Ef × A

2.3. Domain Setup

The area of focus on this project is Almaty, which is about 682 km2. Figure 3 shows the domain configuration for the WPS-Geogrid. The domain comprises 325 grids spaced at 10,000 m in the west–east region and 225 grids at 10 km in the south–north region of the domain. The reference latitude and longitude are 45 and 76.89, respectively. To provide the geogrid program enough room to perform horizontal interpolation effectively, the domain setup was made to include the entirety of Almaty and beyond.

3. Results

Combined heat and power plants are responsible for over 80% of power generation in Almaty [19]; CHPP-2 and CHPP-3 generate this with varying capacities. To assess the power plants’ impact on air quality in Almaty, the simulation was performed using the same location as that of the US Embassy in Almaty. The ground-level stations monitor ambient levels from all known sources, including vehicles, power plants, and residential coal burners. At the same time, the simulation was performed, considering only the emission from the power plants as sources (point sources considering emission through the chimneys). The hourly PM2.5 concentration data obtained from the United States Embassy website for the period of January 2021 (1–14 January 2021) were compared with the hourly PM2.5 concentration obtained from the simulation performed using WRF-AERMOD.
Our model was thoroughly compared with data obtained from two different ground-level locations to ensure accuracy and reliability [20]. Data from the US Embassy in Almaty were the first source of comparison. Monitoring station employed with beta attenuation monitors BAM 1020, which is a US EPA equivalent method that uses the principle of attenuation of beta rays for continuous PM2.5 measurements (Met One, 2022). The data is available at https://www.airnow.gov/ (Airnow, 2022; last accessed at 25 June 2023). We utilized coupled WRF-AERMOD models to simulate the concentration of PM2.5 over a period of 14 days in Almaty and compared our results with observed PM2.5 concentrations from the AERMOD simulation. To further evaluate the accuracy of our simulation, we conducted two separate simulations using the AERMOD system: Controlled Emission and Uncontrolled Emission. In our research, we aimed to evaluate the effectiveness of the emission control system implemented in the power plants located in Almaty. However, we faced an obstacle as we lacked any available information on the subject. In order to overcome this hindrance, we resorted to conducting simulations for both controlled and uncontrolled emissions. In the controlled simulation, we assumed that the emission control mechanism of the power plants was functioning at its maximum capacity, while in the uncontrolled simulation, we considered the scenario where the emission control mechanism was not working at all. This approach enabled us to obtain comprehensive and reliable findings that would be valuable for further studies and analysis.
Figure 4 shows the scatter plot for the simulated PM2.5 concentration and the observed data for the US Embassy for uncontrolled emissions. The plot shows no correlation between the simulated and the observed data; this can be attributed to the unavailability of the efficiency of the control mechanism being used in these power plants. Secondly, the distance between the power plants and the US Embassy is about 14 km and 23 km for CHPP-2 and CHPP-3, respectively; this also affects the simulated concentration compared to that of the observed concentration obtained by the US Embassy [20].
The second comparison of the results of the simulation and the observed concentration of PM2.5 obtained by AirKaz.org (last accessed at 25 June 2023) shows a higher, but not significant, relationship. The “Airkaz” public air quality monitoring network (www.airkaz.org), which uses Pms5003 PM2.5 sensors (Plantower, China) to measure the concentrations of PM2.5 every minute. Figure 5 shows the scatter plot between the simulated concentration of PM2.5 (for the uncontrolled scenario) and the observed concentration. The distance of CHPP-2 and CHPP-3 from the location of AirKaz.org is approximately 18 and 27 km, respectively. While the distance of the CHPPs from AirkAz.org is more than that of the CHPPs from the US Embassy, the concentration observed by AirKaz.org is much lower than that of the US Embassy, as seen from the scatter plots.
The simulation of PM2.5 over the city of Almaty was performed as the final stage of the simulation process after the output of the meteorological simulation had been processed using MMIF. The terrain details were obtained from the USGS map using AERMAP [21]. The emissions of the power plants are discharged through chimneys of varying diameters; emissions for CHPP-2 are discharged through two chimneys of 7.2 m and 6 m diameter, while those of CHPP-3 are discharged through a single chimney of 8.0 m. The power plants’ activity rate (coal consumption) is 380 tons/h and 140.3 tons/h, respectively (KazNIPIEnergoprom, vol 4, 2021 https://www.adb.org/sites/default/files/project-documents/56169/56169-001-esia-en_11.pdf; accessed at 23 May 2023). PM2.5 emissions were estimated using Tables 1.1-7 of the EPA’s AP-142 and Equation (1) for both the controlled and uncontrolled emission scenarios.
The estimated emissions from the power plants, the processed output from WRF, and the topographical details obtained from the AERMAP are used to perform the simulation [22]. The dispersion of PM2.5 in the city from both power plants is shown in Figure 6c. For the controlled simulation, the results show that the maximum concentration of PM2.5 was 255.0 μg/m3, which is the combined effect of the two power plants under consideration, while the individual effects on the concentration of PM2.5 are shown in a and b of Figure 6. Simulation for the uncontrolled scenario shows that the maximum concentration of PM2.5 was as high as 16,478 μg/m3, as shown in Figure 7c. The individual contributions of the power plants to the total concentration of PM2.5 are shown in Figure 7a,b.
While the effect of the emission from the power plants for the uncontrolled scenario significantly contributes to the air quality in Almaty, the distance of travel of the emission from the power plants is within the range of 15 to 20 km, as shown in Figure 7. Many factors could be responsible for the dispersion of the particulate matter emitted from the power plants, such as building heights, topography, urban climate, weather, and time of day [23].
The uncontrolled emission has more effect on the total PM2.5 concentration in the city, as shown in Figure 7. This is because the simulation performed with WRF-AERMOD was conducted with the assumption that the control mechanism of the power plants has zero efficiencies, which means that all the emissions from the power plants is released into the atmosphere. The peak concentration usually occurs at nighttime, possibly because fewer vehicles are on the road and other industries within the vicinity are not working at full capacity [24]. The average percentage contribution of the power plants for the uncontrolled scenario is 30.8% which shows that without the control mechanism, the major PM2.5 concentration will be from the power plants, especially that of the CHPP-2 [10,25].
Table 2 also compares the daily maximum PM2.5 concentration obtained from the simulation for the power plants’ controlled emission, and the US Embassy’s observed data. The average percentage contribution to the total PM2.5 concentration as measured by the US Embassy is 6.55%, which means that if the emission control mechanism of the power plants is working at maximum efficiency, which is 95% (AP-142, Table 1.1-4), it will make a relatively negligible contribution to the total PM2.5 concentration in Almaty.
The efficiency of the control mechanism installed in the power plants has to be determined, which will help obtain a more realistic impact assessment of the power plants on the quality of air in the city. From the simulation results, the efficiency of the control mechanism has to be kept at the maximum performance to ensure a negligible PM2.5 emission.
Comparing the results obtained from AirKaz.org and the simulated results (uncontrolled), it can be seen from Table 2 that the contribution of the power plants is at an average of 35%, that is, 38.98 μg/m3 of the total PM2.5 concentration per hour, which is about eight times the permissible PM2.5 concentration for a city, according to the WHO [26,27,28,29].
The dispersions of PM2.5 as a result of the emissions from the combined heat and power plants (CHPP 2 and 3) in Almaty can go as high as 255 μg/m3 when the two power plants are in operation and the effectiveness of the emission control mechanism is at a maximum (94%). However, the map of the dispersion of PM2.5 for the controlled scenario shows that the concentration of PM2.5 within a 10 to 15 km radius of CHPP-2 falls within the range of 8 to 10 μg/m3, which is about two times higher than the WHO limit as revised in 2021 (IQAir) [14,28]. Emissions from CHPP-3 are within the range of 0 and 1 μg/m3, which means its effect is low compared to CHPP-2. When compared to the total PM2.5 concentration measured by the US Embassy’s monitoring station, which is about 15 km and 25 km from CHPP-2 and CHPP-3, respectively, it shows that the emissions of the power plants, if well-controlled (94%), would only contribute about 6% to the total PM2.5 concentration in some parts of the city. When the emissions from the power plants are uncontrolled or poorly controlled, the risk of human exposure to higher PM2.5 increases [30]. The comparison between the simulated (uncontrolled) and the observed PM2.5 concentration obtained from AirKaz.org sensors indicates that the effect of the CHPPs on the total concentration of PM2.5 in Almaty is more than it should be, which is about 39% of the total concentration of PM2.5. This means that care must be taken to ensure that the emissions of the CHPPs are controlled at maximum capacity to avoid unhealthy amounts of PM2.5 in the city [31,32].
The dispersion maps show that the concentration from CHPP-2 can reach as high as 16.5 μg/m3 while that of CHPP-3 can go as high as 9261 μg/m3. The map of the dispersion of PM2.5 also shows that major parts of the city close to the CHPP-2 will risk being exposed to a concentration of PM2.5 within the range of 50 to 5000 μg/m3, which is higher than the WHO standard. The nature of the dispersion of PM2.5 in Almaty is indicative of the fact that as pollutants travel out of the emission source, the concentration becomes much lower; hence, power plants should be located away from residential areas. This is in line with the research conducted by Xu and Chen, 2021 on the impact of structures on the dispersion of PM2.5.
Both scenarios that have been presented pose a risk for the inhabitants of Almaty, especially people who live close to these power plants. The fully controlled scenario showed that the concentration of PM2.5 is still higher than the standard set by the WHO, which is 5 μg/m3. However, the data for the efficiency of the control mechanism that are in use in the power plants are currently not publicly available. The average daily contributions to the total PM2.5 as measured by the US Embassy monitoring station is 6% and 30% for the controlled and uncontrolled scenarios, respectively, which means there is a high probability of 18% (33.18 μg/m3) of the total concentration of PM2.5 coming from the power plants, which is about six times higher than the standard set by the WHO [33].
There is an urgent need to ensure that the power plants in Almaty are working under a fully controlled emission status in other to reduce the risk of human exposure to excessive pollutants, especially particulate matter (PM2.5) [9,34]. The concentration of PM2.5 decreases further away from the source; hence, the authorities should ensure that these power plants are located at least 20 km away from the city, which will contribute to increasing the quality of air in the city.

4. Conclusions

An impact assessment of combined heat and power plants in Almaty (CHPP-2 and CHPP-3) on the quality of air was conducted using the coupled models WRF-AERMOD to simulate the emissions of the power plants and the meteorology. The results were presented for two scenarios: the controlled and uncontrolled scenarios. These scenarios were necessitated due to the unavailability of the performance data of the power plants’ control mechanism, which are required to calculate the efficiency of the emission control. The result of the simulation shows that to obtain the lowest PM2.5 emissions from the power plants, the emission control efficiency has to be kept at a maximum (94% according to AP-142, Table 1.1-7), that is about 6% of the total PM2.5 concentration in the city of Almaty. The uncontrolled emission simulation shows that the concentration of PM2.5 in Almaty will reach up to 30% of the total concentration compared to the US Embassy’s data and up to 39% when compared to the emission data obtained from AirKaz.org. The graphical presentation of the dispersion of PM2.5 shows that higher values of the concentration of PM2.5 as emitted by the power plants are found within 15 to 20 km from the location of the power plants and then decrease further away. Factors responsible for the dispersion of PM2.5 in Almaty can include the topography of the city, the architectural layout of the city, the temperature of the air, and the time of emission. However, there is a need for an in-depth study of the dispersion of PM2.5 in Almaty to have a comprehensive understanding of the air quality.
Finally, the analysis presented shows no correlation between the observed concentration and the simulated concentration of PM2.5. This is due to the unavailability of real-time, publicly accessible monitoring of the emissions of the power plants in Almaty. Hence, measurement of the efficiency of the emission control is not possible. Secondly, to adequately compare the emissions from the power plants, more monitoring stations must be installed closer to the power plants, increasing the simulation and/or measurement accuracy.

Author Contributions

T.B.O.: Conceptualization, Methodology, Software, Simulation, Data Curation, Validation, Formal analysis, Writing—original draft, Writing, Review and Editing; F.K.: Conceptualization, Review and Editing; M.G.: Review and Editing; N.B.: Provision of Emission data and Review; I.U.: Data Review. All authors have read and agreed to the published version of the manuscript.

Funding

This research was funded by circular economy indexing in construction industry using big data and AI, grant number 20122022CRP1606.

Institutional Review Board Statement

Not applicable.

Informed Consent Statement

Not applicable.

Acknowledgments

The authors acknowledge the financial support from Nazarbayev University Collaborative Research Program (Project Reference: 20122022CRP1606) and the Science Committee of the Ministry of Higher Education and Science of the Republic of Kazakh-stan (Grant No. BR10965258). We also acknowledge the use of the resources made available by the research facilities of Nazarbayev University, such as the High-Performance Computer (HPC) and the IT specialists.

Conflicts of Interest

The authors declare no conflict of interest.

References

  1. Loomis, D.; Huang, W.; Chen, G. The International Agency for Research on Cancer (IARC) evaluation of the carcinogenicity of outdoor air pollution: Focus on China. Chin. J. Cancer 2014, 33, 189–196. [Google Scholar] [CrossRef] [PubMed]
  2. Bai, L.; He, Z.; Li, C.; Chen, Z. Investigation of yearly indoor/outdoor PM2.5 levels in the perspectives of health impacts and air pollution control: Case study in Changchun, in the northeast of China. Sustain. Cities Soc. 2020, 53, 101871. [Google Scholar] [CrossRef]
  3. Li, W.; Lin, G.; Xiao, Z.; Zhang, Y.; Li, B.; Zhou, Y.; Ma, Y.; Chai, E. A review of respirable fine particulate matter (PM2.5)-induced brain damage. Front. Mol. Neurosci. 2022, 15, 454. [Google Scholar] [CrossRef] [PubMed]
  4. IQAir. Almaty Air Quality Index (AQI) and Kazakhstan Air Pollution|AirVisual. 2021. Available online: https://www.iqair.com/kazakhstan/almaty-qalasy/almaty (accessed on 25 June 2023).
  5. Hashmi, R.; Alam, K. Dynamic relationship among environmental regulation, innovation, CO2 emissions, population, and economic growth in OECD countries: A panel investigation. J. Clean. Prod. 2019, 231, 1100–1109. [Google Scholar] [CrossRef]
  6. Saffari, A.; Ataei, M.; Sereshki, F.; Naderi, M. Environmental impact assessment (EIA) by using the Fuzzy Delphi Folchi (FDF) method (case study: Shahrood cement plant, Iran). Environ. Dev. Sustain. 2019, 21, 817–860. [Google Scholar] [CrossRef]
  7. Agency, I.E. Kazakhstan 2022 Energy Sector Review. 2022. Available online: https://iea.blob.core.windows.net/assets/fc84229e-6014-4400-a963-bccea29e0387/Kazakhstan2022.pdf (accessed on 23 May 2023).
  8. United States Environmental Protection Agency. CHP Benefits. Available online: https://www.epa.gov/chp/chp-benefits (accessed on 2 December 2022).
  9. Chio, C.-P.; Lo, W.-C.; Tsuang, B.-J.; Hu, C.-C.; Ku, K.-C.; Chen, Y.-J.; Lin, H.-H.; Chan, C.-C. Health impact assessment of PM2.5 from a planned coal-fired power plant in Taiwan. J. Formos. Med. Assoc. 2019, 118, 1494–1503. [Google Scholar] [CrossRef]
  10. Zakarin, E.A.; Baklanov, A.A.; Balakay, L.A.; Dedova, T.V.; Bostanbekov, K.A. Simulation of air pollution in Almaty City under adverse weather conditions. Russ. Meteorol. Hydrol. 2021, 46, 121–128. [Google Scholar] [CrossRef]
  11. Bekbossynova, A.; Duvanova, D.; Jones, N.; Lyden, K.; McGinley, T.; Moss, H. How Attitudes towards Air Pollution May Impact Public Health: A Case Study of Almaty, Kazakhstan. J. Environ. Prot. 2023, 14, 583–601. [Google Scholar] [CrossRef]
  12. Afzali, A.; Rashid, M.; Afzali, M.; Younesi, V. Prediction of air pollutants concentrations from multiple sources using AERMOD coupled with WRF prognostic model. J. Clean. Prod. 2017, 166, 1216–1225. [Google Scholar] [CrossRef]
  13. United States Environmental Protection Agency. Managing Air Quality—Air Quality Modeling. Available online: https://www.epa.gov/air-quality-management-process/managing-air-quality-air-quality-modeling (accessed on 11 July 2023).
  14. Assanov, D.; Zapasnyi, V.; Kerimray, A. Air Quality and Industrial Emissions in the Cities of Kazakhstan. Atmosphere 2021, 12, 314. [Google Scholar] [CrossRef]
  15. NCAR. Weather Research & Forecasting Model (WRF). Available online: https://www.mmm.ucar.edu/models/wrf (accessed on 23 May 2022).
  16. Xu, H.; Chen, H. Impact of urban morphology on the spatial and temporal distribution of PM2.5 concentration: A numerical simulation with WRF/CMAQ model in Wuhan, China. J. Environ. Manag. 2021, 290, 112427. [Google Scholar] [CrossRef]
  17. Mölders, N.; Tran, H.N.; Quinn, P.; Sassen, K.; Shaw, G.E.; Kramm, G. Assessment of WRF/Chem to simulate sub–Arctic boundary layer characteristics during low solar irradiation using radiosonde, SODAR, and surface data. Atmos. Pollut. Res. 2011, 2, 283–299. [Google Scholar] [CrossRef]
  18. AirNow. US Embassies and Consulates|AirNow.gov. 2021. Available online: https://www.airnow.gov/international/us-embassies-and-consulates/#Kazakhstan$Almaty (accessed on 23 May 2023).
  19. Karatayev, M.; Clarke, M.L. A review of current energy systems and green energy potential in Kazakhstan. Renew. Sustain. Energy Rev. 2016, 55, 491–504. [Google Scholar] [CrossRef]
  20. Rahul, B.; Kumar, R.Y.; Ramachandra, P.V. Air Pollution Dispersion Using Coupled AERMOD-WRF Modeling System and Generation of Gridded Emission Inventory of NOX over Nagpur. In Boundary Layer Flows; Ramachandra, P.V., Valter, S., João, C., Eds.; IntechOpen: Rijeka, Croatia, 2022; p. 10. [Google Scholar]
  21. Shahin, M.A.; Jaksa, M.B.; Maier, H.R. State of the art of artificial neural networks in geotechnical engineering. Electron. J. Geotech. Eng. 2008, 8, 1–26. [Google Scholar]
  22. Hallaji, H.; Bohloul, M.R.; Peyghambarzadeh, S.M.; Azizi, S. Measurement of air pollutants concentrations from stacks of petrochemical company and dispersion modeling by AERMOD coupled with WRF model. Int. J. Environ. Sci. Technol. 2023, 20, 7217–7236. [Google Scholar] [CrossRef]
  23. Duan, W.; Wang, X.; Cheng, S.; Wang, R.; Zhu, J. Influencing factors of PM2.5 and O3 from 2016 to 2020 based on DLNM and WRF-CMAQ. Environ. Pollut. 2021, 285, 117512. [Google Scholar] [CrossRef] [PubMed]
  24. Sicard, P.; Agathokleous, E.; Anenberg, S.C.; De Marco, A.; Paoletti, E.; Calatayud, V. Trends in urban air pollution over the last two decades: A global perspective. Sci. Total Environ. 2023, 858, 160064. [Google Scholar] [CrossRef] [PubMed]
  25. Hu, J.; Chen, J.; Ying, Q.; Zhang, H. One-year simulation of ozone and particulate matter in China using WRF/CMAQ modeling system. Atmos. Meas. Technol. 2016, 16, 10333–10350. [Google Scholar] [CrossRef]
  26. Bu, X.; Xie, Z.; Liu, J.; Wei, L.; Wang, X.; Chen, M.; Ren, H. Global PM2.5-attributable health burden from 1990 to 2017: Estimates from the Global Burden of disease study 2017. Environ. Res. 2021, 197, 111123. [Google Scholar] [CrossRef]
  27. Assembayeva, M.; Egerer, J.; Mendelevitch, R.; Zhakiyev, N. A spatial electricity market model for the power system: The Kazakhstan case study. Energy 2018, 149, 762–778. [Google Scholar] [CrossRef]
  28. Benchrif, A.; Wheida, A.; Tahri, M.; Shubbar, R.M.; Biswas, B. Air quality during three COVID-19 lockdown phases: AQI, PM2.5 and NO2 assessment in cities with more than 1 million inhabitants. Sustain. Cities Soc. 2021, 74, 103170. [Google Scholar] [CrossRef] [PubMed]
  29. Moniruzzaman, C.G.; Bowden, J.; Arunachalam, S. Aircraft landing and takeoff emission impacts on surface O3 and PM2.5 through aerosol direct feedback effects estimated by the coupled WRF-CMAQ model. Atmos. Environ. 2020, 243, 117859. [Google Scholar] [CrossRef]
  30. Almeida, S.; Manousakas, M.; Diapouli, E.; Kertesz, Z.; Samek, L.; Hristova, E.; Šega, K.; Alvarez, R.P.; Belis, C.; Eleftheriadis, K. Ambient particulate matter source apportionment using receptor modelling in European and Central Asia urban areas. Environ. Pollut. 2020, 266, 115199. [Google Scholar] [CrossRef]
  31. Li, P.; Nord, N.; Ertesvåg, I.S.; Ge, Z.; Yang, Z.; Yang, Y. Integrated multiscale simulation of combined heat and power based district heating system. Energy Convers. Manag. 2015, 106, 337–354. [Google Scholar] [CrossRef]
  32. Ma, W.; Fan, J.; Fang, S.; Hassan NM, S.; Zhang, Y.; Wu, X.; Li, Y.; Hu, R.; Liu, G. Energy efficiency indicators for combined cooling, heating and power systems. Energy Convers. Manag. 2021, 239, 114187. [Google Scholar] [CrossRef]
  33. C. D. o. E. A. I. Division and D. Fleming. Organization for Economic Co-operation and Development. 1961. Available online: https://www.cambridge.org/core/journals/international-organization/article/abs/organization-for-economic-cooperation-and-development/84F3EBC868646D21139731082D2049F2 (accessed on 23 May 2023).
  34. Choi, M.-W.; Lee, J.-H.; Woo, J.-W.; Kim, C.-H.; Lee, S.-H. Comparison of PM2.5 chemical components over East Asia simulated by the WRF-Chem and WRF/CMAQ models: On the models’ prediction inconsistency. Atmosphere 2019, 10, 618. [Google Scholar] [CrossRef]
Figure 1. Flow of data from the Weather Research and Forecasting Model (WRF) to the Atmospheric Air Dispersion Model (AERMOD).
Atmosphere 14 01554 g001
Figure 2. Typical input data for point source calculation in AERMOD.
Atmosphere 14 01554 g002
Figure 3. Domain set-up (LH) and Geographical Location of CHPP-2 and CHPP-3 (RH).
Atmosphere 14 01554 g003
Figure 4. Scatter plot between Simulated and Observed (US Embassy) PM2.5 Concentration (Uncontrolled).
Atmosphere 14 01554 g004
Figure 5. Scatter plot between Simulated and Observed (AirKaz.org) PM2.5 Concentration (uncontrolled).
Atmosphere 14 01554 g005
Figure 6. Dispersion of PM2.5 in Almaty—14-Day Simulation (ug/m3), (a) CHPP-2, (b) CHPP-3, and (c) CHPP-2 and CHPP-3 in Almaty (Controlled).
Atmosphere 14 01554 g006
Figure 7. Dispersion of PM2.5 in Almaty—14-Day Simulation (μg/m3) (a) CHPP-2, (b) CHPP-3, and (c) CHPP-2 and CHPP-3 in Almaty (uncontrolled).
Atmosphere 14 01554 g007
Table 1. Overview of the WRF-ARW details used for Meteorology simulation.
Vertical CoordinateTerrain—Following Hydrostatic Pressure
Covered area43.239° N, 76.889° E
WRF CoreARW
Interval6 h
Map ProjectionMercator
Integration time step90 s
DataNCEP FNL
Grid size(112 × 112) × 27
Horizontal grid systemArakawa—C Grid
No. of Domain1
Start date and time2021-01-01_00:00:00
End date and time2021-01-15_00:00:00
DynamicsNon-hydration
Resolution10 km × 10 km
Table 2. Comparison between Maximum PM2.5 concentration from simulation using WRF-AERMOD and Observed data obtained from the US Embassy website and AirKaz.org from 1–14 January 2021 (uncontrolled).
Station 1 *—Daily Average (µg/m3)Station 2 *—Daily Average (µg/m3)
Observed Conc.ControlledUncontrolledObserved Conc.ControlledUncontrolled
DaySimulated Conc.% ContributionSimulated Conc.% ContributionSimulated Conc.% ContributionSimulated Conc.% Contribution
1148.500.020.011.551.05170.300.060.044.462.62
284.920.010.010.840.99115.040.040.032.522.19
3106.850.000.000.200.18140.180.070.054.713.36
4133.780.030.022.031.52155.430.020.011.040.67
5130.360.030.022.211.70138.460.040.033.092.23
6152.960.080.055.433.55141.710.070.054.263.00
7140.830.120.088.466.00174.420.110.067.934.55
8173.430.060.044.552.62162.420.060.044.382.69
9153.870.030.022.051.33138.280.030.022.081.50
10176.130.090.056.743.82107.300.100.096.866.30
11100.825.505.45392.63389.4274.272.633.530.350.48
1279.800.010.010.180.2346.590.010.020.290.62
1332.870.010.030.070.2162.580.010.020.150.23
1429.220.050.173.4711.8665.230.050.093.926.01
* Station 1—US Embassy monitoring station, Almaty, Kazakhstan. * Station 2—AirKaz.org Monitoring Stations, Almaty, Kazakhstan.
Disclaimer/Publisher’s Note: The statements, opinions and data contained in all publications are solely those of the individual author(s) and contributor(s) and not of MDPI and/or the editor(s). MDPI and/or the editor(s) disclaim responsibility for any injury to people or property resulting from any ideas, methods, instructions or products referred to in the content.

