Article

The Effect of Green Roofs and Green Façades in the Pedestrian Thermal Comfort of a Mediterranean Urban Residential Area

1
Laboratory of General and Agricultural Meteorology, Agricultural University of Athens, Iera Odos 75, 11855 Athens, Greece
2
Laboratory of Technology and Policy of Energy and the Environment, School of Applied Arts and Sustainable Design, Hellenic Open University, Parodos Aristotelous 18, 26335 Patra, Greece
3
Laboratory of Urban Planning and Architecture, Department of Civil Engineering, School of Engineering, University of West Attica, 250 Thivon & P.Ralli Street, 12241 Athens, Greece
*
Author to whom correspondence should be addressed.
Atmosphere 2023, 14(10), 1512; https://doi.org/10.3390/atmos14101512
Submission received: 29 August 2023 / Revised: 27 September 2023 / Accepted: 27 September 2023 / Published: 29 September 2023

Abstract

:
The present study investigated the cooling effect of extensive green roofs and green façades, at the pedestrian level, of a Mediterranean densely populated neighborhood. The ENVI-met environmental model was employed to simulate the microclimatic environment on a typical summer day. Thermal conditions of the study area were evaluated based on air temperature and the Mediterranean thermal stress scale of UTCI (Universal Thermal Climate Index). Three mitigation strategies were developed to ameliorate the thermal conditions in the examined area focusing on the efficacy of green façades, green roofs, and the synergetic effect of the green façade and green roof. The mitigation strategies’ performance was evaluated in characteristic design layouts of the study area, namely the following: a typical Mediterranean square, a church with a churchyard, an avenue, NS and EW street orientations, and courtyards. Results showed that compared to the existing configuration, the synergetic effect of the green façade and green roof achieved the greatest amelioration of the thermal conditions during the hottest hours of the day (12:00–18:00) since it produced an average Tair reduction of up to 0.7 °C and a UTCI reduction of 1.6 °C (both in the courtyards design layout). Among the examined design layouts, the courtyards produced the greatest reductions in air temperature and UTCI, whereas the EW streets were the lowest.

1. Introduction

To address the adverse effects of increasing temperatures and the heat island phenomenon, in the last decades, numerous studies evaluated a variety of mitigation and adaptation strategies on their efficacy to ameliorate the thermal conditions within the urban context. Many studies focused on green infrastructure attempting to evaluate the benefits of additional vegetation in existing open spaces (e.g., [1,2,3]), or the effects of different tree species in the urban environment [4]. Others investigated the efficacy of street orientation [5], blue infrastructure [6], and high-albedo materials [7,8]. In their research, Lovatto et al. [8] conducted a study on various building materials to assess their impact on both albedo and thermal comfort. Their objective was to analyze the cost-effectiveness and comfort level of housing units. Their findings emphasized the significance of albedo as a crucial factor in enhancing the sustainability of construction.
Today, green roofs and green walls have gradually been involved in the concept of greening strategy to cope with urban environmental challenges [9]. The alteration of conventional building roofs and walls into green roofs and green walls can be effective by increasing the number of green areas in cities without the requirement of additional open spaces. In addition, such alteration in conventional building materials into green roofs and walls is effective in reducing both the air and the surface temperature [10]. Green roofs can be classified into extensive and intensive [11]. Extensive green roofs consist of a substrate layer with a depth of less than 15 cm, whereas the substrate layer of intensive green roofs is wider than 15 cm, allowing for more complex vegetation, including trees [12]. The green walls can be classified into green façades and living walls. The green façade is characterized by the absence of substrate, whereas in the case of green walls, there is a vertical substrate that is adhered to the building envelope [13].
To date, the cooling effect of green roofs and green façades is often examined in certain spots of a single building or different building configurations [9,14,15], with maximum temperature reduction [16] or range [17], rather than on several urban blocks within a neighborhood. Some studies, even though investigating the thermal environment in a neighborhood, focused their attention on the mean temperature reduction without estimating the impact on the human sensation perspective, i.e., [11]. The cooling effect of green roofs and façades has been examined in several urban contexts of different climatic types such as temperate [9], Mediterranean [11], and tropical [18]. A recent study that examined the life cycle assessment of green roofs reported that thermally insulated green roofs provided improvement in the energy consumption for heating and cooling, and reductions in total life cycle energy consumption, CO2 emissions, and waste production. The extensive green roof types performed better in all the above-mentioned estimations and provided a better economic choice for the private owner [19].
Many of the above-mentioned studies have employed computational fluid dynamic (CFD) models for the simulation of the thermal environment within the urban context. ENVI-met software is a widely used 3D environmental model among the studies that examine the surface–plants–air interactions in the urban environment. Therefore, it has extensively been tested in several cities worldwide with different climatic characteristics, such as in humid subtropical [20], temperate [21], and Mediterranean [22] climates. In addition, previous studies have confirmed the accuracy of ENVI-met results in green-roof-related research [23,24,25] and at the pedestrian level [26,27]. ENVI-met software is preferred by several investigators whose research attempted to evaluate the microclimatic environment in various urban configurations such as urban canyons [20], parks and squares [28], green roofs, and green walls [18]. In this context, several bioclimatic indices have been used for the assessment of outdoor thermal conditions, such as the Predicted Mean Vote PMV [29], the Physiologically Equivalent Temperature (PET) [30], and the Universal Thermal Climate Index (UTCI) [31]. Investigators use thermal indices to assess the effectiveness of examined design scenarios in a variety of urban layouts (e.g., [32,33,34]).
In Greece, the few studies that have, so far, investigated the effect of green roofs or green façades have focused mainly on the building scale performance reporting both air and surface reductions [35], as well as energy consumption saving up to 15% [14], 0.7 K indoor air temperature reductions [36,37], and significant reductions in released sensible heat depending on the Leaf Area Index (LAI) of the grown plants [38].
Athens is the largest city in Greece and a Mediterranean coastal city. Athens’s 2023 population is estimated at 3,169,158 and it is currently the seventh-largest urban area in the European Union. According to Eurostat (2018) [39], the central sector of Athens is the second most densely populated in Europe, with 10,436 people per square kilometer. According to OECD (Organisation for Economic Co-operation and Development) report (2014) [40], Athens is listed in the fourth from the last position concerning the greenery per inhabitant, with only 0.96 m2, an amount that is approximately 10 times lower than that set by the WHO (World Health Organization, 2010) [41] for cities (9.00 m2/inhabitant).
Considering the limited free space of Athens due to building density, it was considered of great importance to investigate the efficacy of green roofs and green façades on the thermal conditions in an Athens neighborhood, located in the west suburbs of Athens center. This particular area was selected to be examined because it encompasses several essential elements central to the daily lives of its residents, such as transportation, recreational spaces, and a local market, all within the context of an urban neighborhood. It also includes a central square with a metro station and an adjacent church with a churchyard, making it a densely populated hub within the neighborhood. Additionally, it is surrounded by a major avenue in Athens with heavy traffic flow, as well as north–south and east–west streets that encircle the residential blocks. This area, which encapsulates these diverse urban characteristics at the neighborhood level, has the potential to transform into a smart city through appropriate interventions. A preliminary study that evaluated the microclimatic environment of the current design layout of the examined urban blocks has already been performed [42]. Results revealed adverse thermal conditions throughout the study area and identified hot spots, especially in the EW street and the avenue. In the current research, the thermal conditions of the study area were investigated both in the existing configuration as well as in three mitigation strategies that evaluated the efficacy of the green roofs, green façades, and their combination on the thermal environment. The cooling effect of the mitigation strategies was evaluated in different design layouts of the examined area, i.e., the squares, the EW and NS streets, the avenue, and the courtyards. For the aim of the current study, ENVI-met was considered a suitable model for the microclimatic simulations of the study area. To the best of our knowledge, this is the first study that has attempted, so far, to investigate the thermal performance of green roofs and façades in an extensive urban neighborhood of Athens such as the selected one. In addition, the current study attempted to quantify the cooling effect magnitude of the mitigation strategies in selected design layouts aiming at identifying whether certain configurations may amplify the effectiveness of the interventions indicating a synergetic effect. The provided outcomes may be crucial for urban designers in the implementation of UHI mitigation strategies in high-density urban areas with a Mediterranean climate.

2. Materials and Methods
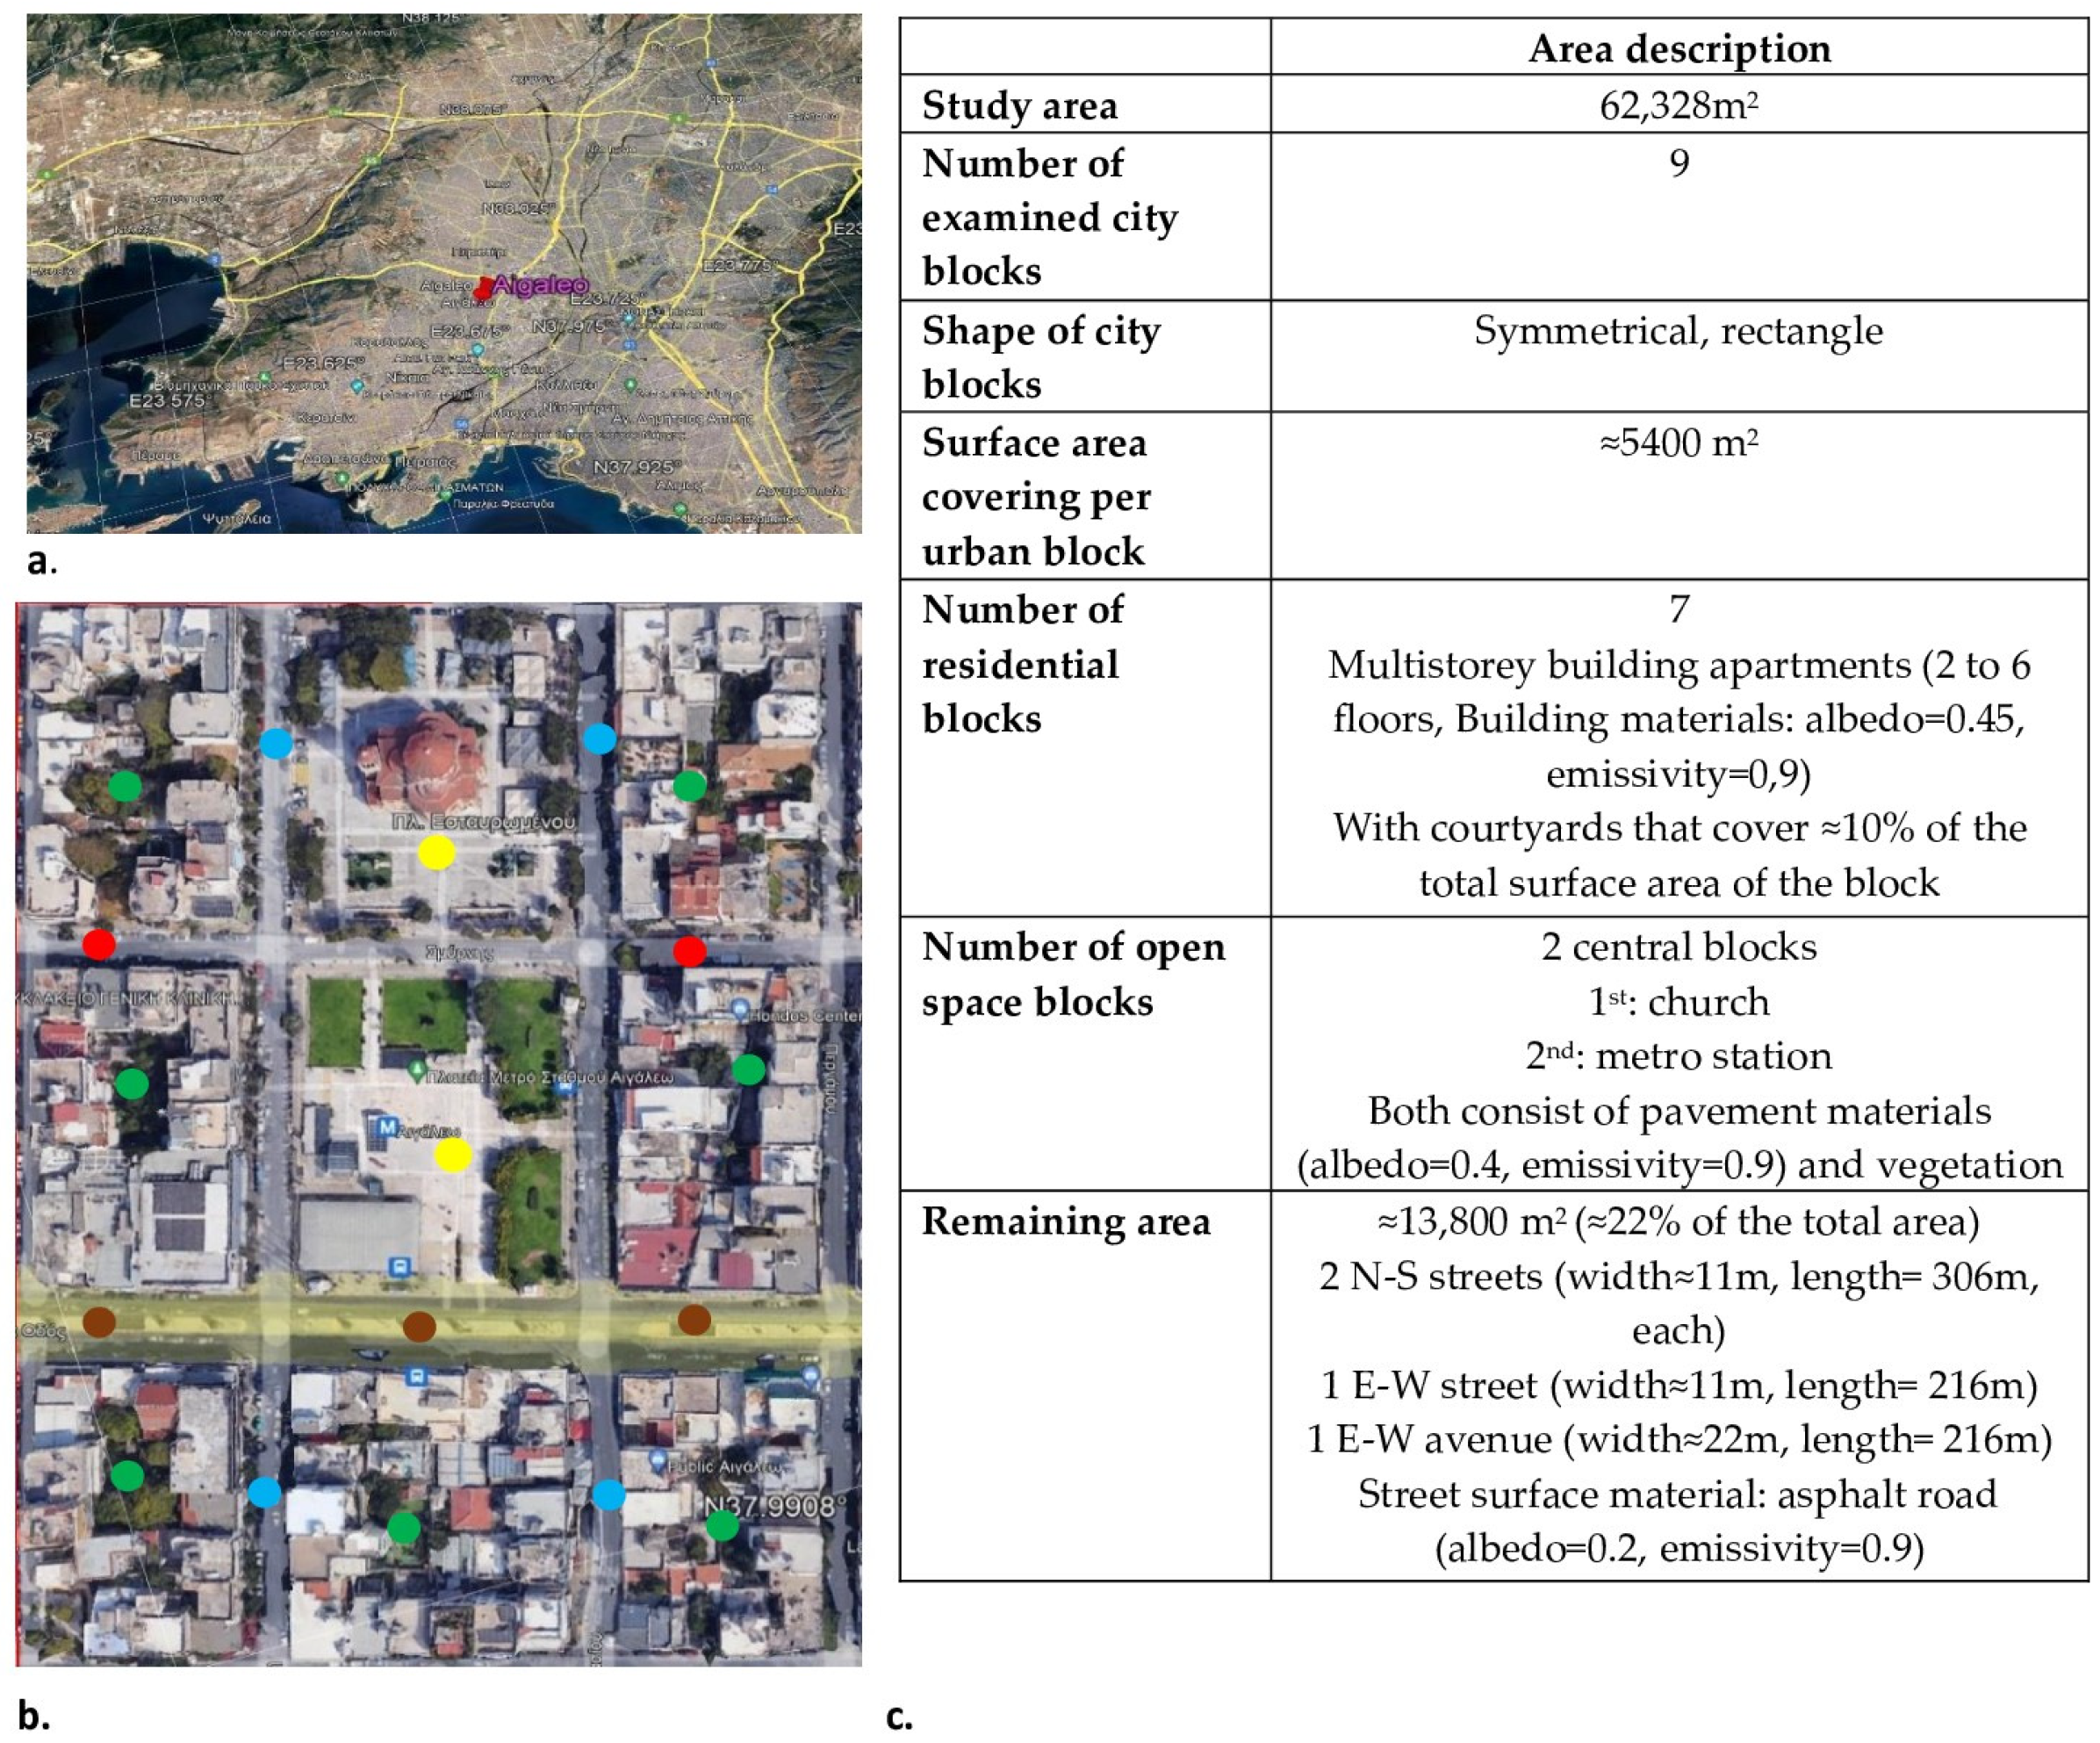
The current design layout of the study area (Figure 1) was evaluated with respect to the thermal environment during a typical summer day using the environmental model ENVI-met to simulate the thermal conditions for the examined day. Thermal conditions were assessed based on air temperature and UTCI [31]. A number of mitigation strategies with an emphasis on the cooling effect of green roofs and green façades were developed and their effect on the thermal environment was evaluated and compared to the current design layout.

2.1. Study Area

This study was carried out in a western suburban area of Athens, located at 37°59′31″ N and 23°40′41″ E at 50 m (Figure 1a) covering a total area of ≈62,000 m2. The study area consists of nine symmetrical city blocks, covering a total of ≈4500 m2, from which seven constitute residential blocks and the remaining two constitute two open urban spaces (Figure 1b). An analytical description of the urban blocks’ characteristics is given in Figure 1c, whereas the physical characteristics of the green elements are presented in Table 1.

2.2. Climatic Characteristics

According to the world map of Köppen–Geiger climate classification, Athens belongs to the Csa climate zone, enjoying a Mediterranean climate characterized by hot, dry summers and mild, rainy winters [43]. The summer mean daily temperature is 27.3 °C. The prevailing wind direction is north-northeast at the end of summer, in autumn and winter, and south-southwest in spring and the beginning of summer. For the aim of the current study, 11 July 2022 was selected to evaluate the microclimatic environment of the study area. The authors recognize that the theoretical estimators and the description of the spatial dependence structure are influenced by the geodesic distance, shape, and sample size [44]. The aim of the current study, however, was the evaluation of typical summer conditions, and therefore 11 July was selected since the microclimatic parameters of that day corresponded to the characteristics of a typical summer day. Previous studies that aimed at investigating the thermal conditions on typical summer days have also conducted environmental simulations on a single representative day [2,18,26,45,46]. The meteorological characteristics of the examined day are shown in Table 2 (meteorological data derived from the nearest automatic weather station NOAAN network of NOA (Korydallos, ELEV: 75 m LAT: 38° 00′ N LONG: 23° 36′ E)).

2.3. Model Simulation

The ENVI-met [47,48] environmental model was employed to simulate the distribution of the microclimatic conditions in the examined urban blocks on a typical summer day in July.
ENVI-met provides a maximum of 250 × 250 × 30 (x-y-z) model domain with a typical horizontal resolution between 0.5 and 10 m. The typical time frame varies from 24 to 48 h with a typical time step between 1 and 5 s.
For the model simulations requirements, the meteorological data of air temperature (°C) (daily mean, maximum, and minimum), relative humidity (%) (maximum and minimum), and wind speed (maximum and minimum) were provided by the nearest to the study area automatic weather station located in Korydallos. A summary of the meteorological variables applied in the simulation domain is presented in Table 2.
The microclimatic simulations were performed for 24 consecutive hours, starting from 1 a.m. to 23 p.m. The examined area has a size of 213 × 294 m resulting in 85 × 117.6 × 30 cells with a resolution of 2.5 × 2.5 × 2.5 m (Table 2). Regarding the vertical height resolution of the model area, the ENVI-met users’ guide recommends that the domain height must be at least twice the height of the tallest object in the domain. Therefore, the vertical size of the cell grids was 2.5 m with a total number of 30 (i.e., the spatial height of the model = 75 m). To gather more precise information about the area where the occupants are typically affected by the microclimatic environment, the initial 3 m were designed with a cell height of 0.5 m.
In addition, 4 nesting grids were set at each edge of the model area in order to increase the distance between the lateral boundaries of the model and to avoid any boundary effect.
Although simulation results occur for several heights from the ground level (depending on the predefined scale of the model domain), we present the microclimatic outputs at the pedestrian level of 1.4 m above the ground surface.
The accuracy of the model simulations for the study area was evaluated by calculating the root mean square error (RMSE), the mean absolute error (MAE), and the index of agreement (d) in the study of [49] giving adequate validation scores for Tair (d = 0.8; MAE = 1.6 °C; RMSE 2.0 °C), UTCI (d = 0.8; MAE = 3.3 °C; RMSE 4.3 °C), mean radiant temperature, Tmrt °C (d = 0.6; MAE = 11.1 °C; RMSE = 13.8 °C, wind speed, WSP m × s−1 (d = 0.5; MAE = 0.6; RMSE = 0.9). These measures of model accuracy have also been used in other studies as well [2]. Based on the above results, the Tair and UTCI were adequately simulated by the model, whereas Tmrt and WSP provided lower validation scores.

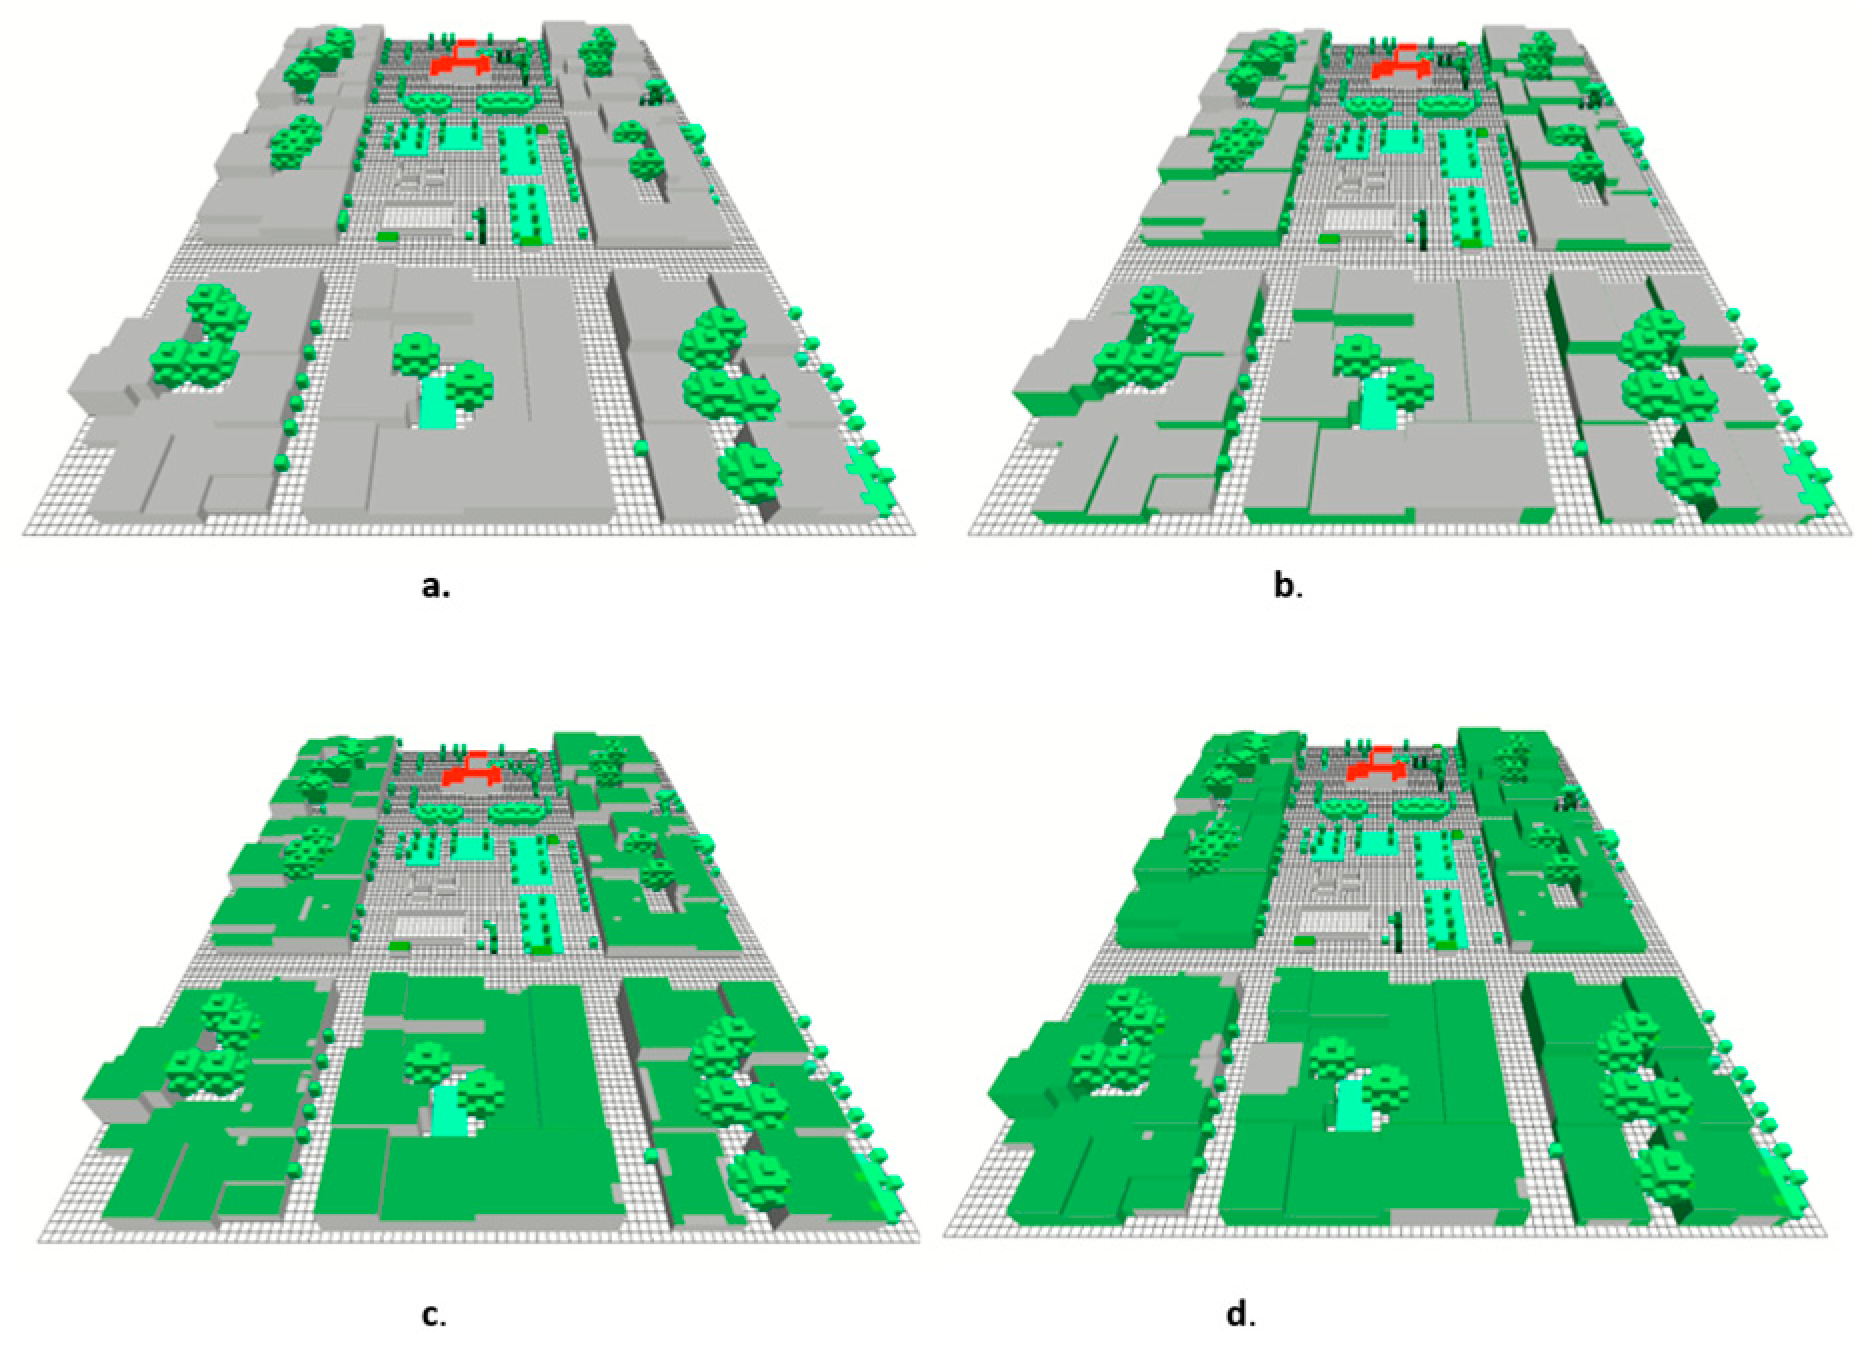
2.4. Mitigation Strategies

In addition to the current design layout of the residential blocks, three mitigation strategies were implemented and evaluated as regards their cooling effect and thermal conditions improvement to the existing design layout. Figure 2 shows a 3D display of the current design layout and the mitigation strategies in the study area. For the sake of simplicity and computational feasibility, this study applied uniform plant species for the mitigation strategies. More specifically, Hedera Helix (Ivy) was selected since it is a common species in the Mediterranean climate and it has previously been tested for its suitability as an effective [50], bioprotective plant [51] with a low cost that notably reduces the wall temperatures [52]. The properties of the selected species are presented in Table 3.
Current design layout: ID: Code: UB_C—corresponds to the current design layout of the study area (Figure 2a).
Mitigation strategy 1: Code: UB_GF—The building walls have been replaced with a green façade (100% coverage) (Figure 2b).
Mitigation strategy 2: Code: UB_GR—The existing rooftop materials have been replaced with vegetation (100% coverage) (Figure 2c). For the present study, extensive green roofs were selected to cover the rooftops of the buildings, taking into consideration that the extensive green roof types have a better ecological footprint and provide a better economic choice [19].
Mitigation strategy 3: Code: UB_GF_GR—Combination of UB_GF and UB_GR (Figure 2d).
Further information regarding the physical characteristics of the mitigation strategies is given in Table 3.
The mitigation strategies’ performance has been evaluated in several different design layouts across the examined area aiming at identifying whether certain design layouts amplify the cooling effect of the mitigation strategies indicating a synergetic effect. Representative spots per design layout are shown in Figure 1b. More specifically, the mitigation strategies’ performance has been evaluated in several spots inside the courtyards (green bullets in Figure 1b), the NS street direction (blue bullets in Figure 1b), the EW avenue (brown bullets), the EW street (red bullets in Figure 1b), as well as the two squares (churchyard and metro station) (yellow bullets in Figure 1b). The performance of the examined mitigation strategies per design layout, in terms of the change induced at pedestrian height (1.4 m), was evaluated and compared to the current design layout of the study area.

2.5. Thermal Comfort

Thermal conditions in the study area both in the current design layout and under the examined mitigation strategies were evaluated using air temperature (Tair, °C), as the simplest index of thermal sensation and the bioclimatic index UTCI (Universal Climate Thermal Index) [31]. UTCI (°C) is a bioclimatic index based on empirical relationships between the metabolic rate of activity and the body’s mean skin temperature and evaporative heat loss under comfort conditions. We assumed a typical male (35 years old; 1.75 tall; weight 75) for the thermo-physiological parameters of the human body, whereas clothing values of 0.5 and an activity level of 1.4 MET were set for the index calculations. The Mediterranean thermal stress scale of UTCI was considered appropriate to be used in this study [34]. The original and the Mediteranean UTCI scales are presented in Table 4.
We used the ENVI-met BioMet [53] post-processor tool to calculate UTCI. The BioMET calculates a number of well-known bioclimatic indices from the ENVI-met ‘atmosphere’ output file by summarizing the impact of the hourly air temperature, humidity, radiative temperature, and wind speed on human thermal sensation.

3. Results

This section analyzes and compares the microclimatic green roof and green façade effects based on the simulated hourly values of Tair (°C) and UTCI (°C) at the pedestrian level (z = 1.4 m) in the above-mentioned examined design layouts. The spatial distribution of thermal conditions in the urban blocks is presented for 16:00 LST representing the time of the day with the maximum heat load.

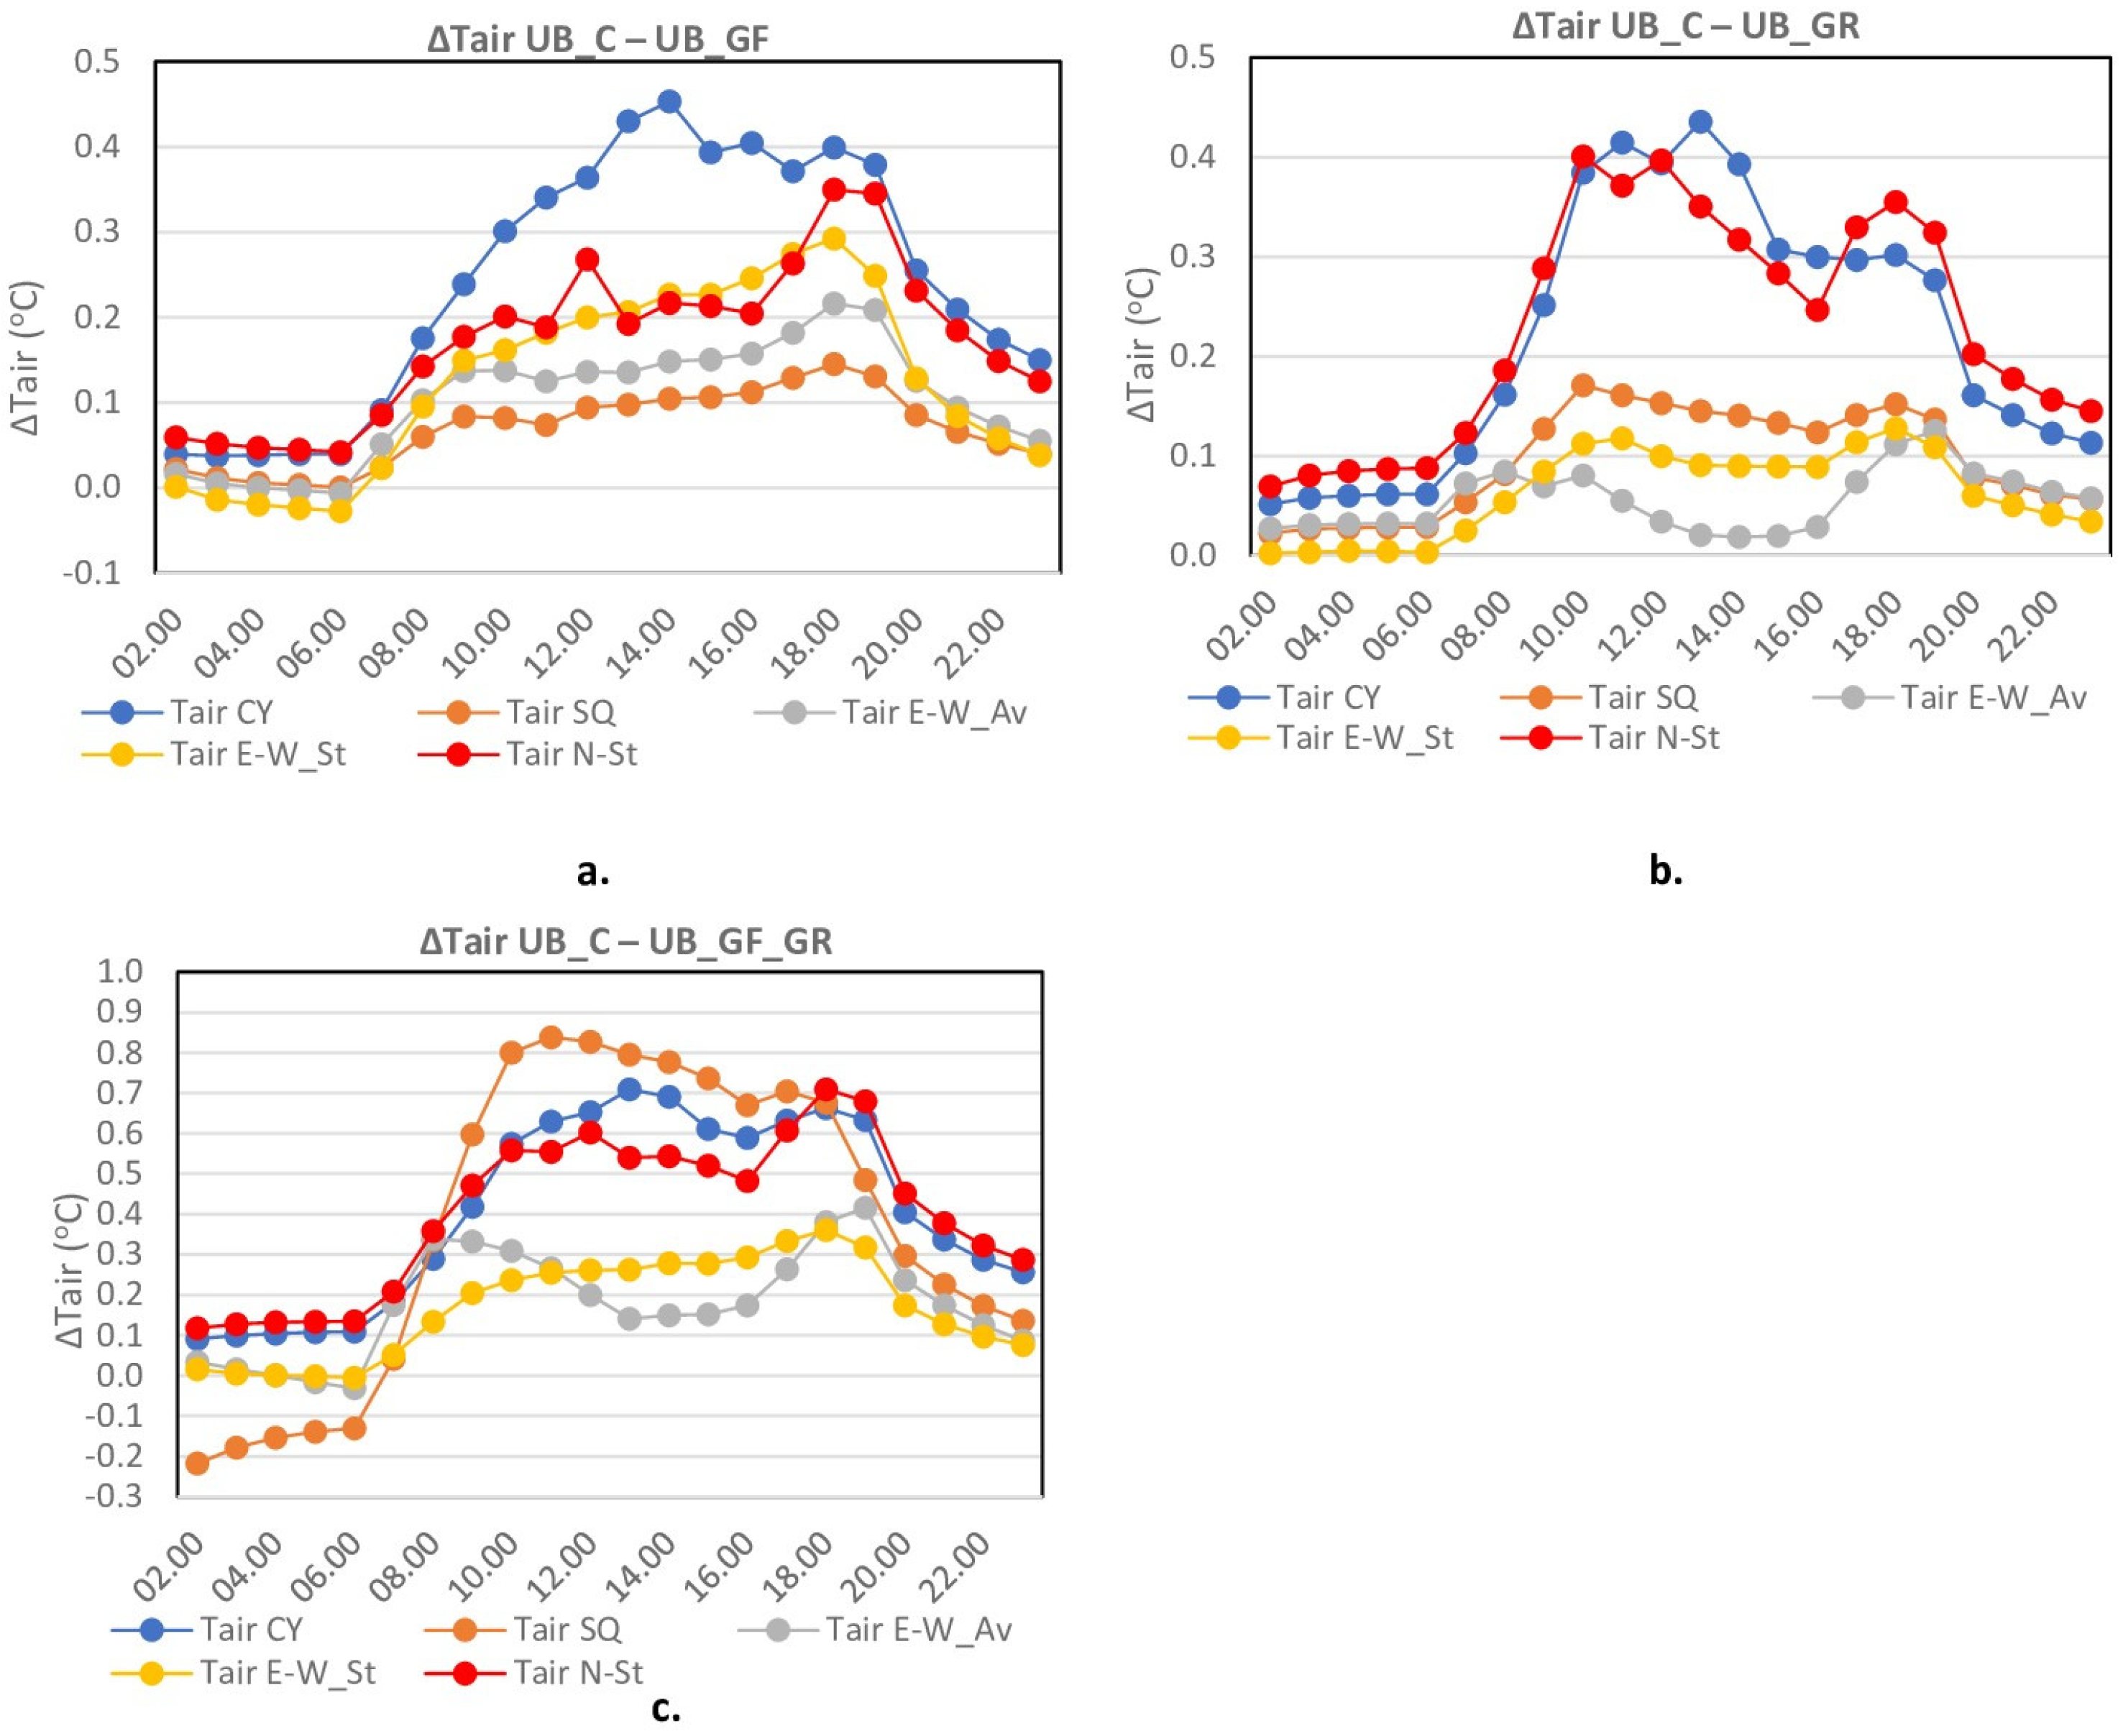
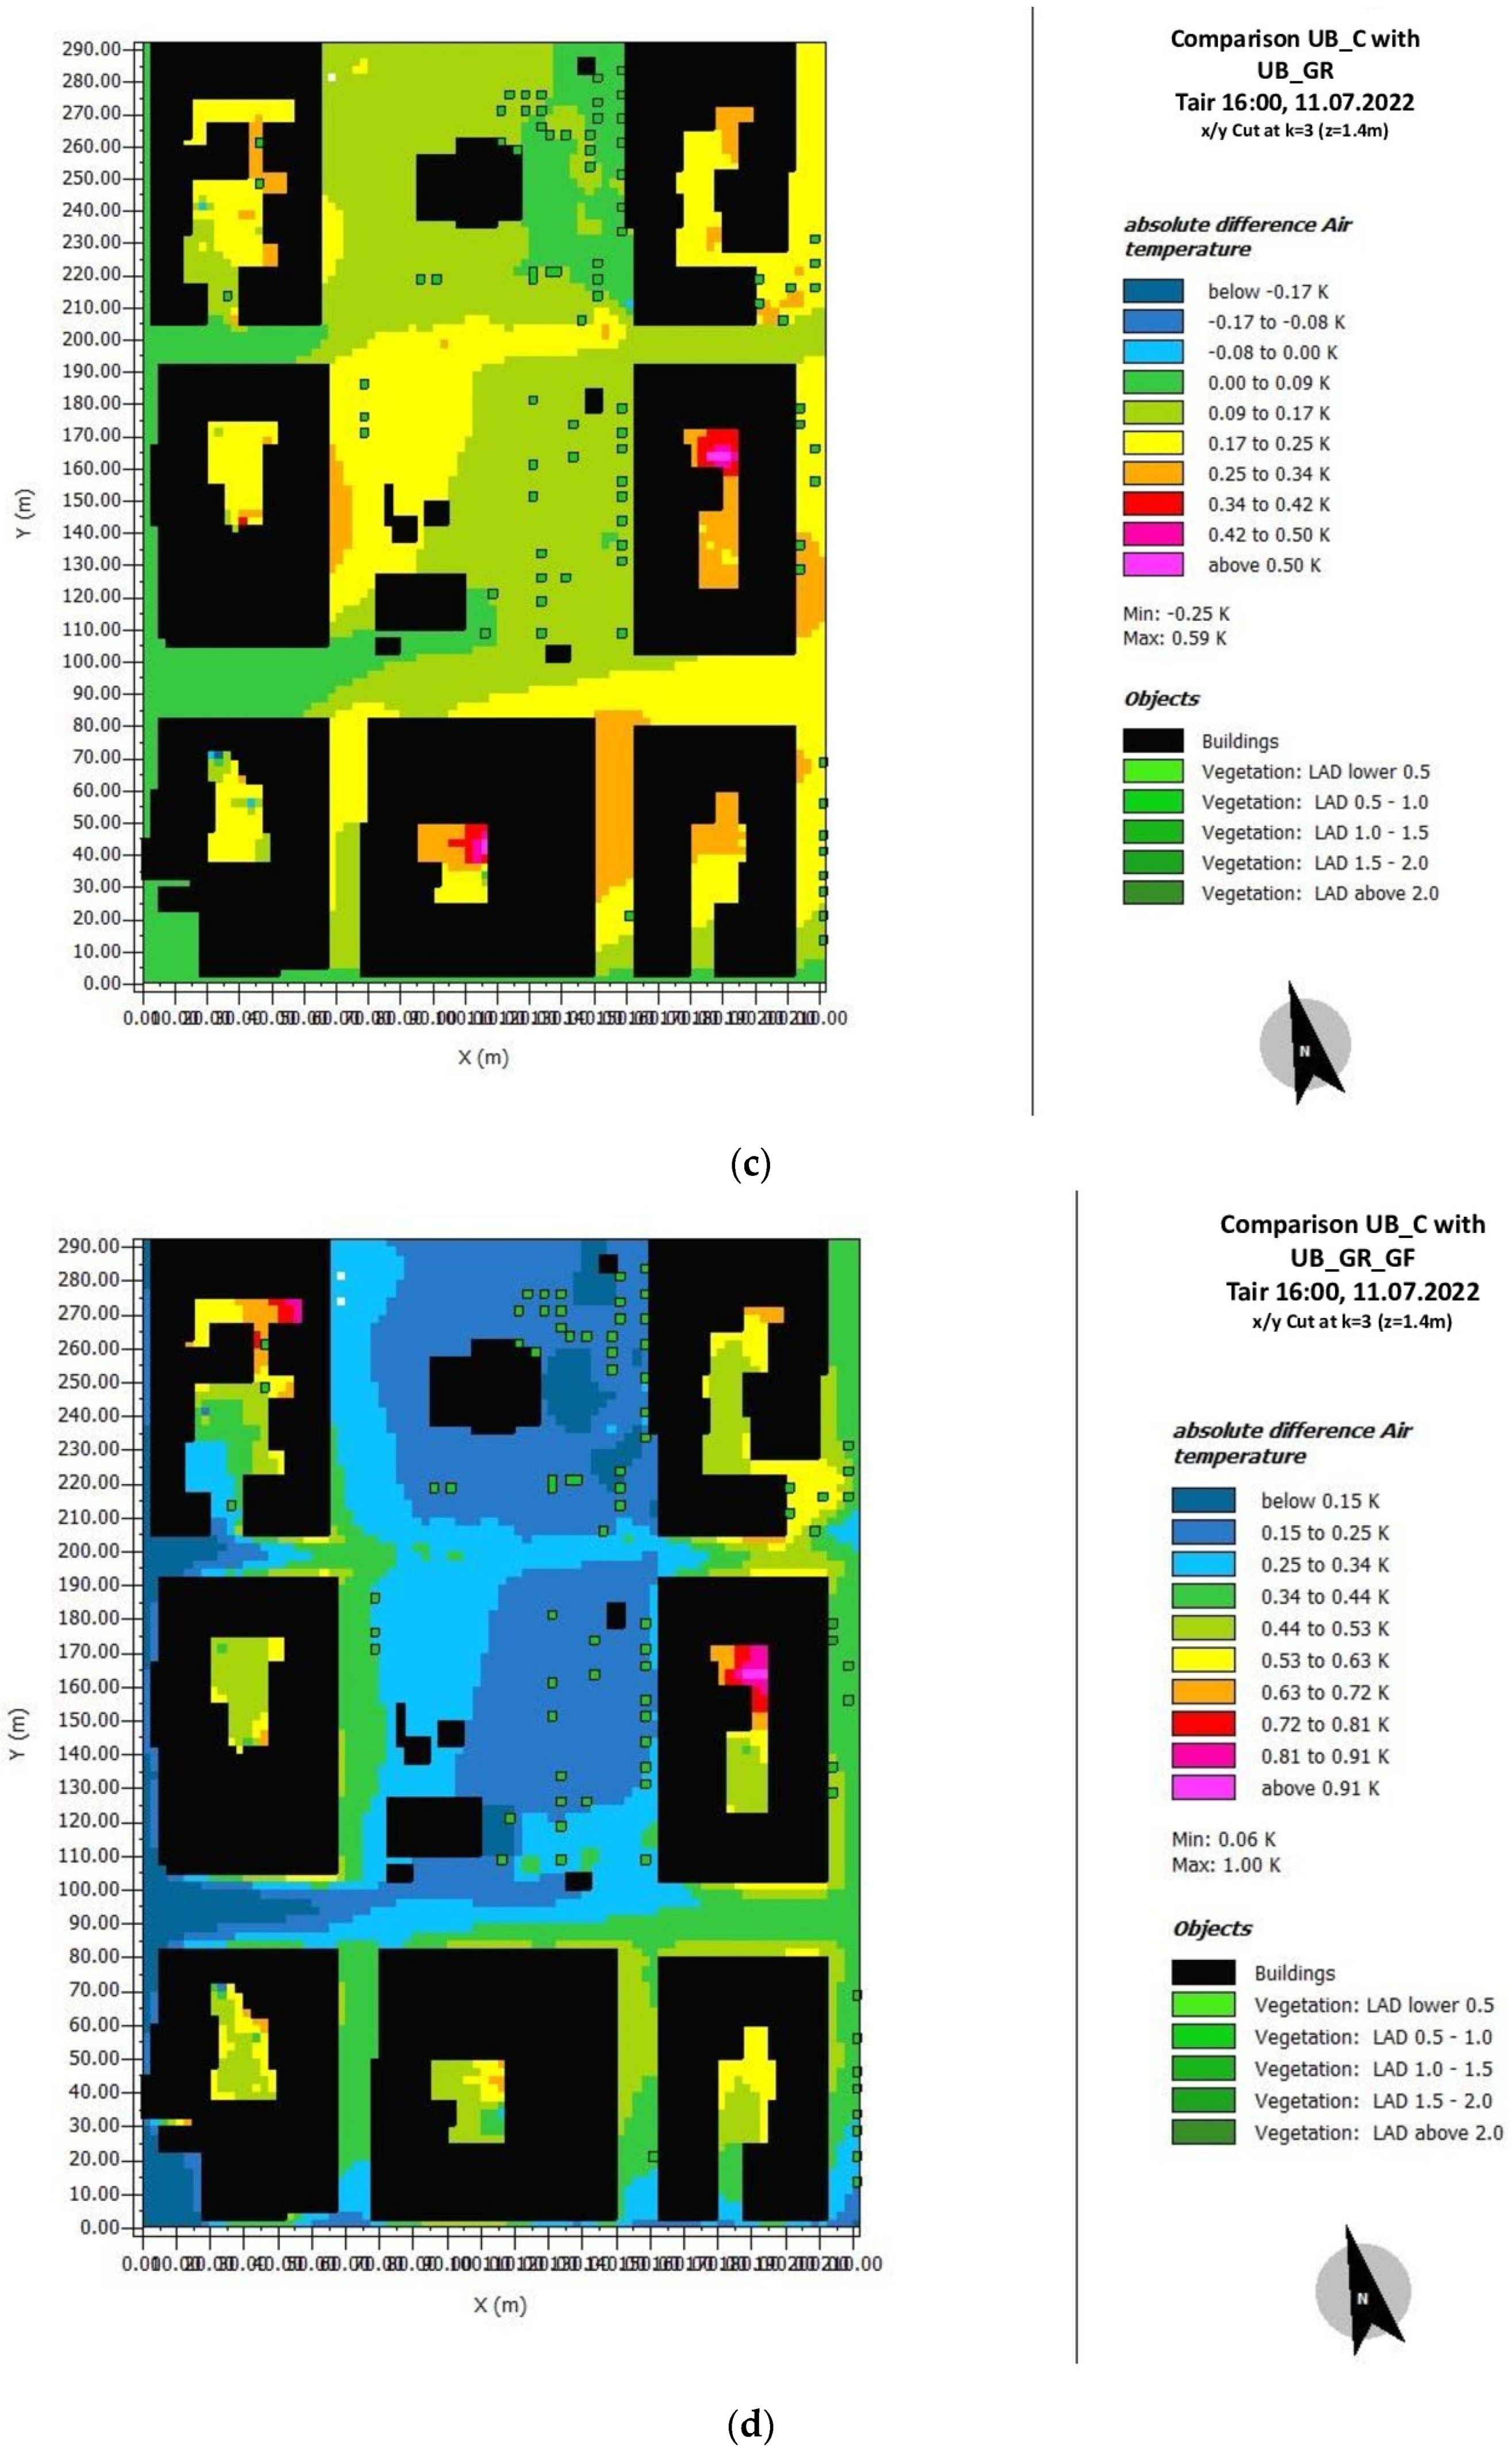
3.1. Air Temperature

The hourly variations in air temperature in the examined design layouts in the UB_C configuration (Figure 3a) and in the UB_GR (Figure 3b), UB_GF (Figure 3c), and UB_GF_GR (Figure 3d) mitigation strategies are presented from 2:00 LST to 23:00 LST. As can be seen, in all the examined cases, the courtyards (‘CY’) design layout induced a higher cooling effect during the day, followed by the north–south street (‘N-S_St’). In the case of the courtyards (‘CY’) design layout, this may imply that the cooling effect of green roofs and green façades is amplified by the synergetic effect of already existing greenery found in the courtyards (‘CY’). In the case of the north–south street (‘N-S_St’), this may occur due to the street orientation that favors the shading from the surrounding buildings. On the other hand, the east–west street (‘E-W_St’) induced a higher hourly Tair, especially during the warmer hours of the day, and the mitigation strategies had the minimum effect on ameliorating the thermal conditions in this design layout. This pattern is repeated in all the examined mitigation strategies (Figure 3b–d). Additionally, all the design layouts under the examined mitigation strategies reached their peaks at 16:00. Table 5 presents the daily average air temperature (Taird) and the average temperature from 12:00 to 18:00 (Tairh) in all the examined design layouts of the current design layout and the mitigation strategies, as well as the corresponding reductions in the daily average air temperature (ΔTaird) and the average temperature from 12:00 to 18:00 (ΔTairh) achieved by the interventions.
The greatest Taird and Tairh cooling effect in the study area was achieved under the UB_GF_GR mitigation strategy, where the maximum ΔTairh (0.74 °C) was observed in the square (‘SQ’) design layout, probably due to the additional effect of the existing vegetation of the square (‘SQ’). Although the UB_GF and the UB_GR achieved similar ΔTaird, the UB_GF achieved slightly better ΔΤairh in all the design layouts. The minimum ΔTairh (0.0 °C) was observed under the UB_GR mitigation strategy in the east–west avenue (‘E-W_AV’) design layout. A closer look at the hourly ΔTair achieved due to the mitigation strategies in the examined design layouts of the study area is shown in Figure 4. It is worth mentioning that each mitigation strategy had a varying impact on the examined design layouts. More specifically, the UB_GF produced the greatest cooling effect in the courtyards (‘CY’) and the minimum in the square (‘SQ’) (Figure 4a), whereas the UB_GR had the minimum cooling effect in the east–west avenue (E-W_Av) (Figure 4b). Considering that the east–west avenue (E-W_Av) produced the most adverse thermal conditions in the study area under the current conditions, the green façade (UB_GF) is the preferred design strategy in this case. The same applies in the east–west street (‘E-W_St’) since UB_GR produced the lowest cooling effect (Figure 4b) compared to the other two mitigation strategies. The square (‘SQ’) was most favored by the implementation of green roofs, i.e., UB_GR (Figure 4b), and particularly by UB_GF_GR (Figure 4c), whereas the UB_GF did not achieve significant Tair reductions in this design layout. Finally, the north–south street (N-S_St) was clearly favored by the implementation of the UB_GF_GR (Figure 4c). The maximum hourly ΔTair (0.8 K) was achieved under the UB_GF_GR mitigation strategy in the square (‘SQ’) design layout for five continuous hours from 10:00 to 14:00 LST (Figure 4c). This is a significant finding since it highlights that the synergetic effect of green roofs and green façades is not restricted locally, but affects the central part of the study area, where the square is located.
Figure 5 shows the spatial distribution of Tair throughout the study area at 16:00 LST, the hottest hour of the day, in the current design layout (UB_C), as well as the comparison between the UB_C and the mitigation strategies. In the current design layout, the Tair varies between 32.0 °C and 34.8 °C. The lowest Tair values are observed in the square (‘SQ’) and the courtyards (‘CY’) design layouts, as well as in the north–south street (N-S_St) design layout. The east–west street (E-W_St) and east–west avenue (E-W_Av) induced the highest Tair values (Figure 5a). The ΔΤair induced by the UB_GF varied from 0.13 K to 0.76 K throughout the study area. The greatest ΔΤair was induced in the courtyards (‘CY’), compared to the other design layouts (Figure 5b). The ΔΤair induced by the UB_GR varied from −0.17 K (indicating areas where the Tair slightly increased after the intervention) to 0.76 K across the study area. As was observed in the case of UB_GF, the greatest ΔΤair was induced in the courtyards (‘CY’) design layout (Figure 5c). Finally, the ΔΤair induced by the UB_GF_GR varied from 0.15 K to 0.91 K throughout the study area. Similarly to the before-mentioned cases, the greatest ΔΤair was induced in the courtyards (‘CY’) design layout (Figure 5d).
A more detailed evaluation of the cooling effect induced in the examined design layouts under the different mitigation strategies was carried out. Since the east–west street (‘E-W_St’) resulted in the highest hourly Tair during the day in all the examined cases, Table 6 presents the Taird and Tairh differences between the east–west street (‘E-W_St’) and the other examined design layouts in all the mitigation strategies aiming at identifying the differentiations that occur in the different design layouts of the study area under the examined mitigation strategies. The maximum ΔΤairh of 2.2 °C was estimated in the north–south street (‘N-S_St’) under the UB_GR and UB_GF_GR mitigation strategies, whereas the lowest was in the east–west avenue (‘E-W_AV’) under both the UB_GR and the UB_GF. It is worth mentioning that the two mitigation strategies induced a slight amplification of the Tairh difference in the courtyards (‘CY’) and north–south street (‘N-S_St’) design layouts compared to the existing design layout, which is probably due to the fact that these design layouts are more affected by the cooling effect produced due to the applied mitigation strategies since they are located in the vicinity of the green roofs and the green façade.

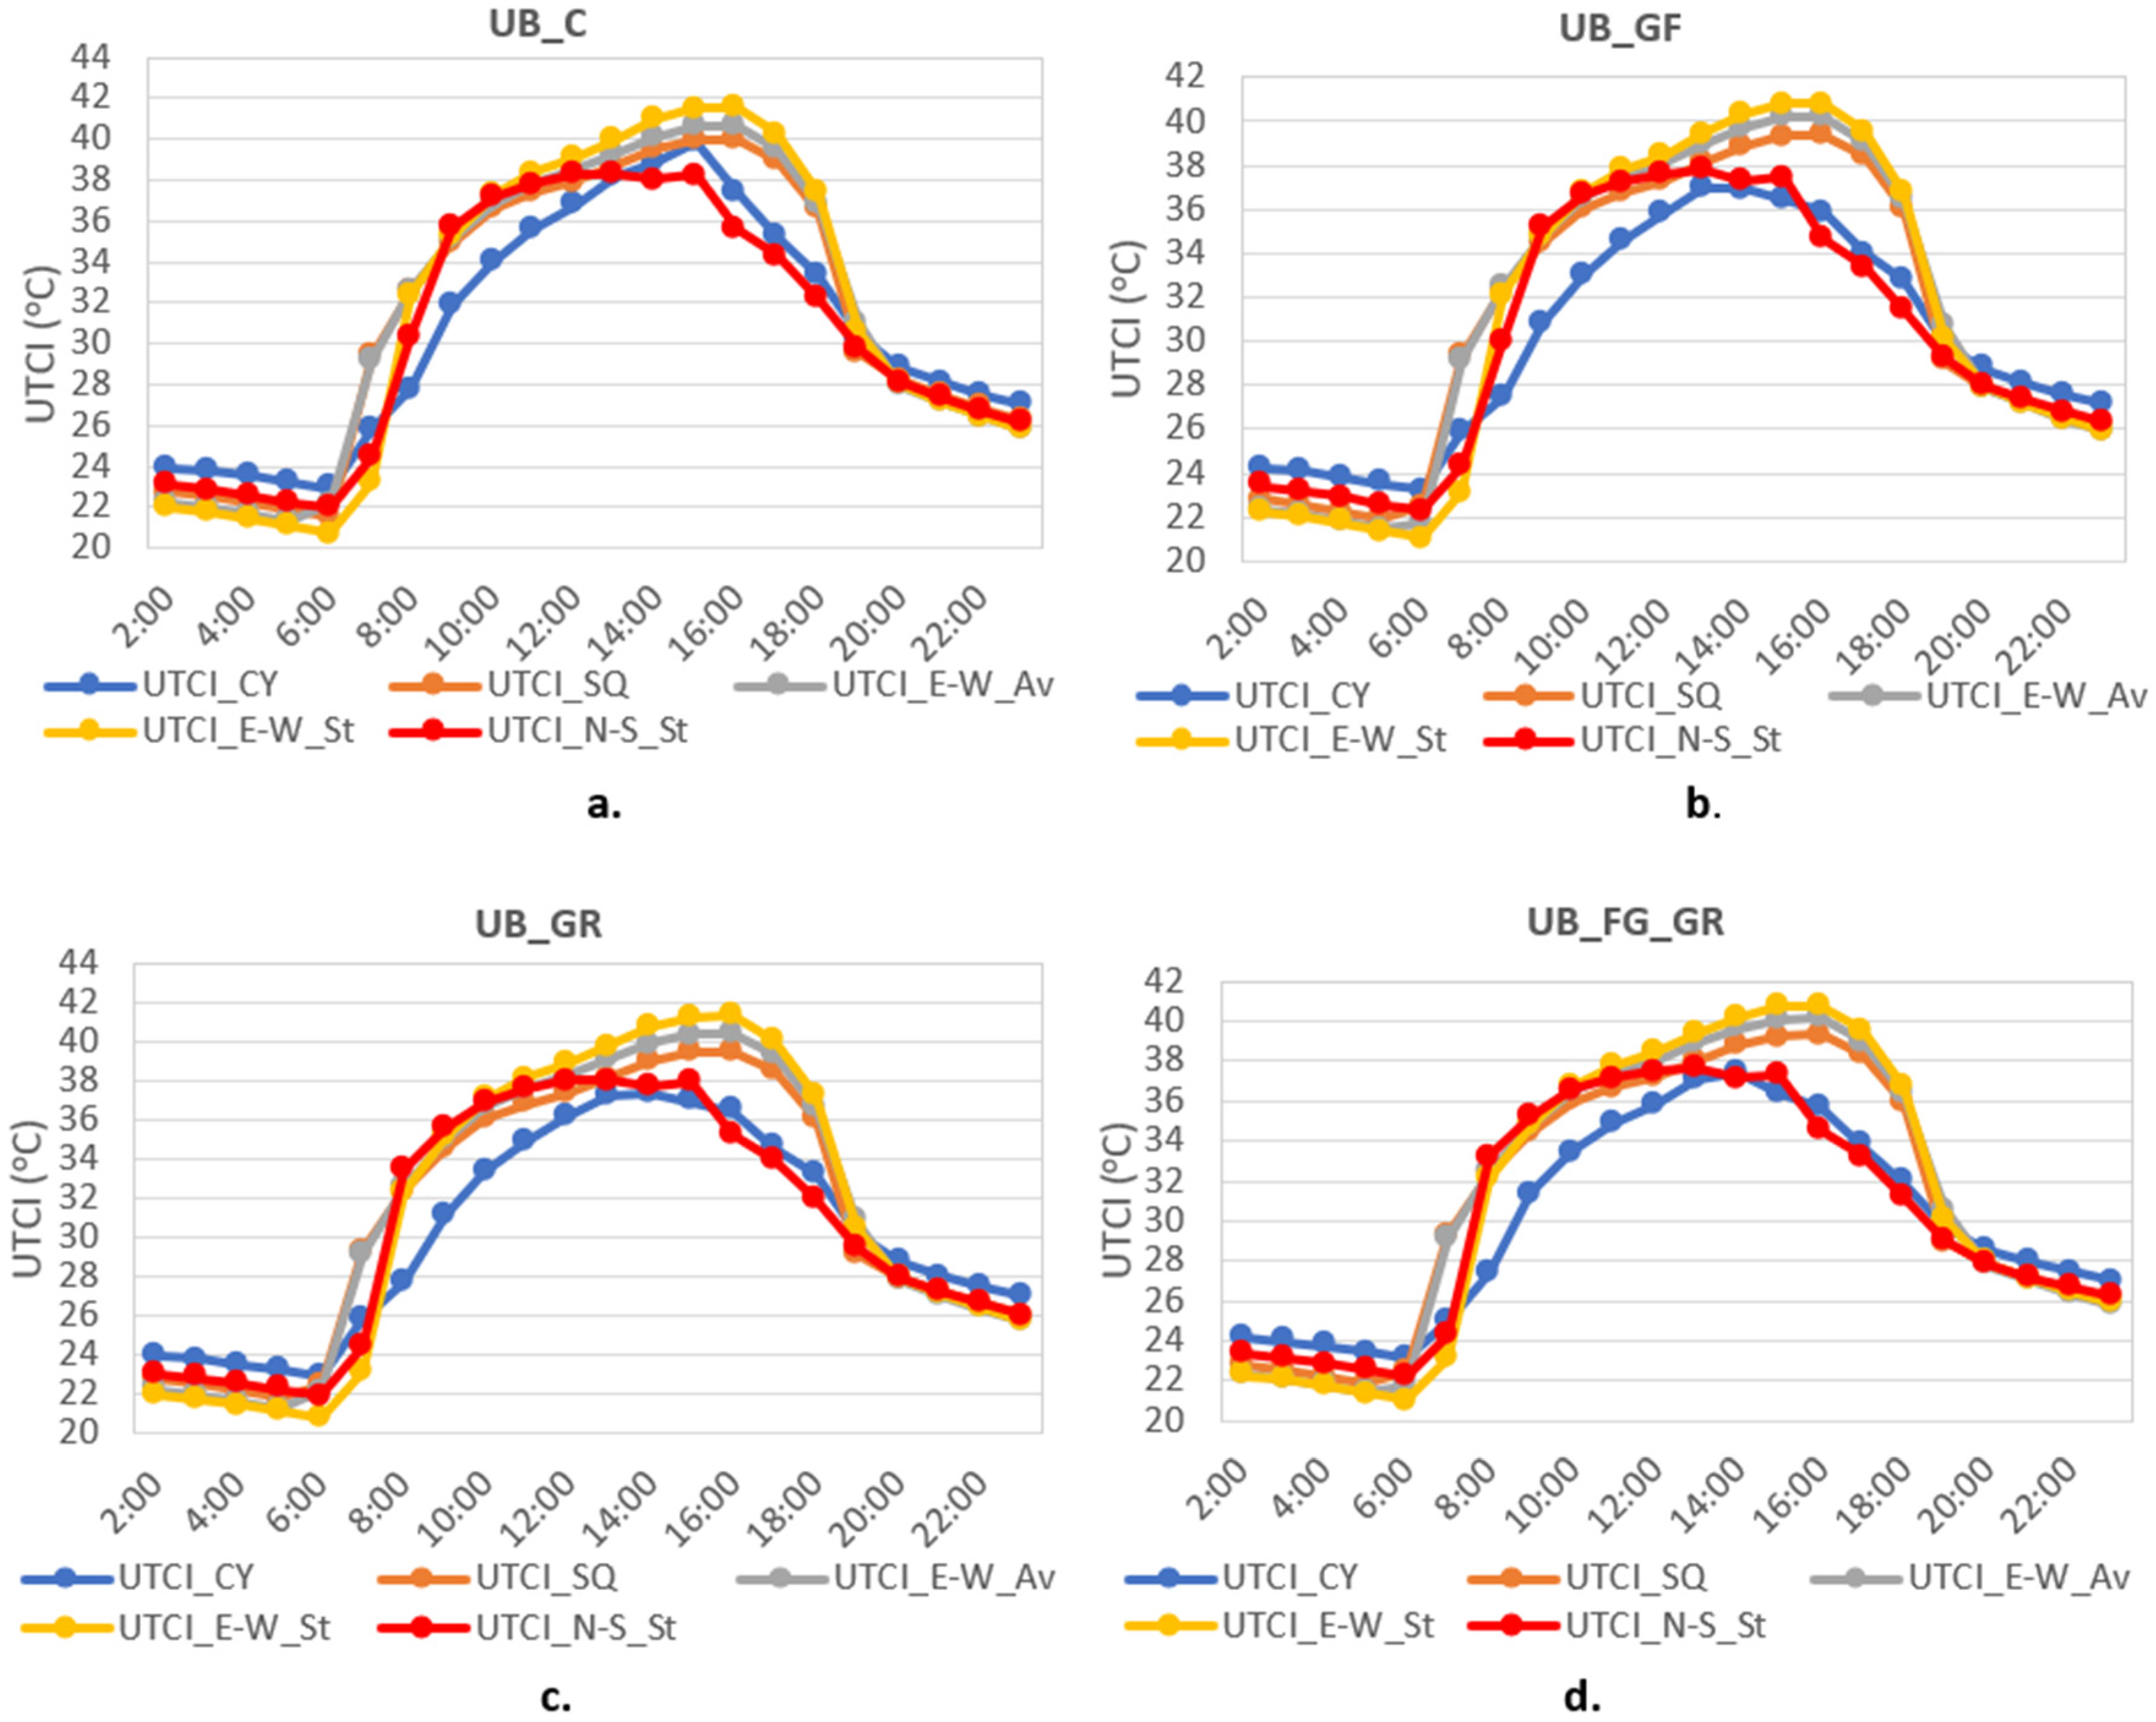
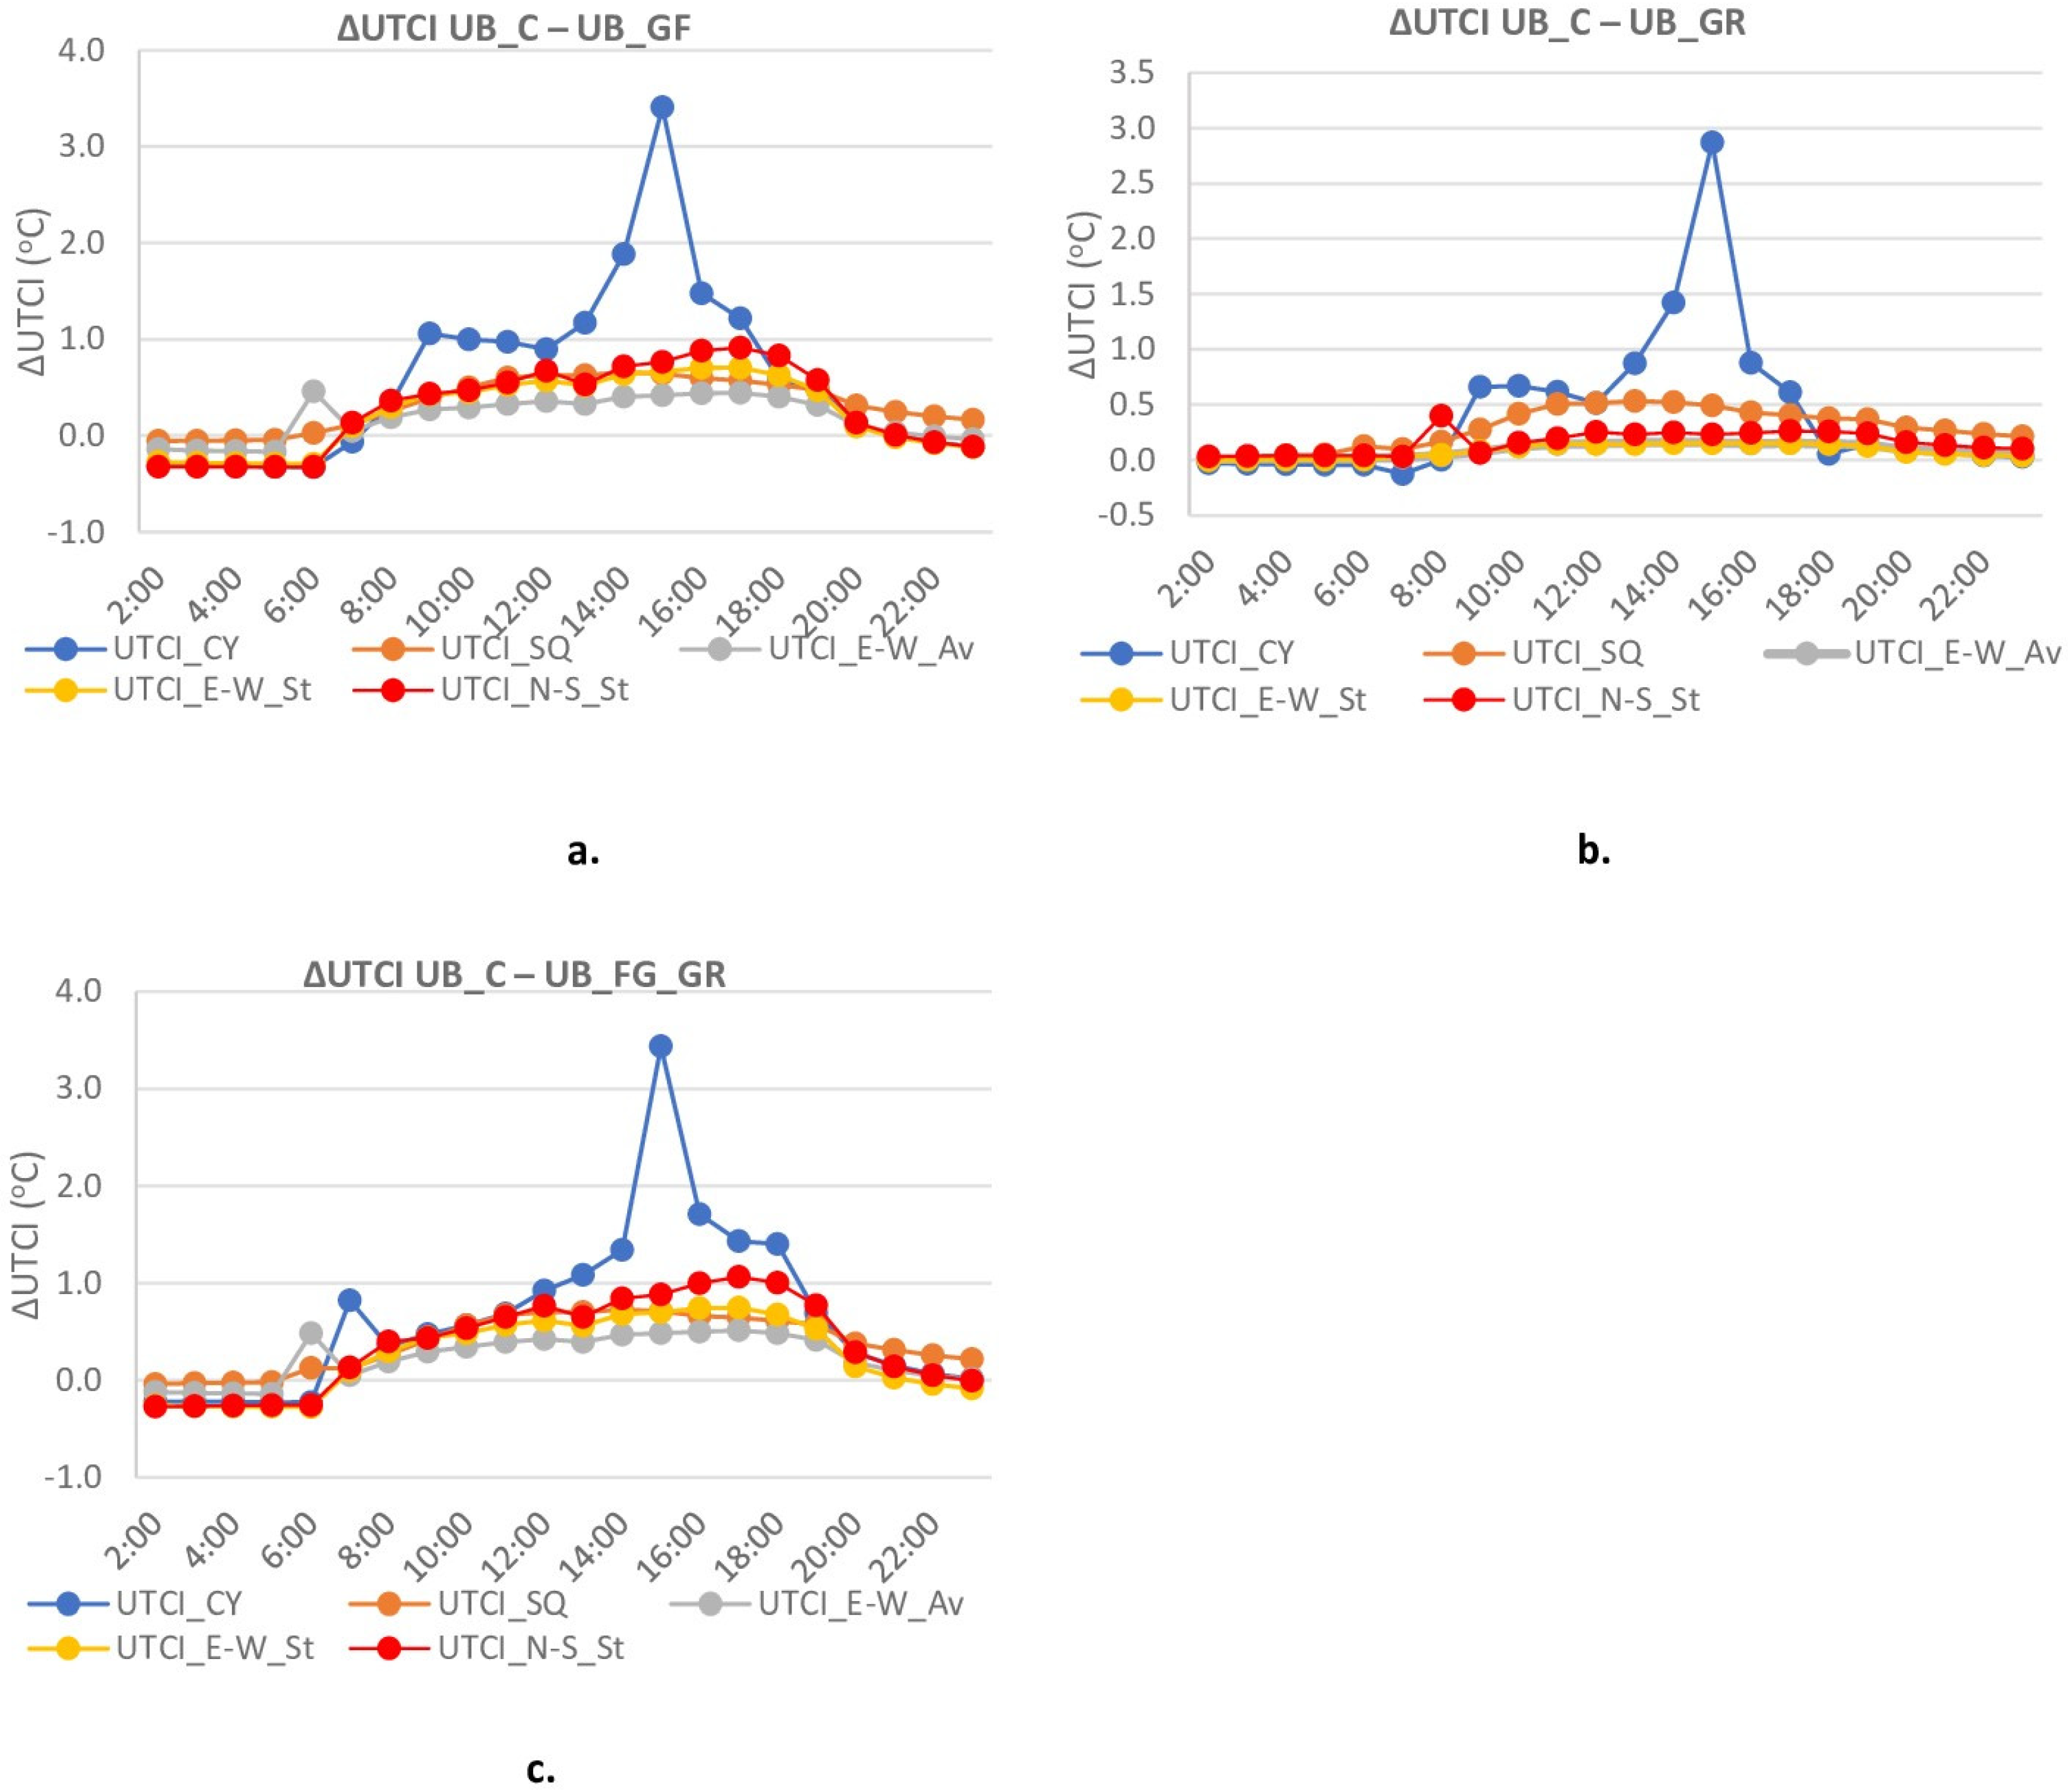
3.2. Universal Climate Thermal Index (UTCI, °C)

The hourly variations of UTCI in the examined design layouts in the UB_C configuration (Figure 6a), and in the UB_GR (Figure 6b), UB_GF (Figure 6c), and UB_GF_GR (Figure 6d) mitigation strategies are presented from 2:00 LST to 23:00 LST. As was also mentioned in the case of Tair, the examined design layouts followed the same patterns regarding the induced thermal conditions, in all the examined mitigation strategies. More specifically, in all the examined cases, except for the UB_C, the courtyards (‘CY’) maintained lower UTCI values during the day, while the east–west street (‘E-W_St’) induced higher UTCI values, especially during the warmer hours of the day. This pattern is repeated in all the examined mitigation strategies (Figure 6b–d). Additionally, all the design layouts under the examined mitigation strategies reached their peaks at 16:00. Table 7 summarizes the daily average UTCI (UTCId) and the average UTCI from 12:00 to 18:00 (UTCIh) in all the examined design layouts of the current design layout and the mitigation strategies. In addition, the hourly ΔUTCI is shown in Figure 7.
In the case of UB_C, the examined design layouts induced different UTCI categories, according to the UTCI Mediterranean thermal assessment scale (Table 7). More specifically, the UTCIh values induced in the north–south street (‘N-S_St’) were the lowest corresponding to the ‘MHS’ category, whereas the UTCIh values induced in the east–west street (‘E-W_St’) were the highest, corresponding to the ‘EHS’ category. The courtyards (‘CY’) induced ‘SHS’ conditions, whereas the square (‘SQ’) and the east–west avenue (‘E-W_AV’) induced ‘VSHS’ conditions.
Although the examined mitigation strategies slightly reduced the UTCI values, a reduction of 1 UTCI thermal sensation category per mitigation strategy was achieved in all the design layouts, except for the ‘E-W_AV’ and the north–south street (‘N-S_St’) (Table 7). UB_GF_GR achieved slightly better thermal conditions compared to the other two mitigation strategies followed by the UB_GF mitigation strategy. The maximum UTCIh reduction (1.6 °C) was achieved in the UB_GF_GR mitigation strategy in the courtyards ‘CY’ design layout, probably due to the additional effect of the existing vegetation of the courtyards ‘CY’s. On the other hand, the minimum UTCIh (0.1 °C) occurred in the UB_GR in the east–west avenue (‘E-W_AV’) and east–west street (‘E-W_St’) design layouts.
A closer look at the hourly ΔUTCI during the examined day is shown in Figure 7. As can be seen, a gradual decrease in the UTCI values was observed in the three mitigation strategies (Figure 7a–c) as we moved toward the warmest hour of the day. In all the mitigation strategies, the greatest hourly reduction in UTCI values was achieved in the courtyards (‘CY’) design layout. Therefore, the maximum hourly ΔUTCI (3.4 °C) was achieved under the UB_GF (Figure 7b) and the UB_GF_GR (Figure 7c) mitigation strategies in the ‘CY’ design layouts at 16:00 LST.
Figure 8 shows the spatial distribution of UTCI throughout the study area at 16:00 LST in the current design layout (UB_C), as well as the comparison between the UB_C and the mitigation strategies. In the current design layout, the UTCI varies between 34.18 °C and 41.73 °C. The lowest UTCI values are observed in the courtyards (‘CY’) and the north–south street (N-S_St) design layouts with values that correspond to ‘MHS’. The east–west street (E-W_St) and east–west avenue (E-W_Av) induced the highest UTCI values that correspond to ‘EHS’ (Figure 8a). Finally, the square (‘SQ’) design layout induced UTCI values that correspond to ‘VSHS’. The ΔUTCI induced by the UB_GF varied from −1.82 °C (indicating areas where there is an increase in UTCI values) to 6.43 °C throughout the study area. The greatest ΔUTCI was sporadically induced throughout the study area, but mainly within the courtyards (‘CY’), in spots where there is dense vegetation, implying that the cooling effect is enhanced due to existing vegetation (Figure 8b). The ΔUTCI induced by the UB_GR varied from −3.50 °C (indicating areas where there is an increase in UTCI values) to 5.70 °C throughout the study area. As noticed in the case of UB_GF, the greatest ΔUTCI was sporadically induced throughout the study area, but mainly within the courtyards (‘CY’), in spots where there is dense vegetation, implying that the cooling effect is enhanced due to existing vegetation (Figure 8c). Finally, the ΔUTCI induced by the UB_GF_GR varied from −1.76 °C to 6.52 °C throughout the study area. Similarly to the before-mentioned cases, the greatest ΔUTCI was sporadically induced throughout the study area, but mainly within the courtyards (‘CY’) design layout, in spots where there is dense vegetation (Figure 8d).
A more detailed evaluation of the cooling effect induced in the examined design layouts under the different mitigation strategies was carried out. Since the ‘E-W_St’ induced the highest UTCIh in all the examined cases, Table 6 presents the UTCIh differences (ΔUTCIh) between the east–west street (‘E-W_St’) and the other examined design layouts per mitigation strategy. In all mitigation strategies, the higher ΔUTCIh was indicated in the courtyards (‘CY’) design layouts. The maximum ΔUTCIh of 4.0 °C was estimated in the courtyards (‘CY’) under the UB_GF_GR mitigation strategy. It is worth mentioning that the three mitigation strategies induced a slight amplification in the ΔUTCIh per design layout (compared with corresponding design layouts of the UB_C), which probably indicates the synergetic effect induced by the mitigation strategies.

4. Discussion

This study first analyzed the current thermal conditions of several adjacent residential blocks of a typical neighborhood in Athens, where a variety of common urban design layouts can be found. The environmental software ENVI-met was employed to simulate the thermal environment of the existing configuration of the study area on a typical summer day in July, the warmest month of the year. Then, three mitigation strategies that focused exclusively on the cooling effect performance of green roofs and green façades, as well as their combination, were examined. The cooling effect magnitude of the examined mitigation strategies was investigated in several design layouts in the study area, such as the metro station square and the church courtyard (SQ), the courtyards (CY), the north–south street (N-S_St), and the east–west street (E-W_St) as well as the avenue (AV). The study focused on the efficacy of green roofs and green façades at the pedestrian level.
Our results revealed that the cooling effect of green roofs and green façades at the pedestrian level was limited and a negligible amelioration of thermal conditions was also found. These results are generally consistent with findings in the existing literature that investigated the efficacy of green roofs or green façades at the pedestrian level [18,54,55,56]. Regarding the thermal stress conditions, while the three mitigation strategies resulted in modest improvements in the average UTCI of up to 1.6 °C, a slight improvement of one category reduction in the thermal stress categories of UTCI was achieved in all the examined mitigation strategies.
In particular, the 100% green roof (UB_GR) plant coverage, which was applied in our study, showed daily average temperature and UTCI reductions of up to 0.3 °C and 1.0 °C, respectively, across the various examined design layouts. A previous study conducted in South Australia [57] reported an average temperature reduction at pedestrian level of 0.06 °C when using extensive green roofs with 30% plant coverage. In addition, one study conducted in Italy found a maximum of 0.18 °C reduction in the case of 25% green roof coverage [11]. In a study that examined various green roof types across different climatic regions, the findings indicated an air temperature decrease of less than 0.02 °C at 15:00 SLT [58]. Finally, some studies have indicated the efficacy of green roofs at the rooftop level [14,59], but a negligible cooling effect at the street level [9].
Similarly to the findings of the green roofs strategy, the 100% green façades (UB_GF) produced daily average temperature and UTCI reductions of up to 0.4 °C and 1.5 °C, respectively. Li et al. [56] investigated different green wall designs in their study conducted in Chenzhou and reported a 0.2 °C air temperature reduction at street level. In addition, one study conducted in Italy found a maximum of 0.24 °C reduction in the case of 25% vertical greening (with 1.5 LAI) [11].
In terms of the air temperature reduction, it is worth mentioning that each mitigation strategy had a varying impact on the examined design layouts. It was found that the east–west street (E-W_St) or avenue (AV) is most favored by the implementation of a green façade compared to a green roof in the adjacent buildings. A study conducted in Hong Kong found air temperature reductions at the pedestrian level ranging horizontally from 0 to 0.7 °C in areas with buildings that were 10 to 15 m high and an urban density of 0.34 [17]. A previous study conducted in China reported that installing green roofs in upwind zones was favorable for pedestrian-level cooling, while green roofs in downwind zones could only exert limited cooling effects [15]. On the other hand, our study showed that the combination of green façades and green roofs increased the cooling effect magnitude that extended in areas located at a distance from the site where the mitigation strategy was implemented. More specifically, the combination of green roofs and green façades (UB_GF_GR) produced a slightly higher cooling effect of up to 0.7 °C, and an average UTCI reduction of 1.6 °C across the examined design layouts. This finding is in line with the study of Cortes et al. [27] who found that the combination of green roofs, grass, and trees could produce a cooling effect of 0.1–0.3 °C.
From the different design layouts analyzed, the courtyards design layout exhibited the most notable cooling effect resulting from all the examined mitigation strategies that sporadically exceeded the 6 °C UTCI reductions, particularly in spots with dense existing vegetation. This finding is in line with a field monitoring study in courtyards in Athens where it was found that courtyards may have a cooling effect on the order of 6.5 K during summer daytime [60]. Conversely, the east–west street (E-W_St) resulted in the most unfavorable thermal conditions. This finding suggests that the thermal conditions were notably improved in the courtyards design layout, likely due to the synergetic effect of existing greenery and the additional green elements from the applied mitigation strategies [27].
To maintain simplicity and computational feasibility, this study applied uniform plant species for the mitigation strategies. More specifically, our study did not explore certain greenery configuration parameters that could potentially impact the magnitude of our results. Prior research has indicated that an increase in leaf density could result in a more pronounced cooling effect when it comes to green roofs [23,61]. Future studies may investigate the potential increase in the cooling effect provided by different vegetation species or even trees. Such investigations could shed light on the possibility of further enhancing the cooling effect and overall environmental impact in urban areas. Another limitation of our study is some uncertainties of ENVI-met in the microclimatic parameters simulations. According to the findings of Koletsis et al. [49] the model produced low validation scores in simulating the mean radiant temperature and the wind speed. Since these parameters are used as input values in the computation of UTCI, this finding implies a level of uncertainty in the UTCI assessments. A possible reason for the low validation scores of the mean radiant temperature could be the use of the gray globe temperature in the field measurements campaign [49], which is related to uncertainties of the mean radiant temperature calculation [62,63]. More specifically, [62] found a systematic underestimation of the mean radiant temperature measured through small globes, whereas [63] recalibrated the mean convection coefficient of the gray globe thermometer in order to be appropriate for use in the humid subtropical climate. A previous study that evaluated the ENVI-Met Vegetation Model reported that the model overestimated the solar radiation resulting in overestimating the air temperature and underestimating the air humidity. The authors of that study concluded, however, that despite these limitations the model is reliable in modeling the physiological and thermal performance in microclimatic environments [45]. Although our findings regarding the cooling effect of the green roofs and the green façades at the pedestrian level are in line with previous studies mentioned above, it is imperative to emphasize the need for further investigation regarding the uncertainties associated with UTCI.
Green façades and green roofs may be an effective strategy when significant space limitations at the city scale limit the opportunity to increase the greenery at the street level [37]. Although evidence from the existing literature and the current study indicated that the percentage of vegetated surfaces does not significantly contribute to the reduction in outdoor temperatures at the pedestrian level, they offer various environmental benefits beyond temperature mitigation. Green roofs act as a consistent heat sink through the process of evaporative cooling, and they effectively decrease the amount of radiative energy absorbed in comparison to concrete surfaces [64]. This reduced solar absorption property of green roofs leads to a decrease in surface air temperature and a reduction in heat flux. In a study conducted in Toronto, replacing a standard flat roof with a green roof resulted in environmental impact reductions ranging from 1.0% to 5.3% [65]. Vertical greening has been adopted due to its recognized environmental advantages and its ability to enhance the favorable thermal performance of buildings. Green surfaces have the capability to alter the emissivity and albedo of concrete and brick surfaces, in addition to serving as evaporative cooling surfaces. As a result, the daytime surface temperature of a green wall is notably cooler compared to a conventional wall [64].
The findings of this study showed a varying cooling effect of green façades and green walls in different design layouts and in street orientations. Thus, existing greenery in the study area increased the cooling effect of the examined adaptive strategies, whereas their effect was insignificant in the case of EW street orientation. This finding is in agreement with the study of Zhang et al. [15] who suggested that in order to better utilize green roofs for pedestrian cooling, it is essential to simultaneously control the wind, greening layout, coverage ratio, vegetation height, and building height. Consequently, it is vital for urban decision-makers to thoroughly investigate the characteristics of the targeted areas before implementing such interventions. This will ensure that both the cooling effect and cost-effectiveness will be maximized.

5. Conclusions

Within the scope of the current study, we evaluated the effectiveness of green roofs and green façades in enhancing the thermal conditions of an urban residential zone in Athens. To achieve this goal, the study utilized the environmental modeling tool ENVI-met to simulate the existing thermal environment in the study area and to project the changes resulting from the implementation of these adaptation strategies. For the sake of practical computational considerations, this study employed consistent plant species (Ivy Hedera) for its mitigation strategies. The main conclusions are as follows:
  • The green façade (UB_GF) and the green roof (UB_GR) strategies revealed comparable results of ΔTaird and ΔTairh that varied from 0.1 to 0.2 °C and from 0.1 to 0.4 °C, respectively, in the different design layouts. The combination of green roofs and green façades (UB_GF_GR) produced a slightly higher cooling effect where the ΔΤaird and ΔΤairh varied from 0.2 to 0.4 °C and from 0.2 to 0.7 °C in the different design layouts, respectively.
  • In terms of the thermal stress conditions, the three mitigation strategies produced limited amelioration of the average UTCI from 12:00 to 18:00 (UTCIh) that did not exceed 1.6 °C. The UB_GR provided the minimum while the UB_GF_GR the maximum UTCI reductions in all the examined design layouts.
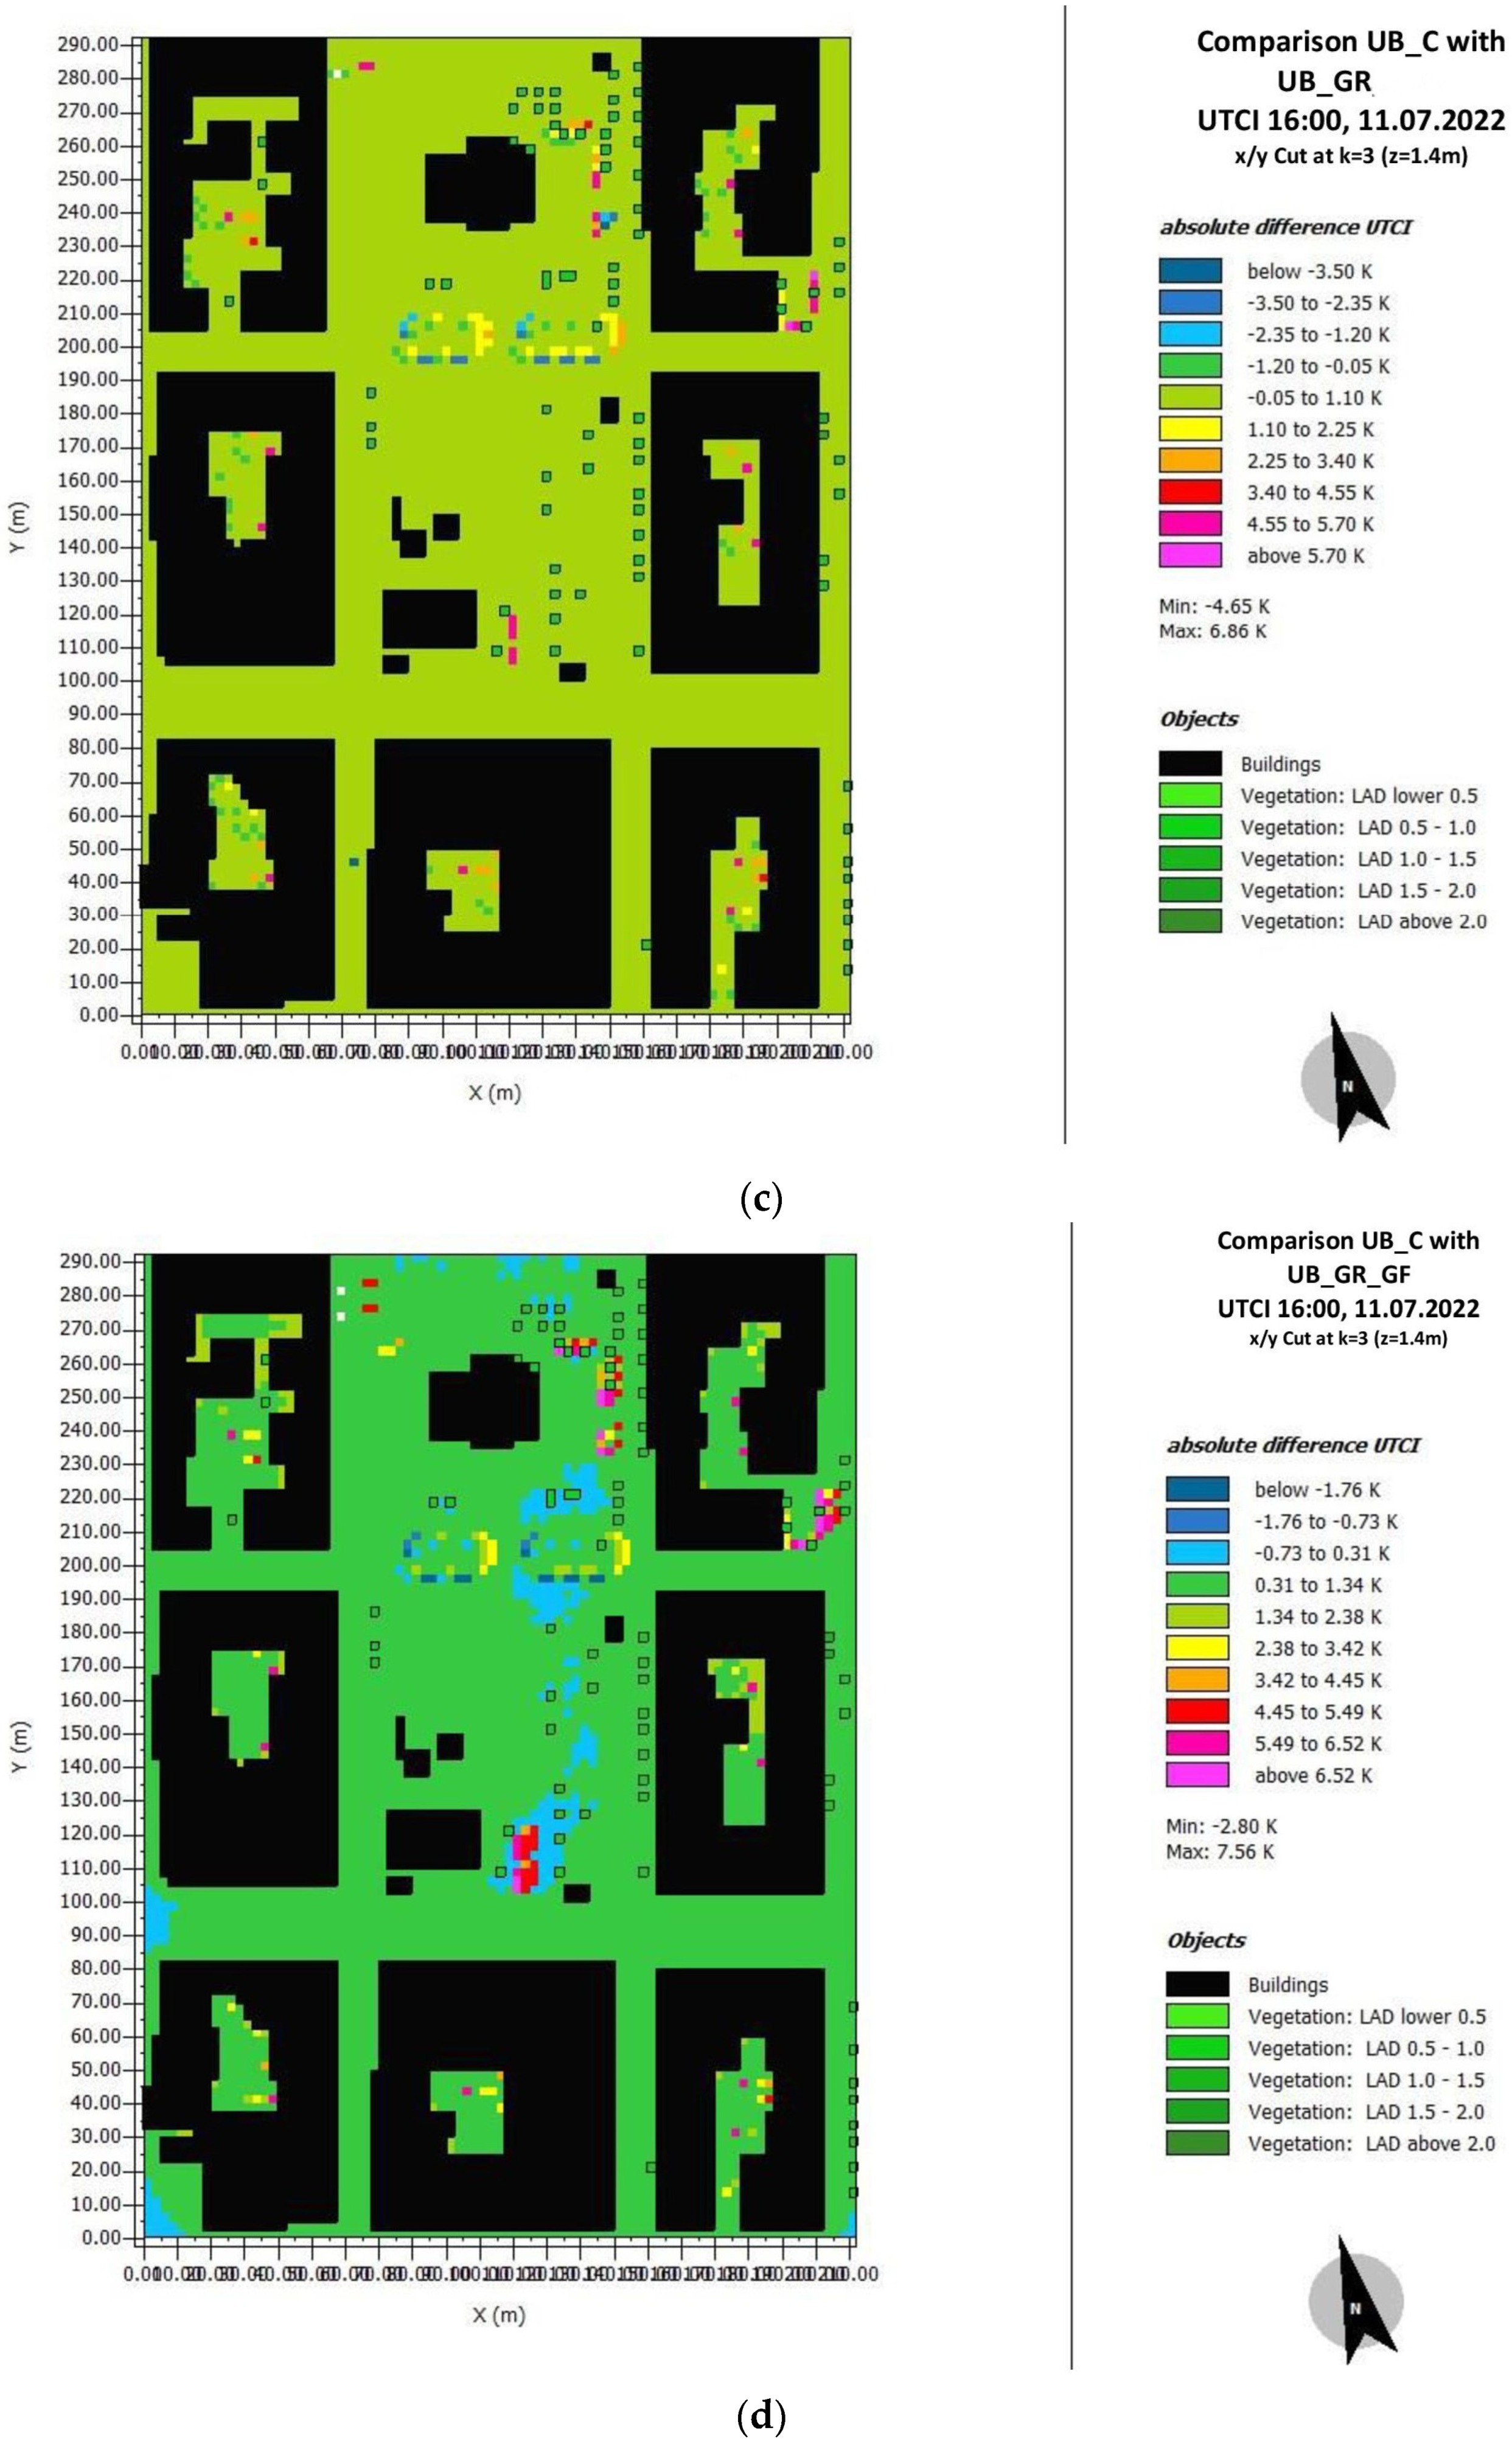
  • Out of the different design layouts analyzed, courtyards exhibited the most notable cooling effect resulting from all the examined mitigation strategies that sporadically exceeded the 6 °C UTCI reductions
  • Conversely, the east–west design layout resulted in the most unfavorable thermal conditions.
The results of this study revealed that the cooling impact of green façades and green walls varied across different design layouts and street orientations. This suggests that for more effective utilization of green roofs in cooling pedestrian areas, it is imperative for future research to conduct a comprehensive assessment of the specific attributes and conditions of the targeted locations before considering the implementation of such interventions.

Author Contributions

Conceptualization, A.T.; methodology, A.T.; writing—original draft preparation, A.T.; model set-up implementation, A.T., E.M. and A.M.; writing—review and editing, A.T., E.M., A.M., I.T. and E.Z. All authors have read and agreed to the published version of the manuscript.

Funding

This research received no external funding.

Institutional Review Board Statement

Not applicable.

Data Availability Statement

The data that support the findings of this study are available upon request from the corresponding author [Areti Tseliou].

Acknowledgments

The authors wish to thank the four anonymous reviewers for providing useful comments and suggestions on this paper, which led to a substantial improvement of the original manuscript. The fourth author wishes to dedicate this work to the memory of his late mentor, colleague and friend Milo Hoffman, who passed away recently.

Conflicts of Interest

The authors declare no conflict of interest.

References

  1. Chatzidimitriou, A.; Yannas, S. Microclimate design for open spaces: Ranking urban design effects on pedestrian thermal comfort in summer. Sustain. Cities Soc. 2016, 26, 27–47. [Google Scholar] [CrossRef]
  2. Tseliou, A.; Koletsis, I.; Pantavou, K.; Thoma, E.; Lykoudis, S.; Tsiros, I.X. Evaluating the Effects of Different Mitigation Strategies on the Warm Thermal Environment of an Urban Square in Athens, Greece. Urban Clim. 2022, 44, 101217. [Google Scholar] [CrossRef]
  3. Cohen, P.; Potchter, O.; Matzarakis, A. Daily and seasonal climatic conditions of green urban open spaces in the Mediterranean climate and their impact on human comfort. Build. Environ. 2012, 51, 285–295. [Google Scholar] [CrossRef]
  4. Potchter, O.; Shashua-Bar, L. Urban Greenery as a tool for city cooling: The Israeli experience in a variety of climatic zones. In Proceedings of the PLEA 2017—Design to Thrive, Edinburgh, UK, 3–5 July 2017; pp. 2–9. [Google Scholar]
  5. Cárdenas-Jirón, L.A.; Graw, K.; Gangwisch, M.; Matzarakis, A. Influence of street configuration on human thermal comfort and benefits for climate-sensitive urban planning in Santiago de Chile. Urban Clim. 2023, 47, 101361. [Google Scholar] [CrossRef]
  6. Jacobs, C.; Klok, L.; Bruse, M.; Cortesão, J.; Lenzholzer, S.; Kluck, J. Are urban water bodies really cooling? Urban Clim. 2020, 32, 100607. [Google Scholar] [CrossRef]
  7. Dimoudi, A.; Zoras, S.; Kantzioura, A.; Stogiannou, X.; Kosmopoulos, P.; Pallas, C. Use of cool materials and other bioclimatic interventions in outdoor places in order to mitigate the urban heat island in a medium size city in Greece. Sustain. Cities Soc. 2014, 13, 89–96. [Google Scholar] [CrossRef]
  8. Lovatto, J.; Santos, R.C.; Souza, C.; Zucca, R.; Lovatto, F.; Geisenhoff, L.O. Use of linear programming for decision making: An analysis of cost, time and comfort of rural housing dwellings. Rev. Bras. Eng. Agrícola Ambient. 2020, 24, 622–629. [Google Scholar] [CrossRef]
  9. Knaus, M.; Haase, D. Green roof effects on daytime heat in a prefabricated residential neighborhood in Berlin, Germany. Urban For. Urban Green. 2020, 53, 126738. [Google Scholar] [CrossRef]
  10. Mohajerani, A.; Bakaric, J.; Jeffrey-Bailey, T. The urban heat island effect, its causes, and mitigation, with reference to the thermal properties of asphalt concrete. J. Environ. Manag. 2017, 197, 522–538. [Google Scholar] [CrossRef]
  11. Iaria, J.; Susca, T. Analytic Hierarchy Processes (AHP) evaluation of green roof- and green wall- based UHI mitigation strategies via ENVI-met simulations. Urban Clim. 2022, 46, 101293. [Google Scholar] [CrossRef]
  12. Mohammad, A.; Mohammad, R.G.; Rasud, K.M.K. Green roofs for storm water management: A review. J. Chongqing Univ. 2012, 11, 5–11. [Google Scholar]
  13. Manso, M.; Castro-Gomes, J. Green wall systems: A review of their characteristics. Renew. Sustain. Energy Rev. 2015, 41, 863–871. [Google Scholar] [CrossRef]
  14. Foustalieraki, M.; Assimakopoulos, M.N.; Santamouris, M.; Pangalou, H. Energy performance of a medium-scale green roof system installed on a commercial building using numerical and experimental data recorded during the cold period of the year. Energy Build. 2017, 135, 33–38. [Google Scholar] [CrossRef]
  15. Zhang, G.; He, B.-J.; Zhu, Z.; Dewancker, B.J. Impact of morphological characteristics of green roofs on pedestrian cooling in subtropical climates. Int. J. Environ. Res. Public Health. 2019, 16, 179. [Google Scholar] [CrossRef] [PubMed]
  16. Lalosevic, M.; Komatina, M.; Milos, M.; Rudonja, N. Green roofs and cool materials as retrofitting strategies for urban heat island mitigation: Case study in Belgrade, Serbia. Therm. Sci. 2018, 22 Pt A, 2309–2324. [Google Scholar] [CrossRef]
  17. Peng, L.; Jim, C. Green-roof effects on neighborhood microclimate and human thermal sensation. Energies 2013, 6, 598–618. [Google Scholar] [CrossRef]
  18. Herath, H.M.P.I.K.; Halwatura, R.U.; Jayasinghe, G.Y. Modeling a Tropical Urban Context with Green Walls and Green Roofs as an Urban Heat Island Adaptation Strategy. Procedia Eng. 2018, 212, 691–698. [Google Scholar] [CrossRef]
  19. Koroxenidis, E.; Theodosiou, T. Comparative environmental and economic evaluation of green roofs under Mediterranean climate conditions—Extensive green roofs a potentially preferable solution. J. Clean. Prod. 2021, 311, 127563. [Google Scholar] [CrossRef]
  20. Peng, M.; Huang, H. The Synergistic Effect of Urban Canyon Geometries and Greenery on Outdoor Thermal Comfort in Humid Subtropical Climates. Front. Environ. Sci. 2022, 10, 851810. [Google Scholar] [CrossRef]
  21. Taleghani, M.; Sailor, D.J.; Tenpierik, M.; van den Dobbelsteen, A. Thermal assessment 20 of heat mitigation strategies: The case of Portland State University, Oregon, USA. Build. Environ. 2014, 73, 138–150. [Google Scholar] [CrossRef]
  22. Salata, F.; Golasi, I.; Petitti, D.; de LietoVollaro, E.; Coppi, M.; de LietoVollaro, A. Relating microclimate, human thermal comfort and health during heat waves: An analysis of heat island mitigation strategies through a case study in an urban outdoor environment. Sustain. Cities Soc. 2017, 30, 79–96. [Google Scholar] [CrossRef]
  23. Berardi, U. The outdoor microclimate benefits and energy saving resulting from green roofs retrofits. Energy Build. 2016, 121, 217–229. [Google Scholar] [CrossRef]
  24. An, K.J.; Lam, Y.F.; Hao, S.; Morakinyo, T.E.; Furumai, H. Multipurpose rain water harvesting for water resource recovery and the cooling effect. Water Res. 2015, 86, 116–121. [Google Scholar] [CrossRef] [PubMed]
  25. Chen, Y.; Zheng, B.; Hu, Y. Numerical Simulation of Local Climate Zone Cooling Achieved through Modification of Trees, Albedo and Green Roofs—A Case Study of Changsha, China. Sustainability 2018, 12, 2752. [Google Scholar] [CrossRef]
  26. Morakinyo, T.E.; Lau, K.K.L.; Ren, C.; Ng, E. Performance of Hong Kong’s common trees species for outdoor temperature regulation, thermal comfort and energy saving. Built Environ. 2018, 137, 157–170. [Google Scholar] [CrossRef]
  27. Cortes, A.; Rejuso, A.J.; Santos, J.A.; Blanco, A. Evaluating mitigation strategies for urban heat island in Mandaue City using ENVI-met. J. Urban Manag. 2022, 11, 97–106. [Google Scholar] [CrossRef]
  28. Tseliou, A.; Koletsis, I.; Tsiros, I.X.; Lyoudis, S.; Pantavou, K. Evaluating the effects of urban design elements on human thermal sensation in summer. In Proceedings of the International Conference on Meteorology, Climatology and Atmospheric Physics (COMECAP 2020), Ioannina, Greece, 26–29 September 2021. [Google Scholar]
  29. Fanger, P.O. Thermal Comfort; McGraw Hill: New York, NY, USA, 1972. [Google Scholar]
  30. Höppe, P. The physiological equivalent temperature—A universal index for the biometeorological assessment of the thermal environment. Int. J. Biometeorol. 1999, 43, 71–75. [Google Scholar] [CrossRef] [PubMed]
  31. Jendritzky, G.; Havenith, G.; Weihs, P.; Batchvarova, E. Towards a universal thermal climate index UTCI for assessing the thermal environment of the human being. In Final Report COST Action 730, Freiburg, Germany; COST Association: Brussels, Belgium, 2009; Available online: https://www.cost.eu/actions/730/ (accessed on 24 August 2023).
  32. Abdallah, A.S.H.; Mahmoud, R.M.A. Urban morphology as an adaptation strategy to improve outdoor thermal comfort in urban residential community of new assiut city, Egypt. Sustain. Cities Soc. 2022, 78, 103648. [Google Scholar] [CrossRef]
  33. Rui, L.; Buccolieri, R.; Gao, Z.; Ding, W.; Shen, J. The impact of green space layouts on microclimate and air quality in residential districts of Nanjing, China. Forests 2018, 9, 224. [Google Scholar] [CrossRef]
  34. Tseliou, A.; Tsiros, I.X. Modeling urban microclimate to ameliorate thermal sensation conditions in outdoor areas in Athens (Greece). Build. Simul. 2016, 9, 251–267. [Google Scholar] [CrossRef]
  35. Tsoumarakis, C.; Assimakopoulos, V.D.; Tsiros, I.; Hoffman, M.; Chronopoulou, A. Thermal performance of a vegetated wall during hot and cold weather conditions. In Proceedings of the PLEA 2008 25th Conference on Passive and Low Energy Architecture, Dublin, Ireland, 22–24 October 2008. [Google Scholar]
  36. Sfakianaki, A.; Pagalou, E.; Pavou, K.; Santamouris, M.; Assimakopoulos, M.N. Theoretical and experimental analysis of the thermal behaviour of a green roof system installed in two residential buildings in Athens, Greece. Int. J. Energy Res. 2009, 33, 1059–1069. [Google Scholar] [CrossRef]
  37. Karachaliou, P.; Santamouris, M.; Pangalou, H. Experimental and numerical analysis of the energy performance of a large-scale intensive green roof system installed on an office building in Athens. Energy Build. 2016, 114, 256–264. [Google Scholar] [CrossRef]
  38. Kolokotsa, D.; Santamouris, M.; Zerefos, S.C. Green and cool roofs’ urban heat island mitigation potential in European Climates for office buildings under free floating conditions. Sol. Energy 2013, 95, 118–130. [Google Scholar] [CrossRef]
  39. Available online: https://ec.europa.eu/eurostat (accessed on 19 May 2023).
  40. Available online: https://www.oecd-ilibrary.org/ (accessed on 11 May 2023).
  41. World Health Organization. Urban Planning, Environment and Health: From Evidence to Policy Action. 2010. Available online: http://www.euro.who.int/data/assets/pdf_file/0004/114448/E93987.pdf?ua=1 (accessed on 22 April 2016).
  42. Tseliou, A.; Melas, E.; Mela, A.; Tsiros, I.X. Environmental Impact of Urban Design Elements in a Mediterranean City. In Proceedings of the International Conference on Meteorology, Climatology and Atmospheric Physics (COMECAP 2023), Athens, Greece, 26–29 September 2023. (submitted). [Google Scholar]
  43. Beck, H.E.; Zimmermann, N.E.; McVicar, T.R.; Vergopolan, N.; Berg, A.; Wood, E.F. Present and future köppen-Geiger climate classification maps at 1-km resolution. Sci. Data 2018, 5, 180214. [Google Scholar] [CrossRef] [PubMed]
  44. Cesca, R.S.; Santos, R.C.; Goes, R.H.D.T.; Favarim, A.P.C.; Oliveira, M.S.G.D.; Silva, N.C.D. Thermal comfort of beef cattle in the state of Mato Grosso do Sul, Brazil. Sci. Agrotechnol. 2021, 45, 1–7. [Google Scholar] [CrossRef]
  45. Liu, Z.; Zheng, S.; Zhao, L. Evaluation of the ENVI-Met vegetation model of four common tree species in a subtropical hot-humid area. Atmosphere 2018, 9, 198. [Google Scholar] [CrossRef]
  46. Sun, S.; Xu, X.; Lao, Z.; Liu, W.; Li, Z.; Higueras Garcia, E.; He, L.; Zhu, J. Evaluating the impact of urban green space and landscape design parameters on thermal comfort in hot summer by numerical simulation. Built Environ. 2017, 123, 277–288. [Google Scholar] [CrossRef]
  47. Bruse, M.; Fleer, H. Simulating surface-plant-air interactions inside urban environments with a three-dimensional numerical model. Environ. Model. Softw. 1998, 13, 373–384. [Google Scholar] [CrossRef]
  48. ENVI-met. ENVI-met V4: A Holistic Microclimate Model. 2023. Available online: https://envi-met.info/doku.php?id=files:downloadv4 (accessed on 10 May 2023).
  49. Koletsis, I.; Tseliou, A.; Lykoudis, S.; Tsiros, I.X.; Lagouvardos, K.; Psiloglou, B.; Founda, D.; Pantavou, K. Validation of ENVI-met microscale model with in-situ measurements in warm thermal conditions across Athens area. In Proceedings of the 17th International Conference on Environmental Science and Technology, CEST2021, Athens, Greece, 1–4 September 2021. [Google Scholar] [CrossRef]
  50. Sternberg, T.; Viles, H.; Cathersides, A. Evaluating the role of ivy (Hedera helix) in moderating wall surface microclimates and contributing to the bioprotection of historic buildings. Build. Environ. 2011, 46, 293–297. [Google Scholar] [CrossRef]
  51. Hunter, A.M.; Williams, N.S.G.; Rayner, J.P.; Aye, L.; Hes, D.; Livesley, S.J. Quantifying the thermal performance of green facades: A critical review. Ecol. Eng. 2014, 63, 102–113. [Google Scholar] [CrossRef]
  52. Thomsit-Ireland, F.; Essah, E.A.; Hadley, P.; Blanuša, T. The impact of green facades and vegetative cover on the temperature and relative humidity within model buildings. Build. Environ. 2020, 181, 107009. [Google Scholar] [CrossRef]
  53. BioMET. ENVI-met BioMET. 2023. Available online: https://envi-met.info/doku.php?id=apps:biomet (accessed on 10 May 2023).
  54. Müller, N.; Kuttler, W.; Barlag, A.B. Counter acting urban climate change: Adaptation measures and their effect on thermal comfort. Theor. Appl. Climatol. 2014, 115, 243–257. [Google Scholar] [CrossRef]
  55. Mohsen, H.; Raslan, R.M.; El-Bastawissi, I. Optimizing the urban environment through holistic microclimate modelling the case of Beirut’s pericenter. In Building Simulation & Optimization 2016, Proceedings of the Building Performance and Optimization Conference, BSO16.IBPSA, Newcastle, UK, 12–14 September 2016; Hamza, N., Underwood, C., Eds.; IBPSA: London, UK, 2016. [Google Scholar]
  56. Li, J.; Zheng, B.; Shen, W.; Xiang, Y.; Chen, X.; Qi, Z. Cooling and energy-saving performance of different Green Wall design: A simulation study of a block. Energies 2019, 12, 2912. [Google Scholar] [CrossRef]
  57. Razzaghmanesh, M.; Beecham, S.; Salemi, T. The role of green roofs in mitigating Urban Heat Island effects in the metropolitan area of Adelaide, South Australia. Urban For. Urban Green. 2016, 15, 89–102. [Google Scholar] [CrossRef]
  58. Morakinyo, T.E.; Dahanayake, K.W.D.K.C.; Ng, E.; Chow, L.C. Temperature and cooling demand reduction by green-roof types in different climates and urban densities: A co-simulation parametric study. Energy Build. 2017, 145, 226–237. [Google Scholar] [CrossRef]
  59. Wong, N.H.; Chen, Y.; Ong, C.L.; Sia, A. Investigation of thermal benefits of rooftop garden in the tropical environment. Build. Environ. 2003, 38, 261–270. [Google Scholar] [CrossRef]
  60. Tsiros, I.X.; Hoffman, M.E. Thermal and comfort conditions in a rear wooded garden and its adjacent semi-open spaces in a Mediterranean climate (Athens) during summer. Archit. Sci. Rev. 2014, 57, 63–82. [Google Scholar] [CrossRef]
  61. Alcazar, S.S.; Olivieri, F.; Neila, J. Green roofs: Experimental and analytical study of its potential for urban microclimate regulation in Mediterranean-continental climates. Urban Clim. 2015, 17, 304–317. [Google Scholar] [CrossRef]
  62. Alfano, F.R.D.A.; Dell’Isola, M.; Ficco, G.; Palella, B.I.; Riccio, G. Small globes and pocket heat stress meters for WBGT and PHS evaluations. A critical analysis under controlled conditions. Build. Environ. 2022, 226, 109781. [Google Scholar] [CrossRef]
  63. Manavvi, S.; Rajasekar, E. Estimating outdoor mean radiant temperature in a humid subtropical climate. Build. Environ. 2020, 171, 106658. [Google Scholar] [CrossRef]
  64. Saiz, S. Comparative Life Cycle Assessment of Standard and Green Roofs. Environ. Sci. Technol. 2006, 40, 4312–4316. [Google Scholar] [CrossRef]
  65. Alexandri, E.; Jones, P. Temperature decreases in an urban canyon due to green walls and green roofs in diverse climates. Build. Environ. 2008, 43, 480–493. [Google Scholar] [CrossRef]
Figure 1. (a) Satellite image of the greater Athens area; (b) aerial photo of the study area. Different color bullets highlight the examined spots affected by different design layouts (red: EW street, brown: EW avenue, green: courtyards, blue: NS streets, yellow: squares); (c) area description.
Atmosphere 14 01512 g001
Figure 2. (a) 3D display of the current design layout (UB_C); (b) the full coverage of building walls with green façades (UB_GF); (c) the full coverage of the building roofs with greenings (UB_GR); and (d) the combination of UB_GF and UB_GR (UB_GF_GR).
Atmosphere 14 01512 g002
Figure 3. The daily variation of Tair in (a) the current design layout (UB_C); (b) the UB_GF (full coverage of green façades); (c) the UB_GR (full coverage of green roofs); and (d) the UB_GF_GR (combination of UB_GF and UB_GR mitigation strategies).
Atmosphere 14 01512 g003
Figure 4. The hourly ΔTair in (a) the UB_GF (full coverage of green façades); (b) the UB_GR (full coverage of green roofs); and (c) the combination of UB_GF and UB_GR mitigation strategies.
Atmosphere 14 01512 g004
Figure 5. The spatial distribution of Tair in the (a) UB_C; (b) UB_GF; (c) UB_GR; and (d) UB_GF_GR at the pedestrian level at 16:00 LST.
Atmosphere 14 01512 g005aAtmosphere 14 01512 g005b
Figure 6. The daily variation in UTCI (°C) in (a) the current design layout (UB_C); (b) the UB_GF (full coverage of green façades); (c) the UB_GR (full coverage of green roofs); and (d) the combination of UB_GF and UB_GR mitigation strategies.
Atmosphere 14 01512 g006
Figure 7. The hourly ΔUTCI in (a) the UB_GF (full coverage of green façades); (b) the UB_GR (full coverage of green roofs); and (c) the combination of UB_GF and UB_GR mitigation strategies.
Atmosphere 14 01512 g007
Figure 8. The spatial distribution of UTCI in the (a) UB_C; (b) UB_GF; (c) UB_GR; and (d) UB_GF_GR at pedestrian level at 16:00 LST.
Atmosphere 14 01512 g008aAtmosphere 14 01512 g008b
Table 1. Physical characteristics of plants.
List of PlantsNumber per SpeciesFoliage Shortwave Transmittance W/(m2K)Foliage Shortwave AlbedoLeaf Area Density (m2/m3)Crown Width (m)Height
Citrus and Aurantium600.30.40.734
Morus plataniforia, sparse, 5 m 40.30.180.335
Morus platanifolia, dense, 5 m610.30.181.135
Platanus acerifolia, dense, 12 m240.30.181.1912
Betula pendula40.30.180.976
Olea europaea50.30.50.554
Morus plataniforia, dense, 5 m20.30.181.135
Albizia julibrissim50.30.60.799
Senegalia greggi160.30.61.032
Pinus pinea40.30.61.51115
Total185
Table 2. Overview of input data and meteorological characteristics for the model area in ENVI-met.
Model ParameterModel Input Value
LocationAigaleo (37°59′31″ N, 23°40′41″ E, 50 m)
Model area85 × 117.6 × 30 cells
Spatial resolution2.5 m × 2.5 m × 2.0
Simulation day11 July 2022
Simulation duration24 h
Meteorological characteristics of the simulation day 1Mean air temperature:27 °C
Minimum air temperature: 23.1 °C
Maximum air temperature: 31.4 °C
Average wind speed: 1.5 m × s−1
Wind Direction: NNE
Minimum RH: 31%
Maximum RH: 57%
1 www.meteo.gr (accessed on 12 January 2023).
Table 3. Detailed presentation of the implemented mitigation strategies.
Mitigation StrategiesPlant Thickness
(cm)
LAI (m2/m2)Plant SpeciesSubstrate
1.
Green roofs
Code: UB_GR
301.5Ivy (Hedera helix)No
2.
Green façades
Code: UB_GF
301.5Ivy (Hedera helix)No
3.
Combined green roofs and façades
Code: UB_GF_GR
301.5Ivy (Hedera helix)No
Table 4. Thermal stress scale of Universal Thermal Climate Index (UTCI, °C).
UTCI (°C)Thermal Stress
Original Scale 1Mediterranean Scale for the Warm Period 2
Above 46Above 39.9Extreme heat stress (EHS)
38 to 4638.3 to 39.9Very strong heat stress (VSHS)
32 to 3836.8 to 38.3Strong heat stress (SHS)
26 to 3234.0 to 36.8Moderate heat stress (MHS)
9 to 2627.0 to 34.0No thermal stress (NTS)
0 to 924.6 to 27.0Slight cold stress (SCS)
−13 to 023.0 to 24.6Moderate cold stress (MCS)
−27 to −1321.5 to 23.0Strong cold stress (SCS)
−40 to −2720.2 to 21.5Very strong cold stress (VSCS)
Below—40Below 20.2Extreme cold stress (ECS)
1 [31]; 2 [34].
Table 5. The daily average air temperature (Taird) and the average temperature from 12:00 to 18:00 (Tairh), as well as the daily average air temperature reduction (ΔTaird) and the average reduction from 12:00 to 18:00 (ΔTairh) in the examined design layouts per mitigation strategy.
Air Temperature (°C)Air Temperature Reduction (ΔTair, °C)
Design LayoutsTairdTairhΔTairdΔTairh
Current configuration (UB_C)
CY29.031.8
SQ29.131.9
E-W_AV29.533.0
E-W_St29.733.6
N-S_St28.931.7
Green
façades (UB_GF)
CY28.731.40.20.4
SQ29.031.70.10.1
E-W_AV29.432.90.10.2
E-W_St29.633.40.10.2
N-S_St28.831.40.20.2
Green roofs (UB_GR)
CY28.731.50.20.3
SQ29.031.70.10.1
E-W_AV29.533.00.10.0
E-W_St29.633.50.10.1
N-S_St28.731.30.20.3
Combined green roofs and green façades (UB_GF_GR)
CY28.531.20.40.6
SQ28.731.10.40.7
E-W_AV29.432.80.20.2
E-W_St29.533.30.20.3
N-S_St28.531.10.40.6
CY: courtyards; SQ: square; E-W_AV: east–west avenue; E-W_St: east–west street; N-S_St: north–south street.
Table 6. Comparison of ΔΤair and ΔUTCI between the E-W_St and the other design layouts in the UB_C, UB_GF, UB_GR, and UB_GF_GR mitigation strategies.
Design LayoutsΔTairh (°C)ΔUTCIh (°C)
UB_C
‘CY’1.83.0
‘SQ’1.81.3
‘E-W_AV’0.60.7
‘N-S_St’1.93.7
UB_GR
‘CY’2.03.9
‘SQ’1.81.6
‘E-W_AV’0.50.7
‘N-S_St’2.23.8
UB_GF
‘CY’2.03.9
‘SQ’1.61.3
‘E-W_AV’0.50.5
‘N-S_St’2.03.8
UB_GF_GR
‘CY’2.14.0
‘SQ’2.21.3
‘E-W_AV’0.50.5
‘N-S_St’2.23.9
CY: courtyards, SQ: square, E-W_AV: east–west avenue, E-W_St: east–west street, N-S_St: north–south street.
Table 7. The UTCId and UTCIh as well as the ΔUTCId and ΔUTCIh in the examined design layouts per mitigation strategy.
UTCI Values (°C)/UTCI CategoriesΔUTCI (°C)
Design LayoutsUTCIdUTCIhΔUTCIdΔUTCIh
UB_C
CY30.6/NTS37.1/SHS
SQ31.4/NTS38.8/VSHS
E-W_AV31.6/NTS39.3/VSHS
E-W_St31.5/NTS40.1/EHS
N-S_St30.5/NTS36.4/MHS
UB_GF
CY30.0/NTS35.6/MHS0.61.5
SQ31.1/NTS38.2/SHS0.30.6
E-W_AV31.4/NTS38.9/VSHS0.20.4
E-W_St31.2/NTS39.5/VSHS0.30.6
N-S_St30.2/NTS35.7/MHS0.30.8
UB_GR
CY30.2/NTS36.0/MHS0.41.0
SQ31.2/NTS38.3/SHS0.20.5
E-W_AV31.5/NTS39.2/VSHS0.10.2
E-W_St31.4/NTS39.9/VSHS0.10.1
N-S_St30.4/NTS36.2/MHS0.10.2
UB_GF_GR
CY30.0/NTS35.5/MHS0.61.6
SQ31.1/NTS38.1/SHS0.40.7
E-W_AV31.3/NTS38.9/VSHS0.20.5
E-W_St31.2/NTS39.4/VSHS0.30.7
N-S_St30.1/NTS35.5/MHS0.40.9
Disclaimer/Publisher’s Note: The statements, opinions and data contained in all publications are solely those of the individual author(s) and contributor(s) and not of MDPI and/or the editor(s). MDPI and/or the editor(s) disclaim responsibility for any injury to people or property resulting from any ideas, methods, instructions or products referred to in the content.

