

Analysis and Mapping of Sea Breeze Event Time in Coastal Cities: A Case Study of Sendai


Abstract
:1. Introduction
2. Data and Methods
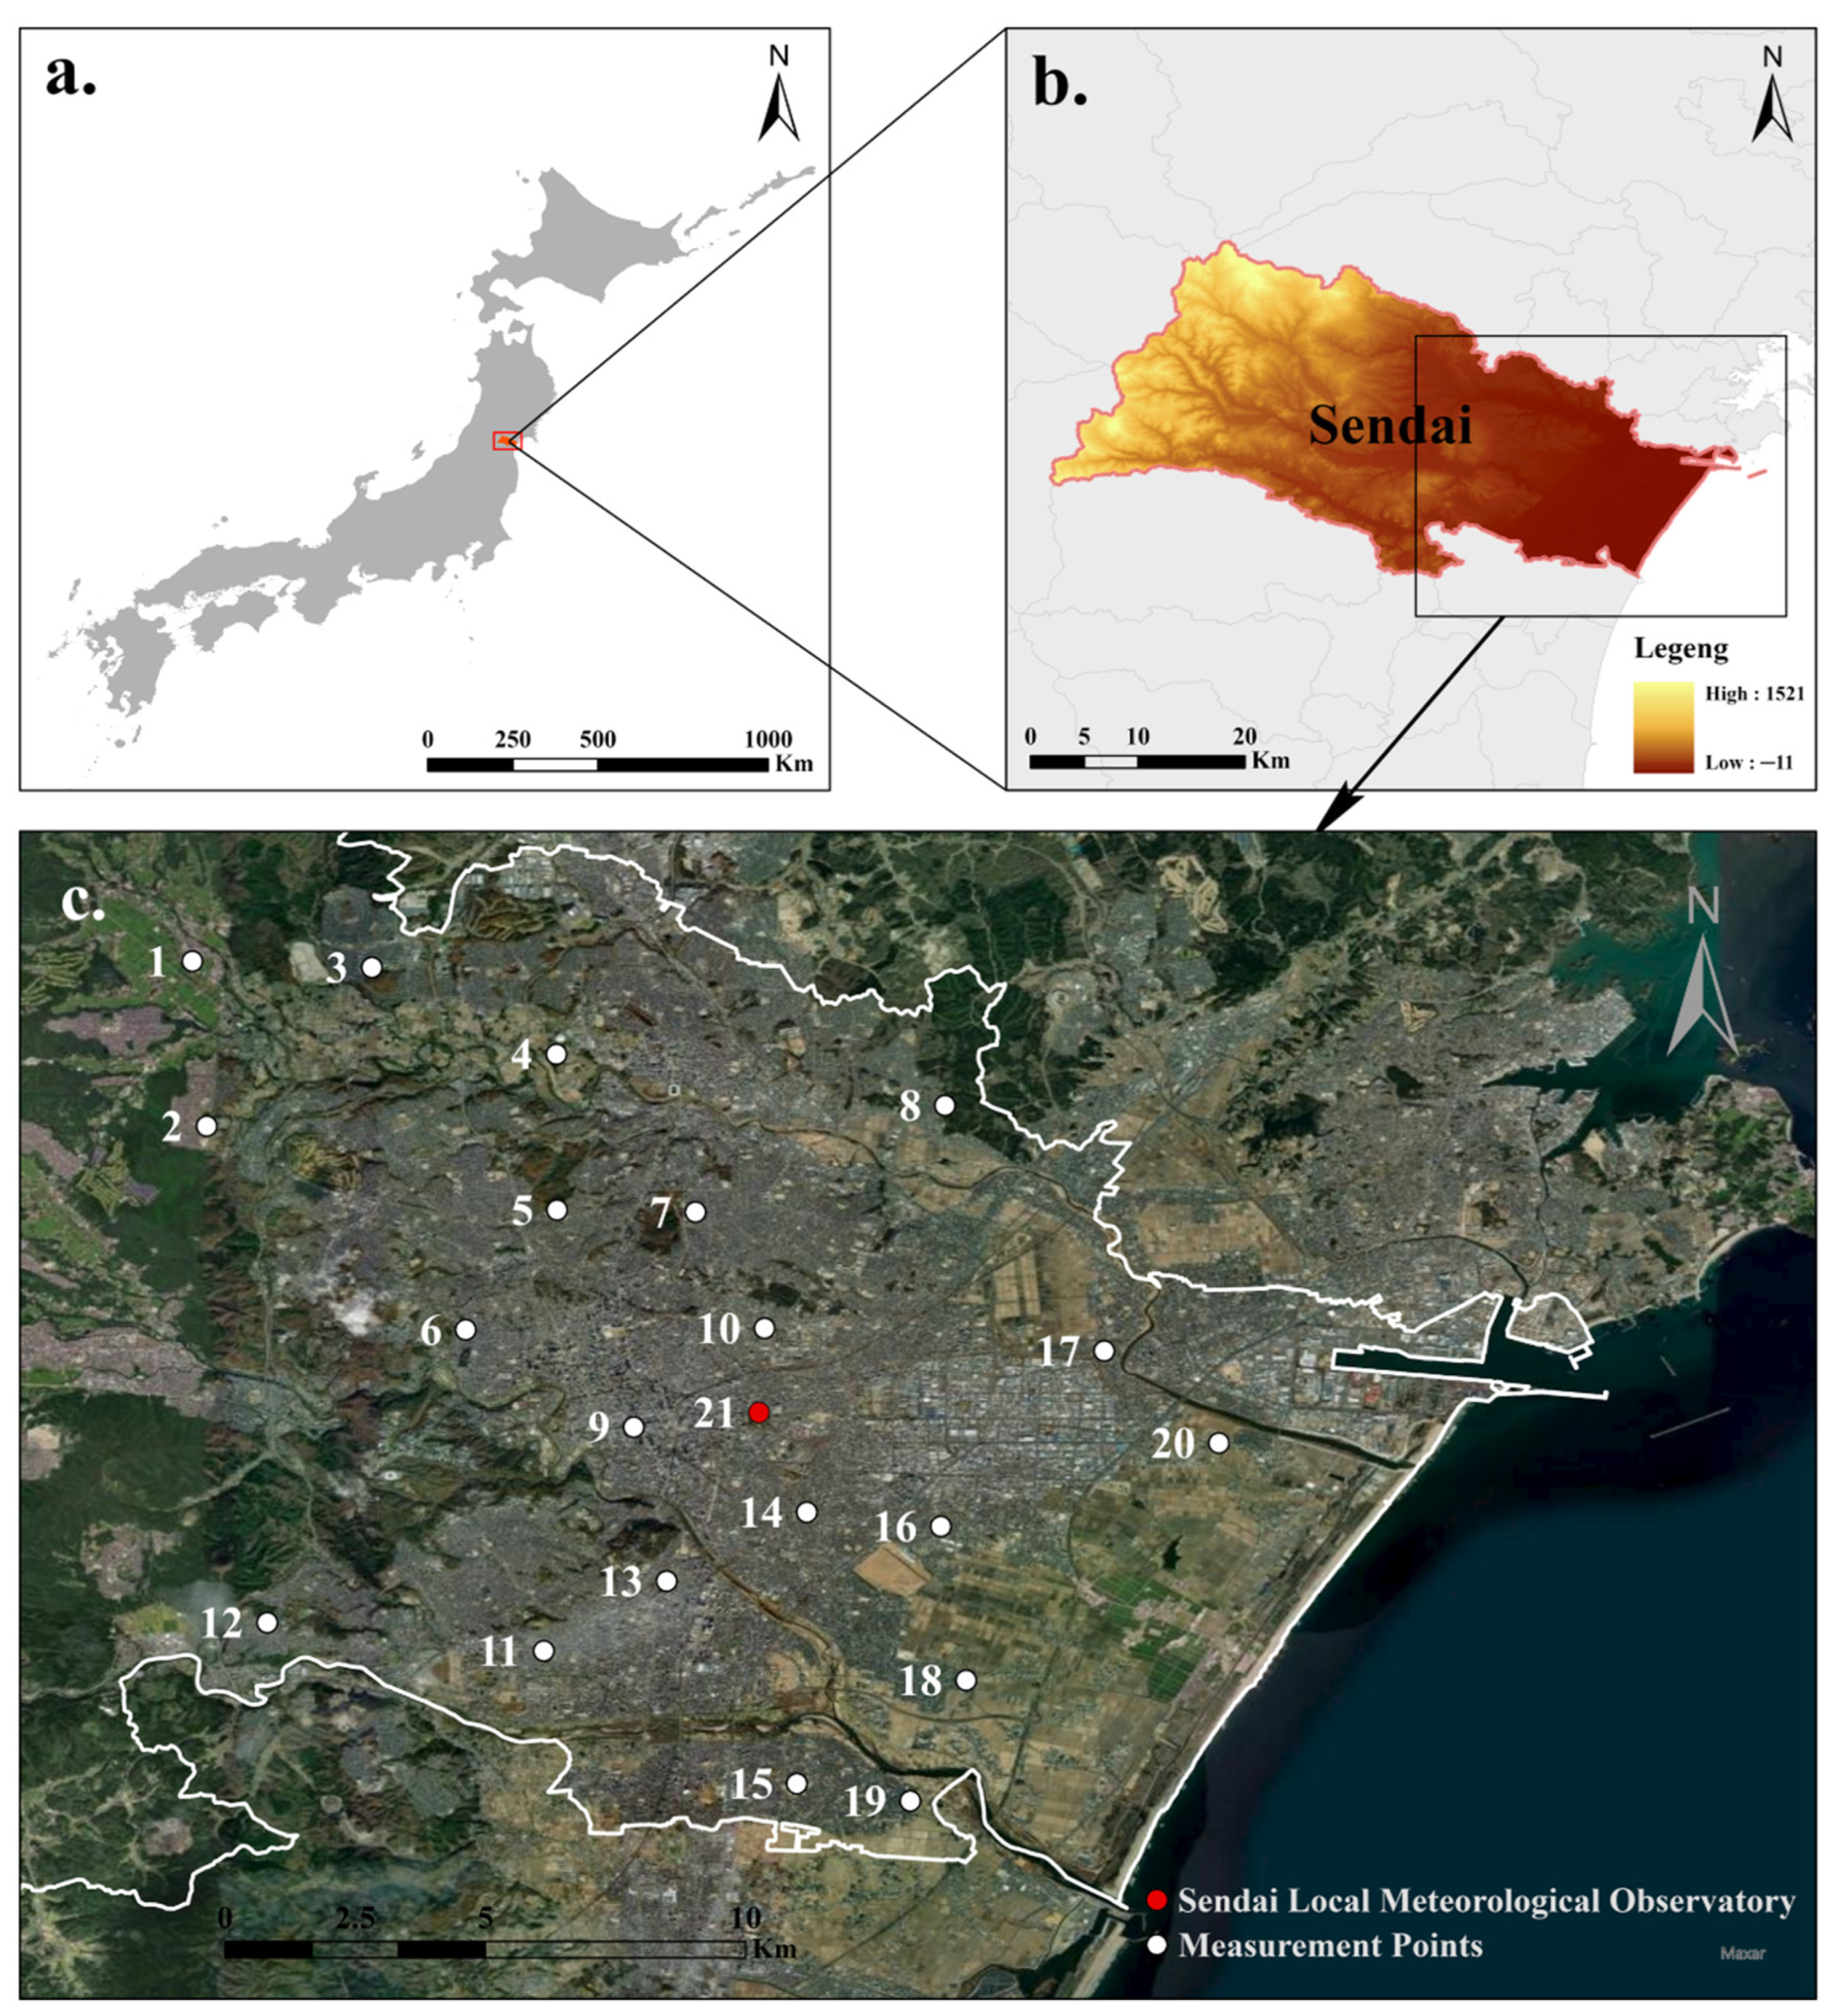
2.1. Study Area
2.2. Data
2.2.1. Data Used to Identify Sea Breezes
2.2.2. Measurement Data
2.2.3. WRF Model and Experimental Design
2.3. Identification of Sea Breezes
- Sunshine: 40% or more of the possible sunshine hours.
- Cloud: less than 5% cloud.
- Rainfall: no rainfall.
- Wind: wind blowing from the sea to the land lasting at least 2 h.
- Temperature: a drop in temperature lasting 1 h or more after the start of the sea breeze.
3. Basic Characteristics of Summer Sea Breeze Activity in Sendai
3.1. Representative Validation of the Study Period
3.2. Define the Research Month
3.3. August Sea Breeze Daily Temperature Characteristics
4. Temporal Characteristics of Sendai Sea Breeze Event
4.1. Analysis of Sea Breeze Event Time Characteristics
4.2. Sea Breeze Arrival Time Distribution Pattern
4.3. Case Study Day
5. Mapping the Time of Summer Sea Breeze Event in Sendai City
5.1. Reproducibility Analysis of WRF Model Data
5.2. Sea Breeze Event Time Map and Discussion
5.2.1. Sea Breeze Arrival Time
5.2.2. Sea Breeze Retreat Time
5.2.3. Duration of Sea Breeze
6. Conclusions
Author Contributions
Funding
Acknowledgments
Conflicts of Interest
References
- Miller, S.T.K.; Keim, B.D.; Talbot, R.W.; Mao, H. Sea Breeze: Structure, Forecasting, and Impacts. Rev. Geophys. 2003, 41, 3. [Google Scholar] [CrossRef]
- Hopkins, G.; Simmons, C.T. Temporal and Spatial Patterns of Air Temperature in a Coastal City with a Slope Base Setting. J. Geophys. Res.-Atmos. 2016, 121, 5336–5355. [Google Scholar] [CrossRef]
- Kolokotsa, D.; Psomas, A.; Karapidakis, E. Urban Heat Island in Southern Europe: The Case Study of Hania, Crete. Sol. Energy 2009, 83, 1871–1883. [Google Scholar] [CrossRef]
- Pokhrel, R.; Lee, H. Estimation of the Effective Zone of Sea/Land Breeze in a Coastal Area. Atmos. Pollut. Res. 2011, 2, 106–115. [Google Scholar] [CrossRef]
- Dandou, A.; Tombrou, M.; Soulakellis, N. The Influence of the City of Athens on the Evolution of the Sea-Breeze Front. Bound.-Layer Meteorol. 2009, 131, 35–51. [Google Scholar] [CrossRef]
- Shen, L.; Zhao, C.; Ma, Z.; Li, Z.; Li, J.; Wang, K. Observed Decrease of Summer Sea-Land Breeze in Shanghai from 1994 to 2014 and Its Association with Urbanization. Atmos. Res. 2019, 227, 198–209. [Google Scholar] [CrossRef]
- Ma, Y.; Gao, R.Z.; Miao, S.G. Impacts of urbanization on summertime SLB circulation in Qingdao. Acta Sci. Circumst. 2013, 33, 1690–1696. [Google Scholar] [CrossRef]
- Bei, N.; Zhao, L.; Wu, J.; Li, X.; Feng, T.; Li, G. Impacts of Sea-Land and Mountain-Valley Circulations on the Air Pollution in Beijing-Tianjin-Hebei (BTH): A Case Study. Environ. Pollut. 2018, 234, 429–438. [Google Scholar] [CrossRef]
- Wang, S.; Zhu, J. Amplified or Exaggerated Changes in Perceived Temperature Extremes under Global Warming. Clim. Dyn. 2020, 54, 117–127. [Google Scholar] [CrossRef]
- Brooke Anderson, G.; Bell, M.L. Heat Waves in the United States: Mortality Risk during Heat Waves and Effect Modification by Heat Wave Characteristics in 43 U.S. Communities. Environ. Health Perspect. 2011, 119, 210–218. [Google Scholar] [CrossRef] [Green Version]
- Stewart, I.D.; Oke, T.R. Local Climate Zones for Urban Temperature Studies. Bull. Am. Meteorol. Soc. 2012, 93, 1879–1900. [Google Scholar] [CrossRef]
- Golden, J.S.; Hartz, D.; Brazel, A.; Luber, G.; Phelan, P. A Biometeorology Study of Climate and Heat-Related Morbidity in Phoenix from 2001 to 2006. Int. J. Biometeorol. 2008, 52, 471–480. [Google Scholar] [CrossRef] [PubMed]
- Guan, H.; Soebarto, V.; Bennett, J.; Clay, R.; Andrew, R.; Guo, Y.; Gharib, S.; Bellette, K. 14 Response of Office Building Electricity Consumption to Urban Weather in Adelaide, South Australia. Urban Clim. 2014, 10, 42–55. [Google Scholar] [CrossRef]
- Park, H.S. Features of the Heat Island in Seoul and Its Surrounding Cities. Atmos. Environ. 1986, 20, 1859–1866. [Google Scholar] [CrossRef]
- Kim, Y.H.; Baik, J.J. Daily Maximum Urban Heat Island Intensity in Large Cities of Korea. Theor. Appl. Climatol. 2004, 79, 151–164. [Google Scholar] [CrossRef]
- He, B.J. Potentials of Meteorological Characteristics and Synoptic Conditions to Mitigate Urban Heat Island Effect. Urban Clim. 2018, 24, 26–33. [Google Scholar] [CrossRef]
- Yow, D.M. Urban heat islands: Observations, impacts, and adaptation. Geogr. Compass 2007, 1, 1227–1251. [Google Scholar] [CrossRef]
- Rajagopalan, P.; Lim, K.C.; Jamei, E. Urban Heat Island and Wind Flow Characteristics of a Tropical City. Sol. Energy 2014, 107, 159–170. [Google Scholar] [CrossRef]
- Lopes, A.; Lopes, S.; Matzarakis, A.; Alcoforado, M.J. The Influence of the Summer Sea Breeze on Thermal Comfort in Funchal (Madeira). A Contribution to Tourism and Urban Planning. Meteorol. Z. 2011, 20, 553–564. [Google Scholar] [CrossRef]
- Emmanuel, R.; Johansson, E. Influence of Urban Morphology and Sea Breeze on Hot Humid Microclimate: The Case of Colombo, Sri Lanka. Clim. Res. 2006, 30, 189–200. [Google Scholar] [CrossRef] [Green Version]
- Masuda, Y.; Ikeda, N.; Seno, T.; Takahashi, N.; Ojima, T. A Basic Study on Utilization of the Cooling Effect of Sea Breeze in Waterfront Areas along Tokyo Bay. J. Asian Archit. Build. Eng. 2005, 4, 483–487. [Google Scholar] [CrossRef]
- Archer, C.L.; Colle, B.A.; Delle Monache, L.; Dvorak, M.J.; Lundquist, J.; Bailey, B.H.; Beaucage, P.; Churchfield, M.J.; Fitch, A.C.; Kosovic, B.; et al. Meteorology for Coastal/Offshore Wind Energy in the United States: Recommendations and Research Needs for the next 10 Years. Bull. Am. Meteorol. Soc. 2014, 95, 515–519. [Google Scholar] [CrossRef]
- Gilliam, R.C.; Raman, S.; Niyogi, D.E.V.D.S. Observational and Numerical Study on the Influence of Large-Scale flow Direction and Coastline Shape on Seabreeze Evolution. Bound.-Layer Meteorol. 2004, 111, 275–300. [Google Scholar] [CrossRef]
- Takebayashi, H.; Tanaka, T.; Moriyama, M.; Watanabe, H.; Miyazaki, H.; Kittaka, K. Relationship between City Size, Coastal Land Use, and Summer Daytime Air Temperature Rise with Distance from Coast. Climate 2018, 6, 84. [Google Scholar] [CrossRef]
- Freitas, E.D.; Rozoff, C.M.; Cotton, W.R.; Silva Dias, P.L. Interactions of an Urban Heat Island and Sea-Breeze Circulations during Winter over the Metropolitan Area of São Paulo, Brazil. Bound.-Layer Meteorol. 2007, 122, 43–65. [Google Scholar] [CrossRef]
- Bastin, S.; Drobinski, P. Temperature and Wind Velocity Oscillations along a Gentle Slope during Sea-Breeze Events. Bound.-Layer Meteorol. 2005, 114, 573–594. [Google Scholar] [CrossRef]
- Crosman, E.T.; Horel, J.D. Sea and Lake Breezes: A Review of Numerical Studies. Bound.-Layer Meteorol. 2010, 137, 1–29. [Google Scholar] [CrossRef]
- Liu, R.; Han, Z.; Wu, J.; Hu, Y.; Li, J. The Impacts of Urban Surface Characteristics on Radiation Balance and Meteorological Variables in the Boundary Layer around Beijing in Summertime. Atmos. Res. 2017, 197, 167–176. [Google Scholar] [CrossRef]
- Morini, E.; Touchaei, A.G.; Rossi, F.; Cotana, F.; Akbari, H. Evaluation of Albedo Enhancement to Mitigate Impacts of Urban Heat Island in Rome (Italy) Using WRF Meteorological Model. Urban Clim. 2018, 24, 551–566. [Google Scholar] [CrossRef]
- Shen, L.; Sun, J.; Yuan, R. Idealized Large-Eddy Simulation Study of Interaction between Urban Heat Island and Sea Breeze Circulations. Atmos. Res. 2018, 214, 338–347. [Google Scholar] [CrossRef]
- Varquez, A.C.G.; Nakayoshi, M.; Kanda, M. The Effects of Highly Detailed Urban Roughness Parameters on a Sea-Breeze Numerical Simulation. Bound.-Layer Meteorol. 2015, 154, 449–469. [Google Scholar] [CrossRef]
- Martilli, A. A Two-Dimensional Numerical Study of the Impact of a City on Atmospheric Circulation and Pollutant Dispersion in a Coastal Environment. Bound.-Layer Meteorol. 2003, 108, 91–119. [Google Scholar] [CrossRef]
- Peng, Z.; Hu, F. A study of the influence of urbanization of Beijing on the boundary wind structure. Chin. J. Geophys. 2006, 49, 1608–1615. [Google Scholar]
- Hu, X.M. Influence of Synoptic Sea Breeze Fronts on the Urban Heat Island Intensity in Dallas-Fort Worth, Texas. Syria Studies 2015, 7, 37–72. [Google Scholar] [CrossRef]
- David, E.K. Convection Initiation Associated with a Sea-Breeze Front, AGust Front, and Their Collision. Mon. Weather. Rev. 1995, 123, 2913–2933. [Google Scholar] [CrossRef]
- Junimura, Y.; Watanabe, H. Study on the Effects of Sea Breeze for Decreasing Urban Air Temperature in Summer: Analyses Based on Long-Term Multi-Point Measurements and Observed Wind Conditions. J. Environ. Eng. AIJ 2008, 73, 93–99. [Google Scholar] [CrossRef]
- Katayama, T.; Hayashi, T.; Shiotsuki, Y.; Kitayama, H.; Ishii, A.; Nishida, M.; Tsutsumi, J.I.; Oguro, M. Cooling Effects of a River and Sea Breeze on the Thermal Environment in a Built-up Area. Energy Build. 1991, 16, 973–978. [Google Scholar] [CrossRef]
- Kitao, N.; Moriyama, M.; Takebayashi, H.; Tanaka, T. A Study on Making Method of a Study on Making Method of Climate Atlas in Osaka Region. AIJ J. Technol. Des. 2012, 18, 255–258. [Google Scholar] [CrossRef]
- Peng, S.; Kon, Y.; Watanabe, H. Effects of Sea Breeze on Urban Areas Using Computation Fluid Dynamic—A Case Study of the Range of Cooling and Humidity Effects in Sendai, Japan. Sustainability 2022, 14, 1074. [Google Scholar] [CrossRef]
- Khan, S.M.; Simpson, R.W. Effect of a Heat Island on the Meteorology of a Complex Urban Airshed. Bound.-Layer Meteorol. 2001, 100, 487–506. [Google Scholar] [CrossRef]
- Naor, R.; Potchter, O.; Shafir, H.; Alpert, P. An Observational Study of the Summer Mediterranean Sea Breeze Front Penetration into the Complex Topography of the Jordan Rift Valley. Theor. Appl. Climatol. 2017, 127, 275–284. [Google Scholar] [CrossRef]
- Powers, J.G.; Klemp, J.B.; Skamarock, W.C.; Davis, C.A.; Dudhia, J.; Gill, D.O.; Coen, J.L.; Gochis, D.J.; Ahmadov, R.; Peckham, S.E.; et al. The Weather Research and Forecasting Model: Overview, System Efforts, and Future Directions. Bull. Am. Meteorol. Soc. 2017, 98, 1717–1737. [Google Scholar] [CrossRef]
- Skamarock, W.C.; Klemp, J.B.; Dudhia, J.; Gill, D.O.; Barker, D.M. A Description of the Advanced Research WRF Version 3. NCAR Tech. Note NCAR/TN-475+STR. 2008. 113p. Available online: https://opensky.ucar.edu/islandora/object/technotes:500 (accessed on 25 July 2022).
- Miao, Y.; Liu, S.; Chen, B.; Zhang, B.; Wang, S.; Li, S. Simulating Urban Flow and Dispersion in Beijing by Coupling a CFD Model with the WRF Model. Adv. Atmos. Sci. 2013, 30, 1663–1678. [Google Scholar] [CrossRef]
- Zheng, Y.; Miao, Y.; Liu, S.; Chen, B.; Zheng, H.; Wang, S. Simulating Flow and Dispersion by Using WRF-CFD Coupled Model in a Built-up Area of Shenyang, China. Adv. Meteorol. 2015, 2015, 528618. [Google Scholar] [CrossRef]
- Kusaka, H.; Hara, M.; Takane, Y. Urban Climate Projection by the WRF Model at 3-Km Horizontal Grid Increment: Dynamical Downscaling and Predicting Heat Stress in the 2070’s August for Tokyo, Osaka, and Nagoya Metropolises. J. Meteorol. Soc. Jpn. 2012, 90, 47–63. [Google Scholar] [CrossRef]
- Hong, S.Y.; Dudhia, J.; Chen, S.H. A Revised Approach to Ice Microphysical Processes for the Bulk Parameterization of Clouds and Precipitation. Mon. Weather. Rev. 2004, 132, 103–120. [Google Scholar] [CrossRef]
- Xie, B.; Fung, J.C.H.; Chan, A.; Lau, A. Evaluation of Nonlocal and Local Planetary Boundary Layer Schemes in the WRF Model. J. Geophys. Res. Atmos. 2012, 117, 1–26. [Google Scholar] [CrossRef]
- Kain, J.S. The Kain–Fritsch Convective Parameterization: An Update. J. Appl. Meteorol. 2004, 43, 170–181. [Google Scholar] [CrossRef]
- Zhou, X.; Okaze, T.; Ren, C.; Cai, M.; Ishida, Y.; Watanabe, H.; Mochida, A. Evaluation of Urban Heat Islands Using Local Climate Zones and the Influence of Sea-Land Breeze. Sustain. Cities Soc. 2020, 55, 102060. [Google Scholar] [CrossRef]


| ID | Location | Lon. | Lat. | Distance (Km) |
|---|---|---|---|---|
| 1 | Nenoshiroishi | 140.796602 | 38.341726 | 21.35 |
| 2 | Yakata | 140.799167 | 38.312591 | 19.68 |
| 3 | Teraoka | 140.828391 | 38.340624 | 18.92 |
| 4 | Nomura | 140.861097 | 38.325285 | 15.65 |
| 5 | Kita-Sendai | 140.861212 | 38.297756 | 13.91 |
| 6 | Kunimi | 140.845 | 38.27666667 | 14.02 |
| 7 | Asahigaoka | 140.885703 | 38.297379 | 12.15 |
| 8 | Tsurugaoka | 140.929878 | 38.316229 | 10.15 |
| 9 | Higashi Nibancho | 140.874781 | 38.259458 | 10.82 |
| 10 | Saiwaicho | 140.897926 | 38.276957 | 10.00 |
| 11 | Nishitaga | 140.858828 | 38.219923 | 11.63 |
| 12 | Hitokita | 140.809892 | 38.224932 | 14.75 |
| 13 | Nagamachi | 140.880617 | 38.232263 | 8.98 |
| 14 | Minamikoizumi | 140.905447 | 38.244434 | 7.61 |
| 15 | Fukurobara | 140.903682 | 38.196458 | 5.92 |
| 16 | Kabanomachi | 140.9291667 | 38.24194444 | 5.60 |
| 17 | Takasago | 140.958098 | 38.272964 | 5.27 |
| 18 | Rokugo | 140.9336111 | 38.21472222 | 3.75 |
| 19 | Higashishiromaru | 140.923753 | 38.193381 | 4.15 |
| 20 | Okada | 140.978404 | 38.256679 | 2.83 |
| 21 | Observatory | 140.89692 | 38.26209 | 9.43 |
| Calculation period | 09:00 (JST) on 1 August 2016, to 09:00 (JST) on 10 August 2016 |
| Vertical grid | 30 layers |
| Domain 1: 9 km, dimension 37 × 28 | |
| Horizontal grid (Figure 3) | Domain 2: 3 km, dimension 43 × 34 |
| Domain 3: 1 km, dimension 31 × 28 | |
| Meteorological data | NCEP re-analysis of global objective data |
| Land data | Digital national land information (resolution of 1000 m) |
| Microphysics | WSM 6-class graupel scheme [47] |
| Radiation: | |
| Longwave | Rapid radiative transfer model |
| Shortwave | Dudhia shortwave |
| PBL scheme | Mellor–Yamada–Janjic TKE scheme [24] |
| Surface scheme | Urban canopy model [46] |
| Cumulus scheme | Kain–Fritsch scheme [49] |
| ID | Location | Bias (°C) | RMSE (°C) | Correlation |
|---|---|---|---|---|
| 1 | Nenoshiroishi | −0.55 | 0.68 | 0.981 |
| 2 | Yakata | −0.88 | 0.82 | 0.973 |
| 3 | Teraoka | −0.76 | 0.82 | 0.974 |
| 4 | Nomura | −0.13 | 0.43 | 0.993 |
| 5 | Kita-Sendai | −1.36 | 0.57 | 0.984 |
| 6 | Kunimi | −1.81 | 0.53 | 0.985 |
| 7 | Asahigaoka | −1.72 | 0.99 | 0.945 |
| 8 | Tsurugaoka | −0.62 | 1.09 | 0.945 |
| 9 | Higashi Nibancho | −2.49 | 1.00 | 0.936 |
| 10 | Saiwaicho | −1.53 | 0.58 | 0.979 |
| 11 | Nishitaga | −2.05 | 0.99 | 0.939 |
| 12 | Hitokita | −0.24 | 0.88 | 0.969 |
| 13 | Nagamachi | −2.13 | 0.86 | 0.950 |
| 14 | Minamikoizumi | −2.15 | 0.88 | 0.937 |
| 15 | Fukurobara | −0.84 | 1.03 | 0.912 |
| 16 | Kabanomachi | −1.29 | 0.53 | 0.969 |
| 17 | Takasago | −1.36 | 0.80 | 0.957 |
| 18 | Rokugo | −1.20 | 0.82 | 0.926 |
| 19 | Higashishiromaru | −0.60 | 1.34 | 0.802 |
| 20 | Okada | −0.59 | 0.75 | 0.939 |
Publisher’s Note: MDPI stays neutral with regard to jurisdictional claims in published maps and institutional affiliations. |
© 2022 by the authors. Licensee MDPI, Basel, Switzerland. This article is an open access article distributed under the terms and conditions of the Creative Commons Attribution (CC BY) license (https://creativecommons.org/licenses/by/4.0/).
Share and Cite
Peng, S.; Watanabe, H. Analysis and Mapping of Sea Breeze Event Time in Coastal Cities: A Case Study of Sendai. Atmosphere 2022, 13, 1484. https://doi.org/10.3390/atmos13091484
Peng S, Watanabe H. Analysis and Mapping of Sea Breeze Event Time in Coastal Cities: A Case Study of Sendai. Atmosphere. 2022; 13(9):1484. https://doi.org/10.3390/atmos13091484
Chicago/Turabian StylePeng, Shiyi, and Hironori Watanabe. 2022. "Analysis and Mapping of Sea Breeze Event Time in Coastal Cities: A Case Study of Sendai" Atmosphere 13, no. 9: 1484. https://doi.org/10.3390/atmos13091484
APA StylePeng, S., & Watanabe, H. (2022). Analysis and Mapping of Sea Breeze Event Time in Coastal Cities: A Case Study of Sendai. Atmosphere, 13(9), 1484. https://doi.org/10.3390/atmos13091484