Article

Life Cycle Assessment of a Prospective Technology for Building-Integrated Production of Broccoli Microgreens

by
Michael G. Parkes
1,2,*,
Julieth P. Cubillos Tovar
3,
Filipe Dourado
2,
Tiago Domingos
1 and
Ricardo F. M. Teixeira
1
1
MARETEC-Marine, Environment and Technology Centre, LARSyS-Laboratory of Robotics and Engineering System, Instituto Superior Técnico, Universidade de Lisboa, Av. Rovisco País 1, 1049-001 Lisboa, Portugal
2
Canguru Foods, Lda, Social Enterprise with Head Office in Lisbon, Rua Cidade Nova Lisboa, 11, 1800-107 Olivais, Portugal
3
Doctoral School of Economic and Regional Sciences, Hungarian University of Agriculture and Life Sciences, 2100 Gödöllő, Hungary
*
Author to whom correspondence should be addressed.
Atmosphere 2022, 13(8), 1317; https://doi.org/10.3390/atmos13081317
Submission received: 13 July 2022 / Revised: 7 August 2022 / Accepted: 12 August 2022 / Published: 18 August 2022
(This article belongs to the Special Issue Urban Design, Microclimate and Environment)

Abstract

:
Indoor Vertical Farms (IVF) can contribute to urban circular food systems by reducing food waste and increasing resource use efficiency. They are also known for high energy consumption but could potentially be improved by integration with buildings. Here, we aim to quantify the environmental performance of a prospective building-integrated urban farm. We performed a Life Cycle Assessment for a unit installed in a university campus in Portugal, producing broccoli microgreens for salads. This technology integrates IVF, product processing and Internet of Things with unused space. Its environmental performance was analyzed using two supply scenarios and a renewable energy variation was applied to each scenario. Results show that the IVF system produces 7.5 kg of microgreens daily with a global warming potential of 18.6 kg CO2e/kg in the case of supply direct on campus, or 22.2 kg CO2e/kg in the case of supply off campus to retailers within a 10-km radius. Consistently in both scenarios, electricity contributed the highest emission, with 10.03 kg CO2e/kg, followed by seeds, with 4.04 kg CO2e/kg. The additional use of photovoltaic electricity yields a reduction of emissions by 32%; an improvement of approximately 16% was found for most environmental categories. A shortened supply chain, coupled with renewable electricity production, can contribute significantly to the environmental performance of building-integrated IVF.

1. Introduction

Global supply chains produce 3.0 GtCO2 in emissions for transport and more than a third of this is associated with plant-based food distribution [1]. Many factors contribute to the intensity of carbon emissions across urban supply chains, such as the level of industry established, its existing infrastructure for production and transportation [2].Urban Agriculture (UA) connects producers with consumers and can help improve access to healthy food in densely populated areas [3,4]. Locating agricultural production in cities does little to address upstream contributors of emissions like pre-processing of technologies and fertilizers [5,6,7], but it has potential to improve downstream impacts from postproduction processing, transportation for distribution and waste management [8,9]. Heavily dependent on the urban environment’s availability of unused urban spaces, technological advancements have increased the application of UA installations inside or on rooftops of buildings [2,10,11,12,13]. In response to global food-miles, installing commercial production systems in urban areas shortens supply chains taking advantage of local production to reduce distance from farm to customer, requiring less energy needs for transport and storage, and improving food security [1,3,4,14,15,16,17].
Indoor Vertical Farms (IVF) are one type of technology applied in UA installations believed to take targeted action towards a circular economy and some environmental benefits through building integration [18,19,20,21,22,23,24]. In most cases an IVF system combines three agricultural technologies for cultivation: a controlled environment growth chamber, a soil-less growing system (hydroponics, aeroponics or aquaponics) and a light system [13,25]. IVF delivers high yields per unit area, year-round production, climate control, water and resource use efficiency [26,27,28,29,30]. Depending on demand in the region and the objectives of the urban farm, a range of leafy greens, fruits and vegetables or fish can be grown, requiring different infrastructure, materials and conditions [31,32]. In the case of an economically driven urban farm, the priority is to sell product at the highest price and produce at the lowest costs. Increasing the output for sale as food then drives the technology selection [33,34,35].
Besides the issues with selection of technology and operational control, IVF faces the challenge of high energy demand due to the use of Light Emitting Diode (LED) light and climate control, and other costs associated with infrastructure, land, farm operations and waste [28,36,37]. When compared with conventional agriculture [23], IVF replaces sunlight with LED lighting and controlled environmental conditions, which comes at a cost financially and environmentally. This is a main factor that creates barriers to increased technology uptake [38,39]. Indoor UA farms have been found to cause emissions ranging from 4.2 to 26.5 kg CO2e to produce a kg of leafy green plants and are highly influenced by the installed technology [15,30,40,41,42]. In most cases the major contributor was electricity, highlighting the need for extensive energy efficiency modeling of IVF equipment and considering alternative renewable electricity sources depending on the location [25,29,43,44]. These renewable sources are important to address this economic and environmental challenges faced in IVF. It is therefore unclear which types of IVF can deliver produce with lower impacts. There is limited data availability enabling an assessment of the options IVF offers for obtaining tangible improvements in cities [8,45]. For example, there are few studies that quantitatively assess how the important factors influencing the performance of IVF systems also affect the environmental impacts generated from production.
This study fills this gap by undertaking the Life Cycle Assessment (LCA) of a prospective IVF technology integrated inside a university campus building to produce microgreens [46]. Here, we propose that current drawbacks of UA can be addressed through IVF integration with buildings to access material streams for waste reduction and energy improvement, thus increasing circularity of waste flows and shortening supply chains [17,47,48,49]. The circularity examined in this study is related to the local supply of microgreens and utilization of organic waste all in the same institution. The aim of the study is to analyze the environmental performance of a prospective technology to supply customers directly onsite (circular) and compare it with a potential alternative of installation of the same technology in a dedicated building and supply of produce off campus to retailers (linear). Concretely, we assess several of the main factors influencing the performance of IVF systems, namely how produce is supplied to consumers (on site vs. remotely), the fate of biological waste materials (composting and use vs. waste disposal as municipal waste), and the source of electricity produced (building-integrated photovoltaic vs. grid). The following sections outline the LCA methods applied, detailed inventory of materials, the results, and a discussion, before answering the main questions raised regarding the role of circularity and building integration in the environmental sustainability of IVF in the conclusions.

2. Materials and Methods

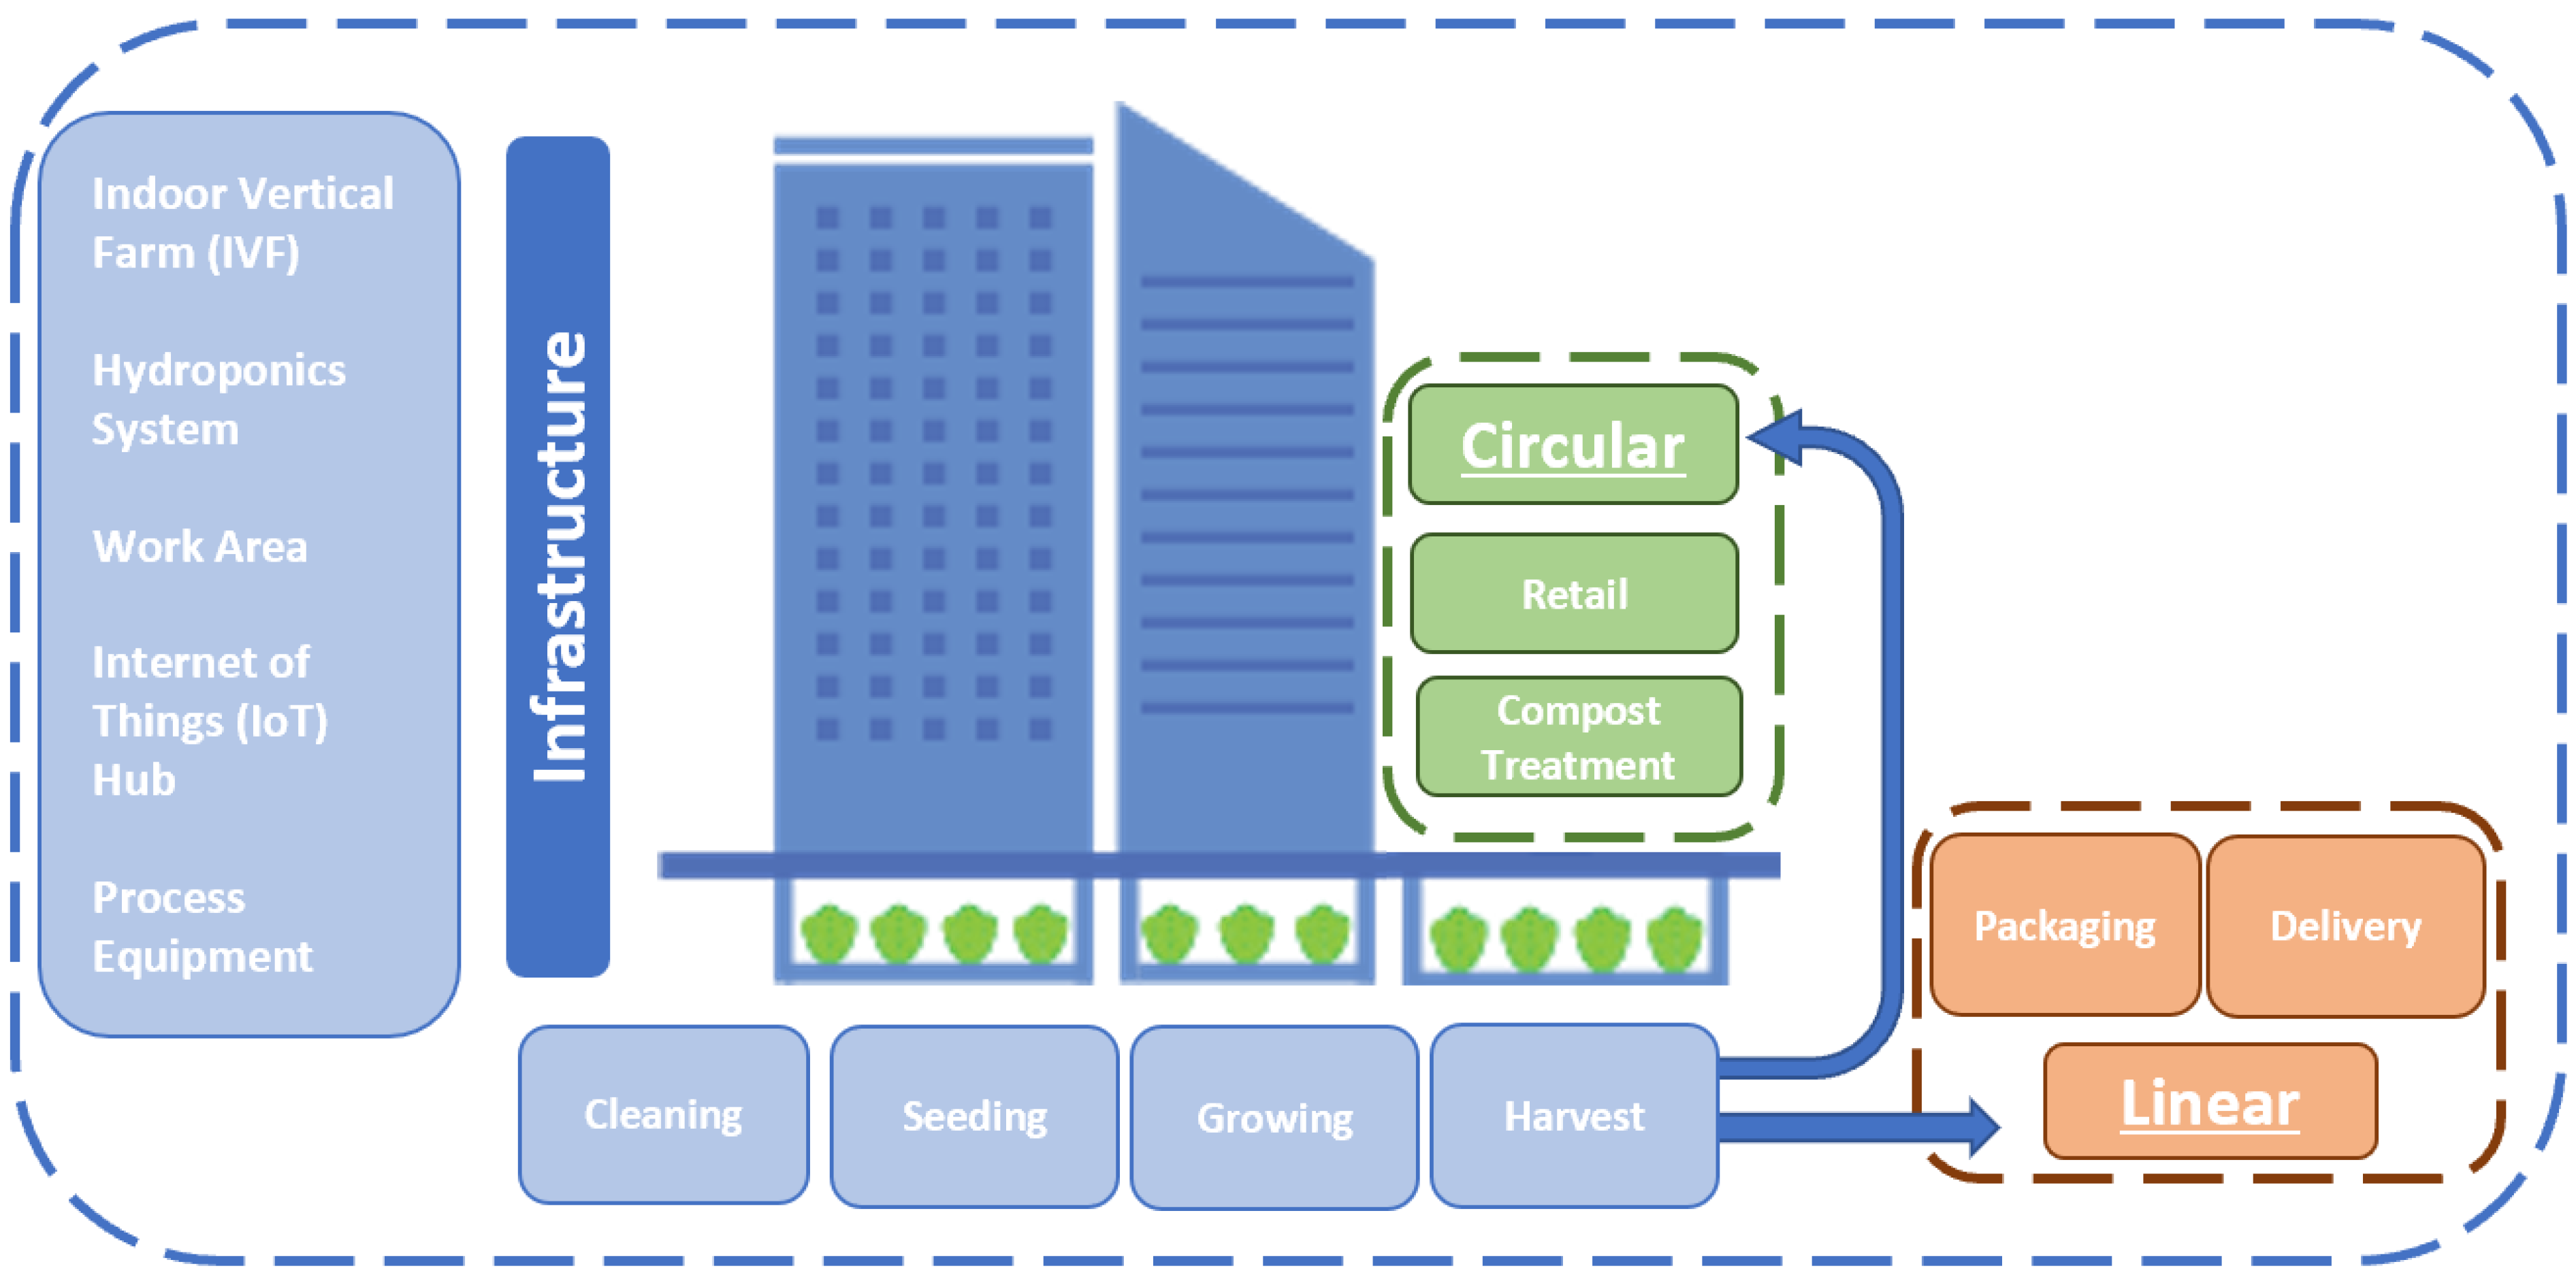
2.1. Study Case Description

The study presents a prospective technology to integrate urban farm technology and operations in an urban building. The installation is not yet producing plants, for which reason in this paper we use the term “prospective” to designate this technology. The design of the installation, starting with the location where it was placed, aimed to shorten supply chains for the production of an ingredient consumed in salads offered by food retailers on the campus. The equipment is located in the basement of one of seven buildings on a university campus in the region of Lisbon, Portugal. Broccoli (Brassica oleracea var. raab) was selected for this site [46,50]. The installation is schedule to produce 64.30 kg/m2, which is equivalent to 2700 kg of broccoli microgreens annually, or 7.5 kg per day. Two factors drove the crop selection: (1) the economic sustainability of the urban farm, and (2) microgreens cultivated in vertical farms produce high nutritional value and cultivation density [46]. These factors are however not explicitly taken into account in this study as the focus is on the environmental impact of the microgreens produced by the building-integrated technologies.
The urban farm will operate cultivation and processes for harvest and packaging onsite. Two main areas were installed to prepare the final product for delivery to food retailers: the first is the IVF and the second is the preparation work area. The IVF includes a soil-less hydroponic system, LED lighting and growth chamber. The preparation work area includes a constructed room with lighting and equipment for seeding and harvesting processes. Both were installed in the technical area of the building and installed together with Internet-of-Things (IoT) equipment and connectivity for building integration and resource use efficiency. The unused space of the technical services area provides access for integration with building energy, water, data infrastructure and air ventilation systems. The location of the IVF chamber, IoT hub and work area offers carpark access to receive materials for microgreen production and deliver final product direct to the campus on foot.
The IVF consists of a 32 m2 climate-controlled growth chamber with height 3.0 m, width 5.0 m, and length 4.2 m, occupying 22 m2 of area. A hydroponic nutrient dosing system services a vertical farm structure with 8 shelves, each with 4 cultivation tiers and 1 germination tier. A total of 40 tiers are connected to ebb and flow hydroponics, each with the capacity to hold 4 growing trays. Each cultivation tier has 5 LED tube grow lights with 5.6 kW power and a 6-kW climate control system. A work area chamber with height 3.0 m, width 3.5 m, and length 8.0 m, houses equipment for operational processes of seeding, harvest and packaging. At full capacity the urban farm can process 126 trays per week (4 trays per cultivation tier) with 18 seeded trays per day growing broccoli microgreens [46,50]. The microgreens are seeded in reusable plastic trays of length 0.6 m, width 0.4 m and height 0.5 m which require 14 days to germinate and grow ready for harvest. The case studied here uses a cycle where seeded trays germinate in the bottom tier without light for 7 days, then trays are move up to tiers with LED lights for 7 days of cultivation under 14 h/day of LED in the IVF.
This IVF system is operated by a proprietary software for production control and monitoring and generates a range of data variables from sensors measuring Temperature (T), Relative Humidity (RH), circulating carbon dioxide (CO2), water and nutrients (NPK) flow. Integrated via database, the IoT hub connects local climate environment sensors measuring T, RH and CO2, with metered electricity (kWh) and local weather data. All systems in the urban farm, IVF and preparation work are connected to existing building water and electricity supply, which gives access to renewable energy sources via existing solar electricity generation and roof space to expand this system. Data integration is a critical component of the prospective technology and provides multiple benefits to production [26], but its specific contribution to the environmental performance of the system is not explored in this study.

2.2. Scenarios

The scenarios were designed based on the prospective technology installed on the campus to compare product supply options for microgreens and analyze the value of material flows onsite. Two urban farm supply scenarios were studied. First, we define Circular Supply (CS) as a replication of the planned future operations to cultivate, post-process and supply the fresh microgreens for consumption on campus, as well as organic waste for composting and use also on site. Then, we define a potential alternative operation of the urban farm in a building that was not integrated with the institution, which we designate as Linear Supply (LS). Both scenarios use the prospective technology, functional unit and system boundaries described in Section 2.3. The major differences between scenarios are in the post-cultivation processing and the delivery stages.
In CS, food is produced in the building-integrated IVF and supplied directly to food retailers on campus. The urban farm model is operated at 0.5 km (km) distance from the food court where the product is delivered on foot by trolley in reusable boxes. As the food business is within walking distance from the IVF, we excluded materials related to off-campus supply such as single use plastics for packaging and refrigerated storage [51], as well as transportation. This scenario requires no single-use packaging to move the microgreens to consumers. An additional advantage is the location in a university campus that includes gardens that use compost. That compost may be produced from existing green waste produced by the urban farm.
The second scenario, LS, assumes a more traditional supply chain in UA for comparison purposes, where the building-integrated IVF is located in an urban area, not a campus or an institution that also serves food and other services, and transportation to retail food businesses is required to access consumers [52,53]. This requires additional post-cultivation processing materials and resources to ensure the safety of food during transportation and during retail storage such as plastic bags and labels (Tables S9 and S10). Here, the final product is individually packaged and then delivered to retailers within a 10-km radius using refrigerated transportation. This scenario required 2 additional processes (packaging and delivery) in the model to reflect delivery of the final product from the urban farm gate to the retail point of sale. Assumed here is that the urban farm is located in an individual urban building. The LS scenario excludes compost treatment as organic wastes produced are disposed of through municipal waste services. This was due to the fact that, because of the lack of gardens for application of compost in the IVF location, there would be no incentive for composting organic wastes on site.
Given the focus of the study on environmental impacts of building-integrated IVF technology as part of cities, a variant was created for renewable energy produced locally and applied to each CS and LS. The solution produces food for local supply, and it can be assumed the building has installed a photovoltaic solar (PV) system on the roof to generate local electricity. Combined with the prospective technology as additional infrastructure in Section 2.4.1, electricity sources were distributed 30% from country energy grid and 70% via photovoltaic system. The rationale behind this assumption is based on the location’s weather and solar irradiance. In the Lisbon region the climate is temperate with monthly sunshine variations of between 140 h in winter to 340 h in summer, while monthly average temperatures range between 12 °C and 28 °C.

2.3. Life Cycle Assessment of Building-Integrated IVF

Life Cycle Assessment (LCA) is a method used to assess the potential environmental impacts and resources used in a product system [17]. LCA can be used in prospective analyses, i.e., for new technologies or new systems where data are limited [22].
This study follows ISO Standard 14,044; 2006 [53] guidelines for LCA assessment of the prospective IVF technology explained in Section 2.1. We used the Open LCA 1.10.3 software for the calculations. Activity data was collected onsite or estimated by facility operators and for emissions and background data we used the Ecoinvent 3.8 database, which is probably the biggest and most widely validated database available, plus adapted datasets from Agribalyse 3.0.1 where needed for agricultural materials in Europe [53,54]. The methods used in each stage of the LCA study, Goal and Scope Definition, Life Cycle Inventory Analysis (LCI), Life Cycle Impact Assessment (LCIA), and Interpretation [26] are presented next in detail.

2.3.1. Goal and Scope

The main goal of this study was to quantify the environmental impacts of the prospective technology in Section 2.1 using scenarios described in Section 2.2 and compare the differences between scenarios and the literature to quantitatively assess the potential role of building integration in the environmental performance of IVF systems. We evaluated the environmental impacts of the growing system for the case of broccoli microgreens. The functional unit in this assessment was 1 kg of fresh weight broccoli microgreens produced and delivered daily to retail businesses, on and off campus, modelled as the average production over a period of 12 months. Processes included in this model were defined based on the scenarios described in Section 2.4.2.

2.3.2. System Boundaries

The life cycle approach considered IVF operations and all upstream and downstream processes required to create and deliver the functional unit [13]. The system boundary took into account all activities, inputs, processes and installation infrastructure for the production of 1 kg of broccoli microgreen supplied direct to an on- or off-campus retailer for purchase and consumption, up until the product is delivered. The analysis was divided into the 2 scenarios described in Section 2.2, applying the LCA methodological approach of ‘cradle to gate’ to compare the use of prospective technology to deliver the final product [54]. The model assesses activities of 6 processes, including cleaning, seeding, growing, harvest, packaging, and delivery of the final product (Figure 1). Excluded are any processes after delivery, such as materials related to retail and consumption.
The upstream processes for IVF inputs included infrastructure, equipment, seeds, substrate, trays, water, electricity, cleaning materials and other consumables with their transportation. Downstream processes focus on the distribution of 1 kg of broccoli microgreens to the point of sale and approximately 4 kg of organic waste. The waste, in the CS case, is a secondary co-product which is used to produce compost that is applied in campus gardens (thus decreasing the need for compost currently purchased from outside the campus). In the LS case, as there is no building integration and therefore no place requiring fertilization, we assumed that there is no economic incentive for composing organic wastes. Organic waste was therefore treated as a waste flow that leaves the system boundary for municipal waste treatment.

2.4. Life Cycle Inventory

The LCI data for production, prospective technology and equipment were sourced mainly from the Ecoinvent database v3.8, which are detailed below in Section 2.4.1, separated into infrastructure, equipment, and processes. This inventory describes the inputs for critical technology and materials used in IVF operations, including seeds, substrate, nutrients, and energy. For both scenarios, the technology, lifetimes and processes are defined within the same system boundary, including updates to packaging and transportation processes for LS.
Research to identify upstream materials of electronic equipment such as LED or IoT sensors required use of manufacturer profiles to inform the corresponding functions in OpenLCA. Section 2.4.1 below provides detail on the inputs used for the infrastructure and specifies primary electronics and communications equipment required for IoT functionality.
Processes required to deliver the functional until of 1 kg of fresh weight broccoli microgreens produced are described in Section 2.4.2 to outline each stage of production within the system boundary. Defined are the primary processes for both scenarios, including changes required to replicate the packaging and delivery required for linear supply.

2.4.1. Indoor Vertical Farm Infrastructure

The infrastructure involved the IVF system, a climate-controlled growth chamber, soil-less hydroponics components, LED fixtures, steel structures, trays, installation materials, transportation, and assembly. The soil-less growing system included key equipment, water pumps, nutrient dosing, filters and tank. The LED lighting and climate control included the electrical hub, materials, cables and electronic components for sensors integration. The whole IVF system operates FitoLog-FitoView’s production and climate control software version 99150, licensed from Aralab, Albarraque Portugal. A 20-year lifetime was defined for the replacement of the majority of IVF components used to grow the functional unit, as outlined in Table 1. We considered 10 years for the LED lights, which operate between 10 and 14 h per day, and the growing trays, due to high use [27].
The work area involves similar inputs as the climate chamber of the IVF. A work room is used as the hub for operations of the urban farm processes for seedling, harvesting and packaging, all completed in this work area. Equipment included in this work area, e.g., steel trolleys, steel benches, lighting, electronics and items required for processes that produce the functional unit have a life of 10 years as they service multiple purposes. All technology equipment inputs are detailed in Table 1.
Electricity for installation, LED lighting, climate control, pumps and ventilation are included for the infrastructure for building integration, along with the IoT main hub and sensors. In order to test the effect of energy mix on CO2e of the functional unit, each scenario is modelled by varying the renewable sources for electricity [55], which is outlined in Section 2.4.2. Additionally, electricity consumption for processes involved in IVF operations are described in Section 2.4.2.
The PV systemwas designed to provide energy during peak demand of the IVF, when both the LEDs and climate control are functioning in parallel during plant growth. The Ecoinvent process “photovoltaic façade installation, 3 kWp, multi-Si, panel, mounted, at building” was applied from a global market provider. This input represents a 22 m2 photovoltaic installation with a lifetime of 30 years. The PV infrastructure was sized to produce the energy required for operating the LEDs and climate control during the plant growth period. The plant growth period corresponds to the 14 h time period of LEDs, which consume 6.5 kWh every hour of operation and climate control at 4.5 kWh with a total of 154 kWh per day. It was assumed that peak demand for IVF operating would align with peak solar irradiation for energy generation during daylight hours. Therefore, the PV energy generated is assumed to replace the energy required for operating the LEDs in the results of Section 3.2.
Due to seasonal variation in weather and its impact on energy generation, a PV system in reality could not fulfill the total energy demand without batteries or extreme over production. To address this, we assumed the monthly electricity demand as a fixed amount of 4620 kWh with no excess electricity stored or transferred into the energy grid. The size of the PV infrastructure required was determined using the Photovoltaic Geographical Information System [55]. According to this tool, monthly solar in-plane irradiation of the region in Lisbon varies between 116 kWh/m2 in winter and 222 kWh/m2 in summer. The tool then calculated that a 3-kWh solar installation without shadowing enables the monthly production of 313 kWh in winter and 555 kWh in summer. The average of these values was applied to estimate the monthly production of a 3-kWh installation as 463 kWh. Covering the fixed electricity demand of 4620 kWh thus required 10 items (PV panels) (Table S4).

2.4.2. Process Modelling

Producing the functional unit in OpenLCA required the development of multiple processes to replicate the IVF operational material inputs. LCI data for all processes were taken mainly from Ecoinvent 3.8, with an exception for seed and substrate, which were built from processes in the Agribalyse 3.0.1 database. The system boundary includes 6 processes: Seeding, Growing, Harvest, Packaging, and Delivery. Table 2 includes a description of the assumptions for each process, LCI data inputs and quantities for the infrastructure and equipment inventory. Additional information on assumptions made for the processes can be accessed in the Supplementary Materials.
The seeding process primary inputs are seeds, substrate and the trays; other inputs are a share of consumables and infrastructure. In order to improve the accuracy of this study, attention was paid to seeds and substrate as the critical materials for producing the functional unit due to the volume consumed. All seedling activities take place in the work area before trays are transferred to the IVF for germination and growth.
The seed function in OpenLCA is based on the weight of seeds required per tray and no consistent approach to sourcing seeds for IVF systems in Ecoinvent database exists. Our function for seeds was copied from Agribalyse database: “Cauliflower seed, conventional, at production site/FR U” and was replicated in Ecoinvent. For every kg of fresh weight of microgreens, 0.07 kg of seeds were consumed, equating to approximately 0.04 kg per tray.
The function that produces the substrate is based on coconut fiber as the growing medium and has similar inputs as Agribalyse “Coconut fiber, at regional storehouse/kg”. Replicated in Ecoinvent, a change was required as the original function had a zero amount for coconut de-husked to produce the coconut fiber. The substrate requires both coconut fiber and husks, the necessary inputs required being 1.33 kg of husks to produce 1 kg of coconut fiber. Each functional unit requires 3 kg input of this substrate (Table S7).
The growing process begins when the seeded trays are transferred to the IVF for germination in a dark layer, a tier at the bottom of the vertical hydroponic racks without LEDs. Once sprouted the seeded trays are move upwards in the racks to the cultivation layers where a nutrient and water mix are circulated on set intervals. For this assessment nutrients dosing is considered as a mix of NPK 15-15-15 supplied at 15 mL per liter of water. It is assumed there is no water or nutrient waste due to the closed loop hydroponic system recirculation of water and each kg produced uses 17 L.
Electricity is a primary input used to power the systems necessary for growing inside the IVF, particularly by managing environmental conditions (heating or cooling), lighting and circulating materials around the system. Each tray spends a total of 7 days under lights before it is ready for harvest. LED lights on cultivation tiers were assumed to run 14 h per day, 7 days/week, consuming 78 kWh. The climate system operates 24 h per day with several set points for heating and cooling, consuming 99.92 kWh. LCI data sourced for both CS and LS electricity are from Ecoinvent’s ‘1 MJ of Market for electricity in PT,’ representing electricity in Portugal 2018.
Following 14 days of germination and growth, trays are collected and transferred to the work area for harvest. The final broccoli microgreens product includes the leaf and stem, cut at the base of the stem, leaving the roots and substrate as organic waste. This is a manual process that involves infrastructure and equipment such as trolleys, benches, cutters and reusable boxes for delivery on campus in CS. This process includes water and consumables for cleaning the trays and reusable boxes. Excluded from all processes is human labor.
The harvest process produces a co-product of organic waste and in CS the treatment process to create compost had zero emissions and is used to avoid new compost being produced for application on campus. Provider selected was for ‘treatment of garden biowaste, home composting heaps’ in Econinvent as an input and the output of compost with ‘market for compost’ to replicate the circular waste treatment process on campus. This completes the LCI inputs and processes for scenario CS as both microgreens and organic wastes are delivered by humans.
To fully consider a “linear” (as opposed to “circular”) in scenario LS, packaging is included for delivery offsite to retail businesses and organic waste is taken as treated as municipal solid waste for PT. The functional unit of 1 kg of fresh weight broccoli microgreens is divided into 100 g plastic bags with a label and packed in carboard boxes for daily delivery. The bags were plastic, single use, had a size of 0.2 m by 0.2 m with an empty weight of 0.06 kg per item and were boxed in 1.4 kg of carboard. An additional 2 h of electricity was considered in packaging and cleaning processes for operations of the work area to replicate the total time of the urban farming operations.
Urban farm operations require constant cleaning with every production cycle from seeding to harvest and during annual maintenance. Accounted as a specific process in the model, cleaning applies to both scenarios and is estimated as a maximum of 2 h for each functional unit. A 1-year lifetime was applied for clothes, gloves and glasses, whereas soap and water were included as consumables (Table S8).

2.5. Impact Assessment

Life cycle impact assessment uses the ReCiPe 2016 v1.1 Midpoint (H) method to assess the environmental performance of 5 indicators in this study: Global Warming Potential (GWP) measured in CO2e, Freshwater Ecotoxicity (FE), Marine Ecotoxicity (ME), Terrestrial Ecotoxicity (TE) and Human Toxicity (HT), measuring ecotoxicity in kg 1,4-DCB [56,57]. The calculation in the ReCiPe methods starts with a classification of each flow to the environment generated within the system boundaries of the product system as contributing to each impact category. Then, for each impact category, the amount of flow generated per functional unit is multiplied by a characterization factor that depicts its relative contribution to the impact categories classified [56]. Considered at all relevant life cycle stages of the functional unit, results are used in this study to compare impacts of IVF and of UA supply chains [53]. Generating results for indicators such as GWP in CO2e per kg supports comparison with other LCA research into IVF technology [12,58,59,60]. Ecotoxicity impact categories were applied as representative of toxicity impacts on urban environments [33], and serve to assess the technologies’ impact on freshwater ecotoxicity, marine ecotoxicity, terrestrial ecotoxicity and human toxicity [57] (Table S2 and Figure S1).

3. Results

Results are first presented in depth for GWP to more easily depict all major findings using a single category only, and to identify the main contributors. Results are shown for both supply scenarios (CS and LS) and the renewable energy variation (PV). Finally, the results of ecotoxicity indicators are presented in Section 3.2. The analysis and explanation of results is included in the Discussion section (Table S1).

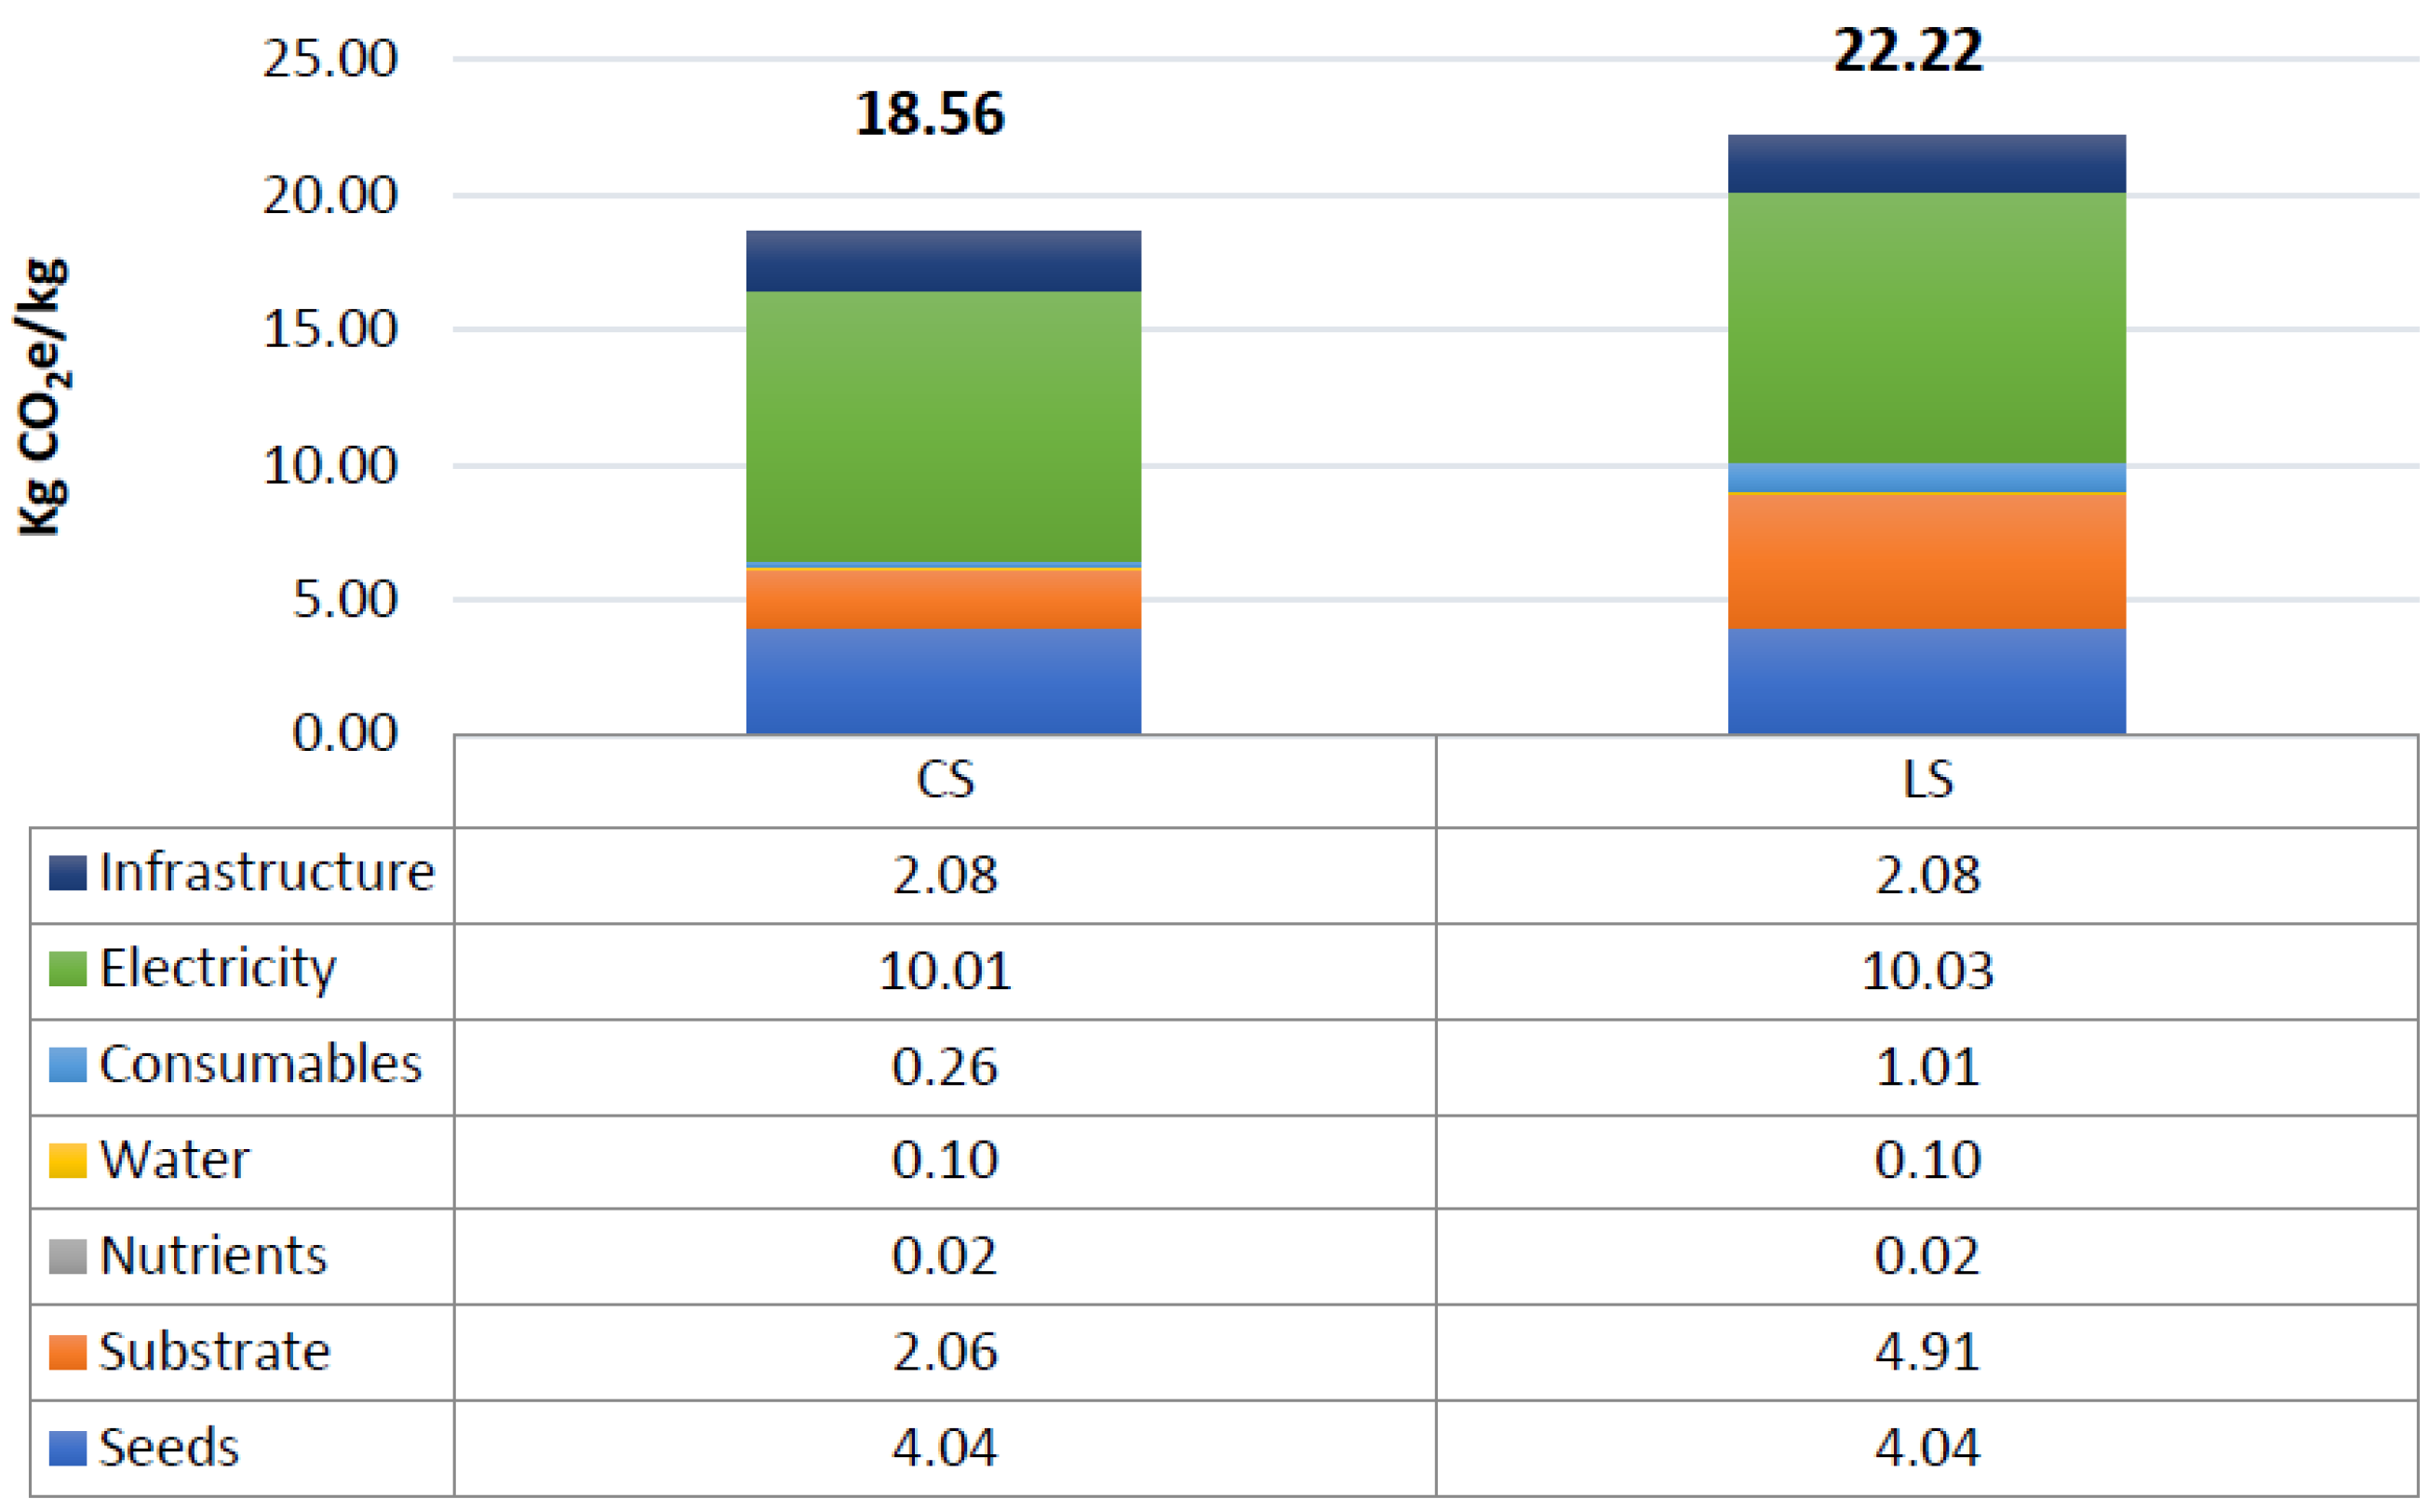
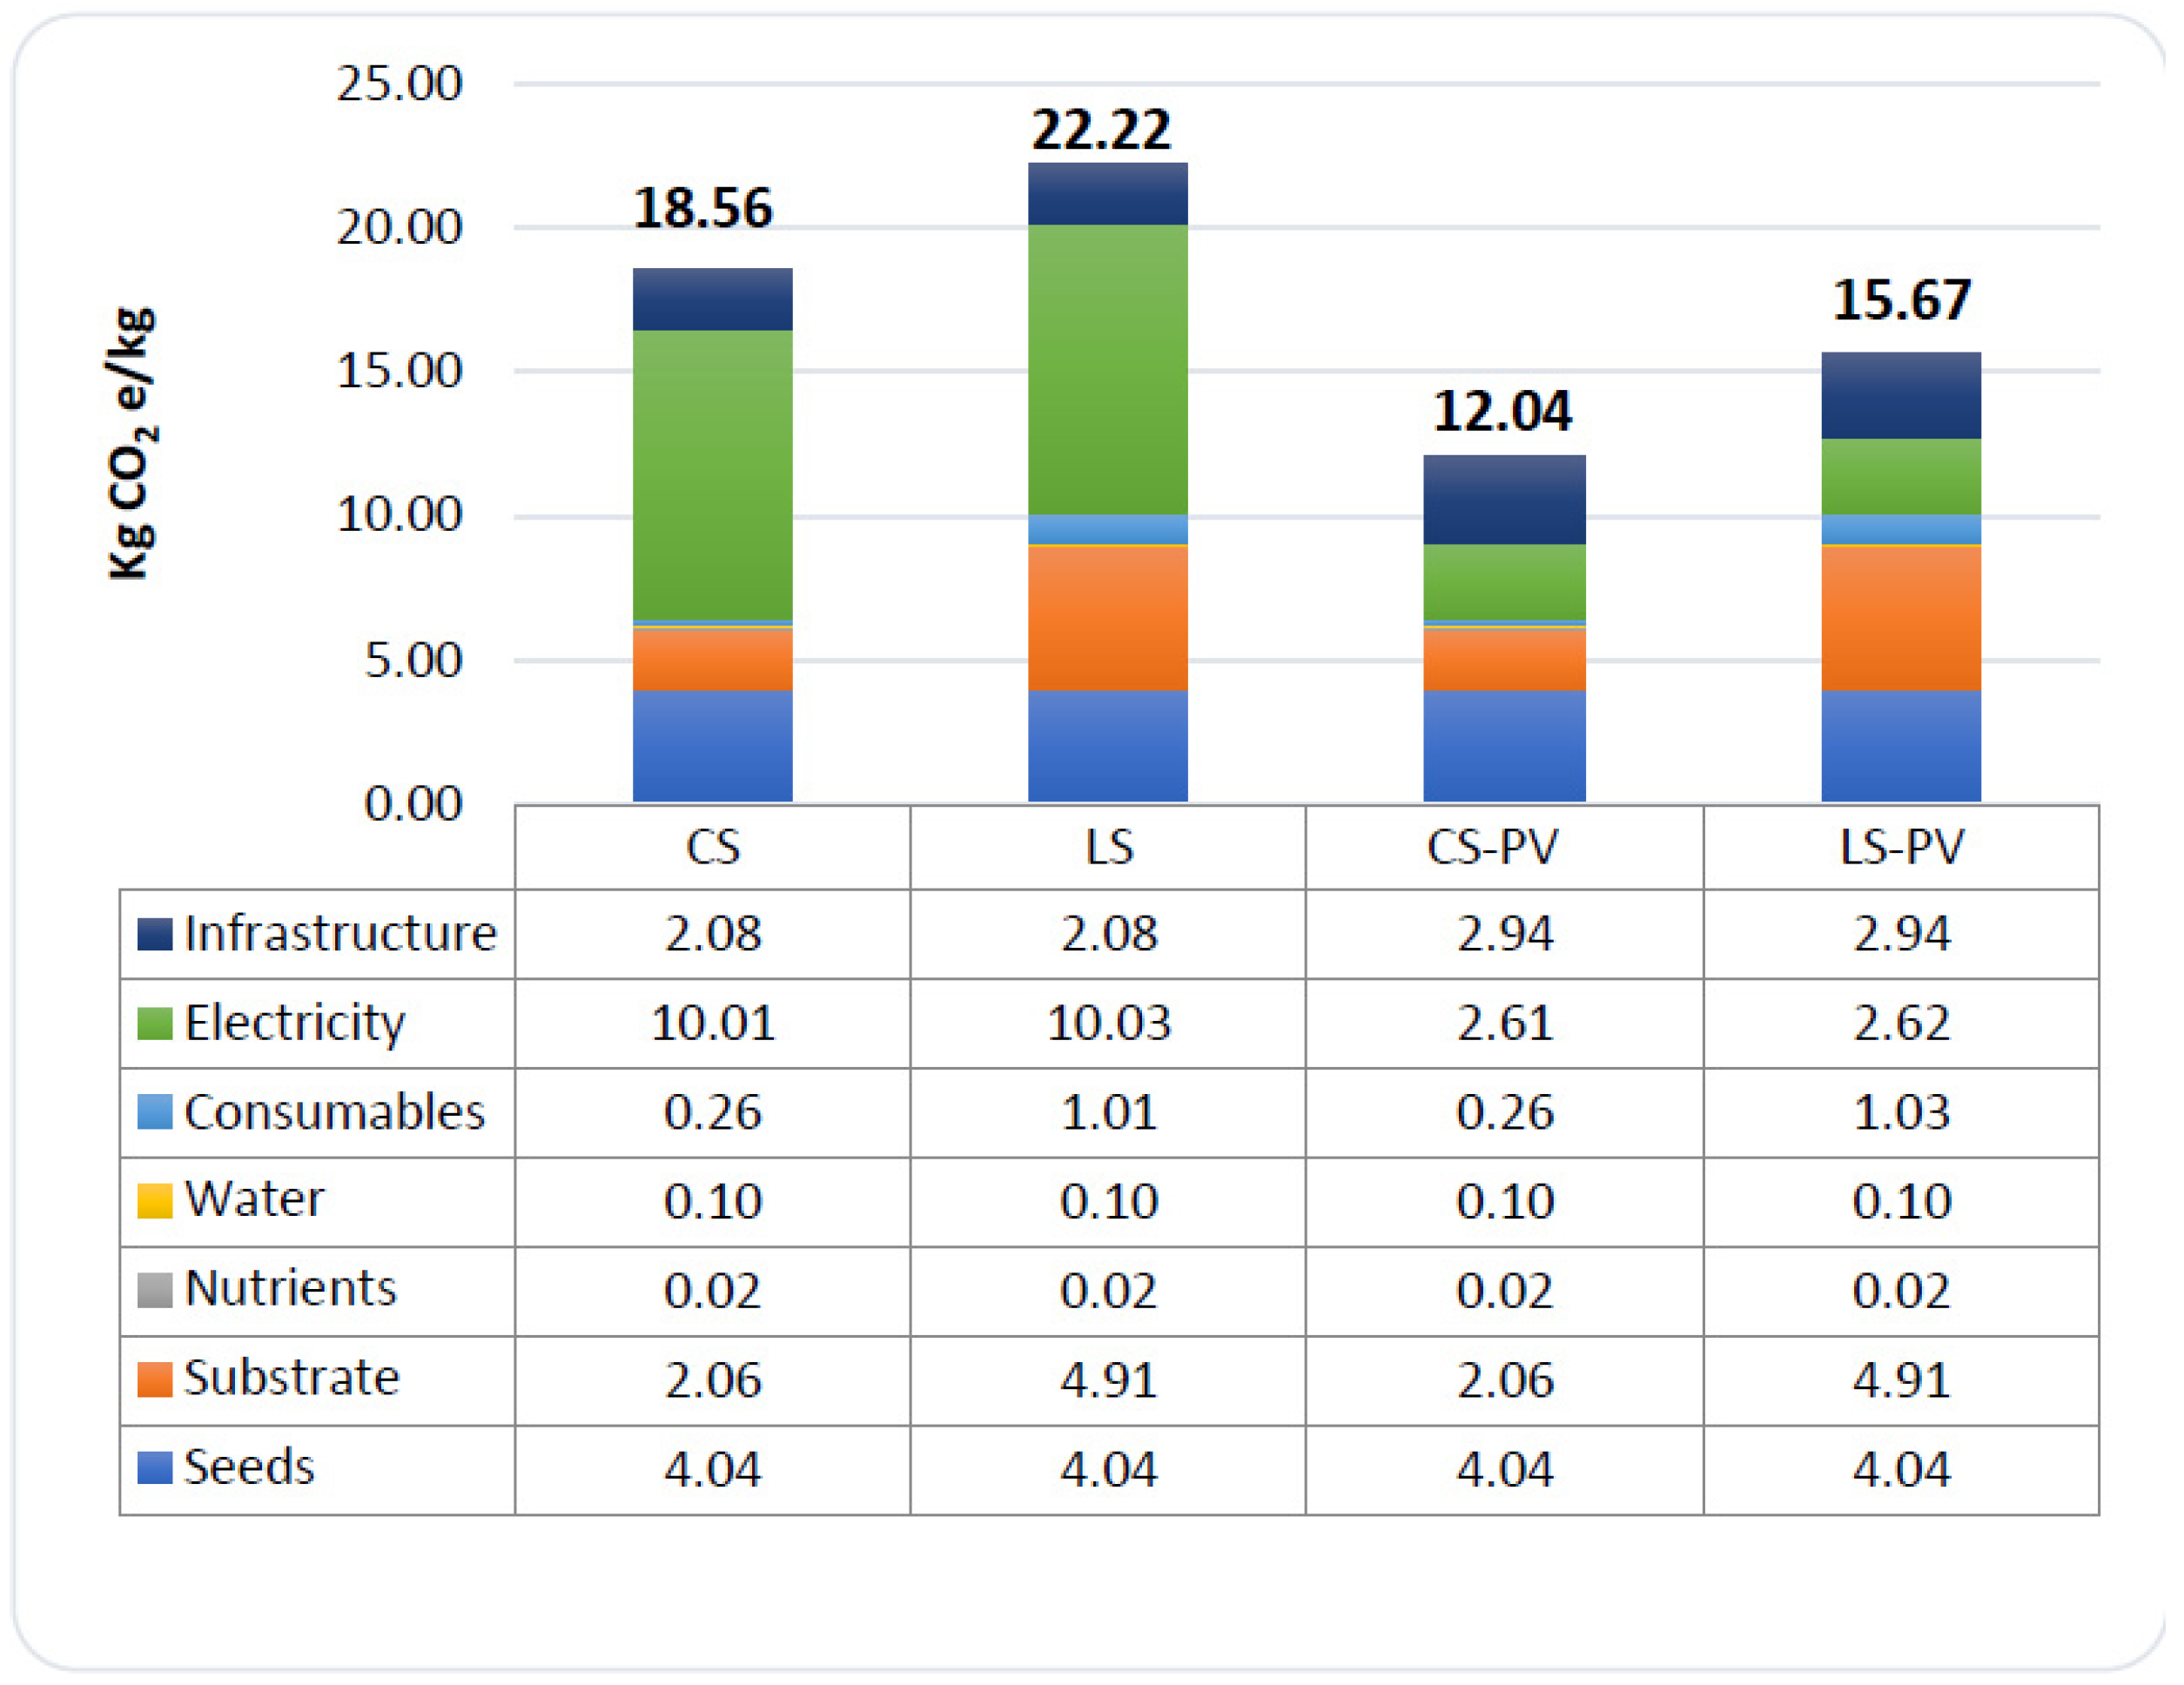
3.1. Global Warming Potential Results

3.1.1. Circular and Linear Supply Scenarios

Figure 2 shows the difference in the total emissions associated with both scenarios and their breakdown in terms of the major contributors. CS generated 18.6 kg CO2e/kg to produce 1 kg of fresh weight. In LS, emissions were 22.2 kg CO2e/kg as a result of higher emissions from consumables used and organic waste generated. Impacts from production and use of seeds (4 kg CO2e/kg), nutrients (0.02 kg CO2e/kg) and water (0.1 kg CO2e/kg), including impacts from wastewater treatment and water consumed in the process of harvest and cleaning, are the same in the two supply scenarios assessed.
Infrastructure represents the prospective IVF technology and therefore also has the same impact in both scenarios. The specific emissions from manufacturing the IVF are 2.07 kg CO2e/kg, due to the primary equipment such as LEDs, trays, climate chamber, IoT, trays and the installation process.
The highest impact in both scenarios was electricity production and use. In CS, it is responsible for 10.01 kg (54%) and LS for 10.03 kg CO2e/kg (45%). This result was expected in an IVF system, as high energy demand in urban farm operations is a known challenge [46,58,59,60]. In this study the primary consumption of electricity was from four inputs (climate system and equipment, LEDs and cleaning). The electricity for LED, with 4.39 kg CO2e/kg, was the highest individual contributor, while the climate control and equipment contributed with 5.60 kg CO2e/kg. The difference between scenarios of 0.01 kg CO2e/kg from electricity is due to the packaging process included in LS.
A major difference of 2.85 kg CO2e/kg due to production of substrate exists between the two scenarios. In LS the substrate is responsible for an emission of 4.91 kg CO2e/kg (22%), which in CS it is only 2.06 kg CO2e/kg (11%). The substrate has lower emissions in CS because the organic waste is treated to produce the co-product of compost and avoid emissions to produce new compost for use in the local market. In LS this material is disposed of as municipal waste; the organic waste is still produced and assumes the building has no access to compost treatment. Therefore, CS organic waste is reused onsite to replace campus compost sources and in LS this waste is disposed of in municipal waste collection. Inputs directly contributing to the organic waste production are the primary product consumables of nutrients 0.02 kg CO2e/kg, substrate 2.12 kg CO2e/kg and seeds 4.04 kg CO2e/kg. Seeds represent 22% in CS and 18% in LS of the total CO2e/kg. The volume of inputs contributing to organic waste were the same in both scenarios.
Emissions due to consumables are 1.02 kg in LS, and 0.27 kg CO2e/kg in CS. The difference of 0.75 CO2e/kg accounts for inputs added of single use plastics for packaging and transportation needs during delivery. Additional activities associated with preparation and cleaning contributed to the difference of consumables between both scenarios shown in Figure 2.

3.1.2. Renewable Energy Variation Results

Figure 3 illustrates the total emissions for both CS and LS, when the electricity source is replaced with 70% renewable electricity generated by a PV system. The scenarios with the incorporation of PV have different results in the classes of infrastructure and electricity as a result of including additional technology for infrastructure. The use of a PV system as an electricity source contributed to a 35.2% reduction of total emissions in CS and 29.48% in LS. The total impact in the CS-PV scenario was 12.04 kg CO2e/kg, while in LS-PV it was 15.67 kg CO2e/kg.
Emissions corresponding to electricity in the alternative renewable energy scenario, CS-PV, were 2.61 kg CO2e/kg and 2.62 kg CO2e/kg in the LS-PV. The replacement of electricity in the PV scenarios reduced the emissions from electricity by 7.40 kg CO2e/kg in relation to both original scenarios. Infrastructure added 0.86 kg CO2e/kg for the installation of the PV equipment. These reductions reveal the importance of other variables, as seeds and substrate become major contributors to total CO2e/kg impacts in this renewable energy use case, especially in the case of CS as the organic waste is composted.

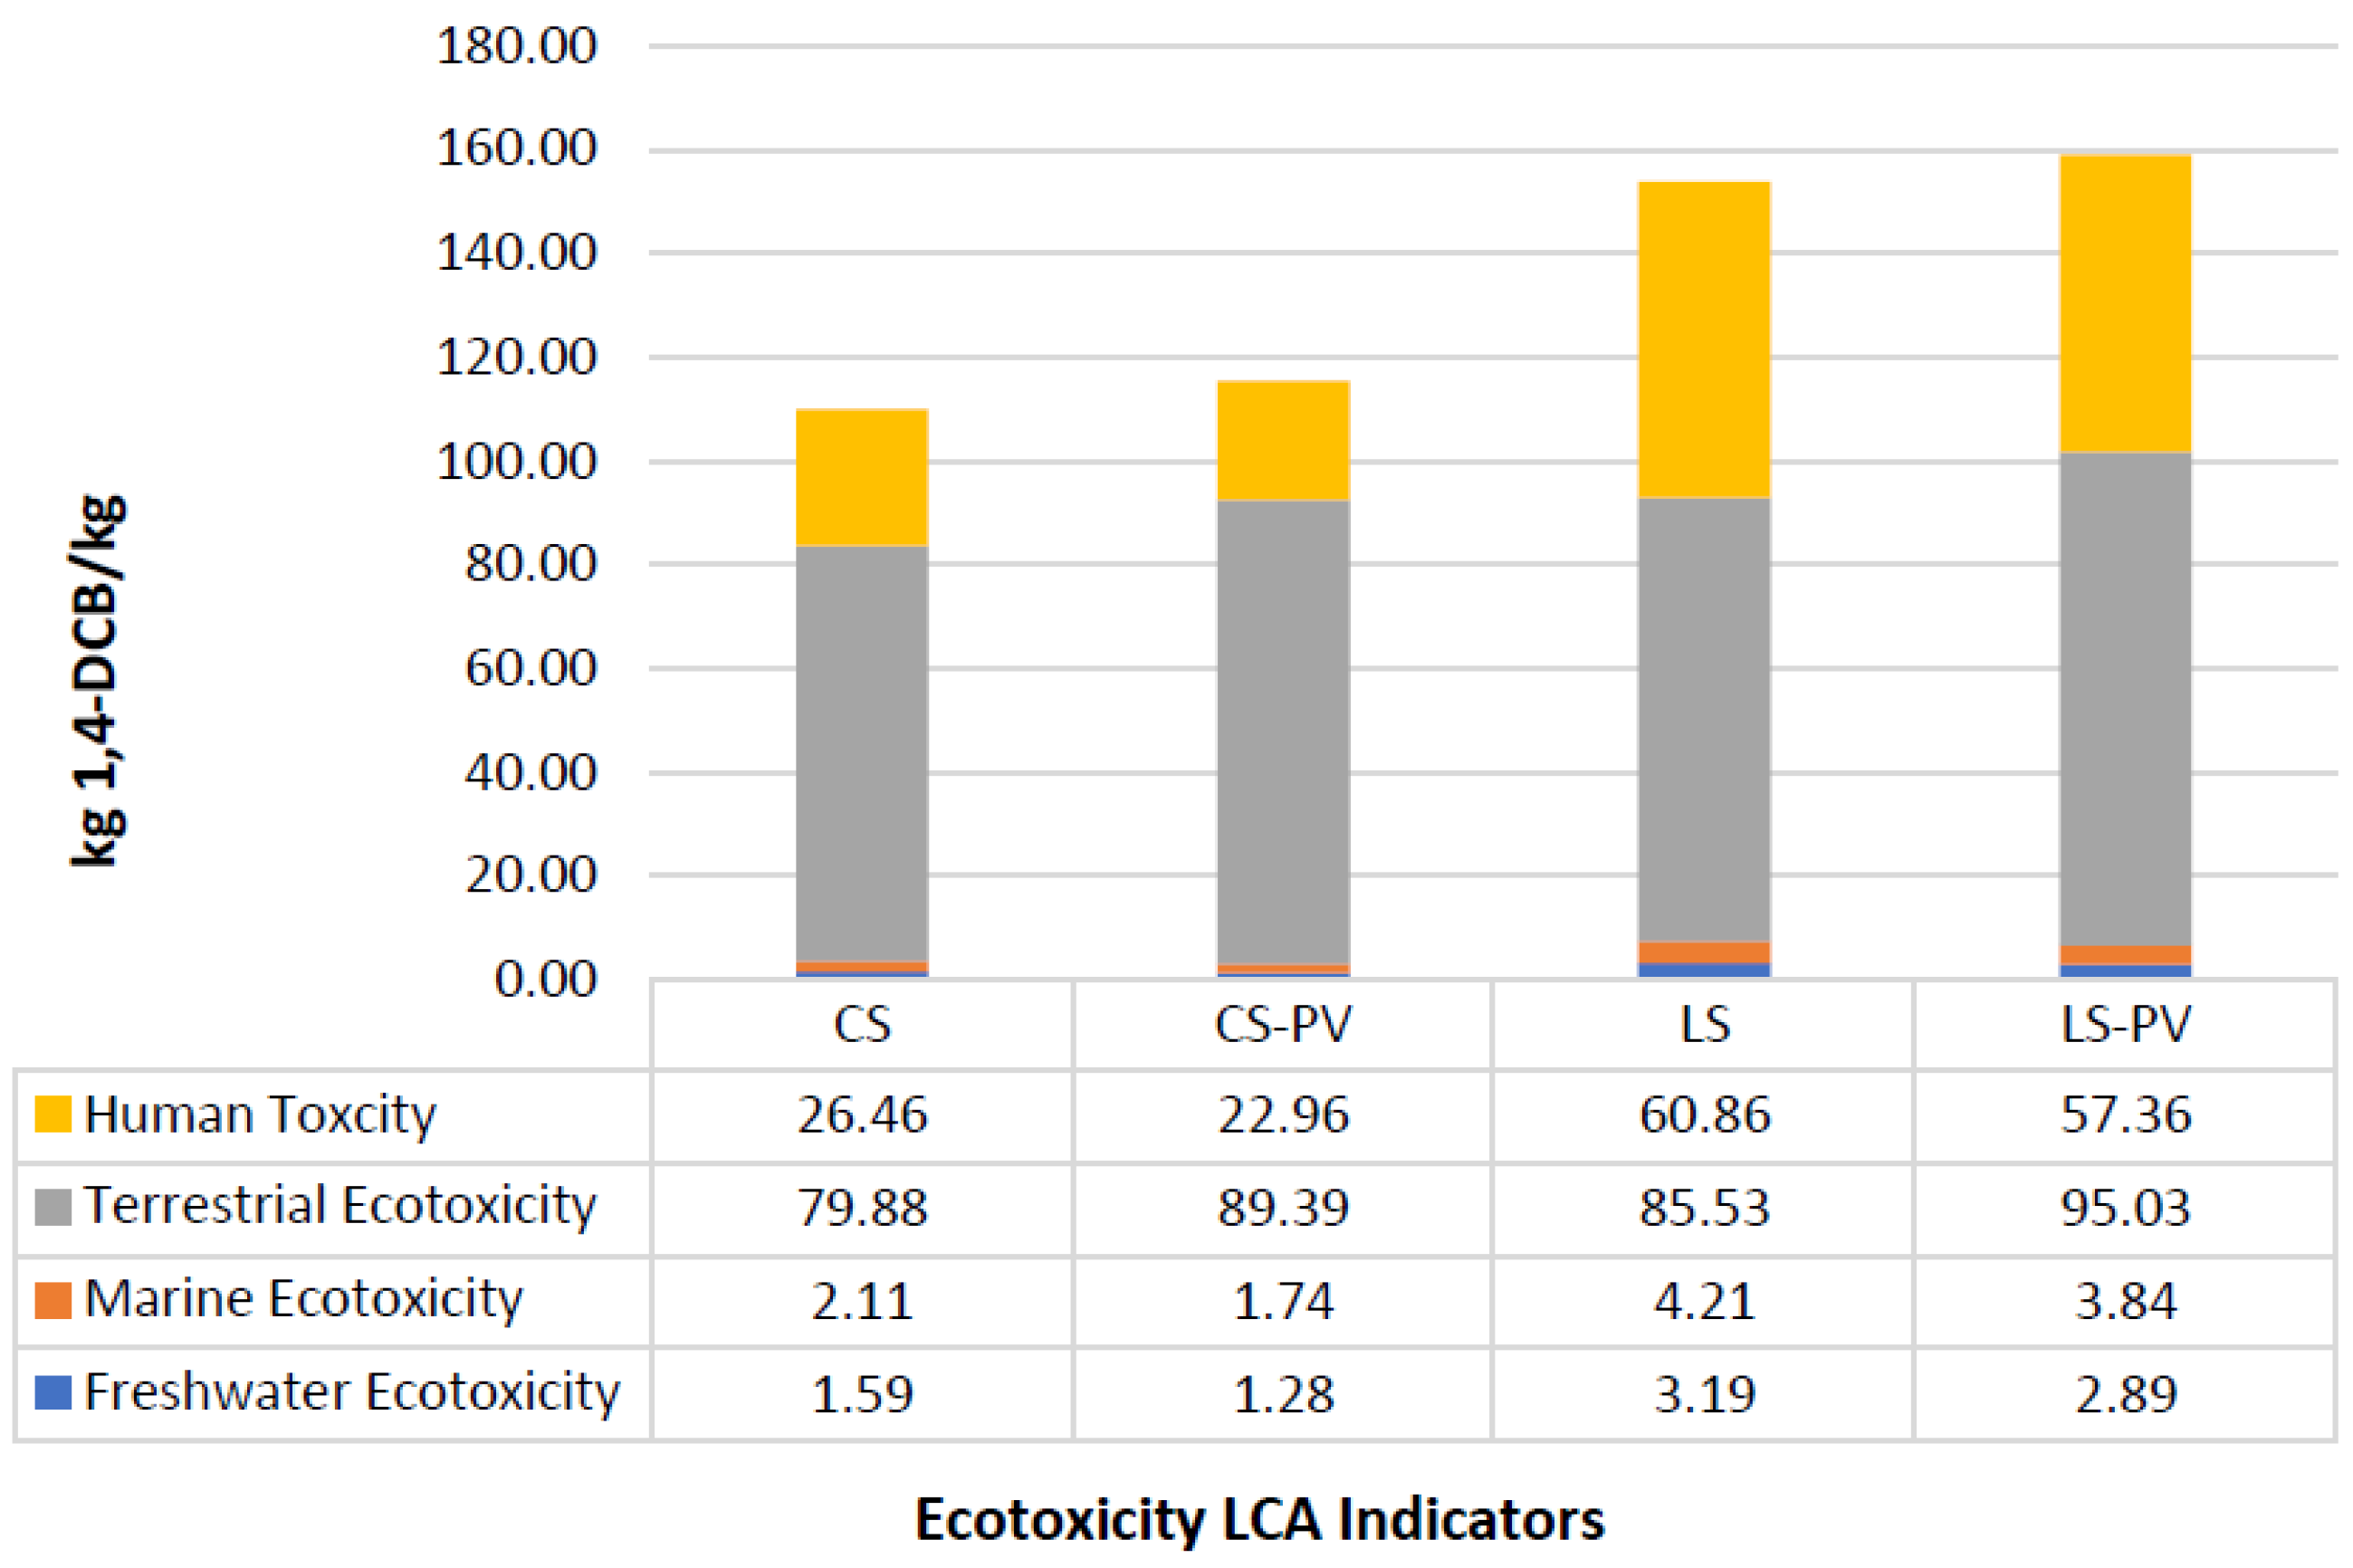
3.2. Ecotoxicity Results

Production of the functional unit contributed to increased weight of hazard materials in natural soils, freshwaters, oceans and air [57]. The results presented in Figure 4 demonstrate the ratio between scenario CS and LS results per kg of 1,4 dichlorobenzene equivalent (1,4-DCB/kg), which was used as an indicator of human and ecological toxicity. The indicators Freshwater Ecotoxicity (FE), Marine Ecotoxicity (ME), Terrestrial Ecotoxicity (TE) and Human Toxicity (HT) illustrate that LS has increased the percentage of impact across all indicators when directly compared with CS.
These four indicators show an increase in ecotoxicity of LS results over CS with a difference of approximately FE 101%, ME 100%, TE 7% and HT 130% kg 1,4-DCB/kg. The highest impacts can be observed for TE in the LS case with 85.53 kg 1,4-DCB/kg in the case of electricity consumption from the grid, and LS-PV with 95.03 kg 1,4-DCB/kg when 70% of grid electricity was replaced with PV electricity. The increase is due to the environmental impacts generated from producing and disposing of the additional infrastructure required for the PV system, such as the panels themselves. Of note is the limited change in TE impacts for CS compared with LS, a difference of only 5.65 kg 1,4-DCB/kg given the inclusion of plastics and the organic waste’s end of life in the study. When the PV scenarios results are considered, CS is reduced with the addition of PV across three indicators FE −24%, ME −21% and HT −15%, and increases TE 11% kg 1,4-DCB/kg. A similar trend is seen in LS with FE −24%, ME −21% and HT −15% kg 1,4-DCB/kg; and increases TE 11% kg 1,4-DCB/kg, this ratio of impact is almost equal to the differences between CS and LS scenarios. Replacing electricity in both scenarios required the addition of PV panels and equipment, leading to an increase in TE when renewable energy was used (Table S4).

4. Discussion

This study presented an assessment of the total environment impacts for fresh cut broccoli microgreens in IVF that, unlike prior studies, intended to pinpoint the contributions of building integration and circularity in food supply. We found that a circular on-campus food supply reduces GWP by 20% (from 18.6 to 22.2 kg CO2e/kg functional unit), TE by 7% and at least halves impact in FE, ME and HT. Considered as a ‘cradle to gate’ system boundary, we captured those impacts by including activities from seeding to delivery of the final product, including the production and installation of the prospective technology infrastructure. This study therefore shows a reduction of impacts associated with shortened supply chains, where the building-integrated IVF ‘farm gate’ is located with direct access to retail and compost treatment.
The main differences between the two scenarios of this study are the use of plastic packaging, the means and distances of transportation and organic waste management treatment. The conditions set in the CS scenario reduced approximately 3.6 kg CO2e/kg of broccoli microgreens compared to the LS scenario results, explained by the internal delivery in the university campus. These results demonstrate a main advantage of shortened supply chains in UA, where the reduction of the number of material inputs (single use plastic bags and cardboard boxes) can reduce the carbon footprint of microgreens [3,4]. Another contributor to the difference between scenarios is the valorization of organic waste in CS. The organic waste treatment is specific to the existence of demand for compost in the building in which the prospective technology is integrated, whereas LS creates waste for disposal by the municipality.
This study provides useful information to identify opportunities to improve urban environments through shortened supply chains that increase circularity [17,60]. A benefit of UA is the reduction of losses and impacts during the transport of the products, because of the proximity of the farm to the consumers [61]. In this study the packaging and delivery impact in the LS scenario is 0.786 kg CO2e/kg of broccoli microgreens. Other studies mention even higher impacts, with transport being the most impactful step in 7% of systems, considering the delivery and transportation of inputs in ground-based, open-air and soil-based systems [12]. Transportation distance applied in LS was only 10 km to a single location daily, representing a short supply chain that is not representative of international plant-based food distribution to major cities [1,8,9].
Considering the question of whether the study assesses the effects of building integration apart from the circularity aspects that it enables, in this study we do not have a scenario without some level of building integration and it is difficult to compare with literature where building integration was not used [13,30]. As we show in the next paragraphs, it was impossible to fairly compare our study with other technologies that are disconnected from the urban building operations because of fundamental differences between studies, namely the crop type, technology installed, assumptions made for infrastructure, processes and seeds. There is a generalized lack of data and access to studies involving equivalent LCA methods and materials. Few studies have been developed specifically for the assessment of microgreens in IVF technology [31,50,62], and the crops primarily researched were tomatoes and lettuce [63]. Our attempt to address the scope for comparisons in this Discussion was restricted to leafy greens categories that match the functional unit and similar IVF technology, but the level of integration was unknown.
Past studies on the GWP impact of urban farms reveal a wide range (between 0.02 and 26.5 kg CO2e/kg) of results for many leafy green products such as lettuce, pak choi, spinach and microgreen varieties [13,41,64,65]. The latter 26.5 kg CO2e/kg value was found for a controlled environment greenhouse with heating demand in winter, whereas the lower results represent a system without climate control and lighting [24]. Due to the urban location, combination of technologies, system boundary and lack of standardization for measurement of functional units in fresh or dry weight, it can be difficult to make meaningful comparisons [40].
The type of plant and growth cycle studied can also influence results; this is where the objectives of any urban farm are critical to informing these inputs. In the case of an economically driven urban farm, the priority is to sell product at the highest price and produce at the lowest costs. Increasing the kilograms of fresh weight grown for sale as food or for the bioactive properties drives the technology selection as not all plant species to achieve these goals [33,34,35]. Leafy green crops, such as lettuce, spinach, or arugula, are commonly studied in UA and can be assumed as suitable replacements for the same dietary service provided by broccoli microgreens for salads or sandwiches [24]. However, both CS and LS results in this study are higher when compared with an IVF designed as a total control factory in a building producing spinach with emissions of 6.4 kg CO2e per kg [65]. Although that analysis presents different assumptions for the operating impact with limited data inputs for infrastructures combination of technology, waste and seedling sources [27]. The similarity of technology hints that the difference may be the crop produced and its specific needs, however it is unclear as it could also be related to the location or sources of inputs. Therefore, the connection between technology installed and crops selected for production requires further research.
We also found that the technology, considered as infrastructure in the LCI, size of the controlled environment applied, LED lighting and growing system are critical for results. They should be carefully modelled, as they can have a very significant contribution for results and in this study the prospective technology was already installed. Different assumptions regarding the inclusion of infrastructure are also a cause for discrepancies in results that compromise any comparability. The manufacturing of the infrastructure in this study was responsible for up to 11.3% of the total emissions (2 kg CO2e/kg). The building-integrated IVF operates a 32 m2 growing area with 100% LED lighting in both CS and LS, which is equal to a 30 m2 modular unit studied in Boston, USA with 8.65 kg CO2e/kg of arugula [24]. In another study of environmental burdens due to change in red and blue LED lighting, multiple small 0.6 m2 growth chambers produced a range of 9.52 to 16.1 kg CO2e per kg of lettuce [66]. The quantitative similarities with the results obtained in this paper are due to the high contribution of electricity to total emissions. Even though both these examples were lower in CO2e per kg than 18.6 kg CO2e/kg for CS, it is unclear from the papers the role that infrastructure and material inputs have on results.
High electricity demand of IVF technology for operating the climate control and light for plant growth was expected [27,63,67]. Sourced Ecoinvent data for the local electricity network in this case include fossil fuels and contribute heavily to the impact of the IVF operations through LED lighting (4.4 kg CO2e/kg) and climate control (5.6 kg CO2e/kg). Representing the largest impact, between 45% (LS) an 54% (CS) of total CO2e/kg, electricity in past studies has accounted for up to 90% and others found a contribution of approximately 60% [65,66]. Options to reduce this through renewable energy available from grids and PV systems can lead to major reductions in GWP [12,68]. This study quantified a 20% reduction in total GWP as a result of replacing 70% of consumption with electricity from an on-campus PV system. Ecotoxicity indicators were lower for CS than for LS and for CS-PV than for LS-PV except for TE. TE impacts increased for both CS-PV and LS-PV scenarios, compared respectively to CS and LS, as a result of increased infrastructure for PV. Further exploration into the effects of renewable energy solutions on ecotoxicity, specifically TE, is required to better understand its negative effect on the environment.
Seeds are not widely discussed in UA-LCA and IVF studies as important, but this study has revealed new results. The assumption of using cauliflower (Brassica oleracea) seed production as a proxy to replicate food-grade seeds from the market resulted in seeds being the second highest impact in CS, just behind electricity. As the amount and type of seeds does not change between scenarios, the results were equal for all scenarios in our study—4.04 kg CO2e/kg, which is a significant contribution to the total. There is no straight ratio of one seed equals one functional unit because each kg of microgreens has 0.07 kg per kg of fresh weight. (Table S5) For other indoor UA systems, the life cycle emissions of producing one kg of lettuce are on average between 4.2 and 5.2 kg CO2e/kg [13], which is equal to the contribution of seeds alone in this study. This result is striking given that the volume of seeds is only 7% of the weight used as a functional unit, but it represents 22% of GWP in CS and 18% in LS. A potential reason for this result is the fact that the IVF produces only microgreens and not mature plants. The emissions of seed production are therefore diluted in a lower-than-potential amount of biomass harvested.
However, an important distinction in microgreen production is the volume of seeds used in each tray and crops species. Broccoli (Brassica oleracea var. raab) microgreens are popular in urban farming but there were no LCI data usable for seed production. This technology requires approximately 300 seeds per g produced or over 1200 seeds per tray grown. Similar studies have corresponded ‘grass seeds’ and used food-grade seeds as proxies for basil microgreens [69], while others use inputs collected from interviews and direct measurement [70]. Comparing these inputs creates confusion for evaluation of similar crops; a kg of lettuce seeds does not have the same volume of seeds as a kg of broccoli seeds, so the error of the approximations when selecting proxy LCI processes are asymmetrical. Consequently, studies’ results will vary simply due to methodological choice, and not because specific technologies and settings of installations are making a real difference. This study also had to resort to a proxy that, despite being similar as a plant type, could have introduced error in the results for seeds. This study clearly flags the issue of seed production as a potential hotspot for environmental impacts. Further studies are needed to address it fully and confirm its importance.
The impacts of substrate across the scenarios varied significantly (CS 2.1 and LS 4.9 kg CO2e/kg) directly due to the handling of organic waste and treatment to create compost by the IVF circular supply. Improvements in substrate types and pots, including reusable sources and recyclable materials, can in the future make important contributions for reducing their share of the impacts [41]. The application of IVF technology provides the opportunity for optimizing inputs such as substrates. To identify materials used and their future use for compost as a new substrate or biofuel materials [71], in this study coconut fiber (Table S7) was used and treated via natural composting processes [8]. A positive impact gained in CS came through the compost byproduct as a replacement for compost in the local market, namely the campus gardens.
The IVF system assumed a static production of 7.5 kg broccoli microgreens daily, where seeds will germinate in the tray for 7 days and spend 7 days of cultivation under 14 h of LED lights. Harvesting at this stage is approximately 2 weeks short of a normal growth cycle for lettuce and to some extent represents the seedlings grown to first leaves and roots for transplant in past studies [70]. The high cycle rate of each growing tray increases the volume of seeds, organic waste and cleaning on a weekly basis, which makes it nearly impossible to compare to the existing literature due to differences in technology and a crop of microgreens. Due to the prospective nature of this technology, it may be possible, once operating, to calibrate system variables and determine optimum conditions for LED [71], seed and substrate sourcing or other process inputs. This would require an optimum plant growth model to characterize the conditions of building-integrated IVF technology, which is suggested as a priority for future research.
For the life cycle assessment modeling, there were limitations in the materials and flows available in the databases (Ecoinvent and Agribalyse). Several inputs for the processes of infrastructure had to be created. Therefore, many estimations were made based on technical reports and existing papers, some taken from urban agriculture cases of outdoor vertical farms, rooftop gardens and urban farming cases. These changes generated a certain level of uncertainty in the results that is difficult to quantify, as LCI processes for the exact technological equipment are so far unknown.

5. Conclusions

This research set out to study the environmental performance of a building-integrated IVF technology that is not yet operating and study how circularity in food supply within the building where it will operate can help its environmental performance. We estimated that producing a kg of broccoli microgreens in a university campus building and selling the produce on campus generates 18.6 kg CO2e/kg. This number includes avoided emissions from waste generated on site and composted for reuse in the campus gardens. If the produce was transported and sold off site, emissions would increase by 20% and emissions of substances causing ecotoxicity to humans and ecosystems would approximately double across four out of five indicators. By adding a renewable source of electricity from a PV system also connected to the building on top of the circular supply, emissions would be reduced by 35%.
Broccoli microgreen production using building-integrated IVF technology with circular supply can therefore be an effective solution to reduce impacts in UA. Access to onsite compost treatment and retail food services brings opportunities to remove transportation for delivery and reduce waste generation both of organic materials and single-use plastics. Additionally, building integration may take advantage of access to green infrastructure and renewable energy. Further research is required to identify further environmental performance relationships in building-integrated IVF, such as optimization of growth conditions specific to microgreens, efficiencies in reduced LED exposure and thermal irradiance in location. We have also shown that the selection of seeds can make a significant impact on results. The limited examples of LCA in food-grade seed cultivation and production require further exploration.

Supplementary Materials

The following supporting information can be downloaded at: https://www.mdpi.com/article/10.3390/atmos13081317/s1, Table S1: Data for GWP.; Table S2: Data for Ecotoxicity; Figure S1: Graph for Ecotoxicity; Table S3: Indoor Vertical Farm Infrastructure; Table S4: Calculation of the number of 3kWp panels needed; Table S5: Process (All units per Function unit of 1 kg of Fresh Weight); Table S6: IVF Operating Processes; Table S7: Coconut fiber; Table S8: Equipment for Processes. Clothes (lifetime 1 year); Table S9: Plastic bags (×10); Table S10: Labels (×10).

Author Contributions

Conceptualization, M.G.P. and R.F.M.T.; methodology, M.G.P. and R.F.M.T.; literature review, analytics and data curation, M.G.P., J.P.C.T. and F.D.; writing—original draft preparation, M.G.P. and J.P.C.T.; writing—review and editing, all authors; supervision, T.D. and R.F.M.T. All authors have read and agreed to the published version of the manuscript.

Funding

This research was funded by Fundação Calouste Gulbenkian under decree of law n.º 40690, through Project Sustainability Conta n.º 326157 (Bios Pilot). This work was funded by Portuguese National Funding through FCT–Fundação para a Ciência e Tecnologia, I. P., through project LA/P/0083/2020 (LA LARSyS–MARETEC) and CEECIND/00365/2018 (R. Teixeira).

Institutional Review Board Statement

Not applicable.

Informed Consent Statement

Not applicable.

Data Availability Statement

Not applicable.

Conflicts of Interest

The authors declare no conflict of interest. The funders had no role in the design of the study; in the collection, analyses, or interpretation of data; in the writing of the manuscript; or in the decision to publish the results.

References

  1. Li, M.; Jia, N.; Lenzen, M.; Malik, A.; Wei, L.; Jin, Y.; Raubenheimer, D. Global Food-Miles Account for Nearly 20% of Total Food-Systems Emissions. Nat. Food 2022, 3, 445–453. [Google Scholar] [CrossRef]
  2. Bherwani, H.; Nair, M.; Niwalkar, A.; Balachandran, D.; Kumar, R. Application of Circular Economy Framework for Reducing the Impacts of Climate Change: A Case Study from India on the Evaluation of Carbon and Materials Footprint Nexus. Energy Nexus 2022, 5, 100047. [Google Scholar] [CrossRef]
  3. Dimitri, C.; Oberholtzer, L.; Pressman, A. Urban Agriculture: Connecting Producers with Consumers. Br. Food J. 2016, 118, 603–617. [Google Scholar] [CrossRef]
  4. Martellozzo, F.; Landry, J.-S.; Plouffe, D.; Seufert, V.; Rowhani, P.; Ramankutty, N. Urban Agriculture: A Global Analysis of the Space Constraint to Meet Urban Vegetable Demand. Environ. Res. Lett. 2014, 9, 640125. [Google Scholar] [CrossRef]
  5. Goldstein, B.; Hauschild, M.; Fernández, J.; Birkved, M. Urban versus Conventional Agriculture, Taxonomy of Resource Profiles: A Review. Agron. Sustain. Dev. 2016, 36, 1–19. [Google Scholar] [CrossRef]
  6. Avgoustaki, D.D.; Xydis, G. Plant Factories in the Water-Food-Energy Nexus Era: A Systematic Bibliographical Review. Food Secur. 2020, 12, 253–268. [Google Scholar] [CrossRef]
  7. Food and Agriculture Organisation of the United Nations. Food, Agriculture and Cities. Challenges of Food and Nutrition Security, Agriculture and Ecosystem Management in an Urbanizing World; Food and Agriculture Organisation of the United Nations: Rome, Italy, 2011. [Google Scholar]
  8. O’Sullivan, C.A.; Bonnett, G.D.; McIntyre, C.L.; Hochman, Z.; Wasson, A.P. Strategies to Improve the Productivity, Product Diversity and Profitability of Urban Agriculture. Agric. Syst. 2019, 174, 133–144. [Google Scholar] [CrossRef]
  9. Arunrat, N.; Pumijumnong, N.; Sereenonchai, S.; Chareonwong, U.; Wang, C. Comparison of GHG Emissions and Farmers’ Profit of Large-Scale and Individual Farming in Rice Production across Four Regions of Thailand. J. Clean. Prod. 2021, 278, 123945. [Google Scholar] [CrossRef]
  10. Khan, R.; Aziz, Z.; Ahmed, V. Building Integrated Agriculture Information Modelling (BIAIM): An Integrated Approach towards Urban Agriculture. Sustain. Cities Soc. 2017, 43, 343–363. [Google Scholar] [CrossRef]
  11. Bohm, M. Urban Agriculture in and on Buildings in North America: The Unfulfilled Potential to Benefit Marginalized Communities. Built Environ. 2017, 43, 343–363. [Google Scholar] [CrossRef]
  12. Parada, F.; Gabarrell, X.; Rufí-Salís, M.; Arcas-Pilz, V.; Muñoz, P.; Villalba, G. Optimizing Irrigation in Urban Agriculture for Tomato Crops in Rooftop Greenhouses. Sci. Total Environ. 2021, 794, 148689. [Google Scholar] [CrossRef] [PubMed]
  13. Dorr, E.; Goldstein, B.; Horvath, A.; Aubry, C.; Gabrielle, B. Environmental Impacts and Resource Use of Urban Agriculture: A Systematic Review and Meta-Analysis. Environ. Res. Lett. 2021, 16, 93002. [Google Scholar] [CrossRef]
  14. Sanyé-Mengual, E.; Martinez-Blanco, J.; Finkbeiner, M.; Cerdà, M.; Camargo, M.; Ometto, A.R.; Velásquez, L.S.; Villada, G.; Niza, S.; Pina, A.; et al. Urban Horticulture in Retail Parks: Environmental Assessment of the Potential Implementation of Rooftop Greenhouses in European and South American Cities. J. Clean. Prod. 2018, 172, 3081–3091. [Google Scholar] [CrossRef]
  15. Neilson, C.; Rickards, L. The Relational Character of Urban Agriculture: Competing Perspectives on Land, Food, People, Agriculture and the City. Geogr. J. 2017, 183, 295–306. [Google Scholar] [CrossRef]
  16. Weidner, T.; Yang, A.; Hamm, M.W. Consolidating the Current Knowledge on Urban Agriculture in Productive Urban Food Systems: Learnings, Gaps and Outlook. J. Clean. Prod. 2019, 209, 1637–1655. [Google Scholar] [CrossRef]
  17. Mohareb, E.; Heller, M.; Novak, P.; Goldstein, B.; Fonoll, X.; Raskin, L. Considerations for Reducing Food System Energy Demand While Scaling up Urban Agriculture. Environ. Res. Lett. 2017, 12, 125004. [Google Scholar] [CrossRef]
  18. Baratsas, S.G.; Pistikopoulos, E.N.; Avraamidou, S. A Systems Engineering Framework for the Optimization of Food Supply Chains under Circular Economy Considerations. Sci. Total Environ. 2021, 794, 148726. [Google Scholar] [CrossRef]
  19. Montero, J.I.; Baeza, E.; Munoz, P.; Sanyé-Mengual, E.; Stanghellini, C. Technology for Rooftop Greenhouses. In Urban Agriculture: Rooftop Urban Agriculture; Orsini, F., Dubbeling, M., De Zeeuw, H., Gianquinto, G., Eds.; Springer International Publishing: Berlin/Heidelberg, Germany, 2017; pp. 83–101. [Google Scholar]
  20. Poulsen, M.N. Cultivating Citizenship, Equity, and Social Inclusion? Putting Civic Agriculture into Practice through Urban Farming. Agric. Hum. Values 2017, 34, 135–148. [Google Scholar] [CrossRef]
  21. Specht, K.; Weith, T.; Swoboda, K.; Siebert, R. Socially Acceptable Urban Agriculture Businesses. Agron. Sustain. Dev. 2016, 36, 17. [Google Scholar] [CrossRef]
  22. Dieleman, H. Urban Agriculture in Mexico City; Balancing between Ecological, Economic, Social and Symbolic Value. J. Clean. Prod. 2017, 163, 156–163. [Google Scholar] [CrossRef]
  23. Walraven, B.C. Aquaponics: Economics and Social Potential for Sustainable Food Production. In Unpublished Manuscript, Honors Report; James Madison University: Harrisonburg, VA, USA, 2014. [Google Scholar]
  24. Goldstein, B.; Hauschild, M.; Fernández, J.; Birkved, M. Testing the Environmental Performance of Urban Agriculture as a Food Supply in Northern Climates. J. Clean. Prod. 2016, 135, 984–994. [Google Scholar] [CrossRef]
  25. Parkes, M.G.; Azevedo, D.L.; Domingos, T.; Teixeira, R.F.M. Narratives and Benefits of Agricultural Technology in Urban Buildings: A Review. Atmosphere 2022, 13, 1250. [Google Scholar] [CrossRef]
  26. Marvin, S.; Rutherford, J. Controlled Environments: An Urban Research Agenda on Microclimatic Enclosure. Urban Stud. 2018, 55, 1143–1162. [Google Scholar] [CrossRef]
  27. Shamshiri, R.R.; Kalantari, F.; Ting, K.C.; Thorp, K.R.; Hameed, I.A.; Weltzien, C.; Ahmad, D.; Shad, Z. Advances in Greenhouse Automation and Controlled Environment Agriculture: A Transition to Plant Factories and Urban Agriculture. Int. J. Agric. Biol. Eng. 2018, 11, 1–22. [Google Scholar] [CrossRef]
  28. Kozai, T.; Kazuhiro, F.; Runkle, E.S. Integrated Urban Controlled Environment Agriculture Systems; Kozai, T., Kazuhiro, F., Runkle, E.S., Eds.; Springer: Singapore, 2016. [Google Scholar]
  29. Sparks, R.E.; Merton, R.; Iii, S. Design and Testing of a Modified Hydroponic Shipping Container System for Urban Food Production. Int. J. Appl. Agric. Sci. 2018, 4, 93–102. [Google Scholar]
  30. Engler, N.; Krarti, M. Review of Energy Efficiency in Controlled Environment Agriculture. Renew. Sustain. Energy Rev. 2021, 141, 110786. [Google Scholar] [CrossRef]
  31. Canet-Martí, A.; Pineda-Martos, R.; Junge, R.; Bohn, K.; Paço, T.A.; Delgado, C.; Alenčikienė, G.; Skar, S.L.G.; Baganz, G.F.M. Nature-Based Solutions for Agriculture in Circular Cities: Challenges, Gaps, and Opportunities. Water 2021, 13, 2565. [Google Scholar] [CrossRef]
  32. Bulgari, R.; Baldi, A.; Ferrante, A.; Lenzi, A. Yield and Quality of Basil, Swiss Chard, and Rocket Microgreens Grown in a Hydroponic System. N. Z. J. Crop Hortic. Sci. 2017, 45, 119–129. [Google Scholar] [CrossRef]
  33. Wong, C.E.; Teo, Z.W.N.; Shen, L.; Yu, H. Seeing the Lights for Leafy Greens in Indoor Vertical Farming. Trends Food Sci. Technol. 2020, 106, 48–63. [Google Scholar] [CrossRef]
  34. Wimmerova, L.; Keken, Z.; Solcova, O.; Bartos, L.; Spacilova, M. A Comparative LCA of Aeroponic, Hydroponic, and Soil Cultivations of Bioactive Substance Producing Plants. Sustainability 2022, 14, 2421. [Google Scholar] [CrossRef]
  35. Dorr, E.; Sanyé-Mengual, E.; Gabrielle, B.; Grard, B.J.P.; Aubry, C. Proper Selection of Substrates and Crops Enhances the Sustainability of Paris Rooftop Garden. Agron. Sustain. Dev. 2017, 37, 51. [Google Scholar] [CrossRef]
  36. Surendran, U.; Chandran, C.; Joseph, E.J. Hydroponic Cultivation of Mentha Spicata and Comparison of Biochemical and Antioxidant Activities with Soil-Grown Plants. Acta Physiol. Plant. 2017, 39, 26. [Google Scholar] [CrossRef]
  37. Orsini, F.; Dubbeling, M.; De Zeeuw, H.; Gianquinto, G. Urban Agriculture: Rooftop Urban Agriculture, 1st ed.; Orsini, F., Dubbeling, M., De Zeeuw, H., Gianquinto, G., Eds.; Springer International Publishing: Berlin/Heidelberg, Germany, 2017. [Google Scholar]
  38. Benis, K.; Reinhart, C.; Ferrão, P. Building-Integrated Agriculture (BIA) In Urban Contexts: Testing A Simulation-Based Decision Support Workflow. In Proceedings of the 15th IBPSA, Building Simulation, San Francisco, CA, USA, 7–9 August 2017; pp. 1798–1807. [Google Scholar]
  39. Goodman, W.; Minner, J. Will the Urban Agricultural Revolution Be Vertical and Soilless? A Case Study of Controlled Environment Agriculture in New York City. Land Use Policy 2019, 83, 160–173. [Google Scholar] [CrossRef]
  40. Al-Kodmany, K. The Vertical Farm: A Review of Developments and Implications for the Vertical City. Buildings 2018, 8, 24. [Google Scholar] [CrossRef]
  41. Shen, Y.; Song, S.; Thian, B.W.Y.; Fong, S.L.; Ee, A.W.L.; Arora, S.; Ghosh, S.; Li, S.F.Y.; Tan, H.T.W.; Dai, Y.; et al. Impacts of Biochar Concentration on the Growth Performance of a Leafy Vegetable in a Tropical City and Its Global Warming Potential. J. Clean. Prod. 2020, 264, 121678. [Google Scholar] [CrossRef]
  42. Martin, M.; Molin, E. Environmental Assessment of an Urban Vertical Hydroponic Farming System in Sweden. Sustainability 2019, 11, 4124. [Google Scholar] [CrossRef]
  43. Kikuchi, Y.; Kanematsu, Y.; Yoshikawa, N.; Okubo, T.; Takagaki, M. Environmental and Resource Use Analysis of Plant Factories with Energy Technology Options: A Case Study in Japan. J. Clean. Prod. 2018, 186, 703–717. [Google Scholar] [CrossRef]
  44. Cuce, E.; Harjunowibowo, D.; Cuce, P.M. Renewable and Sustainable Energy Saving Strategies for Greenhouse Systems: A Comprehensive Review. Renew. Sustain. Energy Rev. 2016, 64, 34–59. [Google Scholar] [CrossRef]
  45. Iddio, E.; Wang, L.; Thomas, Y.; McMorrow, G.; Denzer, A. Energy Efficient Operation and Modeling for Greenhouses: A Literature Review. Renew. Sustain. Energy Rev. 2020, 117, 109480. [Google Scholar] [CrossRef]
  46. Ying, J.; Zhang, X.; Zhang, Y.; Bilan, S. Green Infrastructure: Systematic Literature Review. Econ. Res. Istraz. 2021, 35, 343–366. [Google Scholar] [CrossRef]
  47. Sharma, S.; Shree, B.; Sharma, D.; Kumar, S.; Kumar, V.; Sharma, R.; Saini, R. Vegetable Microgreens: The Gleam of next Generation Super Foods, Their Genetic Enhancement, Health Benefits and Processing Approaches. Food Res. Int. 2022, 155, 111038. [Google Scholar] [CrossRef]
  48. Song, S.; Hou, Y.; Lim, R.B.H.; Gaw, L.Y.F.; Richards, D.R.; Tan, H.T.W. Comparison of Vegetable Production, Resource-Use Efficiency and Environmental Performance of High-Technology and Conventional Farming Systems for Urban Agriculture in the Tropical City of Singapore. Sci. Total Environ. 2022, 807, 150621. [Google Scholar] [CrossRef] [PubMed]
  49. Martin, M.; Weidner, T.; Gullström, C. Estimating the Potential of Building Integration and Regional Synergies to Improve the Environmental Performance of Urban Vertical Farming. Front. Sustain. Food Syst. 2022, 6, 49304. [Google Scholar] [CrossRef]
  50. Misra, G.; Gibson, K.E. Characterization of Microgreen Growing Operations and Associated Food Safety Practices. Food Prot. Trends 2021, 41, 56–69. [Google Scholar] [CrossRef]
  51. Benis, K.; Ferrao, P. Potential Mitigation of the Environmental Impacts of Food Systems through Urban and Peri-Urban Agriculture (UPA)–A Life Cycle Assessment Approach. J. Clean. Prod. 2017, 140, 784–795. [Google Scholar] [CrossRef]
  52. European Commission. Use of Common Methods to Measure and Communicate the Life Cycle Environmental Performance of Products and Organisations. Off. J. Eur. Union 2013, 124, 210. [Google Scholar]
  53. Litskas, V.; Mandoulaki, A.; Vogiatzakis, I.N.; Tzortzakis, N.; Stavrinides, M. Sustainable Viticulture: First Determination of the Environmental Footprint of Grapes. Sustainability 2020, 12, 8812. [Google Scholar] [CrossRef]
  54. Sanyé-Mengual, E.; Oliver-Solà, J.; Montero, J.I.; Rieradevall, J. An Environmental and Economic Life Cycle Assessment of Rooftop Greenhouse (RTG) Implementation in Barcelona, Spain. Assessing New Forms of Urban Agriculture from the Greenhouse Structure to the Final Product Level. Int. J. Life Cycle Assess. 2015, 20, 350–366. [Google Scholar] [CrossRef]
  55. European Commission. Photovoltais Geographical Information System. Available online: https://re.jrc.ec.europa.eu/pvg_tools/en/ (accessed on 1 July 2022).
  56. Huijbregts, M.A.J.; Steinmann, Z.J.N.; Elshout, P.M.F.; Stam, G.; Verones, F.; Vieira, M.; Zijp, M.; Hollander, A.; van Zelm, R. ReCiPe2016: A Harmonised Life Cycle Impact Assessment Method at Midpoint and Endpoint Level. Int. J. Life Cycle Assess. 2017, 22, 138–147. [Google Scholar] [CrossRef]
  57. Van Zelm, R.; Huijbregts, M.A.J.; Van De Meent, D. USES-LCA 2.0-a Global Nested Multi-Media Fate, Exposure, and Effects Model. Int. J. Life Cycle Assess. 2009, 14, 282–284. [Google Scholar] [CrossRef]
  58. Molin, E.; Martin, M. Assessing the Energy and Environmental Performance of Vertical Hydroponic Farming; Swedish Environmental Research Institute: Stockholm, Sweden, 2018. [Google Scholar]
  59. Geneletti, D.; Zardo, L. Ecosystem-Based Adaptation in Cities: An Analysis of European Urban Climate Adaptation Plans. Land Use Policy 2016, 50, 38–47. [Google Scholar] [CrossRef]
  60. Romeo, D.; Vea, E.B.; Thomsen, M. Environmental Impacts of Urban Hydroponics in Europe: A Case Study in Lyon. In Procedia CIRP; Elsevier: Amsterdam, The Netherlands, 2018; Volume 69, pp. 540–545. [Google Scholar]
  61. Kozai, T.; Niu, G.; Takagaki, M. Plant Factory: An Indoor Vertical Farming System for Efficient Quality Food Production; Kozai, T., Niu, G., Takagaki, M., Eds.; Elsevier: Amsterdam, The Netherlands, 2016. [Google Scholar]
  62. Lubna, F.A.; Lewus, D.C.; Shelford, T.J.; Both, A.-J. What You May Not Realize about Vertical Farming. Horticulturae 2022, 8, 322. [Google Scholar] [CrossRef]
  63. Arcas-Pilz, V.; Rufí-Salís, M.; Parada, F.; Gabarrell, X.; Villalba, G. Assessing the Environmental Behavior of Alternative Fertigation Methods in Soilless Systems: The Case of Phaseolus Vulgaris with Struvite and Rhizobia Inoculation. Sci. Total Environ. 2021, 770, 144744. [Google Scholar] [CrossRef] [PubMed]
  64. Pennisi, G.; Sanyé-Mengual, E.; Orsini, F.; Crepaldi, A.; Nicola, S.; Ochoa, J.; Fernandez, J.A.; Gianquinto, G. Modelling Environmental Burdens of Indoor-Grown Vegetables and Herbs as Affected by Red and Blue LED Lighting. Sustainability 2019, 11, 4063. [Google Scholar] [CrossRef]
  65. Al-Chalabi, M. Vertical Farming: Skyscraper Sustainability? Sustain. Cities Soc. 2015, 18, 74–77. [Google Scholar] [CrossRef]
  66. Pennisi, G.; Blasioli, S.; Cellini, A.; Maia, L.; Crepaldi, A.; Braschi, I.; Spinelli, F.; Nicola, S.; Fernandez, J.A.; Stanghellini, C.; et al. Unraveling the Role of Red:Blue LED Lights on Resource Use Efficiency and Nutritional Properties of Indoor Grown Sweet Basil. Front. Plant Sci. 2019, 10, 305. [Google Scholar] [CrossRef]
  67. Ares, G.; Ha, B.; Jaeger, S.R. Consumer Attitudes to Vertical Farming (Indoor Plant Factory with Artificial Lighting) in China, Singapore, UK, and USA: A Multi-Method Study. Food Res. Int. 2021, 150, 110811. [Google Scholar] [CrossRef]
  68. Martin, M.; Poulikidou, S.; Molin, E. Exploring the Environmental Performance of Urban Symbiosis for Vertical Hydroponic Farming. Sustainability 2019, 11, 6724. [Google Scholar] [CrossRef]
  69. Ilari, A.; Duca, D. Energy and Environmental Sustainability of Nursery Step Finalized to ‘‘Fresh Cut’’ Salad Production by Means of LCA. Int. J. Life Cycle Assess. 2018, 23, 800–810. [Google Scholar] [CrossRef]
  70. Dorr, E.; Koegler, M.; Gabrielle, B.; Aubry, C. Life Cycle Assessment of a Circular, Urban Mushroom Farm. J. Clean. Prod. 2021, 288, 125668. [Google Scholar] [CrossRef]
  71. Avgoustaki, D.D. Optimization of Photoperiod and Quality Assessment of Basil Plants Grown in a Small-Scale Indoor Cultivation System for Reduction of Energy Demand. Energies 2019, 12, 3980. [Google Scholar] [CrossRef]
Figure 1. System boundary for the LCA study of prospective IVF technology and processes (Blue) to service through circular supply on campus (Green) for comparison with linear supply (Orange) delivering to offsite retail food businesses.
Atmosphere 13 01317 g001
Figure 2. Global Warming Potential results of the LCA model of the building-integrated IVF technology for Circular Supply (CS) and Linear Supply (LS) scenarios. Presented in carbon emissions CO2 e/kg per kg of fresh weight broccoli microgreens for material inputs.
Atmosphere 13 01317 g002
Figure 3. Photovoltaic system (PV) variation of the GWP results of for the building-integrated IVF technology for Circular Supply (CS) and Linear Supply (LS); add the inclusion of PV to infrastructure and PV replacing 70% electricity. Presented are results for global warming potential in carbon emissions (CO2e) per kg of fresh weight broccoli microgreens for material inputs.
Atmosphere 13 01317 g003
Figure 4. Ecotoxicity indicator results per kg of fresh weight produced by the building-integrated IVF technology for Circular Supply (CS) and Linear Supply (LS) in relationship to each other. Presented in Global Warming (CO2e), Freshwater Ecotoxicity, Marine Ecotoxicity, Terrestrial Ecotoxicity and Human Toxicity (kg 1,4-DCB/kg) (Table S2 and Figure S1).
Atmosphere 13 01317 g004
Table 1. LCI Infrastructure of the building-integrated IVF technology, grouped by equipment types of Indoor Vertical Farm (IVF), hydroponic system, work area, Internet of Things (IoT) and Photovoltaic System (PV), the latter applicable to the renewable energy scenarios only (More detailed in Table S3).
Technology Infrastructure
EquipmentProcessInputAmountUnit
Indoor Vertical Farm (IVF)Climate ChamberPolystyrene slab and Aluminium580.0kg
Cladding, crossbar-pole, aluminium150.7m2
Floor CoveringEpoxy resin insulator, SiO2123.0kg
Tap Water
TraysPVC, Bulk, polymerized168.0kg
Extrusion of Plastic Sheets
RacksSteel, low-alloyed280.0kg
PipesPVC, Bulk, polymerized plastic Pipes31.8kg
ClampsSteel, chromium steel 18/83.6kg
ValvesBrass, Tetrafluoroethylene 1.2kg
CablesCable, three-conductor cable46.1m
Light Emitting Diode (LED)Aluminium bar, LED, transformer251.2kg
Electricity, low voltage57,000.0MJ
Cable, three-conductor cable5.3m
AssemblyElectricity106.9MJ
Land UseOccupation, urban built22.0m2
TransportFreight, lorry 3.5–7.5 metric ton72.0t × km
Climate ControlAir compressor 4 kW, Ventilation System, 10 kW Heat pump, diffuse absorption 4 kW3.0Item
Hydroponic SystemPipesPVC, Bulk, polymerized6.9kg
ClampsSteel, chromium steel 18/817.5kg
ValvesBrass, Tetrafluoroethylene3.2kg
PumpWater pump 22 kW1.0Item
Work AreaWork RoomPolystyrene slab and Aluminium386.0kg
Cladding, crossbar-pole, aluminium100.0m2
Land UseOccupation, urban built14.7m2
HarvestElectronics equipment2.2kg
Metal work bench277.2kg
Polyethylene, plastic equipment28.2kg
chromium steel trolley & trays277.2m2
Internet of Things (IoT) HubSensorsMetals, electronics, plastics and rubber1.91kg
Main HubElectronics and electrical fuses, switches, meter, circuitry.136.0Item
Screen and internetWi-Fi Router and display interface2.0Item
CablesMetals and plastics for cables, ducting, and mounting rail11.0m2
Photovoltaic System (PV)Solar PanelsPhotovoltaic facade installation, 3 kWp, multi-Si, panel, mounted, at building10.0Item
Table 2. LCI of the processes applied for IVF operations with the system boundary 6 processes: Seeding, Growing, Harvest, Packaging, and Delivery are provided with material inputs. Units describe the total volume of inputs per kilograms of fresh weight (kg/kg FW), electricity is measure in megajoules per fresh weight (MJ/kg FW), water in liters (L/kg FW) and kilometers for transportation (km/kg FW) (More detailed in Tables S5 and S6).
IVF Operating Processes
ProcessInputAmountUnit
SeedingTrays (Polyethylene)2.3kg/kg FW
Extrusion of plastic Sheet
Substrate (Coconut fiber)3.0kg/kg FW
Seeds0.07kg/kg FW
GrowingTap water17.0L/kg FW
NPK (15-15-15) fertilizer21.4g/kg FW
Electricity (LEDs)37.6MJ/kg FW
Sensors1Group
Electricity (Equipment)48.0MJ/kg FW
HarvestEquipment1 Group
Compost3.5kg
CleaningDry cleaning consumables, plastics and tissue7.4kg/kg FW
Electricity0.1MJ/kg FW
Water150L/kg FW
Soap1.9g/kg FW
Clothes1Group
PackagingElectricity (lighting)0.1MJ/kg FW
Electricity (sealing bags)0.1MJ/kg FW
Plastic bags10.0Items/kg FW
Labels10.0Items/kg FW
Cardboard box0.2kg/kg FW
DeliveryTruck with refrigeration machine12.7kg × km/kg FW
Publisher’s Note: MDPI stays neutral with regard to jurisdictional claims in published maps and institutional affiliations.

