
Urban Residential CO2 from Spatial and Non-Spatial Perspectives: Regional Difference between Northern and Southern China

1
Business School, Henan Normal University, Xinxiang 453007, China
2
Research Institute for Rural Revitalization and Common Prosperity, Henan Normal University, Xinxiang 453007, China
3
Soft Science Research Base for Industrial Transformation and Upgrading, Henan Normal University, Xinxiang 453007, China
*
Author to whom correspondence should be addressed.
Atmosphere 2022, 13(8), 1240; https://doi.org/10.3390/atmos13081240
Submission received: 8 July 2022
/
Revised: 29 July 2022
/
Accepted: 3 August 2022
/
Published: 5 August 2022
(This article belongs to the Section Air Quality)
Abstract
:Urban residential carbon dioxide (CO2) emissions have increased sharply along with the rapid urbanization process. Few studies have considered the different effects of influencing factors between Northern and Southern China, and the analysis of CO2 per unit area from the spatial perspective is also rarely involved. Using the spatial Durbin model (SDM), this study aimed at revealing the influencing factors (including income, inequality, population density, urban morphology, etc.) on CO2 per capita and CO2 per unit area during 2001–2018 between Northern and Southern China. The results showed that the Northern cities had higher carbon emissions and a faster growth rate, and the high-high clusters were also mainly located in the Northern cities. The Gini coefficient was correlated adversely with CO2, while income imposed a positive effect on carbon emissions. The negative coefficients of the quadratic term of the GDP per capita demonstrated that the residential carbon emissions have the potential to decrease when the income increases to a certain level. The indirect effects of income and the Gini showed that spatial spillover effects exist. Urban population density and the ratio of residential area to built-up area had an opposite effect on CO2 per capita and CO2 per unit area, and they have a bigger impact on the CO2 per unit area. This study revealed the different roles of various factors in reducing CO2 per unit area from the spatial perspective and CO2 per capita from the non-spatial perspective between the Northern and Southern regions, which could help policymakers to design targeted mitigation measures in the residential sector in China, providing references for developing countries to jointly reduce carbon emissions to promote the mitigation of global climate change.
1. Introduction
Climate change characterized by global warming is unequivocal due to the increasing concentration of greenhouse gases [1,2]. Cities are under increasing pressure to achieve emission reductions due to the fact that 70–80% of the emissions of global greenhouse gas emanate from cities [3]. Therefore, it is a key topic to promote economic development while protecting the environment [4,5,6,7]. The proportion of CO2 to total greenhouse gas emissions has increased significantly in the past [8,9]. Human activities affect the socioeconomic and ecological systems and facilitate to emit more carbon dioxide (CO2), and the anthropogenic CO2 emissions act to increase the greenhouse effect [10]. China, as the biggest developing country in the world, emits the most CO2 [11,12], which reached 10.24 billion tons in 2020, contributing 31.73% of the global releases [13]. More importantly, the proportion will gradually increase, promoted by swift industrialization combined with rapid urbanization [14]. The residential CO2 emissions exhibit a higher percentage in China and contribute to the growth of CO2 emissions [15]. Affected by the improvement of livelihoods, the residential energy consumption and CO2 emissions have risen significantly, particularly since the year 2000 [16]. Additionally, with the growth rate of 20 million urban residents per year, China has been undergoing unprecedented urbanization. Concerns regarding sustainable development have been addressed due to a ceaselessly upward trend of CO2 emissions [17]. As a consequence, it is urgent to analyze the effect of influencing factors on CO2 emissions in the residential sector to guide the behaviors of residents and mitigate the process of climate change [18].
Income is one of the important indicators affecting residents’ consumption ability. Income of residents has a bidirectional effect on residential carbon emissions. When income level is low, residents have a low ability to purchase domestic equipment, leading to less energy consumption and lower carbon emissions. Along with the increase in income, the living standards improve, the number of household appliances grows, and the frequency of use increases. As a result, more carbon emissions are produced from the household. From another point of view, however, the poor tend to pay for high-energy equipment, while the rich are more willing to pay for energy-saving equipment, which will reduce the carbon emissions of rich households. The impact of income on residential carbon emissions is uncertain, and income inequality, derived from income, has a more complicated effect on CO2. Therefore, this paper will discuss in depth the impact of income and income inequality on residential CO2.
The objective of this study is to explore the different effects of income, including income level and income inequality, on CO2 per unit area and CO2 per capita between the Northern and Southern China. The purpose of the study was to better understand the influences of these factors on urban residential CO2 emissions by considering the regional differences between the North and South at both the national and regional level from spatial and non-spatial perspectives.
2. Literature Review
As the economy develops and income increases, residential CO2 emissions will continue to rise due to the gradual increase in energy demands for household appliances, central heating, etc. [19,20]. It has been acknowledged that factors such as family members, age, educational background, and salary are inclined to correlate with CO2 emissions [21]. Among these factors, income has been commonly considered to be the main variable [22]. Generally, higher income is correlated with higher CO2 emissions [23,24]. Numerous studies have noted the significant influence of income level when quantifying the roles of explanatory variables on residential CO2 emissions. For instance, Zang et al. [25] showed that household size and income level significantly accelerate the increase in CO2 emissions in China’s residential sector. Miao [26] indicated that income level, population size, and population compactness contribute to the growth of residential CO2 emissions. Li et al. [27] characterized the influence of various factors on per capita household CO2 emissions in Northwest China and concluded that income and urbanization are the main significant factors. Using a representative resident survey, Han et al. [28] found that income and household size significantly affect embedded CO2 emissions in China’s urban area. Ding and Niu [29] showed that the effect of income varied across regions, dropping gradually from the west to the east in China. Nie et al. [30] showed that income is the main contributor to the increase in energy consumption in the residential sector in both urban and rural China because of the constant income growth. Li et al. [31] indicated that the income improvement effect played an important role in emissions inequality at the provincial level using a spatial decomposition analysis.
Furthermore, inequality, reflected in income, wealth, social rights and welfare, is one of the prominent social problems in China [32], which is likely aggravated by the acceleration of urbanization [33]. Many studies have addressed the environmental problems caused by income inequality [34,35,36,37,38,39,40]. However, there is no consensus about the effects of income inequality on carbon emissions. For example, Yang et al. [41] found a remarkable promoting effect of imbalanced income on environmental deterioration in China. Similarly, Knight et al. [42] noted that a bigger wealth gap would stimulate more carbon emissions for high-income countries. Baloch et al. [43] obtained a similar conclusion for Sub-Saharan African countries. Zhang et al. [44] indicated that income gap motivated CO2 emissions at both the national and regional levels. Liu et al. [45] discussed the relationship between income imbalance and CO2 emissions from both non-spatial and spatial perspectives based on a panel model. Jorgenson [46] quantified the influences of income disparity on CO2 emissions in both OECD and non-OECD countries. Grunewald et al. [47] used data from 138 countries and concluded that widening income disparities will result in more CO2 emissions in high-income countries. However, Gangadharan et al. [48] and Heerink et al. [49] showed that income inequality was negatively correlated with CO2 emissions per capita. Kusumawardani and Dewi [50] indicated that income inequality had a negative effect on CO2 emissions. In addition, Baležentis et al. [51] found a non-linear relationship between income inequality and greenhouse gas emissions. Moreover, Borghesi [52] and Policardo [53] implied that income inequality shows no obvious influence on environmental quality.
In the residential sector, some attempts are made to reveal the role of income inequality on CO2 emissions. Golley et al. [54] investigated the change in trends of CO2 emissions across urban households with different income levels in China, and the results indicated that the rich release more CO2 per capita, but the poor emit more CO2 in total. Jorgenson et al. [55] showed that residential CO2 emissions were positively correlated with income inequality at the state level in the United States. Yang et al. [33] measured the degree of inequality based on the Gini index and discussed the correlation between inequalities of household wealth and income among urban households with emissions inequality in China. Wang et al. [56] indicated that income gap was the second major factor contributing to the growth of carbon inequality in the residential sector.
It can be seen that income and income inequality are the important variables affecting residential carbon emissions. However, since China has a vast territory, the socioeconomic development in different regions is uneven [57]. There is an obvious difference in the income level of citizens among regions, and the income gap also varies. The socioeconomic and climatic factors show distinctive regional differences across China [58,59]. These differences may affect the influences of driving factors on CO2 emissions [60]. With the rise of the West, the socio-economic gap between the East and the West in China has gradually narrowed, but the gap between the North and the South has become prominent. Therefore, residential energy structure is significantly different between the North and the South. Previous research quantified the effects of driving factors on emissions, without fully considering the disparity between regions, which might have resulted in spurious regressions, resulting in wide-ranging consequences [61,62]. Additionally, there are few studies focusing on carbon emissions from a spatial perspective [45]. Consequently, this study aims to explore the different effects of income, including income level and income inequality, on CO2 per unit area and CO2 per capita from the view of regional disparities between the Northern and Southern China.
3. Materials and Methods
In this study, Mainland China was first divided into two regions: the Northern region and Southern region, divided by the Qinling–Huaihe Line, to explore the effect of income on urban residential CO2 emissions from the perspective of regional differences. Second, apart from carbon emissions per capita, carbon emissions per unit area were also incorporated to reveal the influencing factors of CO2 emissions from the spatial perspective. Third, the direct effect and the spillover effect of influencing factors on residential CO2 were discussed using the spatial Durbin model at both the national and regional scale from a spatial and non-spatial perspective. The involved materials and methods are displayed as follows.
3.1. Data
This study aims to quantify the effects of factors related to income (including income level and income inequality) on CO2 emissions from urban residential energy consumption from the perspective of regional comparison. Gini, income, GDP per capita (PGDP), the urban population density (PD), the ratio of residential area to built-up area (RR), the urban compactness index (COM), the cohesion index (COH), and carbon intensity (CI) were selected as the explanatory variables. The residential CO2 emissions were calculated by referring to the method of Zhao et al. [63]. GDP per capita reflected the economic development level, which was widely used to express the affluence level. Referring to the relevant research, the square of GDP per capita was adopted to test the EKC hypothesis. The urban population density and the ratio of residential area to built-up area indicated the compactness of inhabitants from a non-spatial and spatial perspective. Urban compactness and cohesion indices are related to the spatial structure of the built-up area, which were derived from the land use data. The former represents the degree of approximation to a circle for each urbanized area, and the later indicates the agglomeration degree of urbanized areas in a city. Carbon intensity expressed the technical development level. Income included two aspects: income level and income inequality. Income level was represented by the per capita disposable income. Income inequality was expressed by the Gini index.
The balanced panel data for 256 prefecture-level cities during 2001–2018 were used in this study. The related socioeconomic data were collected through the China City Statistical Yearbooks, the China Statistical Yearbook for Regional Economy, the China Energy Statistical Yearbook, and provincial statistical yearbooks. The land use data were obtained from Data Center for Resources and Environmental Sciences, Chinese Academy of Sciences (http://www.resdc.cn, accessed on 15 January 2021).
3.2. Calculation of Indicators
3.2.1. Income Level and Income Inequality
Two indicators were employed to describe income: per capita disposable income of urban residents (income, for short) and the Gini index. Income indicates the income level of urban residents. The Gini index represents the degree of inequality of income.
Originally, the Gini index was introduced to represent the degree of equitable income distribution. The Gini index was utilized to depict the income inequality in a certain prefecture-level city. The Gini index can be calculated according to Equation (1):
where Gini indicates the Gini index at the prefecture-level scale; n represents the number of counties in a prefecture-level city; μ is the average value of income per capita in a prefecture-level city. Xi denotes the income per capita of county i, and Xj is the income per capita of county j. The Gini indices vary from 0 to 1, indicating absolute equality and inequality, respectively.
3.2.2. Urban Compactness and Cohesion Indicators
The urban compactness indicator was calculated according to Equation (2), and the cohesion index was obtained according to the concept of landscape ecology [64], represented as Equation (3).
where COM is the urban compactness; COH is the cohesion index; m is the number of the urbanized patch; A and P are the area and perimeter of urbanized areas, respectively; i is the ith urbanized area. The low COM value means that the urbanized patch approaches a circle, with a high degree of compactness. The low COH value means that the urbanized patches are concentrated and distributed in space.
3.3. Spatial Economic Model
According to Tobler’s First Law, regions that are closer have tighter socio-economic activities. Ignoring the spatial effect might have led to spurious regressions. Therefore, including spatial economic modes by introducing a spatial weight matrix is a better choice. Three forms are widely used—the spatial lag model (SLM), the spatial error model (SEM), and the spatial Durbin model (SDM) [65].
The SLM model considers the influence of neighboring dependent variables, which can be expressed by the following formula:
where i and t stand for cross-sectional unit and year, respectively. Y represents the carbon emissions. X is a NT × M matrix of the explanatory factors (M is the number of explanatory factors). W denotes a row-standardized binary spatial weight matrix (N × N). The parameter ρ denotes the spatial autoregressive coefficient and β indicates the elastic coefficient of independent variables. μ and η represent the spatial effect and the time-period effect, respectively. ε is the standard error term.
The SEM model incorporates spatial dependence in the error term, which can be specified using the following formula:
where denotes the error term of spatial autocorrelation; λ is the spatial autocorrelation coefficient of error term, reflecting the degree of the effect of the spatial variables on the independent factors.
The SDM model includes the spatial dependence of explained variables and explanatory variables, which avoids the influence of missing variables on explanatory variables and error terms, to a certain extent [66]. The formula of the SDM model is as follows:
where γ denotes an M × 1 vector of the spatial autocorrelation coefficient of independent factors.
A series of tests, such as the Lagrange multiplier (LM) test, the Hausman test, the Wald test, and the likelihood ratio (LR) test, is used to determine the most suitable model. Since some cities are close in space, but not contiguous, the nearest-neighbor spatial weight matrix is employed to characterize spatial relationships.
4. Results and Discussion
4.1. Spatio-Temporal Variation of CO2 Emissions
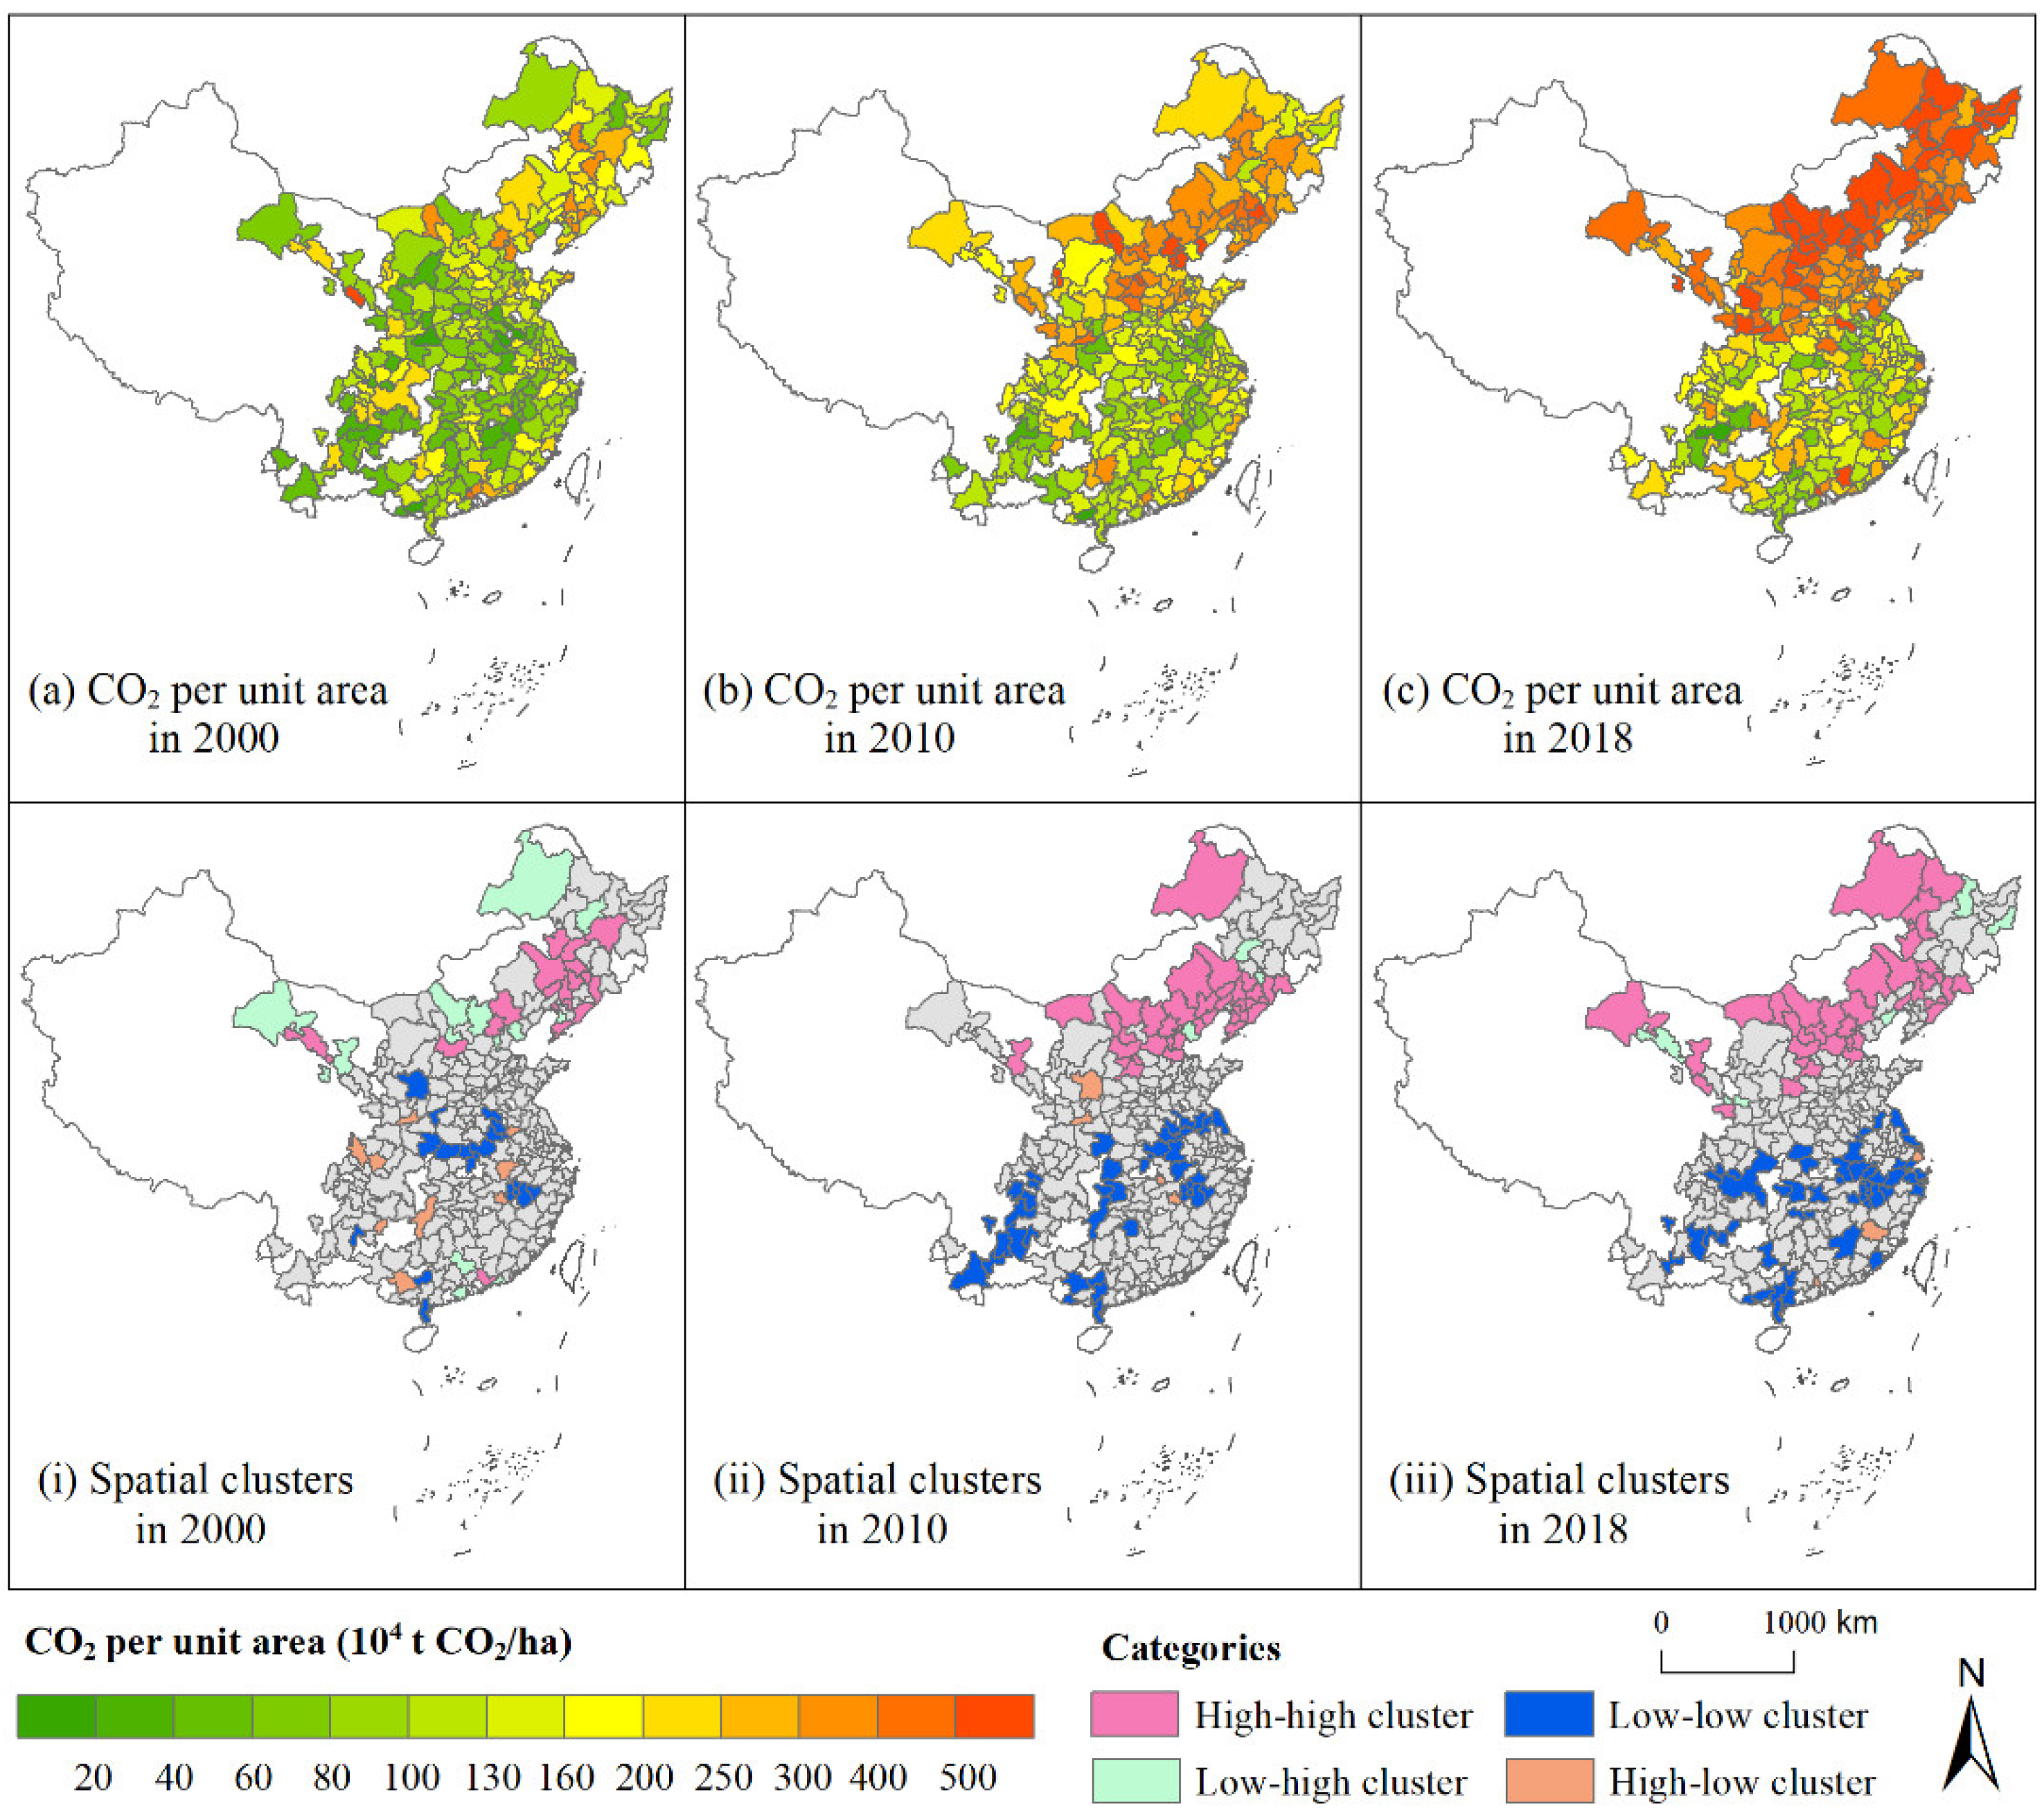
The total CO2 emissions and their spatial clusters are shown in Figure 1. Areas with high carbon emissions were obviously found in Chongqing, Beijing, Shanghai, and Harbin. A similar result was found by Li et al. [31], in that the Beijing-Tianjin-Hebei region and the Sichuan and Chongqing regions exhibited high residential CO2. As time passed, the total carbon emissions increased gradually, especially the cities in Northern China. The spatial pattern of total CO2 presented the characteristics of agglomeration, to some extent. The global Moran’s I indices were 0.149, 0.150, and 0.175 in 2001, 2010, and 2018, respectively, which were all significant at the 0.01 level. The local spatial high-high clusters were identified mainly in the Beijing-Tianjin-Hebei region and in Harbin. The low-low clusters were primarily located in Southern China. As for CO2 per capita (Figure 2) and CO2 per unit area (Figure 3), regions with high carbon emissions were principally recognized in Northern China, especially after 2010. In terms of spatial agglomeration, the global Moran’s I indices of CO2 per capita were 0.446, 0.720, and 0.741, which were higher than those of total CO2 in these three years. Similarly, the high-high clusters were formed mainly in Northern China, and the low-low clusters were found primarily in Southern China, which showed more obvious spatial differentiation compared with that of the total carbon emissions.
4.2. The Roles of Income in Changes of CO2 Emissions
4.2.1. Selection of Spatial Model
The objective of this study was mainly to reveal the effects of income factors (including income level and income inequality) on residential CO2 emissions in urban areas from the perspective of regional differences between the Northern and Southern China. We selected two dependent variables: CO2 emissions per capita and CO2 emissions per unit area of urban residential construction land (CO2 per capita and CO2 per unit area for short, respectively). Therefore, six models were constructed. Model Ⅰ, model Ⅱ, and model Ⅲ depicted the relationships between CO2 per capita and independent variables for the total cities, the Southern cities, and the Northern cities, respectively. Similarly, model Ⅳ, model Ⅴ, and model Ⅵ described the relationships between CO2 per unit area and independent variables for the total cities, the Southern cities, and the Northern cities, respectively.
A serious of tests should be performed before building models with a suitable form. First, LM and robust LM tests were used to examine the existence of spatial correlation. The results showed that all the LM and robust LM statistics passed the significance test at the 0.01 level, rejecting the null hypothesis of no spatial correlation. Spatial economic models should be considered. Additionally, there are fixed effects and random effects that must be determined in spatial economic models. The Hausman test showed that random effects were all rejected at the 0.01 level (Table 1), and the alternative option of fixed effects was selected. According to the LR test, the null hypotheses of joint significance spatial fixed effects and joint significance time-period fixed effects were rejected at the 0.01 level, which showed that spatial and time-period fixed effects were the best choices. All the tests pointed to the spatial economic models with spatial and time-period fixed effects. The SDM model was first estimated, and the Wald and LR tests were utilized to verify whether SDM could be simplified to SLM or SEM. From the results of the Wald and LR tests, the null hypotheses were rejected, meaning that SDM could not be simplified to SLM and SEM. Consequently, SDM was used in our study.
4.2.2. Estimation Results of Spatial Model
Table 2 exhibits the regression results of the spatial panel economic models. The spatial autoregressive coefficients were all statistically significant at the 0.01 confidence level for the total cities, the Northern cities, and the Southern cities, with the two dependent variables of CO2 per capita and CO2 per unit area. These results again confirmed the existence of spatial correlation and spatial effect.
The Gini coefficient exerted a slightly negative effect on CO2 per capita and CO2 per unit area, which indicated that the widening of income inequality was statistically related to the decrease in CO2. This was contradictory to the study of Golley et al. [54] for Chinese urban households, which showed an increasing marginal propensity to emit across income deciles, without using a quantitative indicator of inequality. Based on the Theil index, Jorgenson et al. [55] also showed that carbon emissions were positively associated with income inequality in the United States. The conflicting result is likely due to the different national conditions. Galvin and Sunikka-Blank [67] also demonstrated that both the poor and the very rich had high CO2 emissions in high-income countries. However, the influence of income inequality on carbon emissions is complex, and inconsistent findings have been reported among numerous studies, influenced by different study designs [41,49,53]. Guo [68] pointed out that consumption structure, influenced by income inequality, tended to be energy-intensive and of low quality, which stimulated the increase in CO2. Nevertheless, Demir et al. [69] demonstrated that, since the wealthy families had a lower propensity to emit, a greater inequality contributed to less consumption, thus resulting in lower pollution emissions. Ma et al. [70] also showed that a decrease in the income gap was correlated with an increase in carbon emissions from household consumption in China, which is similar with our findings. According to our results, only the regression coefficients of Gini for the total cities were significant at the 0.1 level, which indicated that, for the total cities, income inequality presented an influential factor in determining the change in CO2.
In terms of income level, income per capita showed a significant influence on both CO2 per capita and CO2 per unit area, except for in the Southern cities. For the total cities, keeping other variables unchanged, every 1% increase in income per capita was related to a 0.149% increase in CO2 per capita, and a 0.159% increase in CO2 per unit area. The change in CO2 per unit area was marginally higher than the change in CO2 per capita caused by the same income growth for the Northern cities. While for the Southern cities, for every 1% of income growth, the change in CO2 per unit area was lower than the change in CO2 per capita, at a rate of 0.077% and 0.083%, respectively. However, increasing income had no significant effect on the increase in CO2 for Southern cities. This is likely because the income level in the Southern cities is generally higher than that in the Northern cities. Inhabitants use household energy restrictively at the low-income level, and with rising income, household energy consumption increases, accompanied by an increase in CO2 emissions. When inhabitants reach a certain income level, the energy consumption and CO2 emissions in a household is no longer dependent on changes in income. In addition, GDP per capita was positively related with CO2 emissions, while the square of GDP per capita was inversely correlated with CO2 emissions at the 0.01 significance level, which also demonstrated the nonlinear relationship (an inverted U-shaped curve) between CO2 emissions and economic growth, which accorded with numerous existing studies [71,72,73]. Generally, carbon emissions first showed an increasing trend along with economic development, and then emissions began to fall after the GDP per capita reached a certain point.
Population density imposed a significant negative effect on CO2 per capita. Every 1% increase in population density was linked to a 0.355%, 0.355%, and 0.372% decrease in CO2 per capita in the total cities, Northern cities, and Southern cities, respectively. These findings are consistent with Al-Mulali et al. [74], who also discovered a significant negative link between urban population and carbon emissions. These findings indicated that population agglomeration had a significant effect on the reduction in CO2 per capita. This is likely due to the fact that the increase in population density was accompanied by the rise in the efficiency of land utilization, and a compact city is inclined to save energy and emit less carbon. In addition, this result can be supported by the fact that the higher degree of urbanization was usually connected with a higher level of economy and an optimized industrial structure, which motivated the process of tertiary industry, and eventually yielded energy efficiency improvements and emission reductions [60]. However, on the contrary, the increasing population density was associated with the increase in CO2 per unit area, which meant that regarding a certain area of land, the agglomeration effect was insufficient to offset the increasing CO2 emissions due to the growing number of inhabitants.
The ratio of residential area to built-up area had a positive influence on CO2 per capita. Every 1% increase in the rate of residential area to built-up area led to a 0.036%, 0.015%, and 0.097% increase in the CO2 per capita for the total cities, Northern cities, and Southern cities, respectively. Namely, the magnitude of change in CO2 per capita was largely higher in the Southern cities than in the Northern cities due to the change of one unit in the ratio of residential area to built-up area. Regarding the CO2 per unit area, a 1% increase in the ratio of residential area to built-up area corresponded to a 0.940%, 0.951%, and 0.882% decrease in CO2 per unit area for the three panel datasets, respectively. Notably, the rising ratio of residential area to built-up area exerted a greater impact on CO2 per unit area than CO2 per capita, showing an opposite effect on the two dependent variables. One possible reason is that the newly developed residential zones usually have a small rate of occupancy and a low degree of population aggregation, and thus the increase in residential area brought about an increase in CO2 per capita and a decrease in CO2 per unit area for the total cities.
Carbon emissions intensity, which is an indicator of technical development level, was a main driving force in changes in CO2 emissions. The decline in carbon emissions intensity was correlated with the decrease in CO2 emissions. Every 1% decrease in carbon emissions intensity led to a 0.651% cut in CO2 per capita and a 0.685% reduction in CO2 per unit area. Particularly, the contribution of carbon emissions intensity to CO2 was higher in the Northern cities than that in the Southern cities. This is probably because the Southern cities have more high-tech enterprises and possess a higher technical level than the Northern cities. The potential for carbon reduction caused by technical progress drops in cities with a higher technical level.
With regard to the influence of spatial structure, the compact index mainly affected carbon emissions positively at the 0.01 significance level for the Northern cities, and the cohesion index influenced the carbon emissions positively at the 0.05 significance level for the Southern cities. Overall, urban configuration has an obvious effect on residential carbon emissions, and compact cities with a high efficiency of land use are more likely to have low carbon emissions in the residential sector, which is consistent with Liu et al. [75].
4.2.3. Spillover Effects
Regression results also showed that obvious spatial spillover effects exist. CO2 emissions are not only affected by the variables in the city itself, but are also influenced by these factors in surrounding cities. Therefore, we further separate the total effects into direct effects and indirect effects (Table 3). The direct effects of the independent variables were slightly different from their coefficients of regression results, indicating that there were feedback effects of influencing factors on carbon emissions among neighboring cities.
For the total cities, the Gini coefficient showed significantly negative direct and indirect effects on both CO2 per capita and CO2 per unit area at the 0.05 significance level. This result indicated that, overall, the widening of income inequality was related to the decrease in carbon emissions in both the local and the surrounding cities. The probable cause is that the poor try not to use some household energy-consuming equipment, such as refrigerators and air conditioners, in order to ease their financial burden, while the rich are inclined to consume clean energy in their daily lives and are thus likely to emit less carbon dioxide. This mode is spread among households, which facilitates the formation of a spatial spillover effect. In this sense, it may be useful to reduce CO2 by raising the income level of middle- and lower-income groups and improving their quality of life. What is more important is to arouse their awareness of energy conservation to guide their habits of energy usage.
Income per capita had positive direct and indirect effects on carbon emissions at the 0.01 significance level for the total cities, showing that a rising income level promoted the increase in carbon emissions significantly in the local and neighboring cities. With a high-income level, residents may consume more household energy due to a loss of financial constraints, and this mode of energy use is gradually transferred to other households in neighboring cities, even though their incomes may not have obviously increased. Additionally, the direct effects of income factors were lower than their indirect effects, which showed that income mainly presented the spatial spillover effect. Income level was correlated with economic development to a large extent, and as a result, GDP per capita also imposed significantly positive direct and indirect effects on carbon emissions. The direct and indirect effects of the quadratic term of the GDP per capita were significantly negative, indicating that both effects exhibited non-linear relationships with carbon emissions.
As shown in Table 3, for the total cities, there were only slight differences between changes in CO2 per capita and CO2 per unit area affected by the Gini coefficient, income per capita, and GDP per capita. However, population density and the ratio of residential area to built-up area influenced CO2 per capita and CO2 per unit area differently. Population density had a negative direct effect and positive indirect effect on CO2 per capita, and inversely, manifested a positive direct effect and negative indirect effect on CO2 per unit area, although both the indirect effects were not significant for most cities. The growing population density was accompanied by population inflow from neighboring cities, thus reducing the aggregation effect of population on carbon emissions and increasing CO2 per capita. Regarding CO2 per unit area, the increased emissions caused by the decrease in population size were not enough to offset the reduction resulting from the low energy consumption associated with a shrinking population, eventually leading to the decrease in CO2 per unit area. The ratio of residential area to built-up area had an opposite direct effect on CO2 per capita and CO2 per unit area, which has been mentioned above. The indirect effects of the proportion of residential area were both negative; however, the negative effects were not significant in most cities.
From the perspective of regional disparity, differences emerged between the Northern and Southern cities. Firstly, the Gini coefficient posed the significant positive indirect effect on CO2 per capita in the Northern cities, while in the Southern cities, the factor exerted a non-significant negative indirect effect on CO2 per capita. In terms of income level, income per capita had a negative indirect effect on CO2 per capita in the Southern cities at the 0.1 significance level, while it showed almost no spillover effect in the Northern cities. From the perspective of CO2 per unit area, the Gini coefficient significantly and inversely influenced the neighboring areas’ CO2 per unit area in both the Northern and Southern cities, while income per capita presented a significant spillover effect only in the Southern cities.
Secondly, the indirect effect of GDP per capita on CO2 per capita was negative in the Northern cities and positive in the Southern cities, and the degree of influence was greater in the Northern cities than in the Southern cities. The indirect effects of the quadratic term were both positive, which was contrary to the results for the total cities. This result indicated that the spillover effect of GDP per capita showed an obvious inverted U-curve at the large scale. However, at the local level, the indirect effect changed, possibly due to the differences in neighborhoods. Regarding the CO2 per unit area, the GDP per capita did not show significant indirect effects in either the Northern or Southern cities.
Thirdly, population density affected the neighboring areas’ carbon emissions positively in the Northern cities, but the positive indirect effects did not pass the significance test. In the Southern cities, population density had a negative effect on carbon emissions. The inverse effect between the North and the South may be caused by the difference in heating modes. The population density increased in the local region by attracting people from other cities; meanwhile, the population size in the neighboring cities decreased. For the Northern cities, central heating in winter is supplied, taking a family as a unit, without regard to the number of members. When the family size decreases, the CO2 per capita rises. Furthermore, the proportion of heat loss increases if the number of users decreases in a certain area. These factors all stimulate the increase in carbon emissions in neighboring cities. For the Southern cities, many people migrate from the Northern cities [76], which promotes the population aggregation, to a large extent, and eventually leads to the reduction in carbon emissions in local and neighboring cities.
Finally, the indirect effects of the ratio of residential area to built-up area on carbon emissions were opposite, with a significantly negative effect in the Northern cities and a significantly positive effect in the Southern cities, respectively. An increase in the ratio of residential area to built-up area meant the growth of the newly residential zones, which indicated the increase in population size in local cities by attracting people from surrounding cities. The CO2 per unit area changed under the combined action of the increase in CO2 per unit area caused by the decrease in the agglomeration effect of population and the reduction in CO2 per unit area derived from the decline in the population. With regard to CO2 per capita, the indirect effect of the ratio of residential area to built-up area in the Southern cities may be due to the decrease in the agglomeration effect of population, while in the Northern cities, the negative indirect effect was likely caused by the policy orientation under the pressure of the decrease in carbon emissions in the surrounding cities. In addition, there is a considerable difference in topography between the North and the South, and the effect of topography on residential carbon emissions has been considered in a related study [77]. Therefore, we have reason to believe that the factor of topography affects the carbon emissions, likely by influencing the arrangement of wires, pipes, and routes for delivering power, etc.
5. Conclusions and Policy Implications
This paper aimed at revealing the influence of income factors on urban residential carbon emissions in China from both spatial and non-spatial perspectives quantified by CO2 per unit area and CO2 per capita, respectively. Meanwhile, regional differentiation between the North and the South was taken into account. The spatial autocorrelation of carbon emissions was verified by global and local Moran’s I, and then the spatial Durbin model (SDM), with spatial and time-period fixed effects, was found to be the most suitable model for investigating the influence of income and other socioeconomic factors on carbon emissions. The main conclusions were as follows: Carbon emissions showed an upward trend over time, and high carbon emissions, as well as high-high clusters, were mainly identified in the North. The growth rate of carbon emissions was faster in Northern China than in Southern China. In terms of the regression results of SDM, the Gini coefficient was correlated negatively with both CO2 per capita and per unit area, which is similar to the results of Demir et al. [70] and Ma et al. [71], while income exerted a positive effect on carbon emissions, which is consistent with Zang et al. [25] and Nie et al. [30]. That is to say, with the increase in income level, residents are inclined to consume more energy for convenience and comfort, and thus emit more CO2. However, the negative effect of income inequality indicated that both the poor and the rich emit low CO2, implying that the residential carbon emissions have the potential to decrease when the income increases to a certain level. The negative coefficients of the quadratic term of the GDP per capita corroborate this view. The indirect effects of income and Gini showed that spatial spillover effects exist, and there was a big difference between the Northern and Southern regions. By comparison of the factors influencing CO2 per capita and CO2 per unit area, urban population density and the ratio of residential area to built-up area had an opposite effect on these two dependent variables, and they have a bigger impact on the CO2 per unit area.
Based on these findings, some countermeasures and suggestions can be put forward. Firstly, the high carbon emissions are likely to be caused by the significant energy consumption used for heating due to the cold climate. There are two aspects to explain. One is that the centralized heating systems are principally installed in Northern China, which leads to much greater energy consumption in Northern than in Southern China. The coverage of central heating has widened, and hence, the carbon emissions have increased significantly. Another aspect is that air conditioners consume more electricity for heating than cooling. For cities without central heating, residents utilize air conditioners to raise the indoor temperature. Consequently, it is essential to further improving the efficiency of energy utilization in central heating systems and air conditioners to reduce their energy consumption and carbon emissions. Reasonable pricing should be formulated for central heating systems, such as step pricing and charging by flow of heat. Secondly, the influence of income factors on carbon emissions was complex. The income level was positively related to carbon emissions, while for income inequality, the result is the opposite, and it is negatively correlated with carbon emissions for the total cities. There is likely an inverted U-shaped curve relationship between living standards and carbon emissions. On the basis of ensuring the continuous improvement of the living standard of the inhabitants, it is a feasible measure to guide them to increase the proportion of clean and green energy and optimize energy structure. Additionally, incentives for clean energy, such as providing subsidies for installing solar panels, should be strengthened for the poor. Thirdly, in order to reach the goal of “Zero Emissions,” one of pathways for carbon capture is land use structure optimization, such as increasing green coverage and enriching the vertical stratification of green land. Limited by the land area, carbon emissions per unit area above the construction area, from a spatial point of view, should also be considered, apart from the carbon emissions per capita. Finally, the population is mobile, and it communicates with others and exchanges information. Therefore, an imitation effect exists in terms of living habits. It is necessary to break administrative boundaries, establish close cooperation and communication, and jointly promote the decrease in the carbon emissions of the residents based on their daily living habits.
In this study, the effects of different drivers on CO2 per unit area and CO2 per capita were revealed between Northern and Southern China from the spatial and non-spatial perspective. Our research was conducted from a new perspective, comparing CO2 per unit area and CO2 per capita, while also revealing the regional disparities between Northern and Southern China. These findings help policymakers to design targeted mitigation measures for the residential sector in China and further contribute to the mitigation of global climate change. However, some limitations also exist. First, this paper mainly focused on the regional inequality in income, and ignored the income inequality between groups. Second, the temperature-related factors were absent in identifying the driving forces of residential CO2. Future studies will focus on these deficiencies and offer a more in-depth analysis of low-carbon development.
Author Contributions
Conceptualization, J.Z.; methodology, J.Z. and S.R.; software, S.R.; validation, J.Z. and S.R.; formal analysis, J.Z. and S.R.; investigation, S.R.; resources, J.Z.; data curation, S.R.; writing—original draft preparation, J.Z.; writing—review and editing, S.R.; visualization, S.R.; supervision, J.Z.; project administration, J.Z.; funding acquisition, J.Z. All authors have read and agreed to the published version of the manuscript.
Funding
This research was funded by the National Natural Science Foundation of China, grant numbers 42001220 and 42171182, the Foundation of Henan Normal University for Young Scholars, grant number 2021QK24, and the Innovation Team of Philosophy and Social Science of Colleges and Universities in Henan Province, grant number 2021-CXTD-04.
Institutional Review Board Statement
Not applicable.
Informed Consent Statement
Not applicable.
Data Availability Statement
Not applicable.
Conflicts of Interest
The authors declare no conflict of interest.
References
- Intergovernmental Panel on Climate Change (IPCC). Climate Change 2014: Synthesis Report; Contribution of Working Groups I, II and III to the Fifth Assessment Report of the Intergovernmental Panel on Climate Change Core Writing Team; Intergovernmental Panel on Climate Change (IPCC): Geneva, Switzerland, 2014. [Google Scholar]
- Lu, H.L.; Liu, G.F.; Zhang, C.R.; Okuda, T. Approaches to quantifying carbon emissions from degradation in pan-tropic forests-implications for effective REDD monitoring. Land Degrad. 2019, 31, 1–16. [Google Scholar] [CrossRef]
- Hoornweg, D.; Sugar, L.; Trejos Gómez, C.L. Cities and greenhouse gas emissions: Moving forward. Environ. Urban. 2011, 23, 207–227. [Google Scholar] [CrossRef]
- Ottelin, J.; Heinonen, J.; Junnila, S. Carbon footprint trends of metropolitan residents in Finland: How strong mitigation policies affect different urban zones. J. Clean. Prod. 2018, 170, 1523–1535. [Google Scholar] [CrossRef]
- Bai, Y.; Deng, X.; Gibson, J.; Zhao, Z.; Xu, H. How does urbanization affect residential CO2 emissions? An analysis on urban agglomerations of China. J. Clean. Prod. 2019, 209, 876–885. [Google Scholar]
- Chen, Y.L.; Zhao, J.C.; Lai, Z.Z.; Wang, Z.; Xia, H. Exploring the effects of economic growth, and renewable and non-renewable energy consumption on China’s CO2 emissions: Evidence from a regional panel analysis. Renew. Energy 2019, 140, 341–353. [Google Scholar] [CrossRef]
- Song, M.; Wu, J.; Song, M.R.; Zhang, L.Y.; Zhu, Y.X. Spatiotemporal regularity and spillover effects of carbon emission intensity in China’s Bohai Economic Rim. Sci. Total Environ. 2020, 740, 140184. [Google Scholar] [CrossRef]
- Lin, S.; Wang, S.; Marinova, D.; Zhao, D.; Hong, J. Impacts of urbanization and real economic development on CO2 emissions in non-high income countries: Empirical research based on the extended STIRPAT model. J. Clean. Prod. 2017, 166, 952–966. [Google Scholar] [CrossRef]
- Shi, K.F.; Yu, B.L.; Zhou, Y.Y.; Chen, Y.; Yang, C.S.; Chen, Z.Q.; Wu, J.P. Spatiotemporal variations of CO2 emissions and their impact factors in China: A comparative analysis between the provincial and prefectural levels. Appl. Energy 2019, 233–234, 170–181. [Google Scholar] [CrossRef]
- International Energy Agency (IEA). Energy Technology Perspectives 2012; International Energy Agency: Paris, France, 2012; pp. 32–40. [Google Scholar]
- Guan, D.; Liu, Z.; Geng, Y.; Lindner, S.; Hubacek, K. The gigatonne gap in China’s carbon dioxide inventories. Nat. Clim. Chang. 2012, 2, 672. [Google Scholar] [CrossRef]
- Wang, Z.; Yang, Y. Features and influencing factors of carbon emissions indicators in the perspective of residential consumption: Evidence from Beijing, China. Ecol. Indic. 2016, 61, 634–645. [Google Scholar] [CrossRef]
- BP Statistical Review of World Energy. 2021. Available online: https://www.bp.com/content/dam/bp/country-sites/zh_cn/china/home/reports/statistical-review-of-world-energy/2021/BP_Stats_2021.pdf (accessed on 18 December 2021).
- Bai, Y.; Deng, X.; Zhang, Q.; Wang, Z. Measuring environmental performance of industrial sub-sectors in China: A stochastic metafrontier approach. Phys. Chem. Earth Parts A/B/C 2017, 101, 3–12. [Google Scholar] [CrossRef]
- Fan, J.L.; Yu, H.; Wei, Y.M. Residential energy-related carbon emissions in urban and rural China during 1996–2012: From the perspective of five end-use activities. Energy Build. 2015, 96, 201–209. [Google Scholar] [CrossRef]
- Fan, J.L.; Liao, H.; Liang, Q.M.; Tatano, H.; Liu, F.C.; Wei, Y.M. Residential carbon emission evolutions in urban–rural divided China: An end-use and behavior analysis. Appl. Energy 2013, 101, 323–332. [Google Scholar] [CrossRef]
- Cai, J.; Yin, H.; Varis, O. Impacts of urbanization on water use and energy-related CO2 emissions of residential consumption in China: A spatio-temporal analysis during 2003–2012. J. Clean. Prod. 2018, 194, 23–33. [Google Scholar] [CrossRef]
- Zhu, Q.; Peng, X.; Wu, K. Calculation and decomposition of indirect carbon emissions from residential consumption in China based on the input–output model. Energy Policy 2012, 48, 618–626. [Google Scholar] [CrossRef]
- Poumanyvong, P.; Kaneko, S. Does urbanization lead to less energy use and lower CO2 emissions? A cross-country analysis. Ecol. Econ. 2010, 70, 434–444. [Google Scholar] [CrossRef]
- Lu, H.L.; Liu, G.F. Spatial effects of carbon dioxide emissions from residential energy consumption: A county-level study using enhanced nocturnal lighting. Appl. Energy 2014, 131, 297–306. [Google Scholar] [CrossRef]
- Baiocchi, G.; Minx, J.; Hubacek, K. The impact of social factors and consumer behavior on carbon dioxide emissions in the United Kingdom: A regression based on input–output and geodemographic consumer segmentation data. J. Ind. Ecol. 2010, 14, 50–72. [Google Scholar] [CrossRef]
- Zhu, Z.; Shen, Y.; Huang, M. Empirical study on low-carbon consumption and factors of carbon emission—Based on Hangzhou. Surv. Resour. Dev. 2011, 27, 831–834. [Google Scholar]
- Zhang, J.; Yu, B.; Cai, J.; Wei, Y.M. Impacts of household income change on CO2 emissions: An empirical analysis of China. J. Clean. Prod. 2017, 157, 190–200. [Google Scholar] [CrossRef]
- Wu, S.; Lei, Y.; Li, S. CO2 emissions from household consumption at the provincial level and interprovincial transfer in China. J. Clean. Prod. 2019, 210, 93–104. [Google Scholar] [CrossRef]
- Zang, X.; Zhao, T.; Wang, J.; Guo, F. The effects of urbanization and household-related factors on residential direct CO2 emissions in Shanxi, China from 1995 to 2014: A decomposition analysis. Atmos. Pollut. Res. 2017, 8, 297–309. [Google Scholar] [CrossRef]
- Miao, L. Examining the impact factors of urban residential energy consumption and CO2 emissions in China–Evidence from city-level data. Ecol. Indic. 2017, 73, 29–37. [Google Scholar] [CrossRef]
- Li, J.; Huang, X.; Yang, H.; Chuai, X.; Li, Y.; Qu, J.; Zhang, Z. Situation and determinants of household carbon emissions in Northwest China. Habitat Int. 2016, 51, 178–187. [Google Scholar] [CrossRef]
- Han, L.; Xu, X.; Han, L. Applying quantile regression and Shapley decomposition to analyzing the determinants of household embedded carbon emissions: Evidence from urban China. J. Clean. Prod. 2015, 103, 219–230. [Google Scholar] [CrossRef]
- Ding, Y.; Niu, S. Spatial difference analysis of residential energy consumption, income and carbon emissions in China. Int. J. Energy Sect. Manag. 2017, 11, 541–556. [Google Scholar] [CrossRef]
- Nie, H.; Kemp, R.; Xu, J.; Vasseur, V.; Fan, Y. Drivers of urban and rural residential energy consumption in China from the perspectives of climate and economic effects. J. Clean. Prod. 2018, 172, 2954–2963. [Google Scholar] [CrossRef]
- Li, H.; Zhao, Y.; Wang, S.; Liu, Y. Spatial-temporal characteristics and drivers of the regional residential CO2 emissions in China during 2000–2017. J. Clean. Prod. 2020, 276, 124116. [Google Scholar] [CrossRef]
- Zhu, C.; Wan, G. Rising inequality in China and the move to a balanced economy. ChinaWorld Econ. 2012, 20, 83–104. [Google Scholar] [CrossRef]
- Yang, Z.; Wu, S.; Cheung, H.Y. From income and housing wealth inequalities to emissions inequality: Carbon emissions of households in China. J. Hous. Built Environ. 2017, 32, 231–252. [Google Scholar] [CrossRef]
- Boyce, J.K. Inequality as a cause of environmental degradation. Ecol. Econ. 1994, 11, 169–178. [Google Scholar] [CrossRef] [Green Version]
- Torras, M.; Boyce, J.K. Income, inequality, and pollution: A reassessment of the environmental Kuznets curve. Ecol. Econ. 1998, 25, 147–160. [Google Scholar] [CrossRef]
- Heil, M.T.; Selden, T.M. Carbon emissions and economic development: Future trajectories based on historical experience. Environ. Dev. Econ. 2001, 6, 63–83. [Google Scholar] [CrossRef]
- Hao, Y.; Chen, H.; Zhang, Q. Will income inequality affect environmental quality? Analysis based on China’s provincial panel data. Ecol. Indic. 2016, 67, 533–542. [Google Scholar] [CrossRef]
- Chen, J.; Cheng, S.; Song, M. Decomposing inequality in energy-related CO2 emissions by source and source increment: The roles of production and residential consumption. Energy Policy 2017, 107, 698–710. [Google Scholar] [CrossRef]
- Khan, A.Q.; Saleem, N.; Fatima, S.T. Financial development, income inequality, and CO2 emissions in Asian countries using STIRPAT model. Environ. Sci. Pollut. Res. 2018, 25, 6308–6319. [Google Scholar] [CrossRef]
- Hailemariam, A.; Dzhumashev, R.; Shahbaz, M. Carbon emissions, income inequality and economic development. Empir. Econ. 2019, 59, 1139–1159. [Google Scholar] [CrossRef]
- Yang, J.; Yang, Z.; Sheng, P. Income distribution, human capital and environmental quality: Empirical study in China. Energy Procedia 2011, 5, 1689–1696. [Google Scholar]
- Knight, K.W.; Schor, J.B.; Jorgenson, A.K. Wealth inequality and carbon emissions in high-income countries. Soc. Curr. 2017, 4, 403–412. [Google Scholar] [CrossRef]
- Baloch, M.A.; Danish, K.S.U.; Ulucak, Z.; Ahmad, A. Analyzing the relationship between poverty, income inequality, and CO2 emission in Sub-Saharan African countries. Sci. Total Environ. 2020, 740, 139867. [Google Scholar] [CrossRef]
- Zhang, C.; Zhao, W. Panel estimation for income inequality and CO2 emissions: A regional analysis in China. Appl. Energy 2014, 136, 382–392. [Google Scholar] [CrossRef]
- Liu, Q.; Wang, S.; Zhang, W.; Li, J.; Kong, Y. Examining the effects of income inequality on CO2 emissions: Evidence from non-spatial and spatial perspectives. Appl. Energy 2019, 236, 163–171. [Google Scholar] [CrossRef]
- Jorgenson, A.K. Inequality and the carbon intensity of human well-being. J. Environ. Stud. Sci. 2015, 5, 277–282. [Google Scholar] [CrossRef]
- Grunewald, N.; Klasen, S.; Martínez-Zarzoso, I.; Muris, C. Income Inequality and CarbonE. Courant Research Centre: Poverty, Equity and Growth; Discussion Papers; Georg-August-Universität Göttingen: Goettingen, Germany, 2011. [Google Scholar]
- Gangadharan, L.; Valenzuela, M.R. Interrelationships between income, health and the environment: Extending the Environmental Kuznets Curve hypothesis. Ecol. Econ. 2001, 36, 513–531. [Google Scholar] [CrossRef] [Green Version]
- Heerink, N.; Mulatu, A.; Bulte, E. Income inequality and the environment: Aggregation bias in environmental Kuznets curves. Ecol. Econ. 2001, 38, 359–367. [Google Scholar] [CrossRef]
- Kusumawardani, D.; Dewi, A.K. The effect of income inequality on carbon dioxide emissions: A case study of Indonesia. Heliyon 2020, 6, e04772. [Google Scholar] [CrossRef]
- Baležentis, T.; Liobikienė, G.; Štreimikienė, D.; Sun, K. The impact of income inequality on consumption-based greenhouse gas emissions at the global level: A partially linear approach. J. Environ. Manag. 2020, 267, 110635. [Google Scholar] [CrossRef]
- Borghesi, S. Income inequality and the environmental Kuznets curve. In Environment, Inequality and Collective Action; Climate Change and Sustainable Development: Milan, Italy, 2006. [Google Scholar]
- Policardo, L. Is democracy good for the environment? Quasi-experimental evidence from regime transitions. Environ. Resour. Econ. 2016, 64, 275–300. [Google Scholar] [CrossRef] [Green Version]
- Golley, J.; Meng, X. Income inequality and carbon dioxide emissions: The case of Chinese urban households. Energy Econ. 2012, 34, 1864–1872. [Google Scholar] [CrossRef]
- Jorgenson, A.K.; Schor, J.B.; Huang, X.; Fitzgerald, J. Income inequality and residential carbon emissions in the United States: A preliminary analysis. Hum. Ecol. Rev. 2015, 22, 93–106. [Google Scholar] [CrossRef]
- Wang, M.; Feng, C. The inequality of China’s regional residential CO2 emissions. Sustain. Prod. Consum. 2021, 27, 2047–2057. [Google Scholar] [CrossRef]
- Miao, L.; Gu, H.; Zhang, X.; Zhen, W.; Wang, M. Factors causing regional differences in China’s residential CO2 emissions—evidence from provincial data. J. Clean. Prod. 2019, 224, 852–863. [Google Scholar] [CrossRef]
- Zhou, Y.; Liu, Y. Does population have a larger impact on carbon dioxide emissions than income? Evidence from a cross-regional panel analysis in China. Appl. Energy 2016, 180, 800–809. [Google Scholar] [CrossRef]
- Li, S.; Zhou, C. What are the impacts of demographic structure on CO2 emissions? A regional analysis in China via heterogeneous panel estimates. Sci. Total Environ. 2019, 650, 2021–2031. [Google Scholar] [CrossRef] [PubMed]
- He, Z.; Xu, S.; Shen, W.; Long, R.; Chen, H. Impact of urbanization on energy related CO2 emission at different development levels: Regional difference in China based on panel estimation. J. Clean. Prod. 2017, 140, 1719–1730. [Google Scholar] [CrossRef]
- Cole, M.A.; Neumayer, E. Examining the impact of demographic factors on air pollution. Popul. Environ. 2004, 26, 5–21. [Google Scholar] [CrossRef] [Green Version]
- Liddle, B. What are the carbon emissions elasticities for income and population? Bridging STIRPAT and EKC via robust heterogeneous panel estimates. Glob. Environ. Chang. 2015, 31, 62–73. [Google Scholar] [CrossRef] [Green Version]
- Zhao, J.; Ji, G.; Yue, Y.L.; Lai, Z.; Chen, Y.; Yang, D.; Yang, X.; Wang, Z. Spatio-temporal dynamics of urban residential CO2 emissions and their driving forces in China using the integrated two nighttime light datasets. Appl. Energy 2019, 235, 612–624. [Google Scholar] [CrossRef]
- Shi, K.F.; Xu, T.; Li, Y.Q.; Chen, Z.Q.; Gong, W.K.; Wu, J.P.; Yu, B.L. Effects of urban forms on CO2 emissions in China from a multi-perspective analysis. J. Environ. Manag. 2020, 262, 110300. [Google Scholar] [CrossRef]
- LeSage, J.P.; Pace, R.K. Introduction to Spatial Econometrics; Chapman and Hall Press, TaylorFrancis Group: Boca Raton, FL, USA, 2009. [Google Scholar]
- Wang, H.J.; Kong, C.L. The research of spatial spillover effect of airport economy on regional economic growth from the dual circulation. J. Manag. 2021, 34, 1–14. [Google Scholar]
- Galvin, R.; Sunikka-Blank, M. Economic inequality and household energy consumption in high-income countries: A challenge for social science based energy re-search. Ecol. Econ. 2018, 153, 78–88. [Google Scholar] [CrossRef]
- Guo, L. Income inequality, household consumption and CO2 emissions in China. Singap. Econ. Rev. 2018, 63, 1740023. [Google Scholar] [CrossRef]
- Demir, C.; Cergibozan, R.; Gök, A. Income inequality and CO2 emissions: Empirical evidence from Turkey. Energy Environ. 2018, 30, 444–461. [Google Scholar] [CrossRef]
- Ma, X.; Chen, D.; Lan, J.; Li, C. The mathematical treatment for effect of income and urban-rural income gap on indirect carbon emissions from household consumption. Environ. Sci. Pollut. Res. 2020, 27, 36231–36241. [Google Scholar] [CrossRef] [PubMed]
- Ahmad, N.; Du, L.; Lu, J.; Wang, J.; Li, H.Z.; Hashimi, M.Z. Modelling the CO2 emissions and economic growth in Croatia: Is there any environmental Kuznets curve? Energy 2017, 123, 164–172. [Google Scholar] [CrossRef]
- Ali, W.; Abdullah, A.; Azam, M. Re-visiting the environmental Kuznets curve hypothesis for Malaysia: Fresh evidence from ARDL bounds testing approach. Renew. Sustain. Energy Rev. 2017, 77, 990–1000. [Google Scholar] [CrossRef]
- Apergis, N.; Christou, C.; Gupta, R. Are there environmental Kuznets curves for US state-level CO2 emissions? Renew. Sustain. Energy Rev. 2017, 69, 551–558. [Google Scholar] [CrossRef] [Green Version]
- Al-Mulali, U.; Ozturk, I. The investigation of environmental Kuznets curve hypothesis in the advanced economies: The role of energy prices. Renew. Sustain. Energy Rev. 2016, 54, 1622–1631. [Google Scholar] [CrossRef]
- Liu, X.; Wang, M.; Qiang, W.; Wu, K.; Wang, X. Urban form, shrinking cities, and residential carbon emissions: Evidence from Chinese city-regions. Appl. Energy 2020, 261, 114409. [Google Scholar] [CrossRef]
- Wu, R. From the Fifth to the seventh national population census in China: The spatio-temporal coupling of population distribution and economic growth as well as the regional balanced development. J. East China Norm. Univ. Humanit. Soc. Sci. 2021, 53, 174–183. [Google Scholar]
- Lu, H.L.; Liu, G.F.; Miao, C.H.; Zhang, C.; Cui, Y.; Zhao, J. Spatial pattern of residential carbon dioxide emissions in a rapidly urbanizing Chinese city and its mismatch effect. Sustainability 2018, 10, 827. [Google Scholar] [CrossRef] [Green Version]
Figure 1.
Spatial distribution and clusters of total CO2 in the years 2001, 2010, and 2018. ((a–c) represents the spatial distributions of the total CO2 in 2000, 2010 and 2018, respectively; (i–iii) denotes the spatial clusters of the total CO2 in 2000, 2010 and 2018, respectively).
Figure 1.
Spatial distribution and clusters of total CO2 in the years 2001, 2010, and 2018. ((a–c) represents the spatial distributions of the total CO2 in 2000, 2010 and 2018, respectively; (i–iii) denotes the spatial clusters of the total CO2 in 2000, 2010 and 2018, respectively).
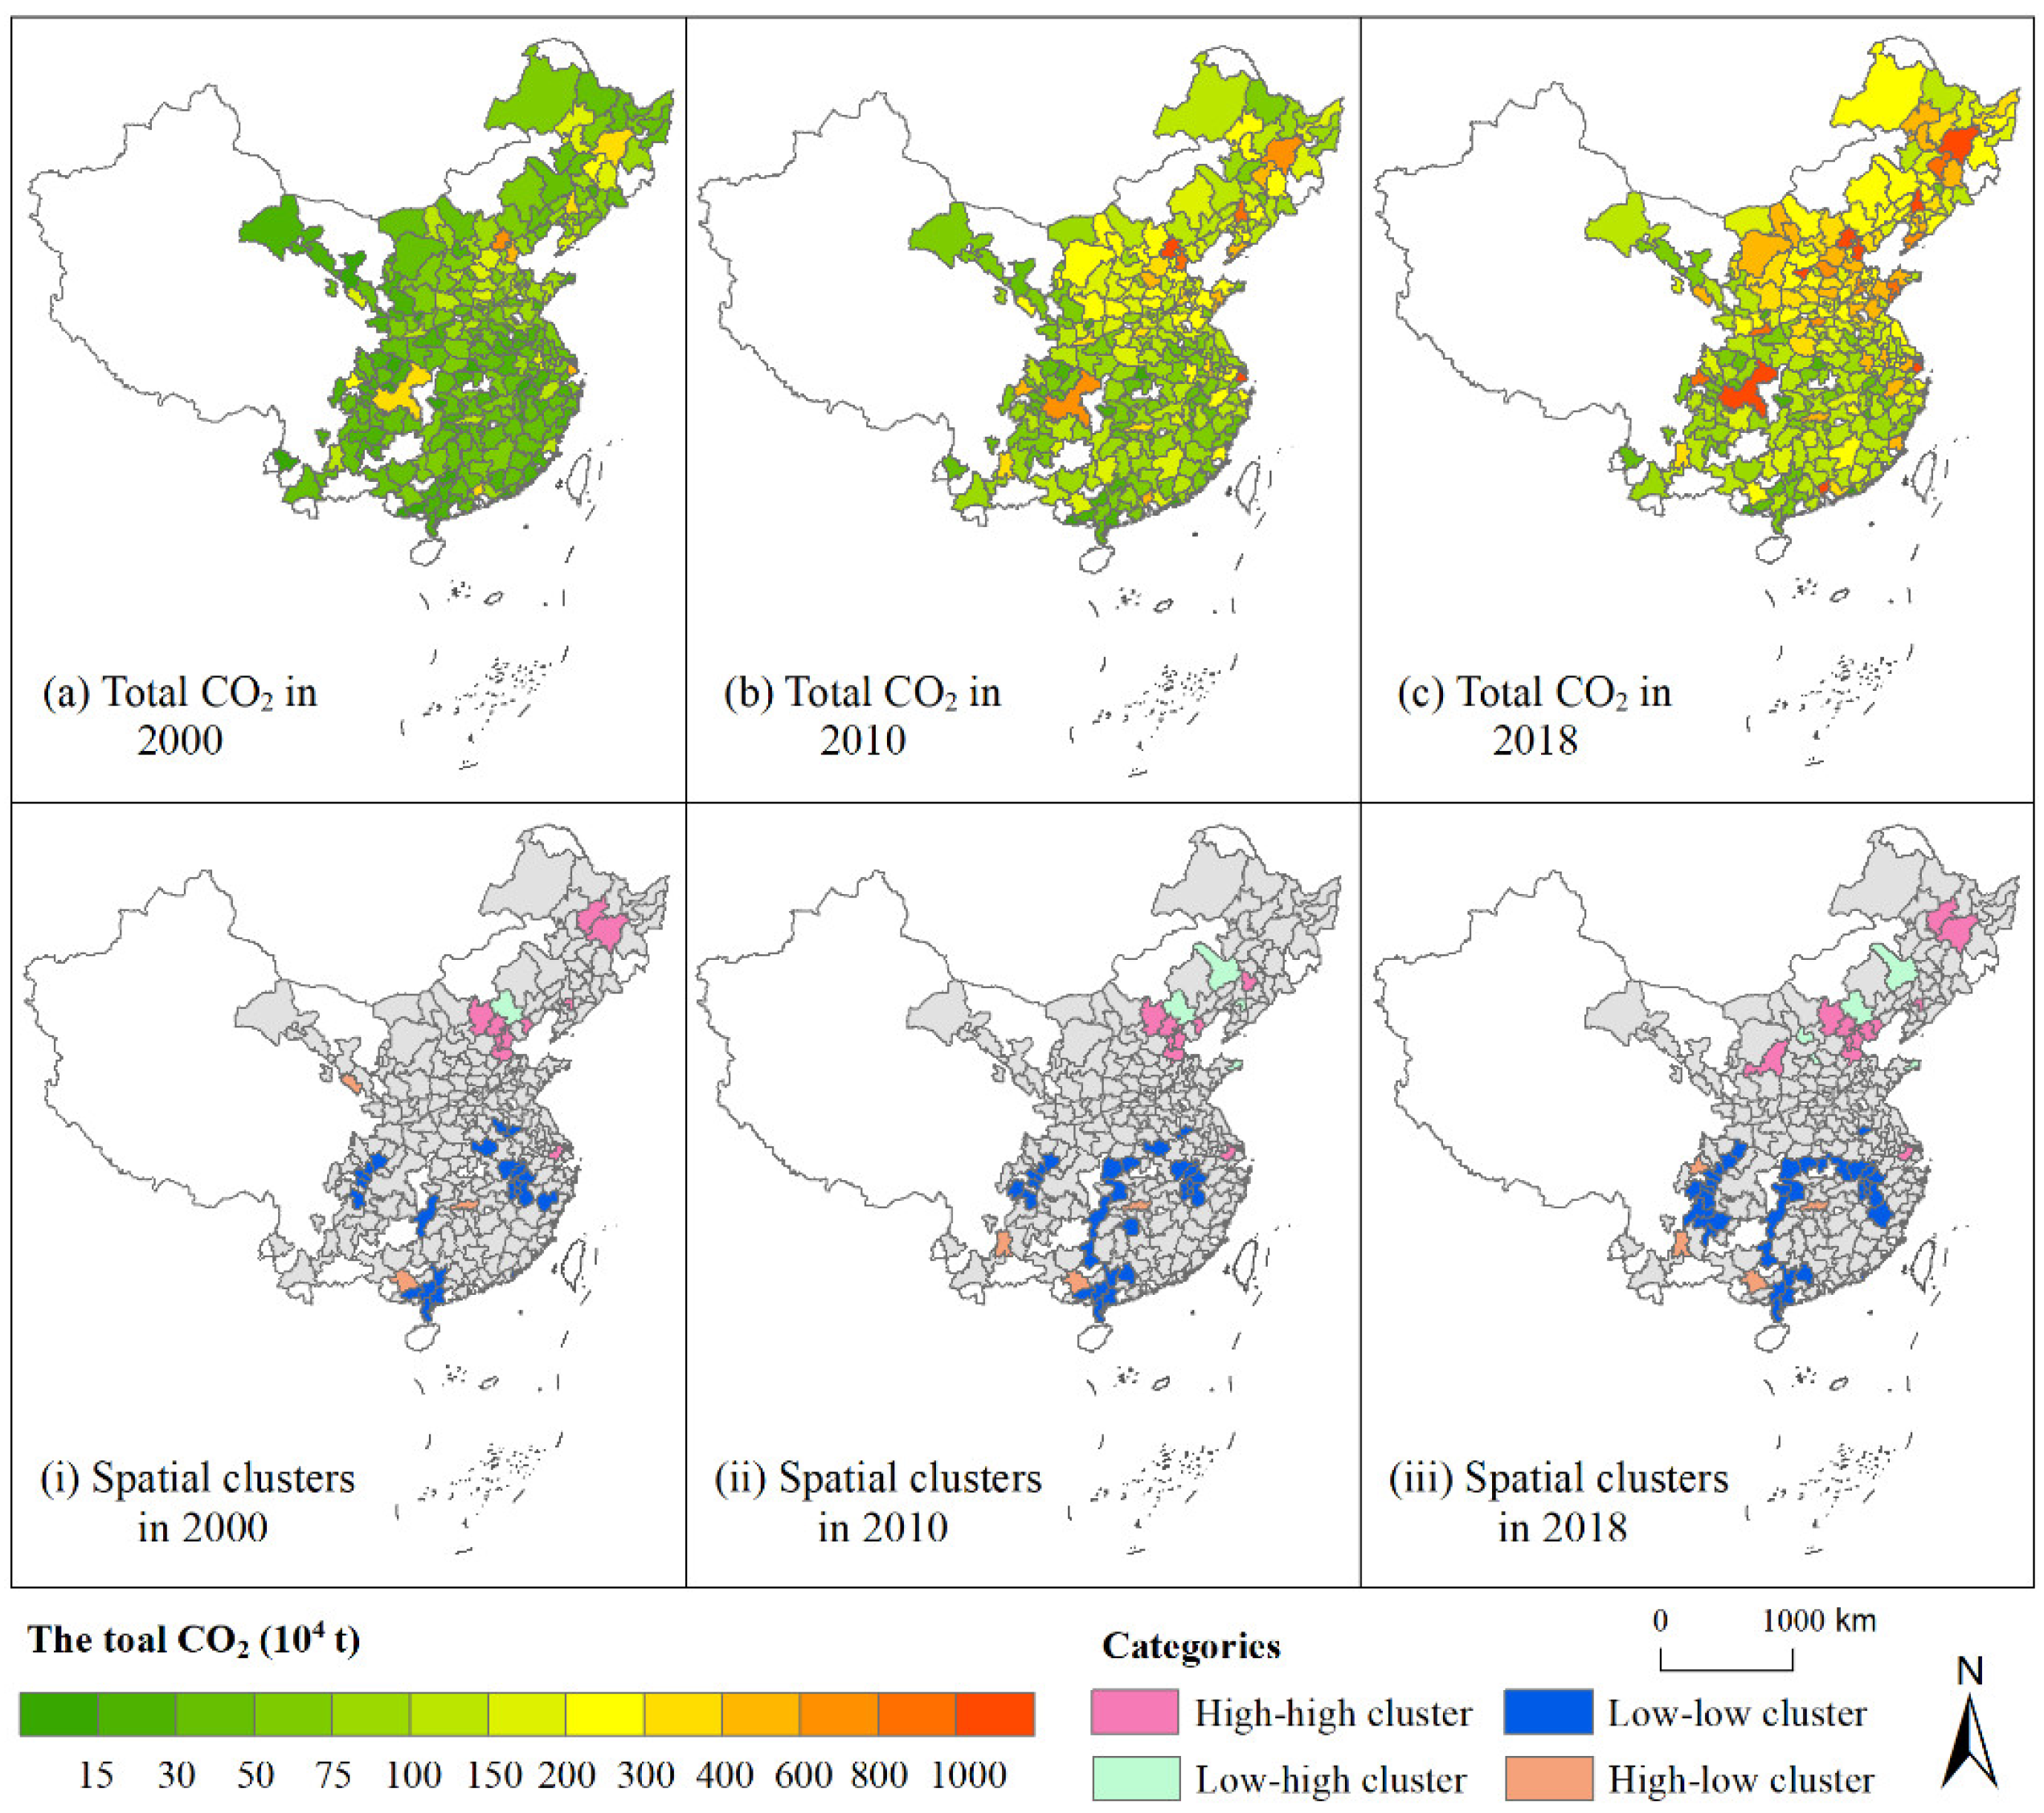
Figure 2.
Spatial distribution and clusters of CO2 per capita in the years 2001, 2010, and 2018. ((a–c) represents the spatial distributions of CO2 per capita in 2000, 2010 and 2018, respectively; (i–iii) denotes the spatial clusters of CO2 per capita in 2000, 2010 and 2018, respectively).
Figure 2.
Spatial distribution and clusters of CO2 per capita in the years 2001, 2010, and 2018. ((a–c) represents the spatial distributions of CO2 per capita in 2000, 2010 and 2018, respectively; (i–iii) denotes the spatial clusters of CO2 per capita in 2000, 2010 and 2018, respectively).
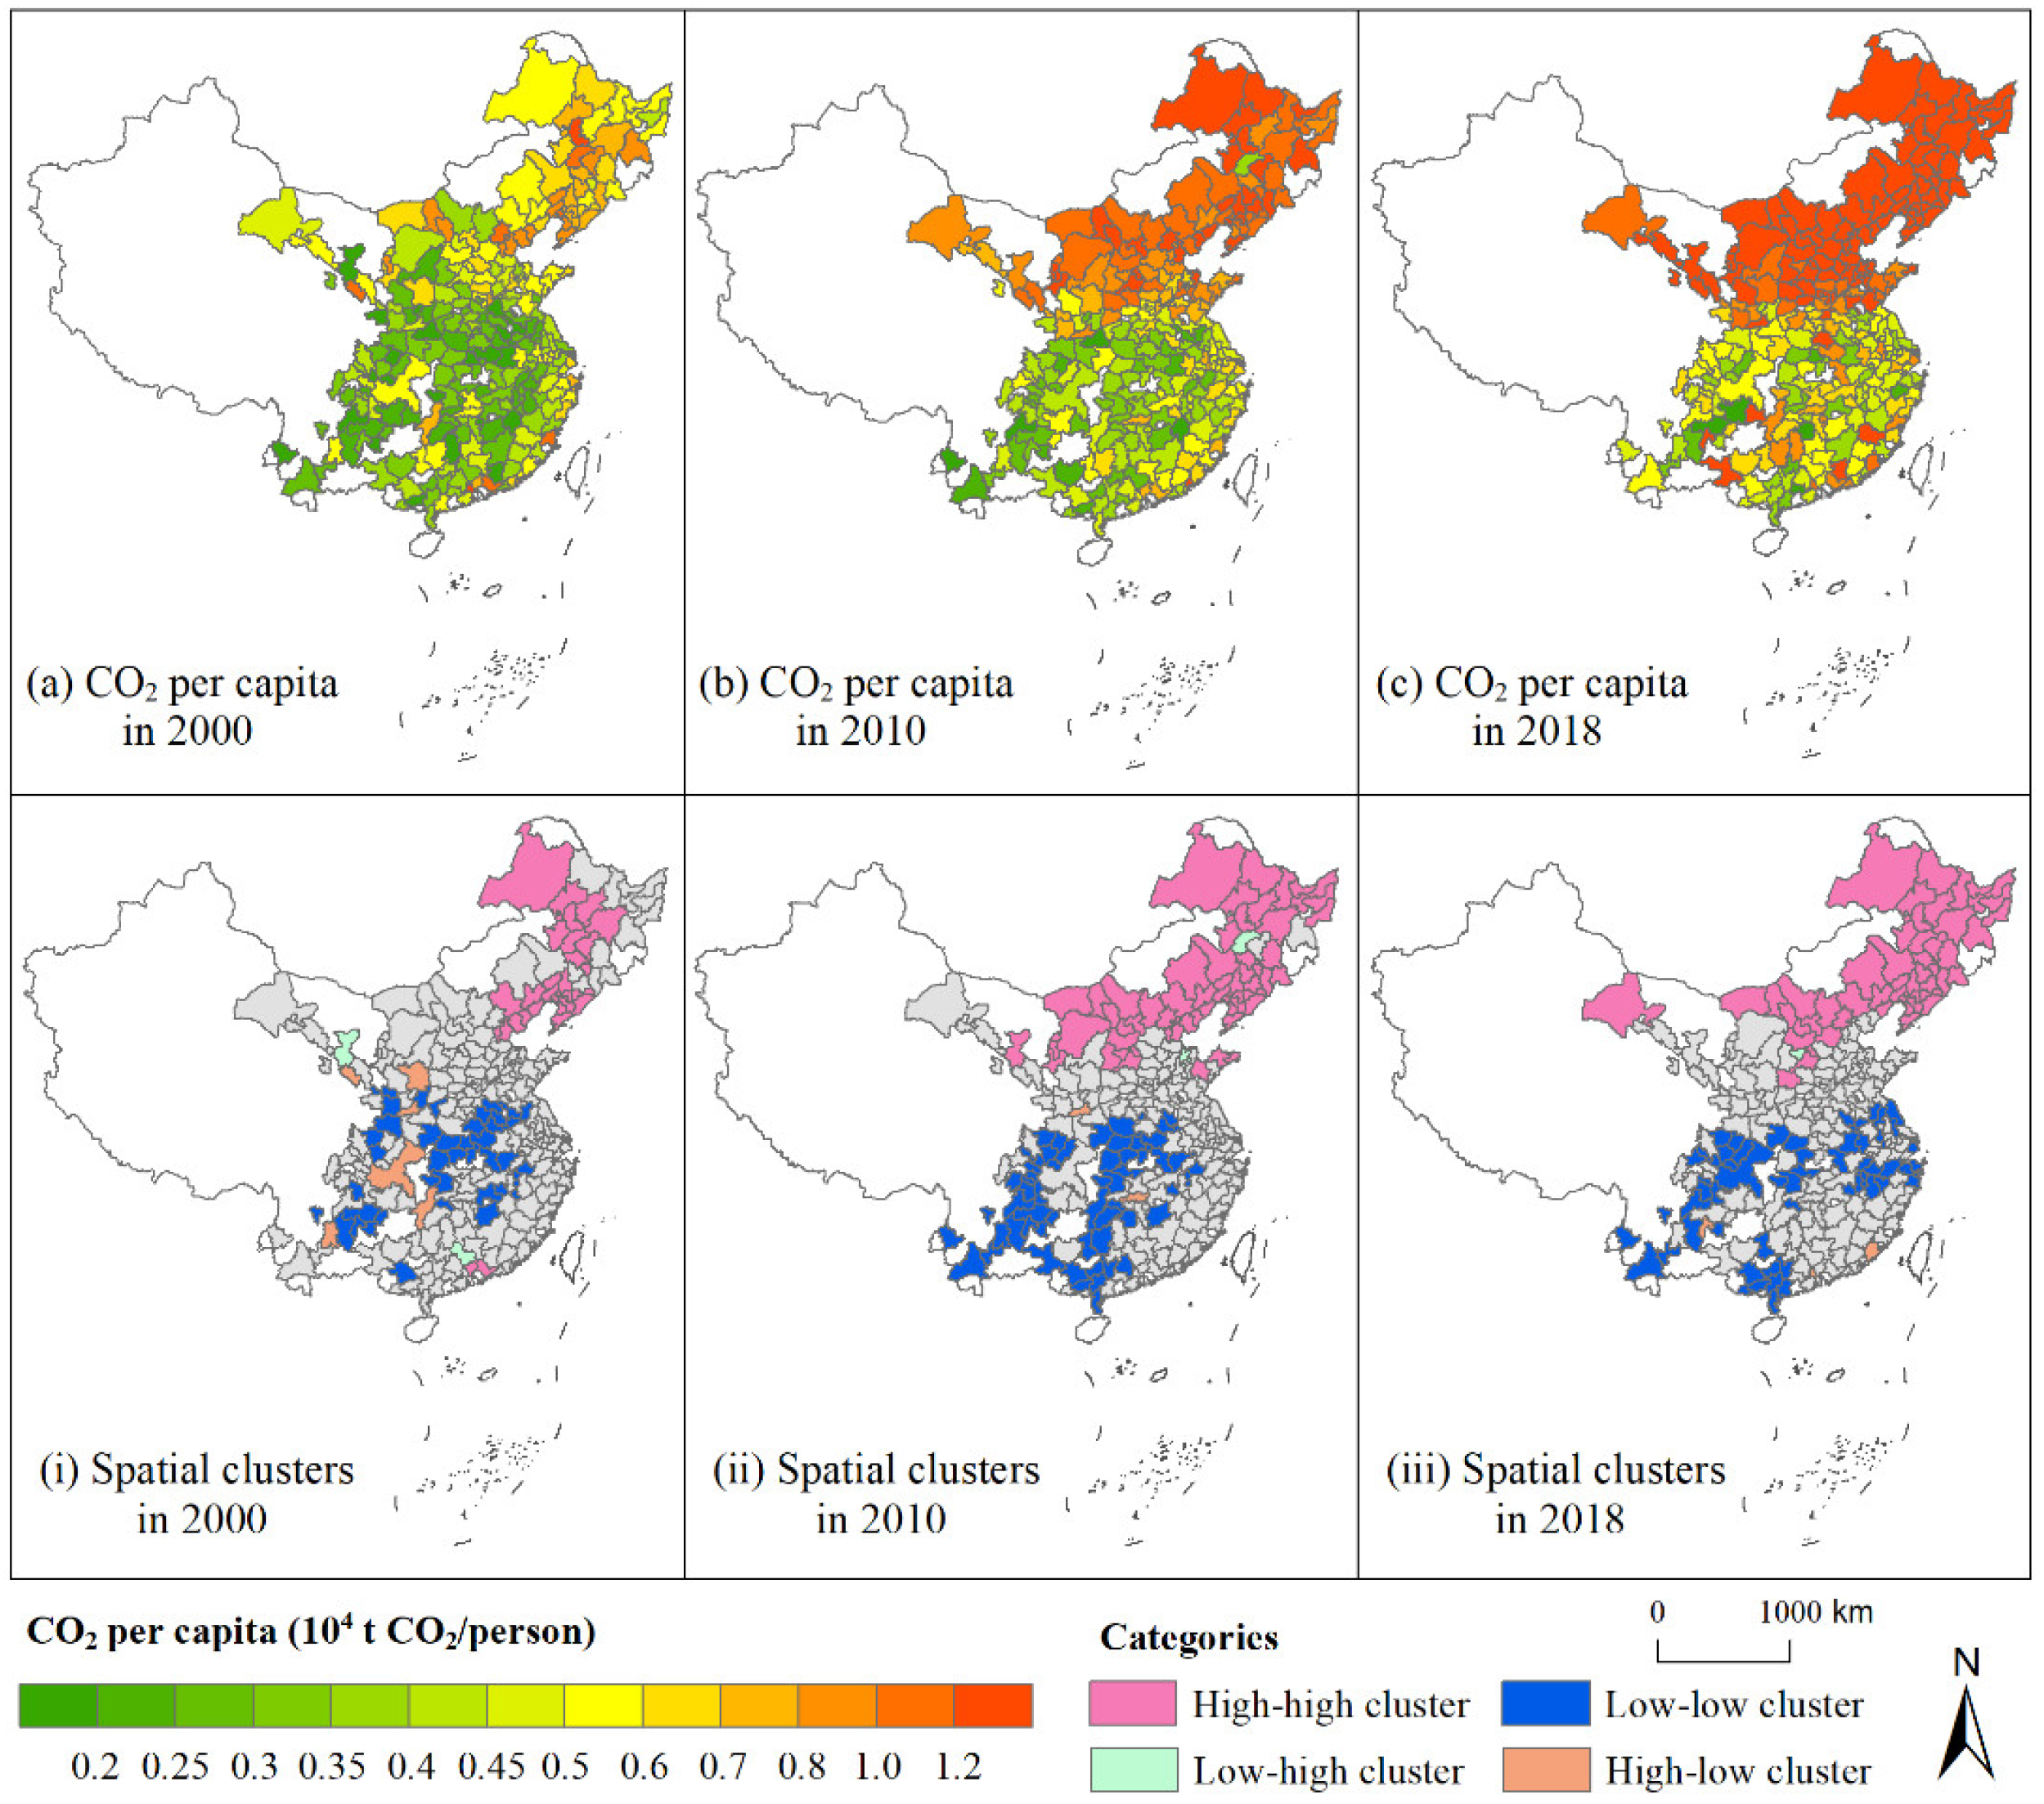
Figure 3.
Spatial distribution and clusters of CO2 per unit area in the years 2001, 2010, and 2018. ((a–c) represents the spatial distributions of CO2 per unit area in 2000, 2010 and 2018, respectively; (i–iii) denotes the spatial clusters of CO2 per unit area in 2000, 2010 and 2018, respectively).
Figure 3.
Spatial distribution and clusters of CO2 per unit area in the years 2001, 2010, and 2018. ((a–c) represents the spatial distributions of CO2 per unit area in 2000, 2010 and 2018, respectively; (i–iii) denotes the spatial clusters of CO2 per unit area in 2000, 2010 and 2018, respectively).

Table 1.
Related tests.
| Test Statistic | CO2 per Capita | CO2 per Unit Area | ||||
|---|---|---|---|---|---|---|
| Total Cities (Model I) | Northern Cities (Model II) | Southern Cities (Model III) | Total Cities (Model IV) | Northern Cities (Model V) | Southern Cities (Model VI) | |
| Hausman test-statistic | 263.652 *** | 142.866 *** | 114.239 *** | 272.098 *** | 126.472 *** | 102.608 *** |
| LR-test joint significance spatial fixed effects | 5157.994 *** | 3376.547 *** | 1305.495 *** | 5024.072 *** | 3354.327 *** | 1234.572 *** |
| LR-test joint significance time-period fixed effects | 480.199 *** | 305.417 *** | 281.511 *** | 472.202 *** | 300.23 *** | 267.546 *** |
| Wald_spatial_lag | 112.568 *** | 123.189 *** | 33.044 *** | 145.670 *** | 97.46 *** | 45.126 *** |
| LR_spatial_lag | 114.724 *** | 123.281 *** | 34.391 *** | 146.718 *** | 94.456 *** | 45.266 *** |
| Wald_spatial_error | 30.595 *** | 63.194 *** | 25.226 *** | 51.428 *** | 49.549 *** | 27.071 *** |
| LR_spatial_error | 68.557 *** | 70.956 *** | 27.684 *** | 54.654 *** | 54.922 *** | 29.696 *** |
Note: *** p < 0.01.
Table 2.
Estimation results of SDM with spatial and time-period fixed effect.
| Variables | Total Cities | Northern Cities | Southern Cities | |||
|---|---|---|---|---|---|---|
| Coefficient | t-Statistic | Coefficient | t-Statistic | Coefficient | t-Statistic | |
| Dependent Variable: CO2 per Capita | ||||||
| W*dep.var. | 0.466 *** | 21.769 | 0.354 *** | 10.389 | 0.204 *** | 5.318 |
| lnGini | −0.024 * | −1.672 | 0.000 | 0.03 | −0.016 | −0.636 |
| lnIncome | 0.149 *** | 3.854 | 0.118 *** | 2.692 | 0.083 | 1.298 |
| lnPGDP | 0.695 *** | 6.475 | 1.624 *** | 9.724 | 0.440 *** | 2.957 |
| ln2PGDP | −0.03 *** | −5.104 | −0.074 *** | −8.836 | −0.017 ** | −1.991 |
| lnPD | −0.355 *** | −15.483 | −0.355 *** | −11.952 | −0.372 *** | −11.068 |
| lnRR | 0.036 | 1.557 | 0.015 | 0.587 | 0.097 ** | 2.449 |
| lnCI | 0.651 *** | 27.222 | 0.718 *** | 22.427 | 0.584 *** | 16.994 |
| lnCOM | 0.053 | 1.37 | 0.095 ** | 2.164 | −0.003 | −0.052 |
| lnCOH | 0.026 | 0.689 | −0.059 | −1.039 | 0.119 ** | 2.305 |
| W*Gini | −0.077 ** | −2.058 | 0.12 *** | 2.722 | −0.094 | −1.313 |
| W*lnIncome | 0.082 | 0.931 | −0.170 | −1.434 | −0.335 ** | −2.182 |
| W*lnPGDP | −0.005 | −0.023 | −1.081 *** | −3.284 | 0.115 | 0.37 |
| W*ln2PGDP | −0.008 | −0.702 | 0.047 *** | 2.859 | 0.004 | 0.251 |
| W*lnPD | 0.165 *** | 3.022 | 0.218 *** | 2.745 | −0.026 | −0.312 |
| W*lnRR | −0.100 | −1.613 | −0.224 *** | −3.401 | 0.216 * | 1.801 |
| W*lnCI | −0.337 *** | −7.364 | −0.491 *** | −7.256 | −0.322 *** | −4.105 |
| W*lnCOM | −0.172 ** | −2.316 | −0.041 | −0.461 | −0.283 ** | −2.373 |
| W*lnCOH | −0.477 *** | −5.718 | −0.566 *** | −4.013 | −0.132 | −1.019 |
| σ2 | 0.055 | 0.037 | 0.070 | |||
| R2 | 0.864 | 0.910 | 0.664 | |||
| Log-Likelihood | 204.195 | 602.147 | −142.658 | |||
| Dependent Variable: CO2 per Unit Area | ||||||
| W*dep.var. | 0.452 *** | 20.787 | 0.336 *** | 9.697 | 0.207 *** | 5.410 |
| lnGini | −0.027 * | −1.763 | −0.002 | −0.107 | −0.018 | −0.685 |
| lnIncome | 0.159 *** | 3.936 | 0.138 *** | 3.038 | 0.077 | 1.141 |
| lnPGDP | 0.786 *** | 7.002 | 1.722 *** | 9.942 | 0.565 *** | 3.631 |
| ln2PGDP | −0.035 *** | −5.739 | −0.08 *** | −9.129 | −0.024 *** | −2.759 |
| lnPD | 0.664 *** | 27.737 | 0.651 *** | 21.097 | 0.652 *** | 18.511 |
| lnRR | −0.940 *** | −38.784 | −0.951 *** | −35.415 | −0.882 *** | −21.381 |
| lnCI | 0.685 *** | 27.388 | 0.782 *** | 23.541 | 0.595 *** | 16.546 |
| lnCOM | 0.086 ** | 2.149 | 0.121 *** | 2.639 | 0.032 | 0.481 |
| lnCOH | −0.004 | −0.112 | −0.105 * | −1.78 | 0.108 ** | 2.01 |
| W*Gini | −0.077 ** | −1.969 | 0.147 *** | 3.218 | −0.126 * | −1.675 |
| W*lnIncome | 0.092 | 0.996 | −0.139 | −1.123 | −0.374 ** | −2.328 |
| W*lnPGDP | 0.192 | 0.876 | −0.765 ** | −2.228 | 0.346 | 1.059 |
| W*ln2PGDP | −0.017 | −1.506 | 0.033 * | 1.921 | −0.009 | −0.509 |
| W*lnPD | −0.343 *** | −5.922 | −0.121 | −1.413 | −0.301 *** | −3.436 |
| W*lnRR | 0.347 *** | 5.099 | 0.111 | 1.412 | 0.405 *** | 3.154 |
| W*lnCI | −0.331 *** | −6.897 | −0.514 *** | −7.270 | −0.335 *** | −4.092 |
| W*lnCOM | −0.217 *** | −2.783 | −0.111 | −1.204 | −0.292 ** | −2.349 |
| W*lnCOH | −0.403 *** | −4.627 | −0.45 *** | −3.086 | −0.061 | −0.447 |
| σ2 | 0.061 | 0.039 | 0.077 | |||
| R2 | 0.871 | 0.918 | 0.745 | |||
| Log-Likelihood | 2.809 | 519.668 | −246.729 | |||
Note: * p < 0.10, ** p < 0.05, *** p < 0.01.
Table 3.
Differentiation results of factors influencing CO2.
| Variables | Total Cities | Northern Cities | Southern Cities | |||
|---|---|---|---|---|---|---|
| Direct Effects | Indirect Effects | Direct Effects | Indirect Effects | Direct Effects | Indirect Effects | |
| Dependent Variable: CO2 per Capita | ||||||
| lnGini | −0.030 * (−1.962) | −0.159 ** (−2.359) | 0.006 (0.409) | 0.181 *** (2.688) | −0.019 (−0.737) | −0.124 (−1.362) |
| lnIncome | 0.160 *** (4.253) | 0.275 * (1.696) | 0.112 ** (2.546) | −0.185 (−1.006) | 0.077 (1.182) | −0.393 ** (−2.089) |
| lnPGDP | 0.717 *** (6.592) | 0.570 * (1.657) | 1.595 *** (9.86) | −0.762 * (−1.689) | 0.445 *** (3.029) | 0.261 (0.713) |
| ln2PGDP | −0.031 *** (−5.303) | −0.039 ** (−2.174) | −0.073 *** (−9.015) | 0.032 (1.399) | −0.017 ** (−2.022) | 0.001 (0.025) |
| lnPD | −0.355 *** (−15.182) | 0.000 (0.000) | −0.351 *** (−11.326) | 0.139 (1.154) | −0.375 *** (−10.905) | −0.125 (−1.249) |
| lnRR | 0.031 (1.311) | −0.147 (−1.350) | 0.005 (0.180) | −0.331 *** (−3.408) | 0.103 ** (2.562) | 0.284 * (1.892) |
| lnCI | 0.649 *** (28.345) | −0.062 (−0.893) | 0.707 *** (22.357) | −0.361 *** (−3.820) | 0.579 *** (16.757) | −0.247 ** (−2.575) |
| lnCOM | 0.042 (1.096) | −0.269 ** (−2.161) | 0.096 ** (2.257) | −0.016 (−0.129) | −0.016 (−0.250) | −0.345 ** (−2.402) |
| lnCOH | −0.006 (−0.149) | −0.832 *** (−5.600) | −0.085 (−1.423) | −0.902 *** (−4.418) | 0.116 ** (2.110) | −0.143 (−0.855) |
| Dependent Variable: CO2 per Unit Area | ||||||
| lnGini | −0.032 ** (−2.053) | −0.157 ** (−2.233) | 0.005 (0.264) | 0.214 *** (3.234) | −0.021 (−0.806) | −0.163 * (−1.701) |
| lnIncome | 0.170 *** (4.140) | 0.291 * (1.822) | 0.134 *** (2.853) | −0.132 (−0.733) | 0.068 (1.031) | −0.448 ** (−2.258) |
| lnPGDP | 0.818 *** (7.192) | 0.964 *** (2.785) | 1.719 *** (10.404) | −0.267 (−0.575) | 0.581 *** (3.681) | 0.575 (1.433) |
| ln2PGDP | −0.037 *** (−6.008) | −0.058 *** (−3.302) | −0.080 *** (−9.572) | 0.009 (0.383) | −0.025 *** (−2.816) | −0.017 (−0.788) |
| lnPD | 0.662 *** (27.910) | −0.073 (−0.769) | 0.653 *** (20.318) | 0.140 (1.154) | 0.648 *** (17.818) | −0.203 ** (−2.039) |
| lnRR | −0.943 *** (−39.273) | −0.131 (−1.147) | −0.960 *** (−34.683) | −0.297 *** (−3.035) | −0.877 *** (−20.402) | 0.275 * (1.719) |
| lnCI | 0.683 *** (27.193) | −0.039 (−0.538) | 0.772 *** (22.398) | −0.371 *** (−3.763) | 0.59 *** (16.631) | −0.264 *** (−2.626) |
| lnCOM | 0.074 * (1.829) | −0.315 ** (−2.422) | 0.117 *** (2.619) | −0.106 (−0.782) | 0.027 (0.404) | −0.360 ** (−2.439) |
| lnCOH | −0.026 (−0.653) | −0.715 *** (−4.881) | −0.122 ** (−2.045) | −0.714 *** (−3.324) | 0.106 ** (2.052) | −0.048 (−0.290) |
Note: t statistics in parentheses; * p < 0.10, ** p < 0.05, *** p < 0.01.
Publisher’s Note: MDPI stays neutral with regard to jurisdictional claims in published maps and institutional affiliations. |
© 2022 by the authors. Licensee MDPI, Basel, Switzerland. This article is an open access article distributed under the terms and conditions of the Creative Commons Attribution (CC BY) license (https://creativecommons.org/licenses/by/4.0/).
Share and Cite
MDPI and ACS Style
Zhao, J.; Ren, S. Urban Residential CO2 from Spatial and Non-Spatial Perspectives: Regional Difference between Northern and Southern China. Atmosphere 2022, 13, 1240. https://doi.org/10.3390/atmos13081240
AMA Style
Zhao J, Ren S. Urban Residential CO2 from Spatial and Non-Spatial Perspectives: Regional Difference between Northern and Southern China. Atmosphere. 2022; 13(8):1240. https://doi.org/10.3390/atmos13081240
Chicago/Turabian StyleZhao, Jincai, and Shixin Ren. 2022. "Urban Residential CO2 from Spatial and Non-Spatial Perspectives: Regional Difference between Northern and Southern China" Atmosphere 13, no. 8: 1240. https://doi.org/10.3390/atmos13081240
Note that from the first issue of 2016, this journal uses article numbers instead of page numbers. See further details here.