
A Real-Time Approach to Detect PM2.5 in a Seriously Polluted Environment Based on Pressure Drop

1
School of Safety Engineering, China University of Mining and Technology, Xuzhou 221116, China
2
Center for Forest and Wetland Protection at Linyi, Linyi 276037, China
*
Author to whom correspondence should be addressed.
Atmosphere 2022, 13(8), 1237; https://doi.org/10.3390/atmos13081237
Submission received: 30 June 2022
/
Revised: 30 July 2022
/
Accepted: 2 August 2022
/
Published: 4 August 2022
(This article belongs to the Special Issue Control and Purification of Particulate Matter)
Abstract
:A differential pressure-based low-cost PM2.5 detection system was developed for particulate matter measurement in polluted environments. The PM2.5 monitor consists of a sampling device, a pump, a pressure sensor, and a control circuit. Two sampling devices including a foam penetration-filter tube and a cyclone-filter holder were applied. Tests were conducted in a haze environment and laboratory particle chambers with varying PM2.5 concentration. The pressure data were related to the PM2.5 concentration recorded by Dusttrak to show the calibration process and the performance of this instrument. Results showed the concentration information given by the instrument was consistent with the actual concentration in the experiment, and this instrument was more suitable for seriously polluted environment detection. Concentration oscillation of the pressure-based PM2.5 monitor caused by turbulent flow could be reduced by a longer calculation interval and data averaging in the calculation process. As a low-cost sensor, the pressure-based PM2.5 monitor still has good performance and application value for detecting high-concentration PM2.5 in atmospheric environments or workplaces.
1. Introduction
PM2.5, particulate matter with aerodynamic equivalent diameters of less than 2.5 μm, has great impacts on air quality, human activities, and health [1,2,3,4]. PM2.5 affects cloud formation and rainfall [5], which is an important part of climate change. At the same time, PM2.5 is highly relevant to respiratory infections, asthma, and other diseases [6,7,8]. Detection of PM2.5 concentration in the atmosphere and specific workplaces is important for providing control strategies for the government, enterprises, and individuals. At present, there are many methods for particle matter (PM) monitoring based on different measurement principles, such as the gravimetric method [9,10], light scattering method [11,12], β-absorption method [13], tapered element oscillating microbalance (TEOM) method [14,15], quartz crystal microbalance (QCM) method [16,17], and so on.
The gravimetric method has the advantages of a simple measuring principle, reliable data, and being free from the interference of particle characteristics (size, shape, color, composition, etc.) [9]. However, it is difficult to provide real-time PM information due to the long sampling time and cumbersome operations [10]. The light scattering method could provide real-time measurement [11], but the accuracy will be compromised by measuring PM with different size distributions, different compositions, and humidity of the ambient air [12]. The β-ray method [13] and tapered element oscillating microbalance method [14,15] are internationally agreed on for the continuous monitoring of PM. The main disadvantages of them are the high cost and frequent replacement of the filter membrane [18]. The quartz crystal microbalance method can also realize the real-time monitoring of particles [16], but the quartz resonator is sensitive to the mass change and has a limited measurement range, which requires regular cleaning and frequent maintenance [17].
In recent years, low-cost sensors (using the light scattering principle) have become increasingly popular for PM concentration measurement [19,20]. These PM sensors can realize the function of high-cost laboratory-level monitoring equipment at a much lower cost [21]. They are inexpensive (typically between $20 and $200), compact (some are matchbox-sized), reliable, and able to capture real-time data (with a 1 s time resolution) [22,23]. These advantages make the application of low-cost PM concentration sensors in indoor and outdoor environments increasingly widespread [24,25,26,27]. However, these low-cost sensors based on light scattering tend to have serious errors when detecting high particle concentrations due to optical path pollution. To form the detection network and achieve high spatial-temporal resolution [28] for monitoring PM2.5 concentrations, new types of low-cost sensors are still needed to measure the PM2.5 in the atmosphere and workplaces, especially at high concentrations.
The differential pressure method is a potential way to measure PM2.5 at little cost. In the research of Dobroski [29] and Volkwein [30,31], particles were collected on a filter membrane (in a respirable dust dosimeter) drawn by a flow pump. The deposition of particles caused a proportional increase in the pressure drop of the filter, and the differential pressure data could be used to predict the accumulated particle mass loading on the filter. Although the pressure response is affected by particle size, type, and humidity, this method can still provide relatively accurate measurements when calibrated for specific particles or atmosphere conditions. Previous research [29,30,31] offered a fundamental understanding of the differential pressure-based method for detecting accumulated particle weight. However, the measurement of particle concentration based on this method and the way to offer continuous monitoring data have not been sufficiently investigated.
The objective of this study was to explore the applicability of the pressure-based method for measurement of PM2.5 and develop a new device. Hence, we designed a pressure-based PM2.5 monitor that is suitable for polluted environment measurement. The PM2.5 sampling device has two structures, including a foam penetration-filter tube and a cyclone-filter holder. The monitor was tested in a haze environment with a relatively low PM concentration and laboratory chambers with high PM concentrations, respectively. The pressure data were related to the PM2.5 concentration recorded by standard instrument (Dusttrak 8530, TSI Inc., Shoreview, MN, USA) to establish the calibration formula. The method to minimize the influence of pressure oscillation on monitoring results was also discussed.
2. Experimental
2.1. Instrumentation
Figure 1 shows the design of the pressure-based PM2.5 monitor. Its key components include a sampling device, a pump, a control circuit, and a pressure sensor.
2.1.1. Sampling Device
Two types of sampling devices were used, including a foam penetration-filter tube and a cyclone-filter holder. The former was custom-made, with a small deposition area on the filter. The latter is commercially available, which has a larger filter and is more suitable for detecting particles at high concentrations. Both of them are cheap, and the tube or cassette can be discarded or recycled after use. The design of the foam penetration filter tube [31] is shown in Figure 2, and it was manufactured by 3D printing with nylon. The foam penetration-filter tube can be divided into three parts. The front part is filled with a polyurethane foam (8 mm in length, 6.3 mm in diameter, and 50 holes/inch), and the other, polyurethane foam (25 mm in length, 4 mm in diameter, and 90 holes/inch). The former foam is used to remove larger particles and prevent the tube from being blocked, and the latter foam collects particles greater than 2.5 μm in size and ensures only PM2.5 particles pass through. A silver membrane filter (STERLITECH Inc., Auburn, WA, USA) with the diameter of 8 mm is placed tightly between the middle part and the back part. With the drawing of flow pump, PM2.5 passes through the front and the middle parts (55 mm in length and 6.3 mm in diameter), and then deposits uniformly on the filter membrane.
The cyclone-filter holder is shown in the right part of Figure 1. A silver filter with a diameter of 25 mm is mounted in a three-section cassette, in which a larger space allows particle deposition to be more uniform. The inlet of cassette is connected with a custom-made Dorr-Oliver 2.5 μm cyclone, which is used to separate particles greater than 2.5 μm.
2.1.2. Pump
The flow pump (Kamoer Inc., Shanghai, China) is used to draw the particles into the detection system. The volumetric flow rate of it can be adjusted by a circuit board. The inlet of the flow pump is connected with the flow controller, which was maintained at 650 mL/min when using a PM2.5 detection tube, and 2.7 L/min when the cyclone-filter holder was adopted to meet the cut point of 2.5 μm. Hence, the foam or cyclone could separate particles greater than 2.5 μm in size. The flow controller limits the high flow rate of flow pump in order to minimize the gas turbulence and reduce the pressure signal oscillation, which affects the detection accuracy.
2.1.3. Control Circuit and Pressure Sensor
Figure 3 shows the designed control circuit board. The pressure sensor installed on the circuit board was connected to the outlet of PM2.5 sampling device (foam penetration-filter tube/cyclone-filter holder) through tubes and a “Y” connector to record the pressure response in real time. In the preliminary experiment, the pressure drop generated by porous foam or cyclone was minuscule. This phenomenon was also observed in the previous study [30], where the differential pressure of porous foam was less than four percent of the total pressure increase for mass loading. For this reason, the pressure at the outlet of foam penetration-filter tube or cyclone-filter holder is regarded as the differential pressure of filter, which allows simplifying the setup of the monitoring system.
The microcontroller on the control circuit board can convert the recorded pressure data into PM2.5 concentration by calibration formula in real time. The operation interface, concentration, and pressure data can be displayed on the LED screen connected to the control board. The calibration formula can be manually modified according to the particle types and environment. The buttons on the circuit board have functions of turning on/off the system, setting working time, and uploading/deleting data. The system can be powered with battery (such as two 18,650 lithium-iron-phosphate batteries in parallel, 1.8 Ah each), making the system portable. The data transmission interface connected with circuit board can transfer the recorded data to a computer.
2.2. Calibration
In order to build the relationship between pressure and concentration for the pressure-based PM2.5 monitor, tests were conducted in the atmospheric environment of heavy haze. The test location was near the window on the third floor of a building (Xuzhou, Jiangsu Province, China), and there were no large buildings nearby and few vehicles. A foam penetration-filter tube was chosen to be the sampling device. The experiment was conducted on 18 October 2021, and the whole measurement time was about 3 h. The pressure data recorded by the tested monitor and PM2.5 concentration recorded by Dusttrak were related to derive the calibration formula.
Tests were also conducted in a laboratory environment with high PM2.5 concentration produced by mosquito coil burning. The cyclone-filter holder was used as the sampling device. A cylindrical chamber with a diameter of 0.4 m and height of 0.5 m was used. The chamber was closed and had a small hole at the center of bottom. During the experiment, the cyclone-filter holder and Dusttrak sampling head were arranged side by side in the center of the chamber. A small section of mosquito coil was ignited in the bottom of the chamber. After 10 min, the mosquito coil burned out. The PM2.5 concentration in the chamber was about 150 mg/m3, and then begun to decrease. The pressure-based PM2.5 monitor and Dusttrak were turned on to record the pressure and PM2.5 concentration data.
Application of the pressure-based PM2.5 monitor was validated in a cubic laboratory chamber that was 2.2 m × 1.5 m × 2.2 m. Two particle generators (Model 8026, TSI Inc.) were located in the chamber to aerosolize the salt solution in a constant flow. Small holes were arranged on the side and top walls of the chamber. The PM2.5 concentration in the chamber gradually rose to 2 mg/m3, and then decreased by adjusting the flow of the particle generators and the holes. The pressure-based PM2.5 monitor and Dusttrak were arranged side by side in the center of the chamber for recording the PM2.5 concentration.
3. Results and Discussions
3.1. Calibration in an Atmospheric Environment
3.1.1. Calibration Equation
Figure 4 shows the variation of the measured pressure drop with time during PM2.5 sampling in an atmospheric environment with haze. The pressure was recorded every second for a period of 14,000 s. The pressure increased with time as PM2.5 was gradually deposited on the filter membrane. It can be seen in Figure 4a that the pressure rise rate was more consistent at 2200–6200 s, which indicates the atmospheric conditions were more stable, and PM2.5 concentration did not fluctuate a lot in this period. Therefore, the data in the scale of 2200–6200 s were fitted with a linear regression model, as shown in Figure 4b. Results of regression analysis for 2200–6200 s data are as follows.
The fitting coefficient R2 is 0.98. Pressure oscillation was observed, which might have been due to the noise from the pressure sensor and the turbulent flow.
For the selected period of 2200–6200 s, the PM2.5 concentration measured by Dusttrak was 0.24 mg/m3. Therefore, under this stable environment, the accumulated PM2.5 mass loading m on the filter can be expressed as:
where t is the sampling time of the pressure-based PM2.5 monitor and Q is the sampling flow rate of 650 mL/min.
Combining Equations (1) and (2), the relationship between the accumulated PM2.5 particle mass loading on the filter membrane and the pressure drop P can be expressed as:
The pressure at t1 (s) is denoted as P1 (kPa), and the pressure at t2 is denoted as P2. The cumulative PM2.5 mass at t1 and t2 can be expressed as follows.
Hence, the PM2.5 concentration C for the period of t1 to t2 can be given by the following equation.
3.1.2. Effects of Time Interval
Equation (6) provides the relationship of PM2.5 concentration, pressure, and time, which can be simplified as:
where Cn+Δt is the PM2.5 mass concentration for the time interval of Δt after second n; Pn and Pn+Δt are the pressure at n and n + Δt seconds, respectively.
The PM2.5 concentration was calculated for different Δt of 60 s, 120 s, 10 min, and 20 min, and the results are shown in Figure 5. When Δt was equal to 60 or 120 s, the calculated PM2.5 concentration oscillated seriously with time. This is because the noise of pressure was high and covered the slight pressure rise during a short time interval, leading to great errors in the calculation results. As the time interval increased, the oscillation of the PM2.5 concentration was weakened. As shown in Figure 5, the PM2.5 concentration was apparently stable for a time interval of 10 or 20 min. For measurement of PM2.5 in an atmospheric environment, the time intervals of 10 and 20 min are acceptable. To get a faster detection response for changes of PM2.5 concentration, the time interval should also not be too long; hence, a time interval of 10 min was selected for the pressure-based PM2.5 monitor. The corresponding equation is shown below.
For measurements in similar environment, Equation (8) is input to the microcontroller, and real-time PM2.5 concentration could be given by the monitor automatically based on pressure data. Abnormal values in the beginning of detection were caused by the unstable pressure in the filter when the pump started.
3.1.3. Effects of Average Times
In order to further eliminate the influence of pressure oscillation and prevent the output of the monitor from being an abnormal value, the concentration calculation results (Δt = 10 min) were also averaged every 20 s, 60 s, 120 s, and 300 s, as shown in Figure 6. It can be seen that the averaged concentration (red line) is much more stable, and the oscillation becomes weaker as the average time increases. However, the details of curves lose a lot when the average time is too long. Therefore, the concentration data are suggested to average every 120 s before output by the pressure-based PM2.5 monitor in a similar environment.
3.2. Calibration in a Laboratory Environment with High PM2.5 Concentration
Calibration of the pressure-based PM2.5 monitor was also conducted in a cylindrical chamber with a gradually decreasing PM2.5 concentration, which was generated from mosquito coil burning. The results are shown in Figure 7.
Figure 7a shows variation of pressure with time recorded by the pressure-based PM2.5 monitor. After large particles were separated by a cyclone collector, PM2.5 was deposited on the filter membrane, and the pressure increased steadily from 2214 to 2466 Pa with time. Resulting from the high PM concentration in the chamber, the pressure curve is smoother, with less oscillation. As time increases, the slope of pressure-time curve decreases due to the decline in environmental particle concentration. This phenomenon was proved by data of Dusttrak, in which PM2.5 concentration decreased from 143 to 4 mg/m3, as shown in Figure 7c.
For the environment with changing PM2.5 concentration, the concentration calibration method was different from that in Section 3.1.1 because the linear regression could not be applied. From Equation (7), the calibration equation for concentration can be expressed as follows.
ΔP/Δt was calculated, and its variation with time is given in Figure 8b. The time interval used was 60 s, which was much shorter than that in Section 3.1.2 due to the fast mass loading on the filter in the high concentration environment. The coefficient k was calculated as the ratio of the difference between the highest and lowest values of ΔP/Δt and that of the Dusttrak data in a same period, which was equal to 318.87. The final equation is shown below.
Figure 7c shows the comparison between PM2.5 concentrations calibrated by the pressure data using Equation (10) and those recorded by Dusttrak. The calculated concentrations are in good agreement with the Dusttrak data. Both of them declined with time, and the decreasing rate gradually slowed down, which is consistent with the environmental conditions of this experiment. Figure 7d shows a linear regression for PM2.5 mass concentration between the pressure-based PM monitor and Dusttrak, with an R2 of 0.92 and normalized RMSE of 25%. As a low-cost sensor, the pressure-based PM2.5 monitor still has good performance on measurement of high-concentration PM.
3.3. Application of the Pressure-Based PM2.5 Measurement Method
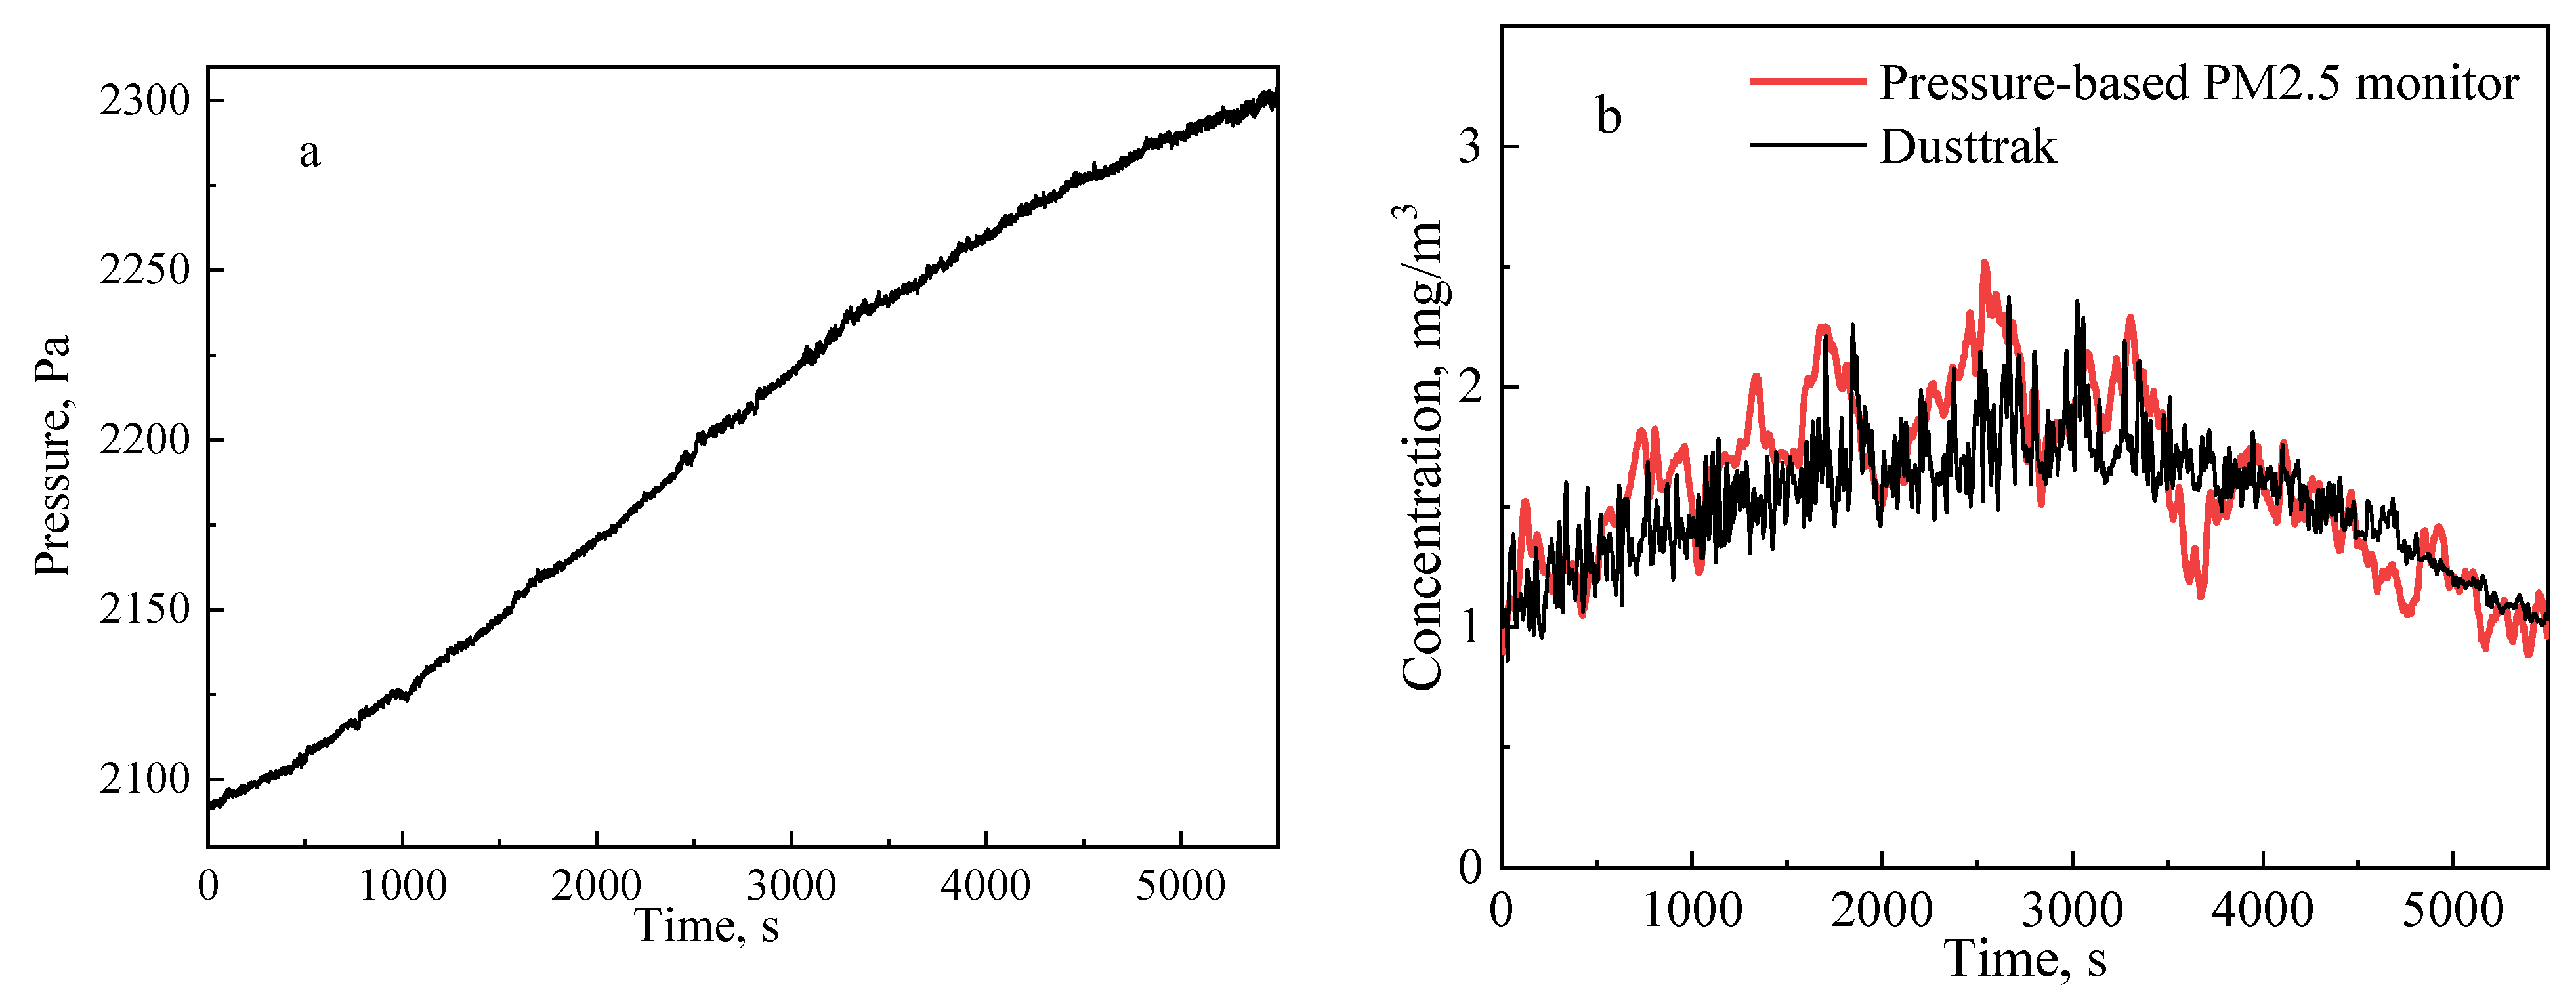
The pressure-based PM2.5 monitor was applied to measure the NaCl aerosol concentration in a cubic chamber of 2.2 m × 1.5 m × 2.2 m. Figure 8a shows variation of pressure with time for varying PM2.5 concentration in the cubic chamber. The slope of pressure curve increases gradually before 3000 s and decreases after 3000 s in the pressure rising process, as the PM2.5 concentration first increased and then decreased in the environment. The pressure data were calibrated by the method in Section 3.2. To calculate the coefficient k of the calibration formula, pressure data before about 3000 s were used. After that, the derived calibration formula was applied to all the data, and the results of corresponding concentration information are shown in Figure 8b. The trend of concentration curve measured by the PM2.5 real-time monitoring system is consistent with that of Dusttrak.
4. Conclusions
To explore the applicability of the pressure method for measurement of PM2.5, a pressure-based PM2.5 monitor was developed, which consisted of a sampling device, a pump, a pressure sensor, and a control circuit. Experiments were conducted in a hazy environment with a relatively low PM concentration and laboratory chambers with high PM concentrations. The calibration approach was proposed, where the the PM2.5 concentration was related to the pressure and the time interval, which could be simplified as follows.
The concentration calculation was achieved through the microcontroller. Users can calculate coefficient k as the ratio of the difference between the highest and lowest value of ΔP/Δt and that of the standard instrument (such as Dusttrak) in a same period. Then, various calibration formulae can be input to the microcontroller to adapt for different particle types and environmental conditions. In the tests, concentration data given by the monitor showed good resemblance to the experiment condition. Meanwhile, the monitor showed better performance when detecting in a seriously polluted environment. To minimize the pressure oscillations caused by turbulent flow and sensor noise, a longer calculation interval and data averaging should be used in the calculation process. As a low-cost sensor, the pressure-based PM2.5 monitor can be used in atmosphere or workplaces environment, and has potential for further instrument development. Relevant study is being conducted to improve this instrument for general use.
Author Contributions
Validation, P.X.; Visualization, R.H.; Writing—original draft, J.L.; Writing—review & editing, L.Z. All authors have read and agreed to the published version of the manuscript.
Funding
This study is supported by the National Natural Science Foundation of China (Grant No. 52074274), the Fundamental Research Funds for the Central Universities (grant number 2021YCPY0107) and “Shuangchuang Team” Program of Jiangsu Province (grant number 202020049).
Informed Consent Statement
Not applicable.
Data Availability Statement
Not applicable.
Conflicts of Interest
The authors declare no conflict of interest.
References
- Henschel, S.; Atkinson, R.; Zeka, A.; Le Tertre, A.; Analitis, A.; Katsouyanni, K.; Chanel, O.; Pascal, M.; Forsberg, B.; Medina, S. Air pollution interventions and their impact on public health. Int. J. Public Health 2012, 57, 757–768. [Google Scholar] [CrossRef] [PubMed]
- Liu, H.; Bartonova, A.; Schindler, M.; Sharma, M.; Behera, S.N.; Katiyar, K.; Dikshit, O.; Health, O. Respiratory disease in relation to outdoor air pollution in Kanpur, India. Arch. Environ. Occup. Health 2013, 68, 204–217. [Google Scholar] [CrossRef] [PubMed] [Green Version]
- Roy, M.; Brokamp, C.; Balachandran, S. Clustering and regression-based analysis of PM2.5 sensitivity to meteorology in Cincinnati, Ohio. Atmosphere 2022, 13, 545. [Google Scholar] [CrossRef]
- Wang, X.H.; Wang, B.Z. Research on prediction of environmental aerosol and PM2.5 based on artificial neural network. Neural Comput. Appl. 2019, 31, 8217–8227. [Google Scholar] [CrossRef]
- Kulmala, M.; Cai, R.; Stolzenburg, D.; Zhou, Y.; Dada, L.; Guo, Y.; Yan, C.; Petaja, T.; Jiang, J.; Kerminen, V.-M. The contribution of new particle formation and subsequent growth to haze formation. Environ. Sci. Atmos. 2022, 2, 352–361. [Google Scholar] [CrossRef]
- Liu, H.; Dunea, D.; Iordache, S.; Pohoata, A. A review of airborne particulate matter effects on young children’s respiratory symptoms and diseases. Atmosphere 2018, 9, 150. [Google Scholar] [CrossRef] [Green Version]
- Kampa, M.; Castanas, E. Human health effects of air pollution. Environ. Pollut. 2008, 151, 362–367. [Google Scholar] [CrossRef]
- Potter, N.A.; Meltzer, G.Y.; Avenbuan, O.N.; Raja, A.; Zelikoff, J.T. Particulate matter and associated metals: A link with neurotoxicity and mental health. Atmosphere 2021, 12, 425. [Google Scholar] [CrossRef]
- Patel, P.; Aggarwal, S.G. On the techniques and standards of particulate matter sampling. J. Air Waste Manag. Assoc. 2022, 72, 791–814. [Google Scholar] [CrossRef]
- Watson, J.G.; Tropp, R.J.; Kohl, S.D.; Wang, X.; Chow, J.C. Filter processing and gravimetric analysis for suspended particulate matter samples. Aerosol Sci. Eng. 2017, 1, 93–105. [Google Scholar] [CrossRef]
- Kelly, K.E.; Whitaker, J.; Petty, A.; Widmer, C.; Dybwad, A.; Sleeth, D.; Martin, R.; Butterfield, A. Ambient and laboratory evaluation of a low-cost particulate matter sensor. Environ. Pollut. 2017, 221, 491–500. [Google Scholar] [CrossRef] [PubMed]
- Gramsch, E.; Oyola, P.; Reyes, F.; Vasquez, Y.; Rubio, M.A.; Soto, C.; Perez, P.; Moreno, F.; Gutierrez, N. Influence of particle composition and size on the accuracy of low cost PM sensors: Findings from field campaigns. Front. Environ. Sci. 2021, 9, 751267. [Google Scholar] [CrossRef]
- Gębicki, J.; Szymańska, K. Comparative field test for measurement of PM10 dust in atmospheric air using gravimetric (reference) method and β-absorption method (Eberline FH 62-1). Atmos. Environ. 2012, 54, 18–24. [Google Scholar] [CrossRef]
- Wanjura, J.D.; Shaw, B.W.; Parnell, C.B.; Lacey, R.E.; Capareda, S.C. Comparison of continuous monitor (TEOM) and gravimetric sampler particulate matter concentrations. Trans. ASABE 2008, 51, 251–257. [Google Scholar] [CrossRef]
- Sullivan, B.; Allawatt, G.; Emery, A.; Means, P.; Kramlich, J.; Posner, J. Time-resolved particulate emissions monitoring of cookstove biomass combustion using a tapered element oscillating microbalance. Combust. Sci. Technol. 2017, 189, 923–936. [Google Scholar] [CrossRef]
- Ngo, N.D.; Jang, J. Long-term measurement of PM2.5 mass concentration using an electrostatic particle concentrator-based quartz crystal microbalance integrated with carbon dioxide aerosol jets for PM sensing in remote areas. IEEE Access 2021, 9, 90715–90726. [Google Scholar] [CrossRef]
- Ngo, N.D.; Lee, J.; Kim, M.W.; Jang, J. Measurement of PM2.5 mass concentration using an electrostatic particle concentrator-based quartz crystal microbalance. IEEE Access 2019, 7, 170640–170647. [Google Scholar] [CrossRef]
- Ayers, G.P. Potential for simultaneous measurement of PM10, PM2.5 and PM1 for air quality monitoring purposes using a single TEOM. Atmos. Environ. 2004, 38, 3453–3458. [Google Scholar] [CrossRef]
- Patra, S.S.; Ramsisaria, R.; Du, R.; Wu, T.; Boor, B.E. A machine learning field calibration method for improving the performance of low-cost particle sensors. Build. Environ. 2021, 190, 107457. [Google Scholar] [CrossRef]
- Vogt, M.; Schneider, P.; Castell, N.; Hamer, P. Assessment of low-cost particulate matter sensor systems against optical and gravimetric methods in a field co-location in Norway. Atmosphere 2021, 12, 961. [Google Scholar] [CrossRef]
- Palmisani, J.; Di Gilio, A.; Viana, M.; de Gennaro, G.; Ferro, A. Indoor air quality evaluation in oncology units at two European hospitals: Low-cost sensors for TVOCs, PM2.5 and CO2 real-time monitoring. Build. Environ. 2021, 205, 108237. [Google Scholar] [CrossRef]
- He, R.; Han, T.; Bachman, D.; Carluccio, D.J.; Jaeger, R.; Zhang, J.; Thirumurugesan, S.; Andrews, C.; Mainelis, G. Evaluation of two low-cost PM monitors under different laboratory and indoor conditions. Aerosol Sci. Technol. 2020, 55, 316–331. [Google Scholar] [CrossRef]
- Manikonda, A.; Zíková, N.; Hopke, P.K.; Ferro, A.R. Laboratory assessment of low-cost PM monitors. J. Aerosol Sci. 2016, 102, 29–40. [Google Scholar] [CrossRef]
- Hapidin, D.A.; Munir, M.M.; Suprijadi; Khairurrijal, K. Development of a new personal air filter test system using a low-cost particulate matter (PM) sensor. Aerosol Sci. Technol. 2020, 54, 203–216. [Google Scholar] [CrossRef]
- Choe, Y.; Shin, J.-s.; Park, J.; Kim, E.; Oh, N.; Min, K.; Kim, D.; Sung, K.; Cho, M.; Yang, W. Inadequacy of air purifier for indoor air quality improvement in classrooms without external ventilation. Build. Environ. 2022, 207, 108450. [Google Scholar] [CrossRef]
- Demanega, I.; Mujan, I.; Singer, B.C.; Anđelković, A.S.; Babich, F.; Licina, D. Performance assessment of low-cost environmental monitors and single sensors under variable indoor air quality and thermal conditions. Build. Environ. 2021, 187, 107415. [Google Scholar] [CrossRef]
- Shao, Y.; Kavi, L.; Boyle, M.; Louis, L.M.; Pool, W.; Thomas, S.B.; Wilson, S.; Rule, A.M.; Quiros-Alcala, L. Real-time air monitoring of occupational exposures to particulate matter among hairdressers in Maryland: A pilot study. Indoor Air 2021, 31, 1144–1153. [Google Scholar] [CrossRef]
- Liu, H.; Schneider, P.; Haugen, R.; Vogt, M. Performance assessment of a low-cost PM2.5 sensor for a near four-month period in Oslo, Norway. Atmosphere 2019, 10, 41. [Google Scholar] [CrossRef] [Green Version]
- Dobroski, H.; Tuchman, D.P.; Vinson, R.P.; Timko, R.J. Differential pressure response of 25-mm-diameter glass fiber filters challenged with coal and limestone dust mixtures. Appl. Occup. Environ. Hyg. 2002, 17, 96–103. [Google Scholar] [CrossRef]
- Volkwein, J.C.; Schoeneman, A.L.; Page, S.J. Laboratory evaluation of pressure differential-based respirable dust detector tube. Appl. Occup. Environ. Hyg. 2000, 15, 158–164. [Google Scholar] [CrossRef]
- Volkwein, J.C.; Thimons, E.D. New tools to monitor personal exposure to respirable coal mine dust. In Proceedings of the Seventh International Mine Ventilation Congress, Crakow, Poland, 17–22 June 2001. [Google Scholar]
Figure 1.
Pressure-based PM2.5 monitor.

Figure 2.
Structure of the foam penetration-filter tube.
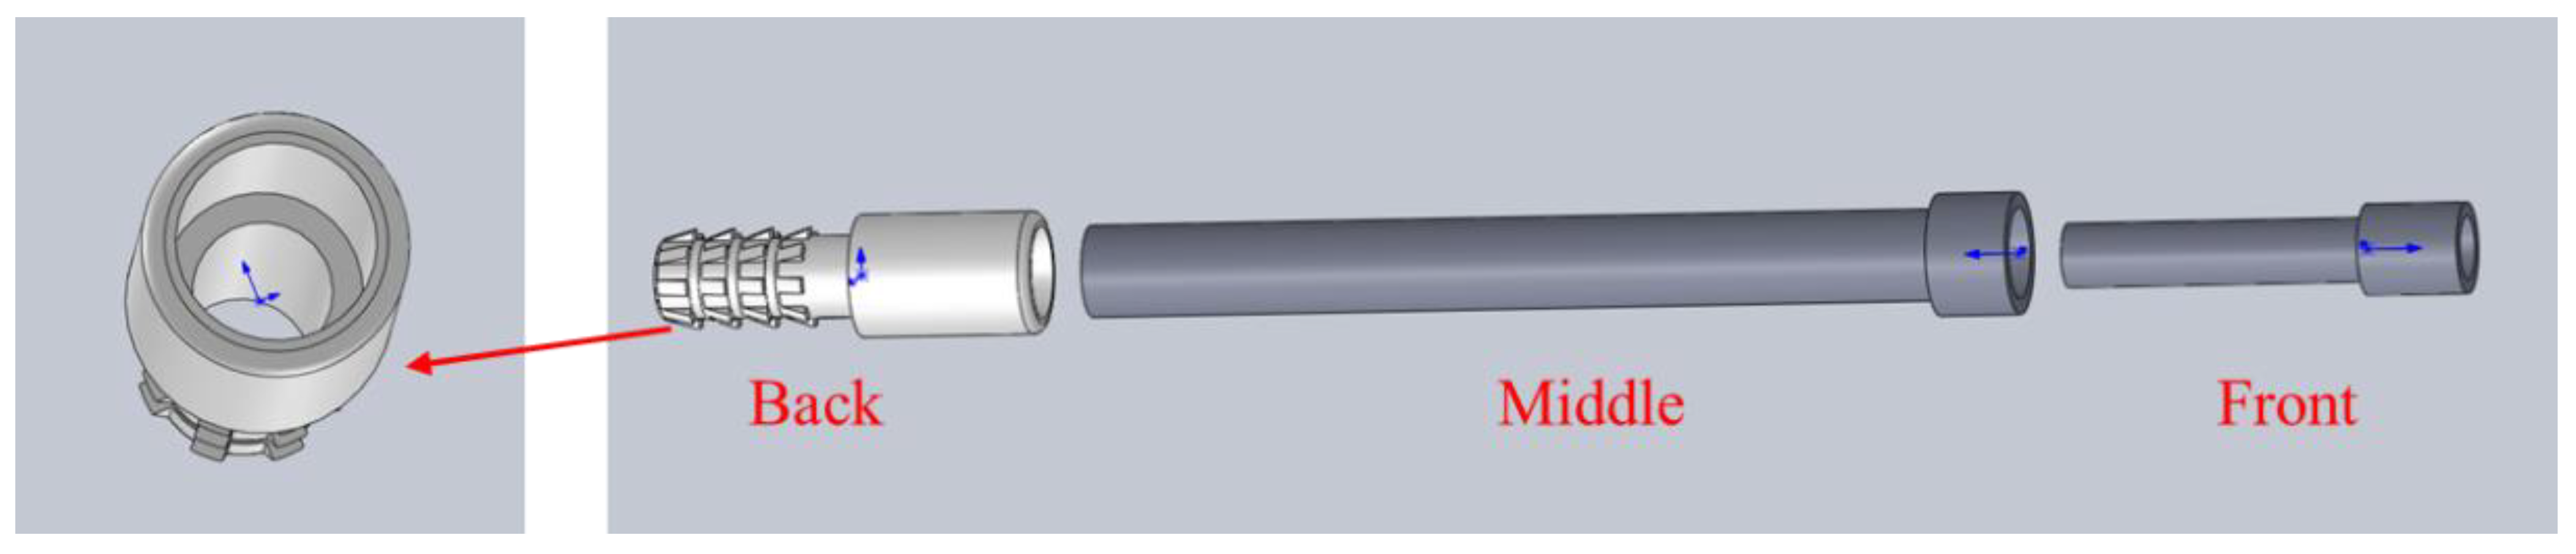
Figure 3.
The control circuit board and part of the circuit schematic diagram.
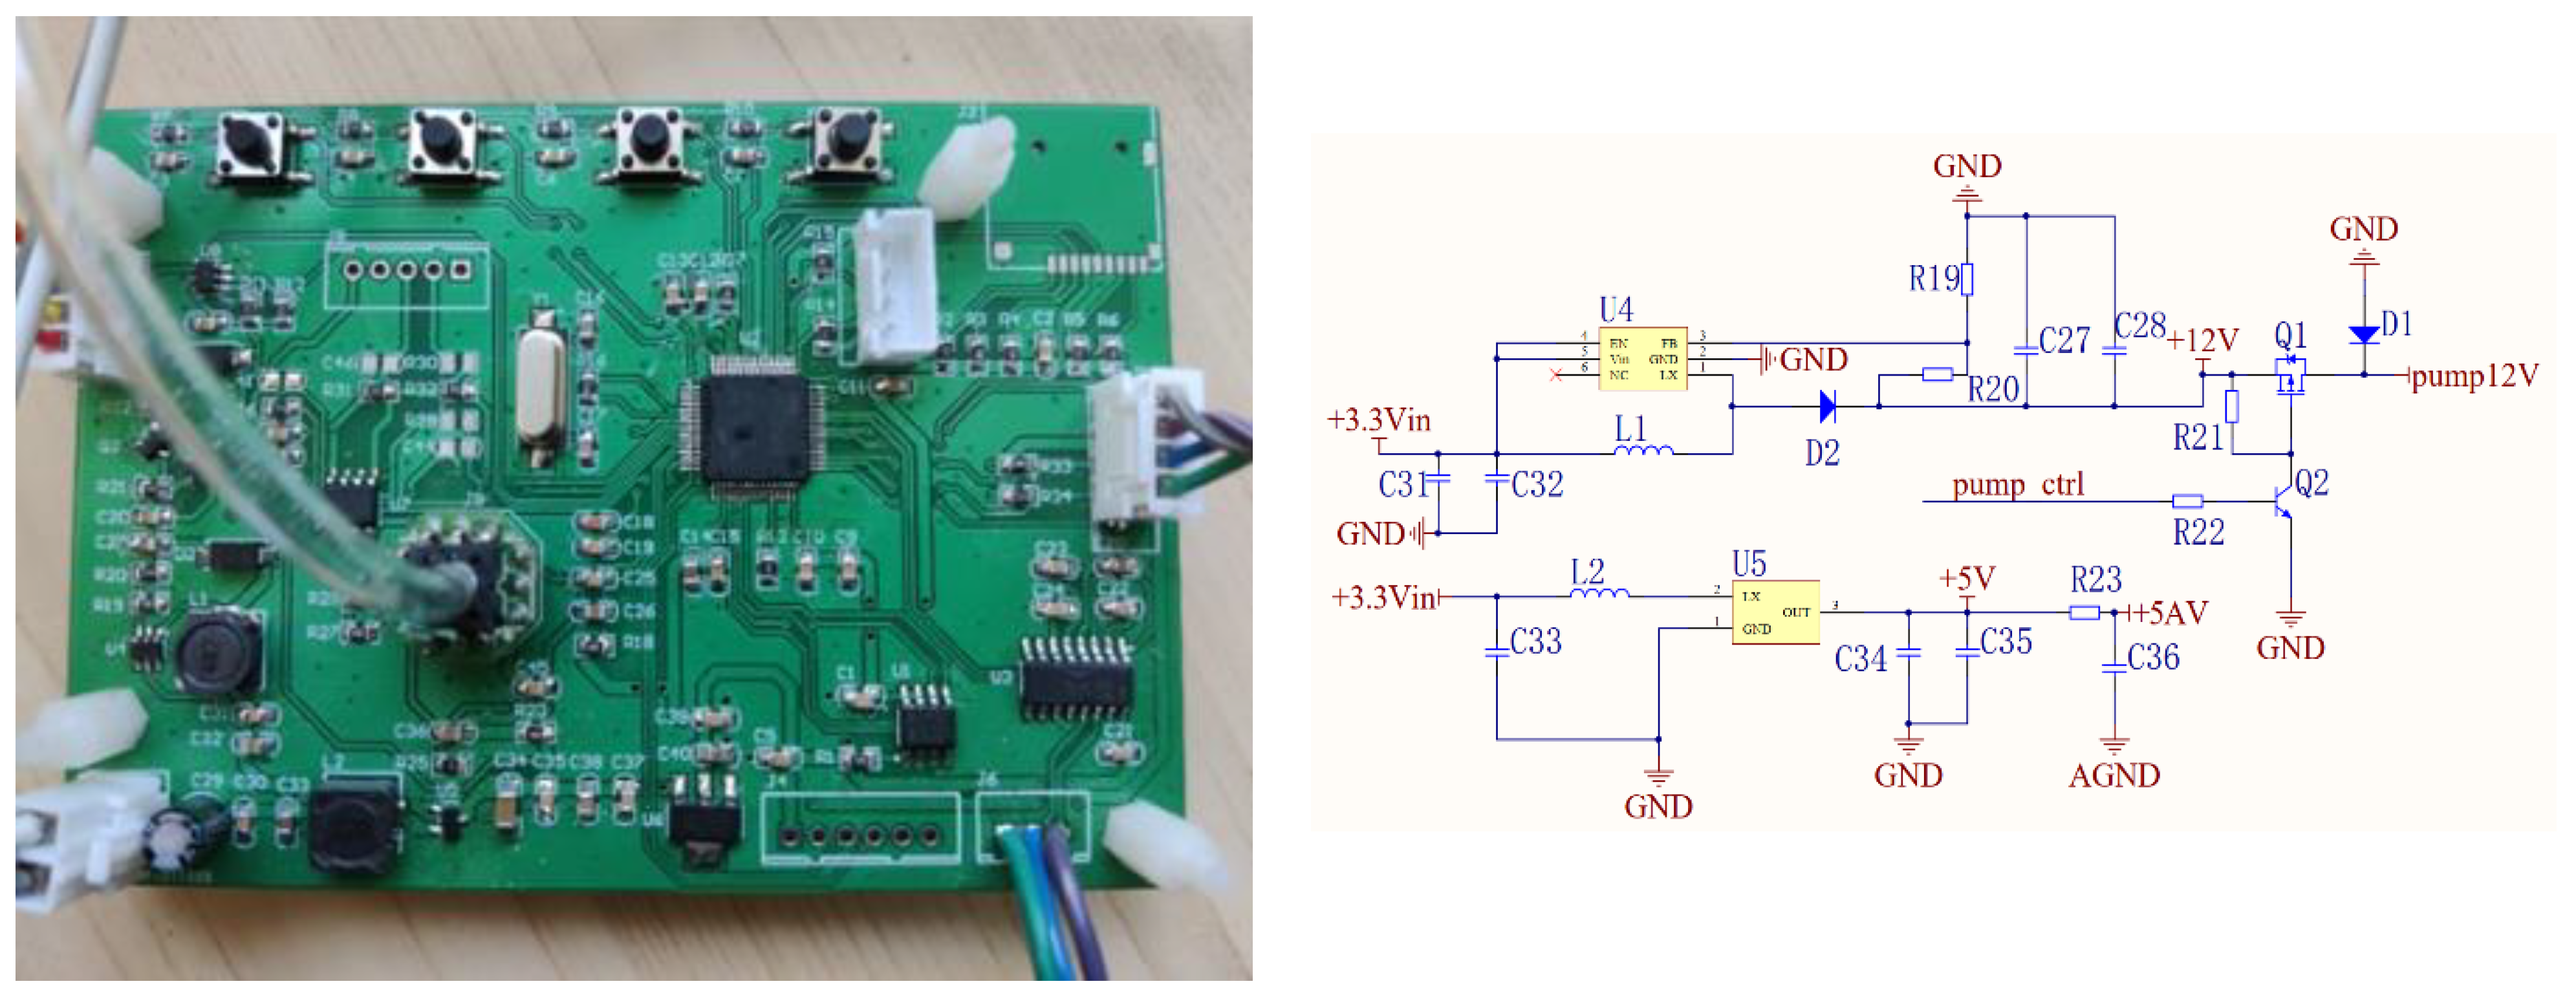
Figure 4.
Variation of the measured pressure drop with time during PM2.5 sampling in an atmospheric environment with haze for (a) all data and (b) data between 2200 and 6200 s.
Figure 4.
Variation of the measured pressure drop with time during PM2.5 sampling in an atmospheric environment with haze for (a) all data and (b) data between 2200 and 6200 s.

Figure 5.
PM2.5 concentration calculated with intervals of 60 s, 120 s, 10 min, and 20 min.
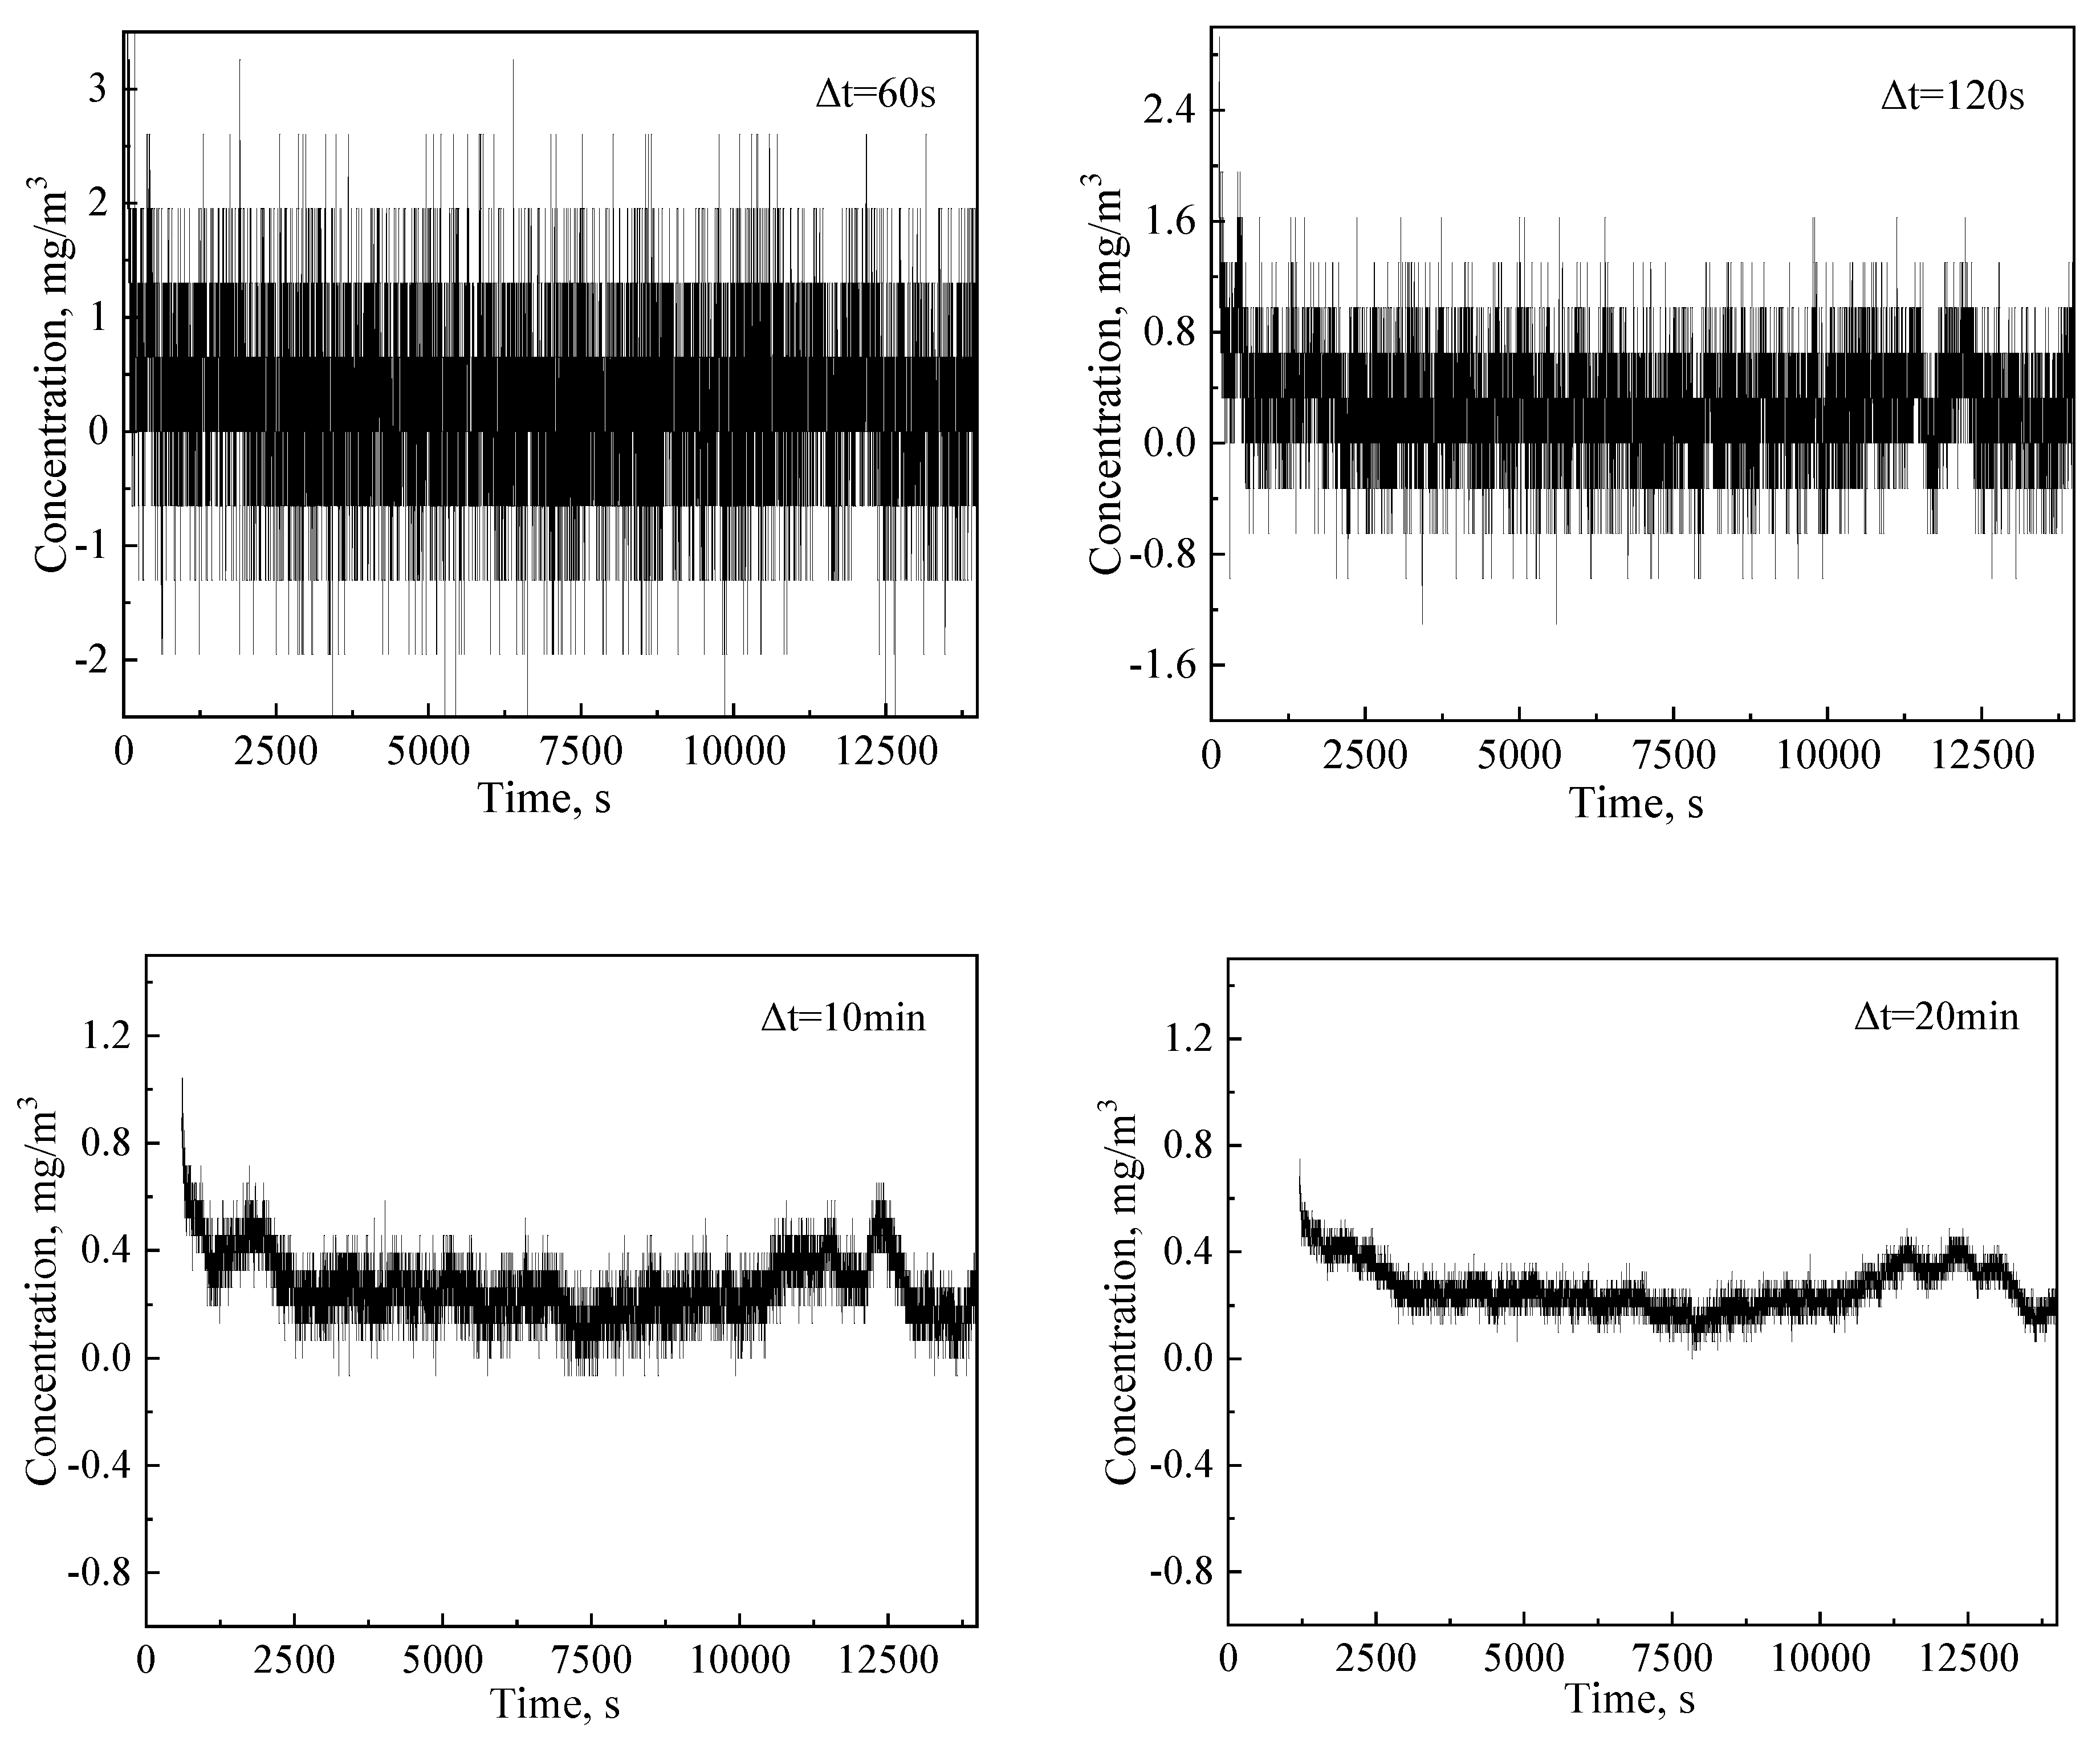
Figure 6.
PM2.5 concentration (Δt = 10 min) averaged every 20 s, 60 s, 120 s, and 300 s. The black line is the original concentration, and the red line is the averaged concentration.
Figure 6.
PM2.5 concentration (Δt = 10 min) averaged every 20 s, 60 s, 120 s, and 300 s. The black line is the original concentration, and the red line is the averaged concentration.
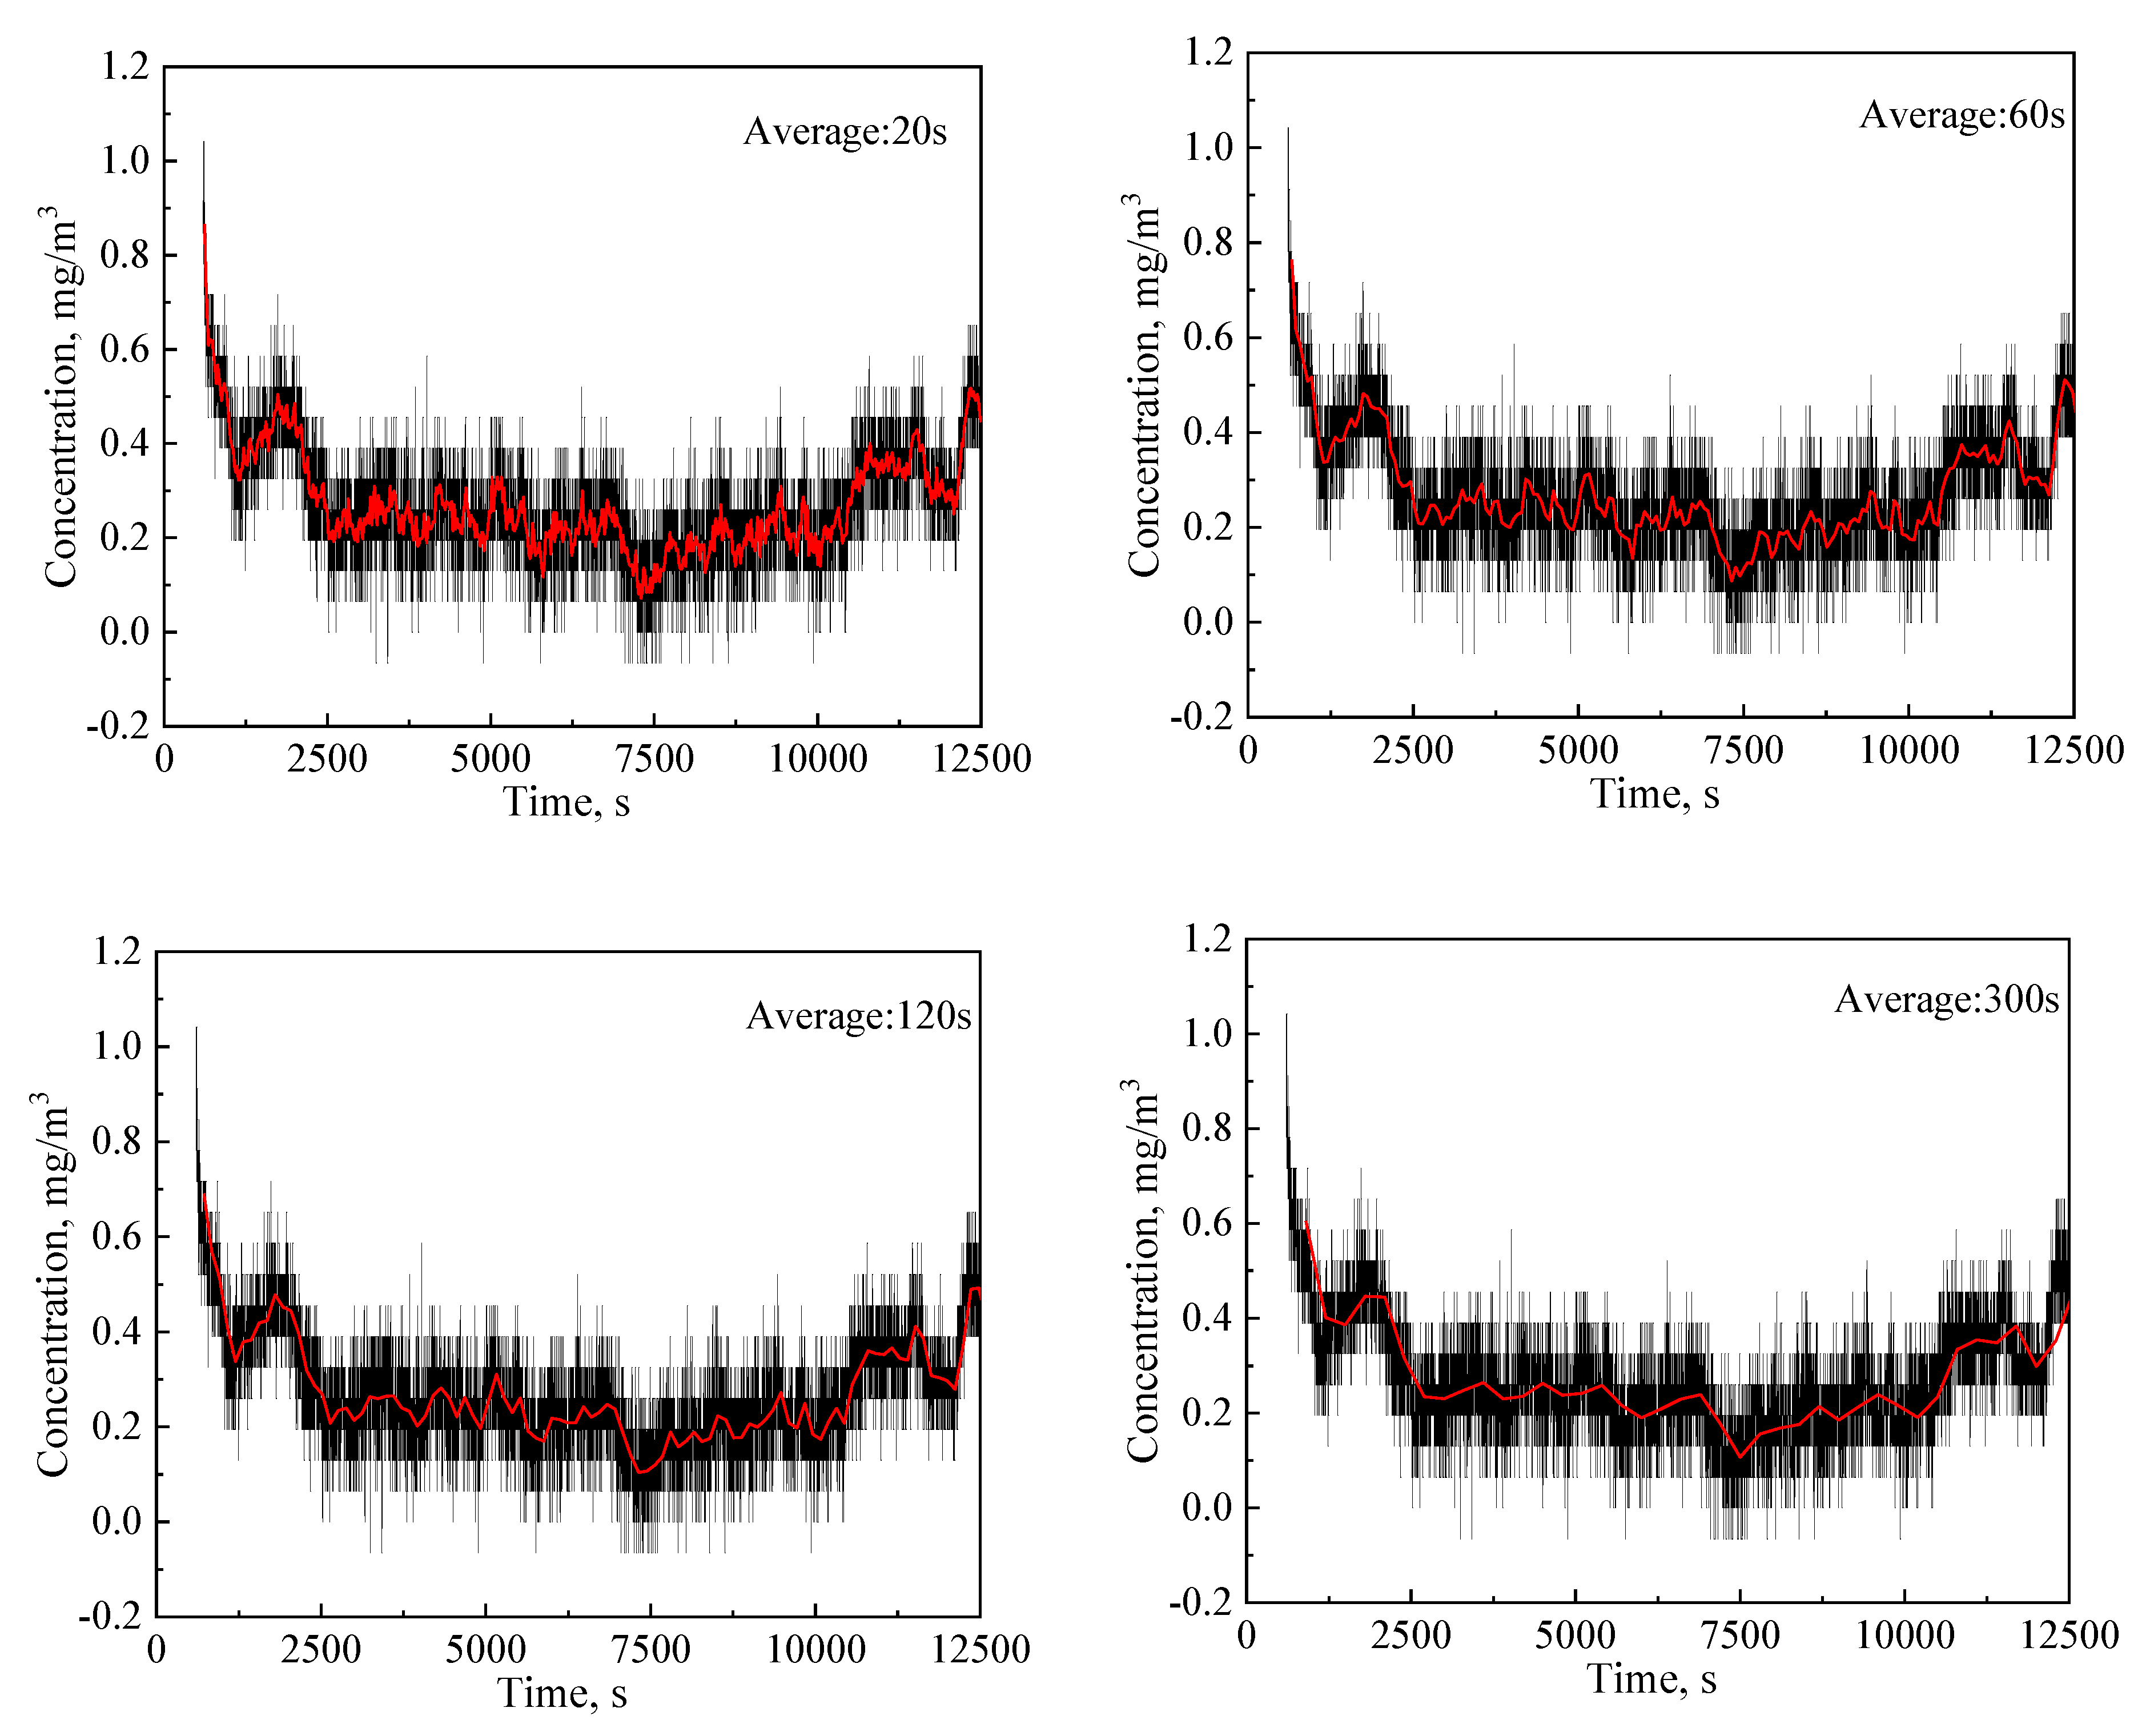
Figure 7.
(a) Variation of pressure with time in the cylindrical chamber with gradually decreasing PM2.5 concentration. (b) Variation of ΔP/Δt (Δt = 60 s) with time. (c) Comparison between PM2.5 concentration calibrated by the pressure data and recorded by Dusttrak. (d) Regression plots for PM2.5 mass concentration: pressure-based PM monitor vs. Dusttrak.
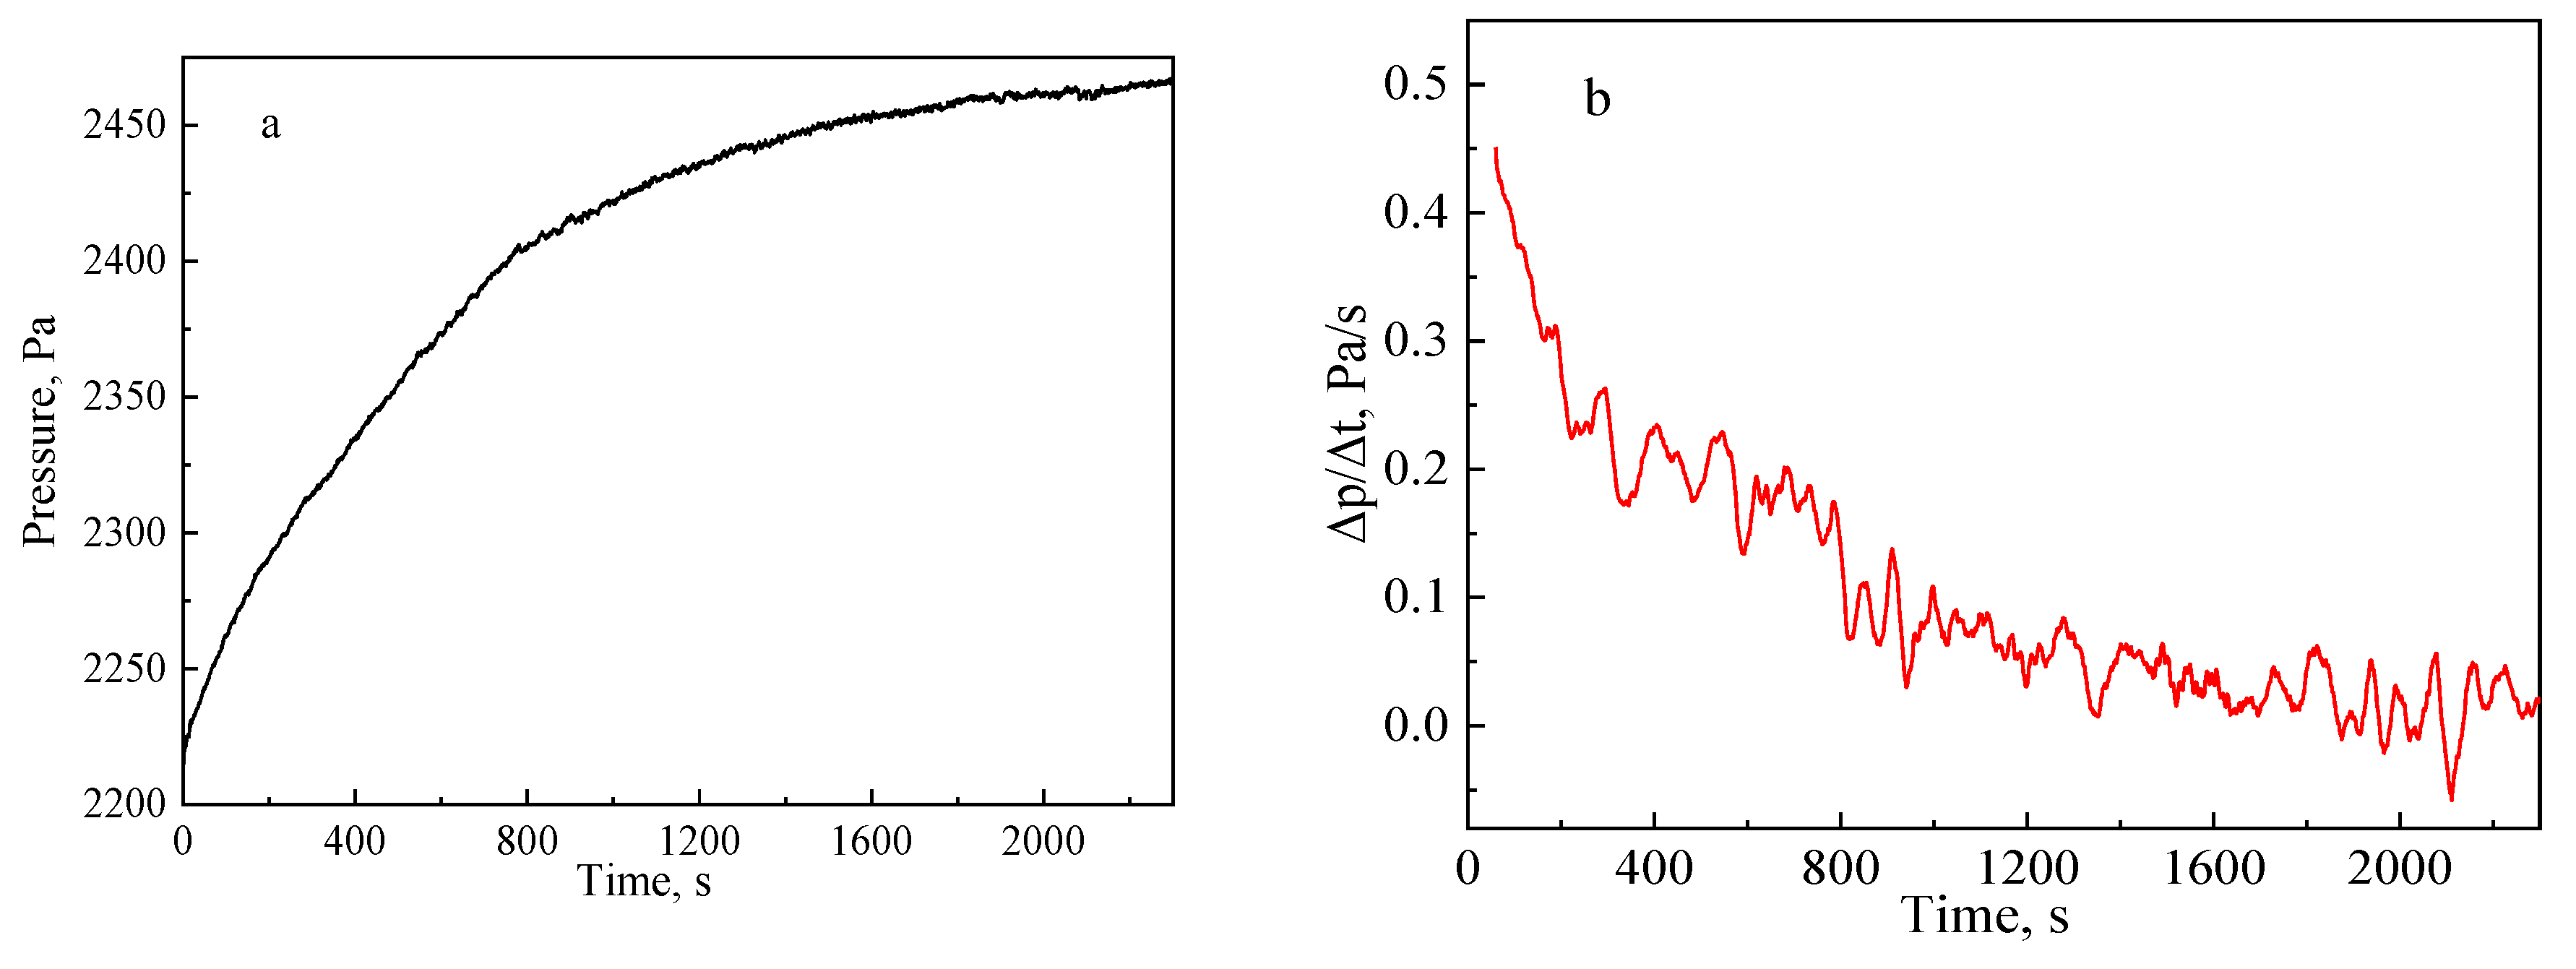

Figure 8.
(a) Variation of pressure with time in the cubic chamber with changing PM2.5 concentration. (b) Comparison between PM2.5 concentration calibrated by the pressure data and recorded by Dusttrak.
Figure 8.
(a) Variation of pressure with time in the cubic chamber with changing PM2.5 concentration. (b) Comparison between PM2.5 concentration calibrated by the pressure data and recorded by Dusttrak.
Publisher’s Note: MDPI stays neutral with regard to jurisdictional claims in published maps and institutional affiliations. |
© 2022 by the authors. Licensee MDPI, Basel, Switzerland. This article is an open access article distributed under the terms and conditions of the Creative Commons Attribution (CC BY) license (https://creativecommons.org/licenses/by/4.0/).
Share and Cite
MDPI and ACS Style
Li, J.; Zheng, L.; Xuan, P.; Huo, R. A Real-Time Approach to Detect PM2.5 in a Seriously Polluted Environment Based on Pressure Drop. Atmosphere 2022, 13, 1237. https://doi.org/10.3390/atmos13081237
AMA Style
Li J, Zheng L, Xuan P, Huo R. A Real-Time Approach to Detect PM2.5 in a Seriously Polluted Environment Based on Pressure Drop. Atmosphere. 2022; 13(8):1237. https://doi.org/10.3390/atmos13081237
Chicago/Turabian StyleLi, Jialin, Lina Zheng, Peng Xuan, and Ruiyan Huo. 2022. "A Real-Time Approach to Detect PM2.5 in a Seriously Polluted Environment Based on Pressure Drop" Atmosphere 13, no. 8: 1237. https://doi.org/10.3390/atmos13081237
Note that from the first issue of 2016, this journal uses article numbers instead of page numbers. See further details here.