
A Spatio-Temporal Weighted Filling Method for Missing AOD Values


1
School of Earth Sciences and Engineering, Hohai University, Nanjing 211100, China
2
College of Resources and Environment, University of Chinese Academy of Sciences, Beijing 100049, China
3
Yanshan Earth Key Zone and Surface Flux Observation and Research Station, University of Chinese Academy of Sciences, Beijing 101408, China
*
Authors to whom correspondence should be addressed.
Atmosphere 2022, 13(7), 1080; https://doi.org/10.3390/atmos13071080
Submission received: 25 May 2022
/
Revised: 5 July 2022
/
Accepted: 6 July 2022
/
Published: 8 July 2022
(This article belongs to the Special Issue Feature Papers in Aerosol Research)
Abstract
:Aerosol Optical Depth (AOD) is a key parameter in defining the characteristics of atmospheric aerosols, evaluating atmospheric pollution, and studying aerosol radiative climate effects. However, a large amount of the AOD data obtained by satellite remote sensing are missing due to cloud cover and other factors. To obtain AOD data with continuous distribution in space, this study considers the spatial and temporal correlation of AOD and proposes a spatio-temporal weighted filling method based on a sliding window to supply the missing AOD data blocks. The method uses the semivariogram and autocorrelation function to judge the spatial and temporal correlation of AOD and uses the AOD spatial autocorrelation threshold as the sliding window size, and then it builds a spatio-temporal weighted model for each window to fill in the missing values. We selected the area with full values for simulation. The results show that the accuracy of this method has been significantly improved compared with the mean filling method. The reaches 0.751, the is 0.021, and the filling effect is smoother. Finally, this method was used to fill in the missing values of the MultiAngle Implementation of Atmospheric Correction (MAIAC) AOD in the Beijing–Tianjin–Hebei region in 2019, and AErosol RObotic NETwork (AERONET) AOD was used as the true value for testing. The results show that the filled AOD has a high correlation with AERONET AOD, the is 0.785, and the is 0.120. A summary of the AOD values of the 13 cities in the Beijing–Tianjin–Hebei region shows that the values in the first and third quarters are higher than those in the second and fourth quarters, with the highest AOD value in March and the second highest in August; among the 13 cities, the AOD values in Chengde and Zhangjiakou are lower than those in the other cities.
1. Introduction
Atmospheric aerosols are colloidal multiphase systems composed of liquid or solid particles suspended in the atmosphere, generally ranging in size from 0.001 to 100 μm. As an important part of the atmosphere, aerosol particles affect surface temperature and atmospheric circulation by scattering and absorbing solar radiation, and they can also change the optical properties and lifespan of clouds, affecting cloud radiation and precipitation [1,2,3,4]. High-density social activities can greatly increase the amount of aerosols in the atmosphere, with significant impacts on the global climate system and ecosystems, and exposure to environmental aerosols can damage the human respiratory and cardiovascular systems [5]. The research on the impact of atmospheric aerosols on environmental climate change mainly depends on understanding its temporal and spatial distribution and the accurate estimation of its optical properties (optical thickness, asymmetry factor, single scattering albedo, etc.) [6,7]. AOD is a key parameter in identifying the characteristics of atmospheric aerosols. It is defined as the integral of the extinction coefficient of the medium in the vertical direction, describing the reduction effect of aerosol on light, and is a key factor in evaluating atmospheric pollution and studying the effects of aerosol radiation on climate. An accurate description of the spatial and temporal distribution of AOD can provide a reference for the study of air pollution and health, which is a guide for the healthy development of cities.
At present, the acquisition of AOD mainly occurs through two methods: ground or site monitoring and satellite remote sensing. Although the data obtained through ground monitoring sites have high accuracy, the sites are scarce and cannot meet large-scale research needs. When the spatial scale of the study area is relatively large, satellite remote sensing data can be used. With the vigorous development of remote sensing technology, a large number of remote sensing satellites can be used to obtain AOD data, such as GF-4, Himawari-8, FY-4A, Terra, Aqua, and Suomi-NPP. MODIS sensors mounted on Terra and Aqua satellites are currently the most widely used sensors for global aerosol retrieval. However, due to the algorithm itself, AOD data are missing. For example, the DT algorithm cannot retrieve bright areas with high surface reflectivity [8]. The AOD value of the clouds, snow, and ice polluted areas cannot be obtained using the DB algorithm [9,10]. To better describe the spatial distribution characteristics of AOD, it is necessary to fill in the non-random missing AOD.
There are three main ways to fill AOD. The first is to consider that the value of AOD will be affected by various factors and establish a relationship model between AOD and its influencing factors for filling. For example, Xiao et al. used cloud cover, temperature, humidity, altitude, and CTM AOD to establish a multiple imputation model to fill the MAIAC AOD [11]. Jung et al. established the relationship between AOD and its impact factors to achieve the filling effect based on the random forest model [12]. Song et al. considered the relationship between AOD and PM2.5 and used PM2.5 data from ground monitoring sites as estimation factors to construct a spatio-temporal linear mixed effect model and a spatio-temporal nested linear mixed effect model to fill in the AOD in the Beijing–Tianjin–Hebei region [13]. Guo et al. established the relationship among AOD and SO2, NO2, PM2.5, meteorology, and other influencing factors in the North China Plain based on the extreme gradient boosting model and filled the data [14]. It is very effective, because it uses influencing factors to estimate the missing data, but we usually cannot know all the factors that affect AOD, so the accuracy of the established model has certain defects.
The second is to fill in the missing AOD data using multi-source data fusion for the AOD obtained from the satellites. For example, He et al. used the products of the MODIS DB algorithm to fill the AOD products of the MODIS DT algorithm and finally obtained the Chinese AOD data with a regional spatial resolution of 3 km [15]. Tang et al. fused the MODIS AOD product MOD04_L2 and the SeaWiFS AOD product SWDB_L2 based on the Bayesian Maximum Entropy (BME) method, and the average completeness of the combined AOD data was 95.2% [16]. Wang et al. used a large-scale Terra AOD image to restore missing pixels in Aqua AOD products, which improved the AOD coverage from 20.5% to 45.9% [17]. However, in regions with cloud cover and high surface reflectance, AOD data obtained from different satellites are missing, so when the missing AOD data are filled using this method, the filling is not effective in such cases.
The third is to fill the AOD based on its own distribution characteristics. For example, Zhang et al. used the mean value of the pixels around the missing value to completely fill in the AOD data for Shijiazhuang City [18]. Although this method can achieve 100% filling, for areas with a large missing range, filling takes place several times, causing errors to accumulate.
The AOD data obtained by satellite remote sensing are often missing a large range, and there will be significant errors when filling it with the data of the spatial dimension. The residual aerosol in the residual layer at night will become a source of boundary layer aerosol formation the next day [19]. Therefore, the temporal correlation between AOD data can be considered, and the missing positions can be filled in to avoid inaccurate results caused by using spatial data only when significant AOD data are missing. Accordingly, this paper will use the spatio-temporal weighted model to fill in the missing AODs from the two dimensions of time and space.
2. Data and Methods
2.1. Data
2.1.1. MAIAC AOD
NASA released MCD19A2, a secondary AOD product from the Terra and Aqua satellites, in 2018 [20]. The product is produced based on the MAIAC and has undergone cloud removal, atmospheric correction, and other processing. Compared with the data obtained by the MODIS DB algorithm and the DT algorithm, the accuracy and coverage rate have improved. The Beijing–Tianjin–Hebei region has the largest and most dynamic economy in Northern China, so this paper will focus on the Beijing–Tianjin–Hebei region as the research area and the aerosol optical depth in 2019 as the research object. The MCD19A2 data of the Beijing–Tianjin–Hebei region in 2019 were obtained from LAADS DAAC (https://ladsweb.modaps.eosdis.nasa.gov/, accessed on 14 October 2021). MCD19A2 not only contains daily AOD data at 470 nm and 550 nm with a spatial resolution of 1 km 1 km, but also includes the AOD_QA dataset describing the quality of AOD data. MAIAC AOD at 550 nm (SDS name: Optical_Depth_055) from Terra and Aqua were retrieved, where the retrieved MAIAC AOD data CloudMask and AdjacencyMask attributes are both Clear (SDS name: AOD_QA). MAIAC AOD of the Terra and Aqua satellites was simply linearly fused to improve the coverage rate of the AOD. As shown in Figure 1, in which the left panel shows the geographic location of the study area, the right panel shows the missing AOD, the horizontal coordinate is the rate of missing AOD in a day, and the vertical coordinate is the number of days in 2019 that this missing rate accounts for, there were 187 days in 2019 when the fused AOD data for the Beijing–Tianjin–Hebei region had a missing rate of 50% or more, of which 42 days had a missing rate greater than 90%.
2.1.2. AERONET AOD
AERONET is a global land-based remote sensing aerosol network that provides AOD data at quality levels 1.0, 1.5, and 2.0 that can be used to examine satellite aerosol data, with the 2.0 data are de-clouded and quality assured, with pre-field and post-field calibration applied [21]. Aerosol products from MODIS and ground-observed aerosol data have been evaluated and compared, showing a strong correlation between the two [22,23]. Therefore, the ground-based aerosol data can be used to validate the filled satellite aerosol data. There are two monitoring stations (Beijing [39.977° N, 116.381° E] and Beijing-CAMS [39.933° N, 116.317° E]) in the Beijing–Tianjin–Hebei region for which level 2.0 data exist for 2019, with station data obtained from the Goddard Space Flight Center (https://aeronet.gsfc.nasa.gov/, accessed on 4 January 2022). However, the network does not provide an AOD at 550 nm, so the AOD data at 500 nm and 675 nm must be interpolated to obtain the data at 550 nm.
2.2. Method
2.2.1. Spatio-Temporal Correlation Detection
Everything is related to something around it, and the closer it is, the more closely it is connected. The semi-variance function in geostatistics describes the scale dependence of the spatial correlation of features. Reflecting changes in spatial correlation due to changes in scale can be calculated by plotting the variance of feature attribute values with distance [24]. The range of variation of the semi-variance function curve is the threshold of spatial autocorrelation between the image elements; when the spatial distance between the image elements exceeds the range of variation, the correlation is not obvious.
The autocorrelation function (ACF) describes the time series and lagged th order autocovariance function (i.e., the correlation between observations at k time units [ and ] in the time series) and measures the impact of historical data on the present.
2.2.2. Spatio-Temporal Weighted Model
The spatio-temporal weighted model can consider both spatial and temporal correlation and weigh the data in the temporal and spatial dimensions. The missing data are filled in using the sliding window, as shown in Figure 2, in which the area surrounded by red dashed lines is the current area to be filled, gray is the data presence, white is the data absence, blue is the value after filling, the maximum missing area of the current area corresponds to the radius , and the number of AOD presence pixels is . A temporal fit and a spatial fit with different radii are performed for the locations where the AOD values exist. Red is the target image element and gray the reference image element, and when the reference image element is missing at the corresponding time location, the data from a small area at that location can be used as a reference. From the spatial fit and temporal fit values, the fit matrix is formed.
where is the spatial fit of the th image element with radius and is the temporal fit of the th image element. Then the root mean square error of the spatio-temporal weighted fit with radius is:
where is the pixel value of the th image element, the is minimized when . is the time weight of the current region when the missing radius is , and the image elements with missing radius are filled using this weight. The final predicted value of the image element to be repaired is:
where is the spatial fit of the image to be repaired and is the temporal fit of the image to be repaired.
3. Experiments and Results Analysis
AOD data with a daily spatial resolution of 1 km can be obtained from MCD19A2. The aerosols remaining in the residual layer at night will impact the aerosols in the boundary layer the next day. Therefore, the temporal and spatial correlation of AOD data can be considered to fill in the missing AOD data.
3.1. Spatial Correlation
A spatial correlation analysis was performed using the semi-variance function for the data on the first day of each quarter, as shown in Figure 3, where (a)–(d) represent the semi-variance function curves for the four quarters. The results show a strong spatial correlation between the data in the range of about 125 km, while beyond this range, the spatial correlation is not significant. When the missing spatial distance of AOD data exists at more than 125 km, filling with data of the spatial dimension will cause inaccurate filling results.
3.2. Time Correlation
The data for 2019 were analyzed for temporal correlation, as shown in Figure 4, and the vertical coordinates indicate the covariance of the AOD data with a lag of k days. The results indicate that the AOD data have temporal autocorrelation in the short term, so their temporal correlation can be considered for filling when filling them.
AOD data have spatial correlation in a certain range and temporal correlation in a short period, so it is necessary to consider both temporal and spatial dimensions when filling them, especially when the missing range of AOD data is more extensive than the spatial autocorrelation threshold, as it becomes more necessary to fill them using the temporal dimension data.
3.3. Spatio-Temporal Weighted
When all the images around the target image element are present, the target image element is repaired. Ten regions with fully present AOD data were selected, and one image element to be recovered in each region was chosen for the temporal fitting and spatial fitting experiments, respectively. As shown in Figure 5, in space, the smaller the radius of the selected reference image element, the better the fitting effect (Figure 5b); in time, the data of the day before and after as the reference image is better than the two days before and after (Figure 5c), and when all the images around the target image are present, the spatial fitting effect is higher than the temporal fitting effect.
When the data around the target image element are missing for a large area, the spatial fit becomes poor, and the temporal fit is independent of the current missing range. Eight sets of experiments were performed by selecting regions where the data were fully present. Figure 6 shows the eight results after the spatio-temporal weighted fitting, where the horizontal coordinate represents the missing radius, and the vertical coordinate represents 100 times of the time weight. The colors denote the . The larger the missing radius, the larger the , because when the AOD is missing in a large area, the spatially selectable reference image element is too far away from the target image element, and the correlation becomes weaker, resulting in a larger error. The blue line in each set of experiments is the time weight corresponding to the smallest of the current missing radius of the time-weighted fit, and it shows that the larger the missing radius, the larger the time weight, so when the AOD data are missing for a large area, the temporal weight can be added to fit the missing values to improve fitting accuracy.
3.4. Results Analysis
Based on the sliding window approach to fill the AOD data for the Beijing–Tianjin–Hebei regions, the window size is the threshold value of the spatial autocorrelation of AOD (i.e., the range of the semi-variance function curve), and the missing values of the current window are filled using the spatio-temporal weighting method.
Select a region where the data is completely present, randomly select the missing positions within the region for filling and compare the filling results of this method with those of the mean filling method. As shown in Figure 7, where (a) is the case of the data itself, (b) is the case after randomly selecting missing values, (c) is the result after mean fill, and (d) is the result of filling using the method proposed in this paper. It can be seen that (d) is smoother than (c) and closer to the original figure, so the filling effect of the method proposed in this paper is better than that of mean filling. Figure 8 presents a comparison of the accuracy of the two filling methods. The results show that the filling results of the method proposed in this paper have smaller differences than those obtained using the mean filling method, and the using mean filling is 0.470 and the is 0.029, while the of the method proposed in this paper is 0.751 and the is 0.021; thus, the filling accuracy is significantly improved.
The method proposed in this paper was used to populate the AOD data of the Beijing–Tianjin–Hebei region in 2019, and the final populated results were compared with the AERONET AOD data. As depicted in Figure 9, the horizontal coordinates are the AERONET AOD, the vertical coordinates are the MAIAC AOD after filling, and the solid black line shows the linear regression relationship between the filled AOD and AERONET AOD. The results show that the filled AOD is highly correlated with AERONET AOD, with an of 0.785 and of 0.12, so the method proposed in this paper is suitable for filling in the missing values of MAIAC AOD. However, the MAIAC AOD populated based on this method was overestimated relative to the AERONET AOD in the Beijing–Tianjin–Hebei region. This is due to the error in calculating the regression coefficients of surface reflectance at different wavelengths when using the MAIAC algorithm to invert the aerosol optical thickness, resulting in the overestimation of MAIAC AOD.
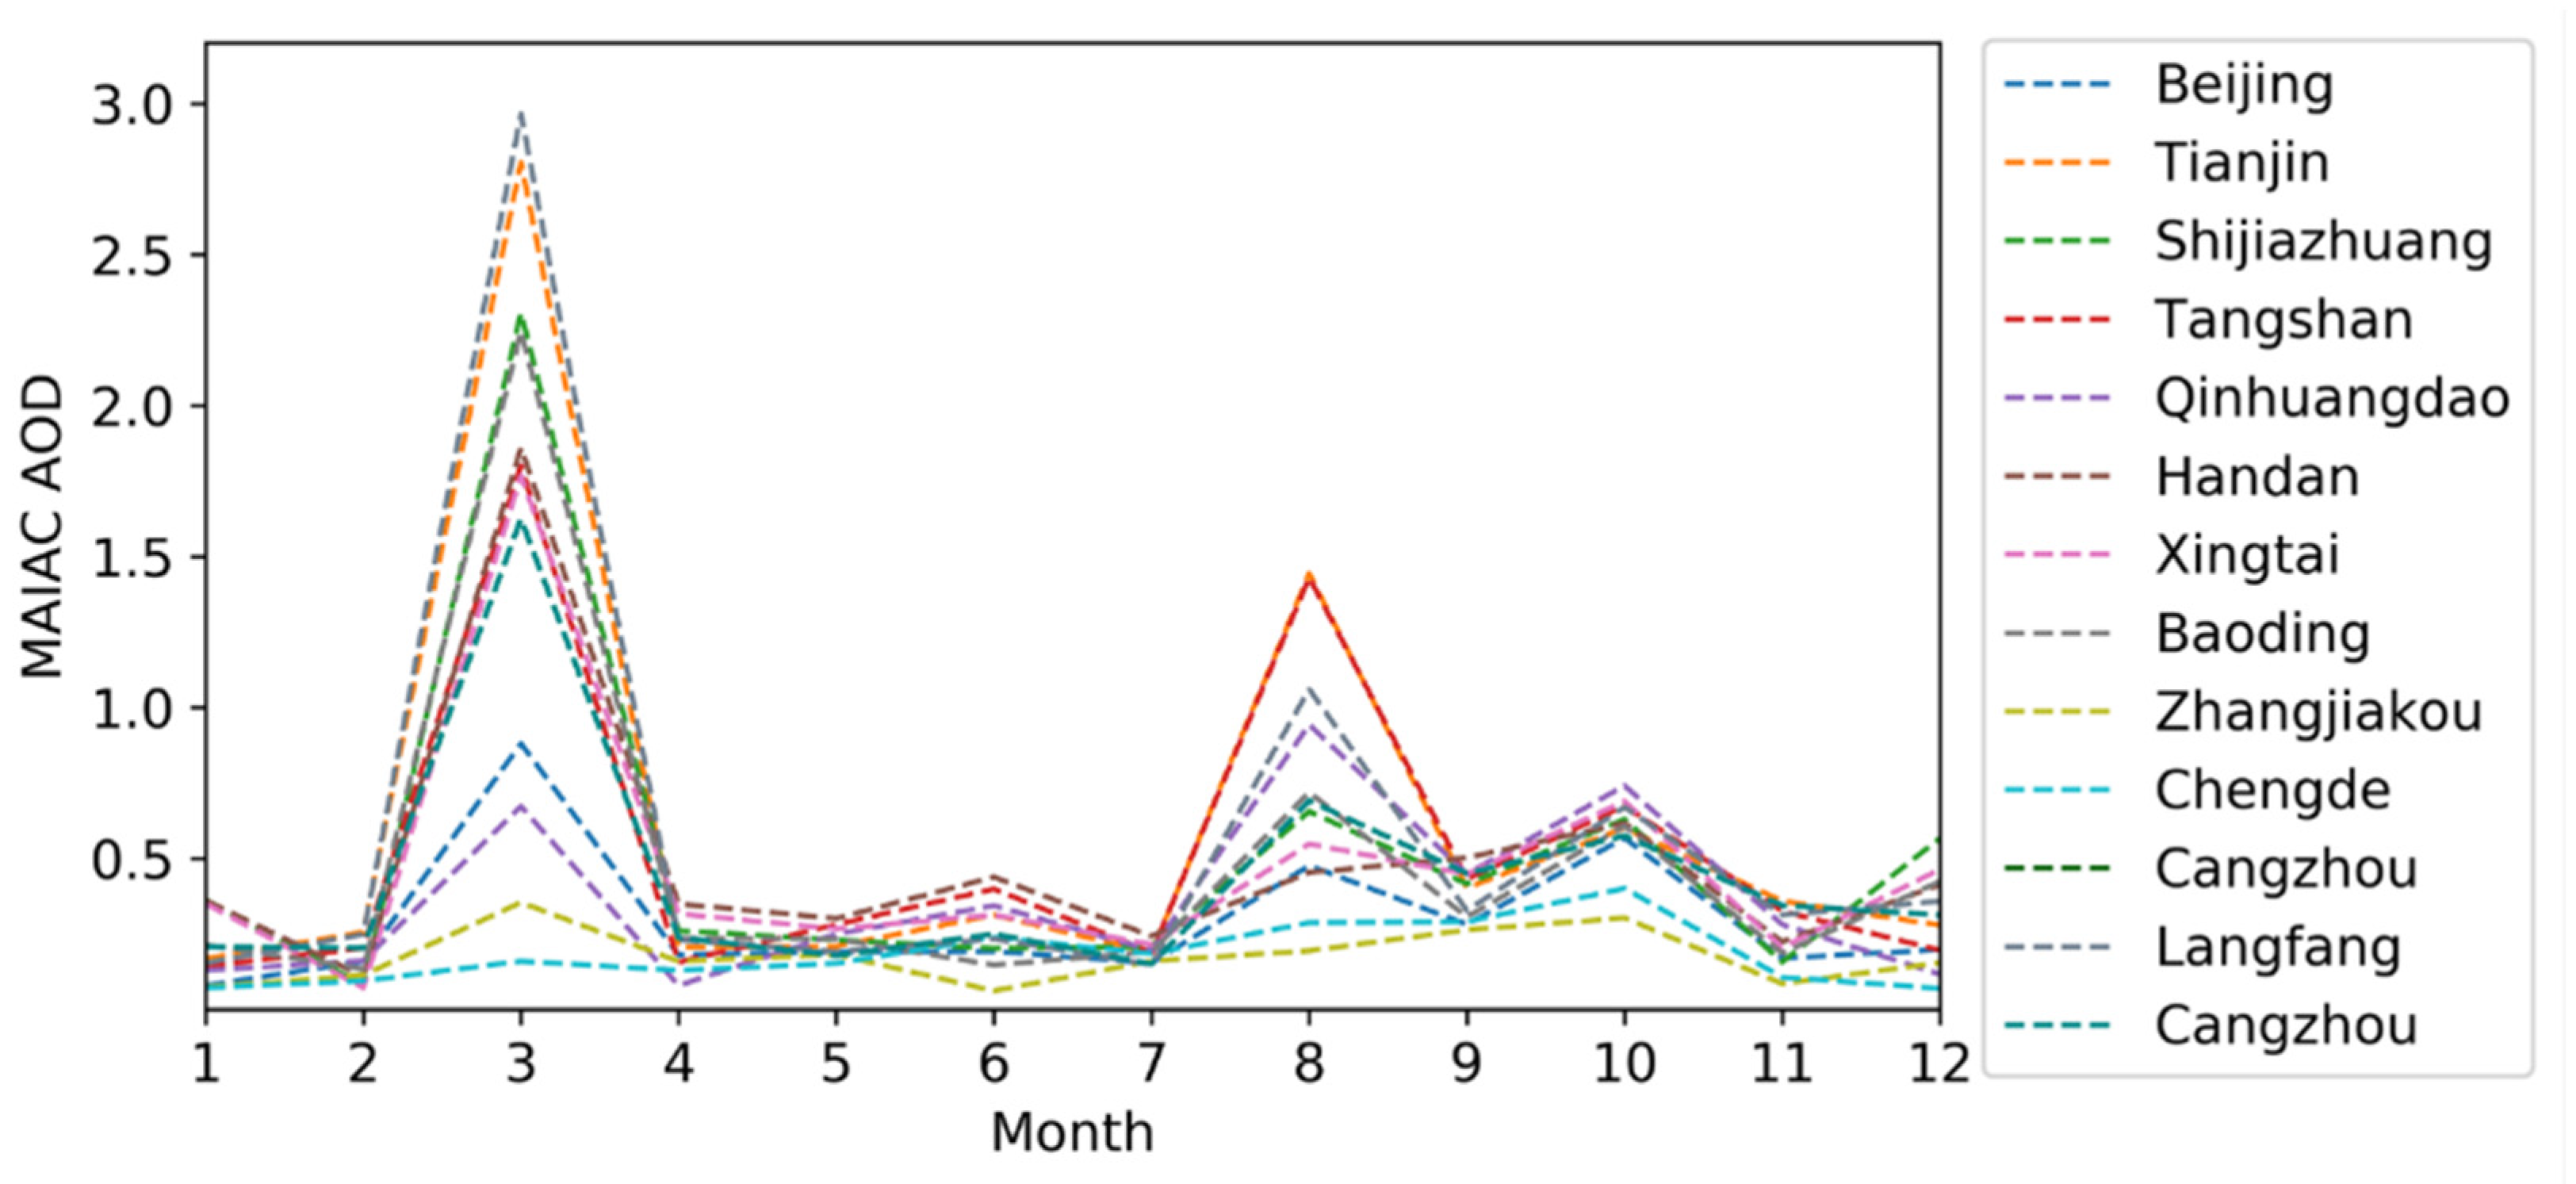
The populated AOD data are summarized by city, and Figure 10 shows the average value of AOD for each city on the first day of each month. Overall, the values in the first and third quarters are higher than those in the second and fourth quarters, with the highest AOD value in March and the second highest in August. This phenomenon is caused by the low vegetation cover and sandy weather in spring that promotes the production of new particles, resulting in higher AOD. The interaction of hot weather and large amounts of moisture in the air during the summer promotes the growth of aerosol particles, resulting in higher AOD in the summer. Among the 13 cities, the AOD values in Chengde and Zhangjiakou are lower than those in the other cities.
4. Conclusions
In this paper, the spatial correlation and temporal correlation of AOD were analyzed by using the semi-covariance function and autocorrelation function respectively. The results showed that AOD has a short-lived temporal correlation, and a spatial correlation within a certain range. However, when the distance exceeds 125 km, the spatial correlation of AOD is not obvious, so when a large range of AOD data are missing, the effect will become worse when using spatial data only for filling. Nevertheless, the fitting effect in time is not related to the current missing range. Therefore, this paper proposes a spatio-temporal weighting method based on the sliding window approach, which considers both the temporal and spatial dimensions of the data on the missing values and fills in the AOD data in chunks. The optimal temporal and spatial weights for missing radii are calculated based on the values already present in the AOD in each region, and the missing values in that region are filled using this weight. Selecting the region with complete values and randomly choosing the missing positions for filling, is 0.751 and is 0.021. Compared with the mean filling method, the filling accuracy of the method proposed in this paper is significantly improved, and the filling results are smoother.
Finally, the method proposed in this paper was used to fill in the missing values in the Beijing–Tianjin–Hebei region in 2019 using AERONET AOD as the true value. The filled AOD was highly correlated with AERONET AOD with an of 0.785 and of 0.120, indicating that the method proposed in this paper is suitable for filling in the missing MAIAC AOD values for air pollution and health research and serves as a reference. A summary of the statistics of the AOD values of thirteen cities in the Beijing–Tianjin–Hebei region shows that the values in the first and third quarters are higher than those in the second and fourth quarters, with the highest AOD value in March and the second highest in August; among the 13 cities, the AOD values in Chengde and Zhangjiakou are lower than those in the other cities.
A sliding window-based spatio-temporal weighted filling method to fill the missing AOD data is proposed, which can solve the problem of large area missing of AOD data acquired by satellite due to cloud cover occlusion and other reasons, and finally obtain high precision spatially continuous distribution of AOD data, which can provide data support for atmospheric pollution and health research.
Author Contributions
Conceptualization, R.G. and X.R.; methodology, R.G. and X.R.; software, R.G. and X.R.; validation, R.G. and X.R.; formal analysis, R.G., X.R. and J.T.; investigation, R.G., X.R. and J.T.; resources, X.R. and J.T.; data curation, R.G., X.R. and J.T.; writing—original draft preparation, R.G. and X.R.; writing—review and editing, R.G. and X.R.; visualization, R.G. and X.R.; supervision, R.G. and X.R.; project administration, R.G. and X.R.; funding acquisition, R.G. and X.R. All authors have read and agreed to the published version of the manuscript.
Funding
This research was funded by the National Key Research and Development Program of China (Grant No. 2019YFC1804304), the National Natural Science Foundation of China (Grant No. 41771478), and the Fundamental Research Funds for the Central Universities (Grant No. 2019B02514).
Institutional Review Board Statement
Not applicable.
Informed Consent Statement
Not applicable.
Data Availability Statement
Not applicable.
Acknowledgments
The authors gratefully acknowledge NASA for providing MAIAC AOD and AERONET AOD data.
Conflicts of Interest
The authors declare no conflict of interest.
References
- Kaiser, D.P.; Qian, Y. Decreasing Trends in Sunshine Duration over China for 1954–1998: Indication of Increased Haze Pollution? Geophys. Res. Lett. 2002, 29, 38-1–38-4. [Google Scholar] [CrossRef]
- Hallquist, M.; Wenger, J.C.; Baltensperger, U.; Rudich, Y.; Simpson, D.; Claeys, M.; Dommen, J.; Donahue, N.M.; George, C.; Goldstein, A.H. The Formation, Properties and Impact of Secondary Organic Aerosol: Current and Emerging Issues. Atmospheric Chem. Phys. 2009, 9, 5155–5236. [Google Scholar] [CrossRef] [Green Version]
- Stocker, T.F.; Qin, D.; Plattner, G.K.; Tignor, M.; Allen, S.K.; Boschung, J.; Nauels, A.; Xia, Y.; Bex, V.; Midgley, P.M. Contribution of Working Group I to the Fifth Assessment Report of the Intergovernmental Panel on Climate Change; Cambridge University Press: Cambridge, UK; New York, NY, USA, 2013; Chapter 5; pp. 1–1552. [Google Scholar]
- Rosenfeld, D.; Dai, J.; Yu, X.; Yao, Z.; Xu, X.; Yang, X.; Du, C. Inverse Relations between Amounts of Air Pollution and Orographic Precipitation. Science 2007, 315, 1396–1398. [Google Scholar] [CrossRef] [PubMed] [Green Version]
- Salzmann, M.; Weser, H.; Cherian, R. Robust Response of Asian Summer Monsoon to Anthropogenic Aerosols in CMIP5 Models. J. Geophys. Res. Atmos. 2014, 119, 11–321. [Google Scholar] [CrossRef]
- Guo, J.; Su, T.; Chen, D.; Wang, J.; Li, Z.; Lv, Y.; Guo, X.; Liu, H.; Cribb, M.; Zhai, P. Declining Summertime Local-Scale Precipitation Frequency over China and the United States, 1981–2012: The Disparate Roles of Aerosols. Geophys. Res. Lett. 2019, 46, 13281–13289. [Google Scholar] [CrossRef] [Green Version]
- Vivone, G.; Arienzo, A.; Bilal, M.; Garzelli, A.; Pappalardo, G.; Lolli, S. A Dark Target Kalman Filter Algorithm for Aerosol Property Retrievals in Urban Environment Using Multispectral Images. Urban Clim. 2022, 43, 101135. [Google Scholar] [CrossRef]
- Kaufman, Y.J.; Tanré, D.; Remer, L.A.; Vermote, E.F.; Chu, A.; Holben, B.N. Operational Remote Sensing of Tropospheric Aerosol over Land from EOS Moderate Resolution Imaging Spectroradiometer. J. Geophys. Res. Atmos. 1997, 102, 17051–17067. [Google Scholar] [CrossRef]
- Hsu, N.C.; Tsay, S.-C.; King, M.D.; Herman, J.R. Aerosol Properties over Bright-Reflecting Source Regions. IEEE Trans. Geosci. Remote Sens. 2004, 42, 557–569. [Google Scholar] [CrossRef]
- Gupta, P.; Levy, R.C.; Mattoo, S.; Remer, L.A.; Munchak, L.A. A Surface Reflectance Scheme for Retrieving Aerosol Optical Depth over Urban Surfaces in MODIS Dark Target Retrieval Algorithm. Atmos. Meas. Tech. 2016, 9, 3293–3308. [Google Scholar] [CrossRef] [Green Version]
- Xiao, Q.; Wang, Y.; Chang, H.H.; Meng, X.; Geng, G.; Lyapustin, A.; Liu, Y. Full-Coverage High-Resolution Daily PM2.5 Estimation Using MAIAC AOD in the Yangtze River Delta of China. Remote Sens. Environ. 2017, 199, 437–446. [Google Scholar]
- Jung, C.-R.; Chen, W.-T.; Nakayama, S.F. A National-Scale 1-Km Resolution PM2.5 Estimation Model over Japan Using Maiac Aod and a Two-Stage Random Forest Model. Remote Sens. 2021, 13, 3657. [Google Scholar] [CrossRef]
- Song, C.; Wei, Q.; Fan, L. Filling the Missing Data of AOD Using the Situ PM2.5 Monitoring Measurements in the Beijing-Tianjin-Hebei Region. China Environ. Sci. 2022, 1–16. [Google Scholar] [CrossRef]
- Guo, L.; Meng, F.; Ma, M. Spatiotemporal Variation and Influencing Factors of AOD in the North China Plain. Environ. Sci. 2022, 43, 3483–3493. [Google Scholar] [CrossRef]
- He, Q.; Huang, B. Satellite-Based Mapping of Daily High-Resolution Ground PM2.5 in China via Space-Time Regression Modeling. Remote. Sens. Environ. 2018, 206, 72–83. [Google Scholar] [CrossRef]
- Tang, Q.; Bo, Y.; Zhu, Y. Spatiotemporal Fusion of Multiple-Satellite Aerosol Optical Depth (AOD) Products Using Bayesian Maximum Entropy Method. J. Geophys. Res. Atmos. 2016, 121, 4034–4048. [Google Scholar] [CrossRef] [Green Version]
- Wang, Y.; Yuan, Q.; Li, T.; Shen, H.; Zheng, L.; Zhang, L. Large-Scale MODIS AOD Products Recovery: Spatial-Temporal Hybrid Fusion Considering Aerosol Variation Mitigation. ISPRS J. Photogramm. Remote Sens. 2019, 157, 1–12. [Google Scholar] [CrossRef]
- Zhang, G.; Lu, H.; Dong, J.; Poslad, S.; Li, R.; Zhang, X.; Rui, X. A Framework to Predict High-Resolution Spatiotemporal PM2.5 Distributions Using a Deep-Learning Model: A Case Study of Shijiazhuang, China. Remote Sens. 2020, 12, 2825. [Google Scholar] [CrossRef]
- Liu, B.; Ma, Y.; Shi, Y.; Jin, S.; Jin, Y.; Gong, W. The Characteristics and Sources of the Aerosols within the Nocturnal Residual Layer over Wuhan, China. Atmos. Res. 2020, 241, 104959. [Google Scholar] [CrossRef]
- Lyapustin, A.; Wang, Y.; Korkin, S.; Huang, D. MODIS Collection 6 MAIAC Algorithm. Atmos. Meas. Tech. 2018, 11, 5741–5765. [Google Scholar] [CrossRef] [Green Version]
- Giles, D.M.; Sinyuk, A.; Sorokin, M.G.; Schafer, J.S.; Smirnov, A.; Slutsker, I.; Eck, T.F.; Holben, B.N.; Lewis, J.R.; Campbell, J.R. Advancements in the Aerosol Robotic Network (AERONET) Version 3 Database–Automated near-Real-Time Quality Control Algorithm with Improved Cloud Screening for Sun Photometer Aerosol Optical Depth (AOD) Measurements. Atmos. Meas. Tech. 2019, 12, 169–209. [Google Scholar] [CrossRef] [Green Version]
- Filonchyk, M.; Hurynovich, V. Validation of MODIS Aerosol Products with AERONET Measurements of Different Land Cover Types in Areas over Eastern Europe and China. J. Geovisualization Spat. Anal. 2020, 4, 10. [Google Scholar] [CrossRef]
- Wang, Y.; Yuan, Q.; Li, T.; Shen, H.; Zheng, L.; Zhang, L. Evaluation and Comparison of MODIS Collection 6.1 Aerosol Optical Depth against AERONET over Regions in China with Multifarious Underlying Surfaces. Atmos. Environ. 2019, 200, 280–301. [Google Scholar] [CrossRef] [Green Version]
- Ming, D.; Qiu, Y.; Zhou, W. Applying Spatial Statistics into Remote Sensing Pattern Recognition: With Case Study of Cropland Extraction Based on GeOBIA. Acta Geod. Cartogr. Sin. 2016, 45, 825–833. [Google Scholar]
Figure 1.
Overview of the study area.
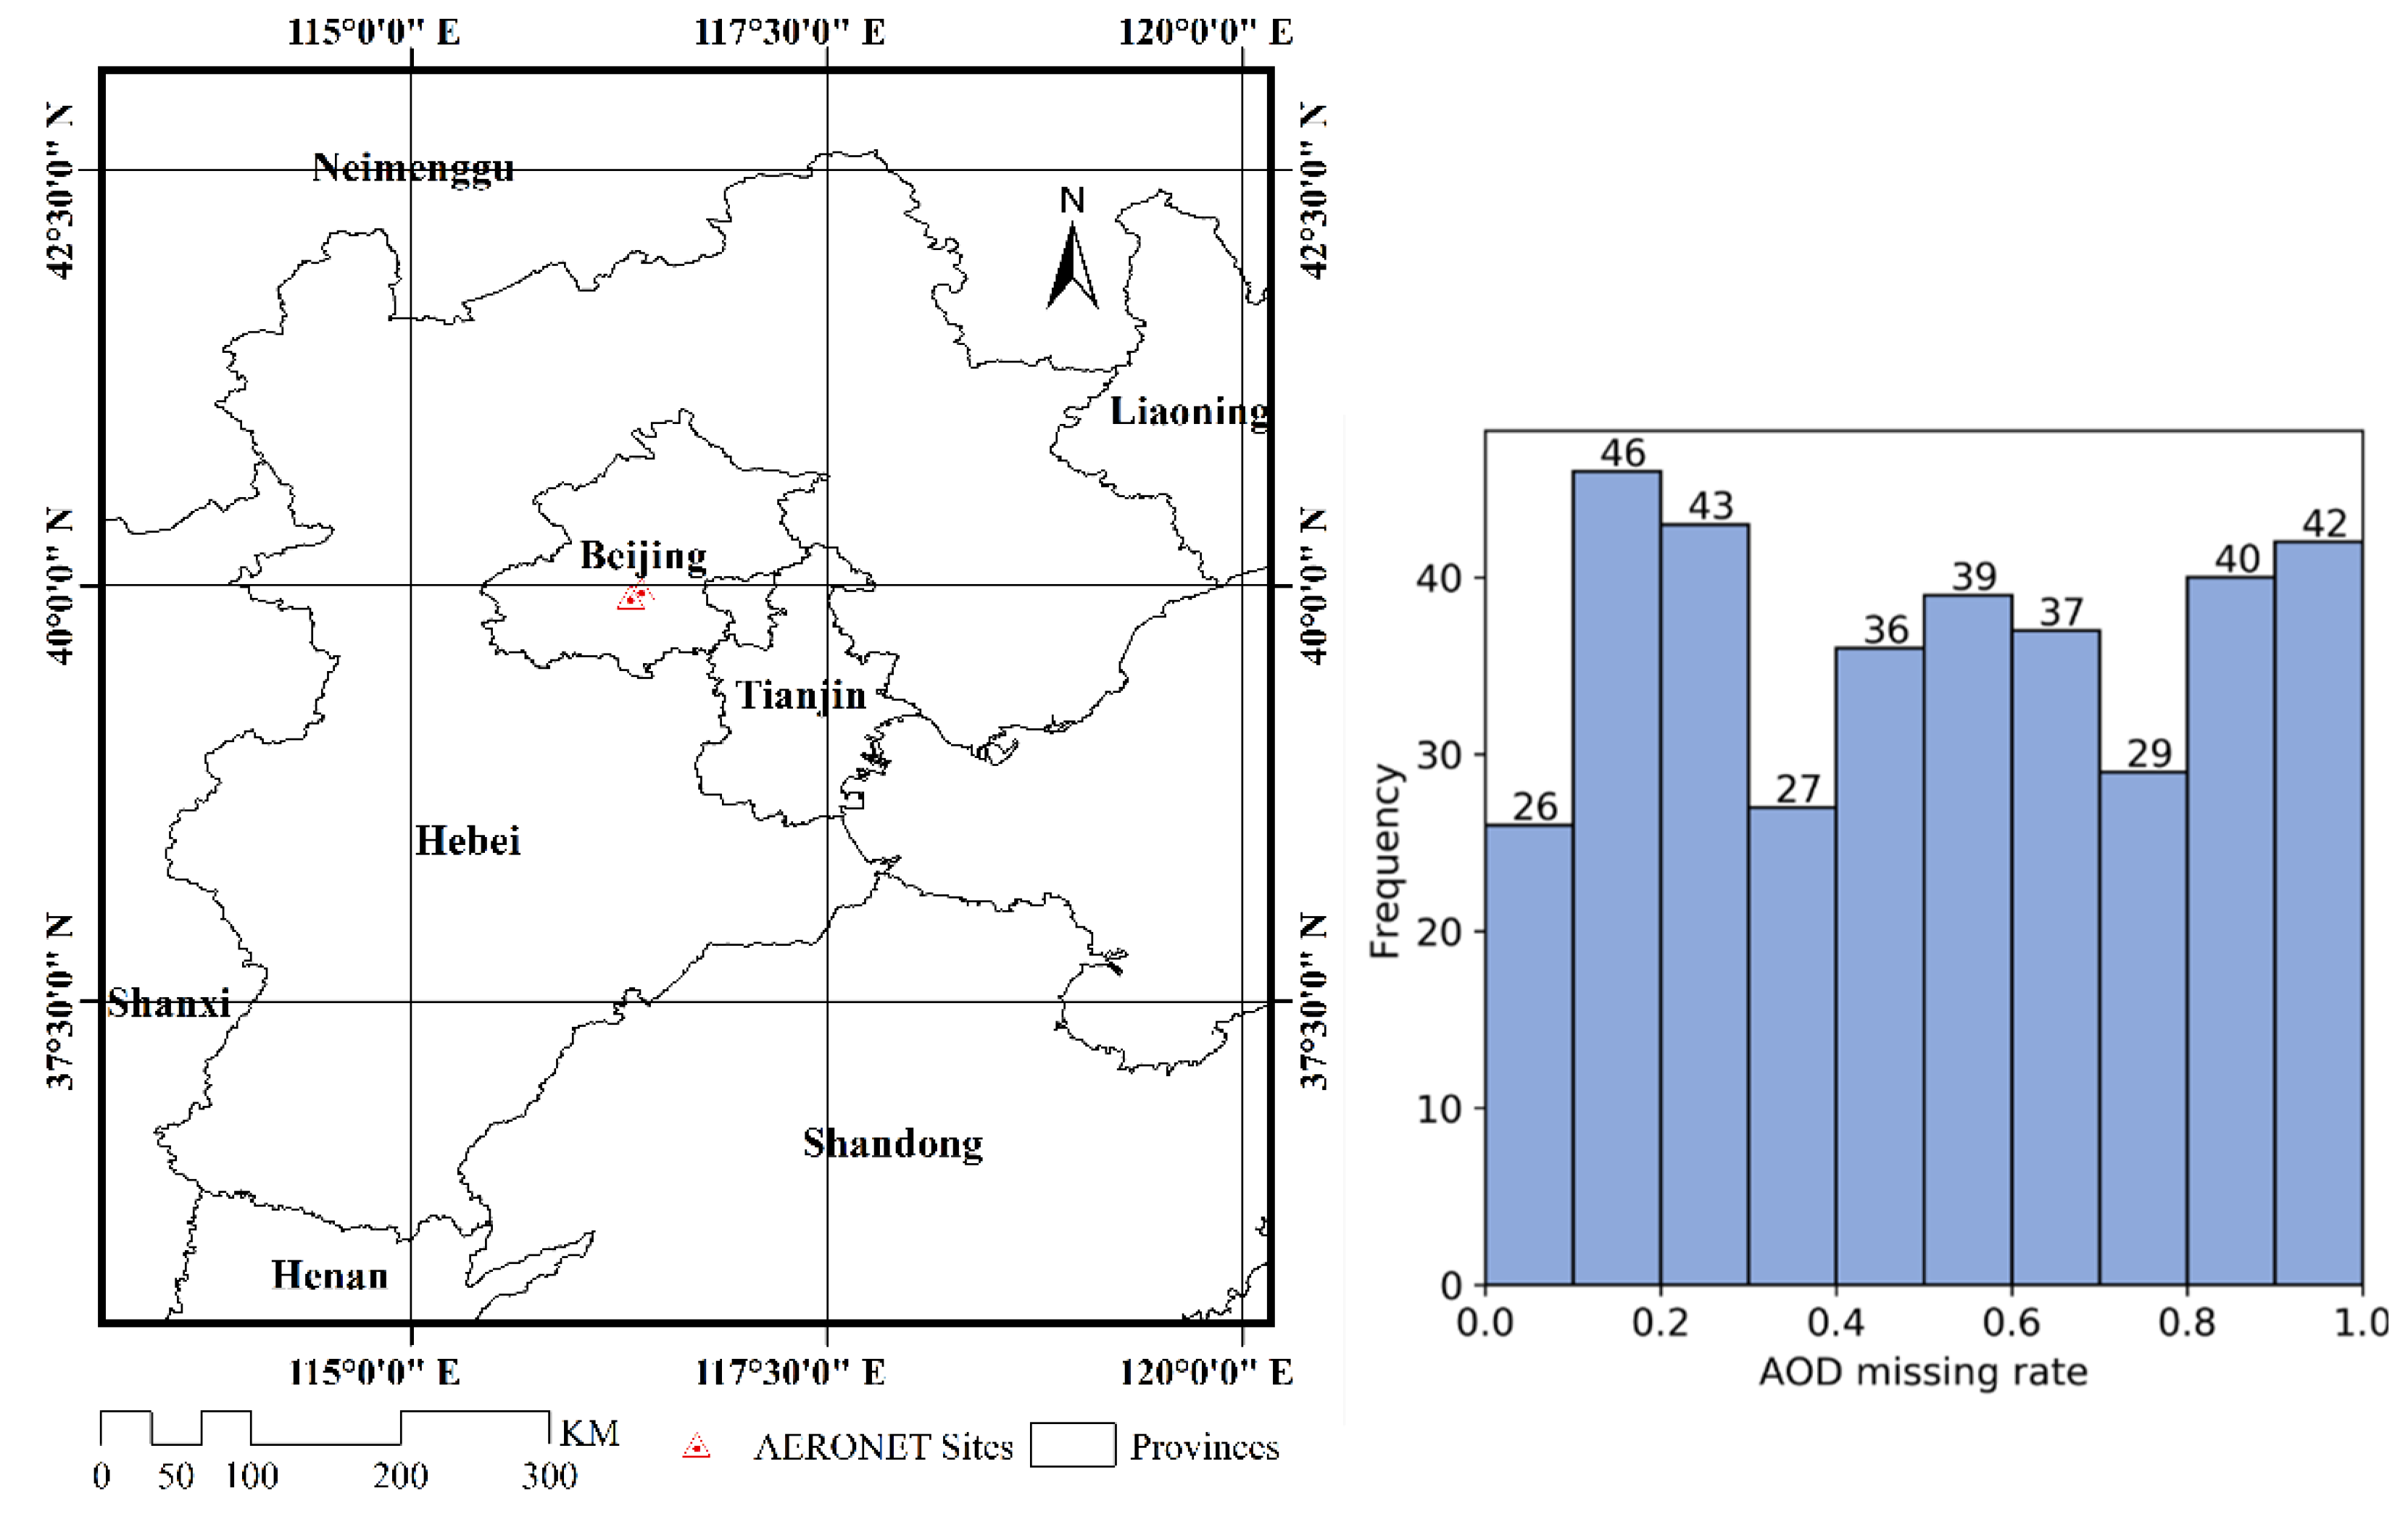
Figure 2.
Spatiotemporal weighted model.
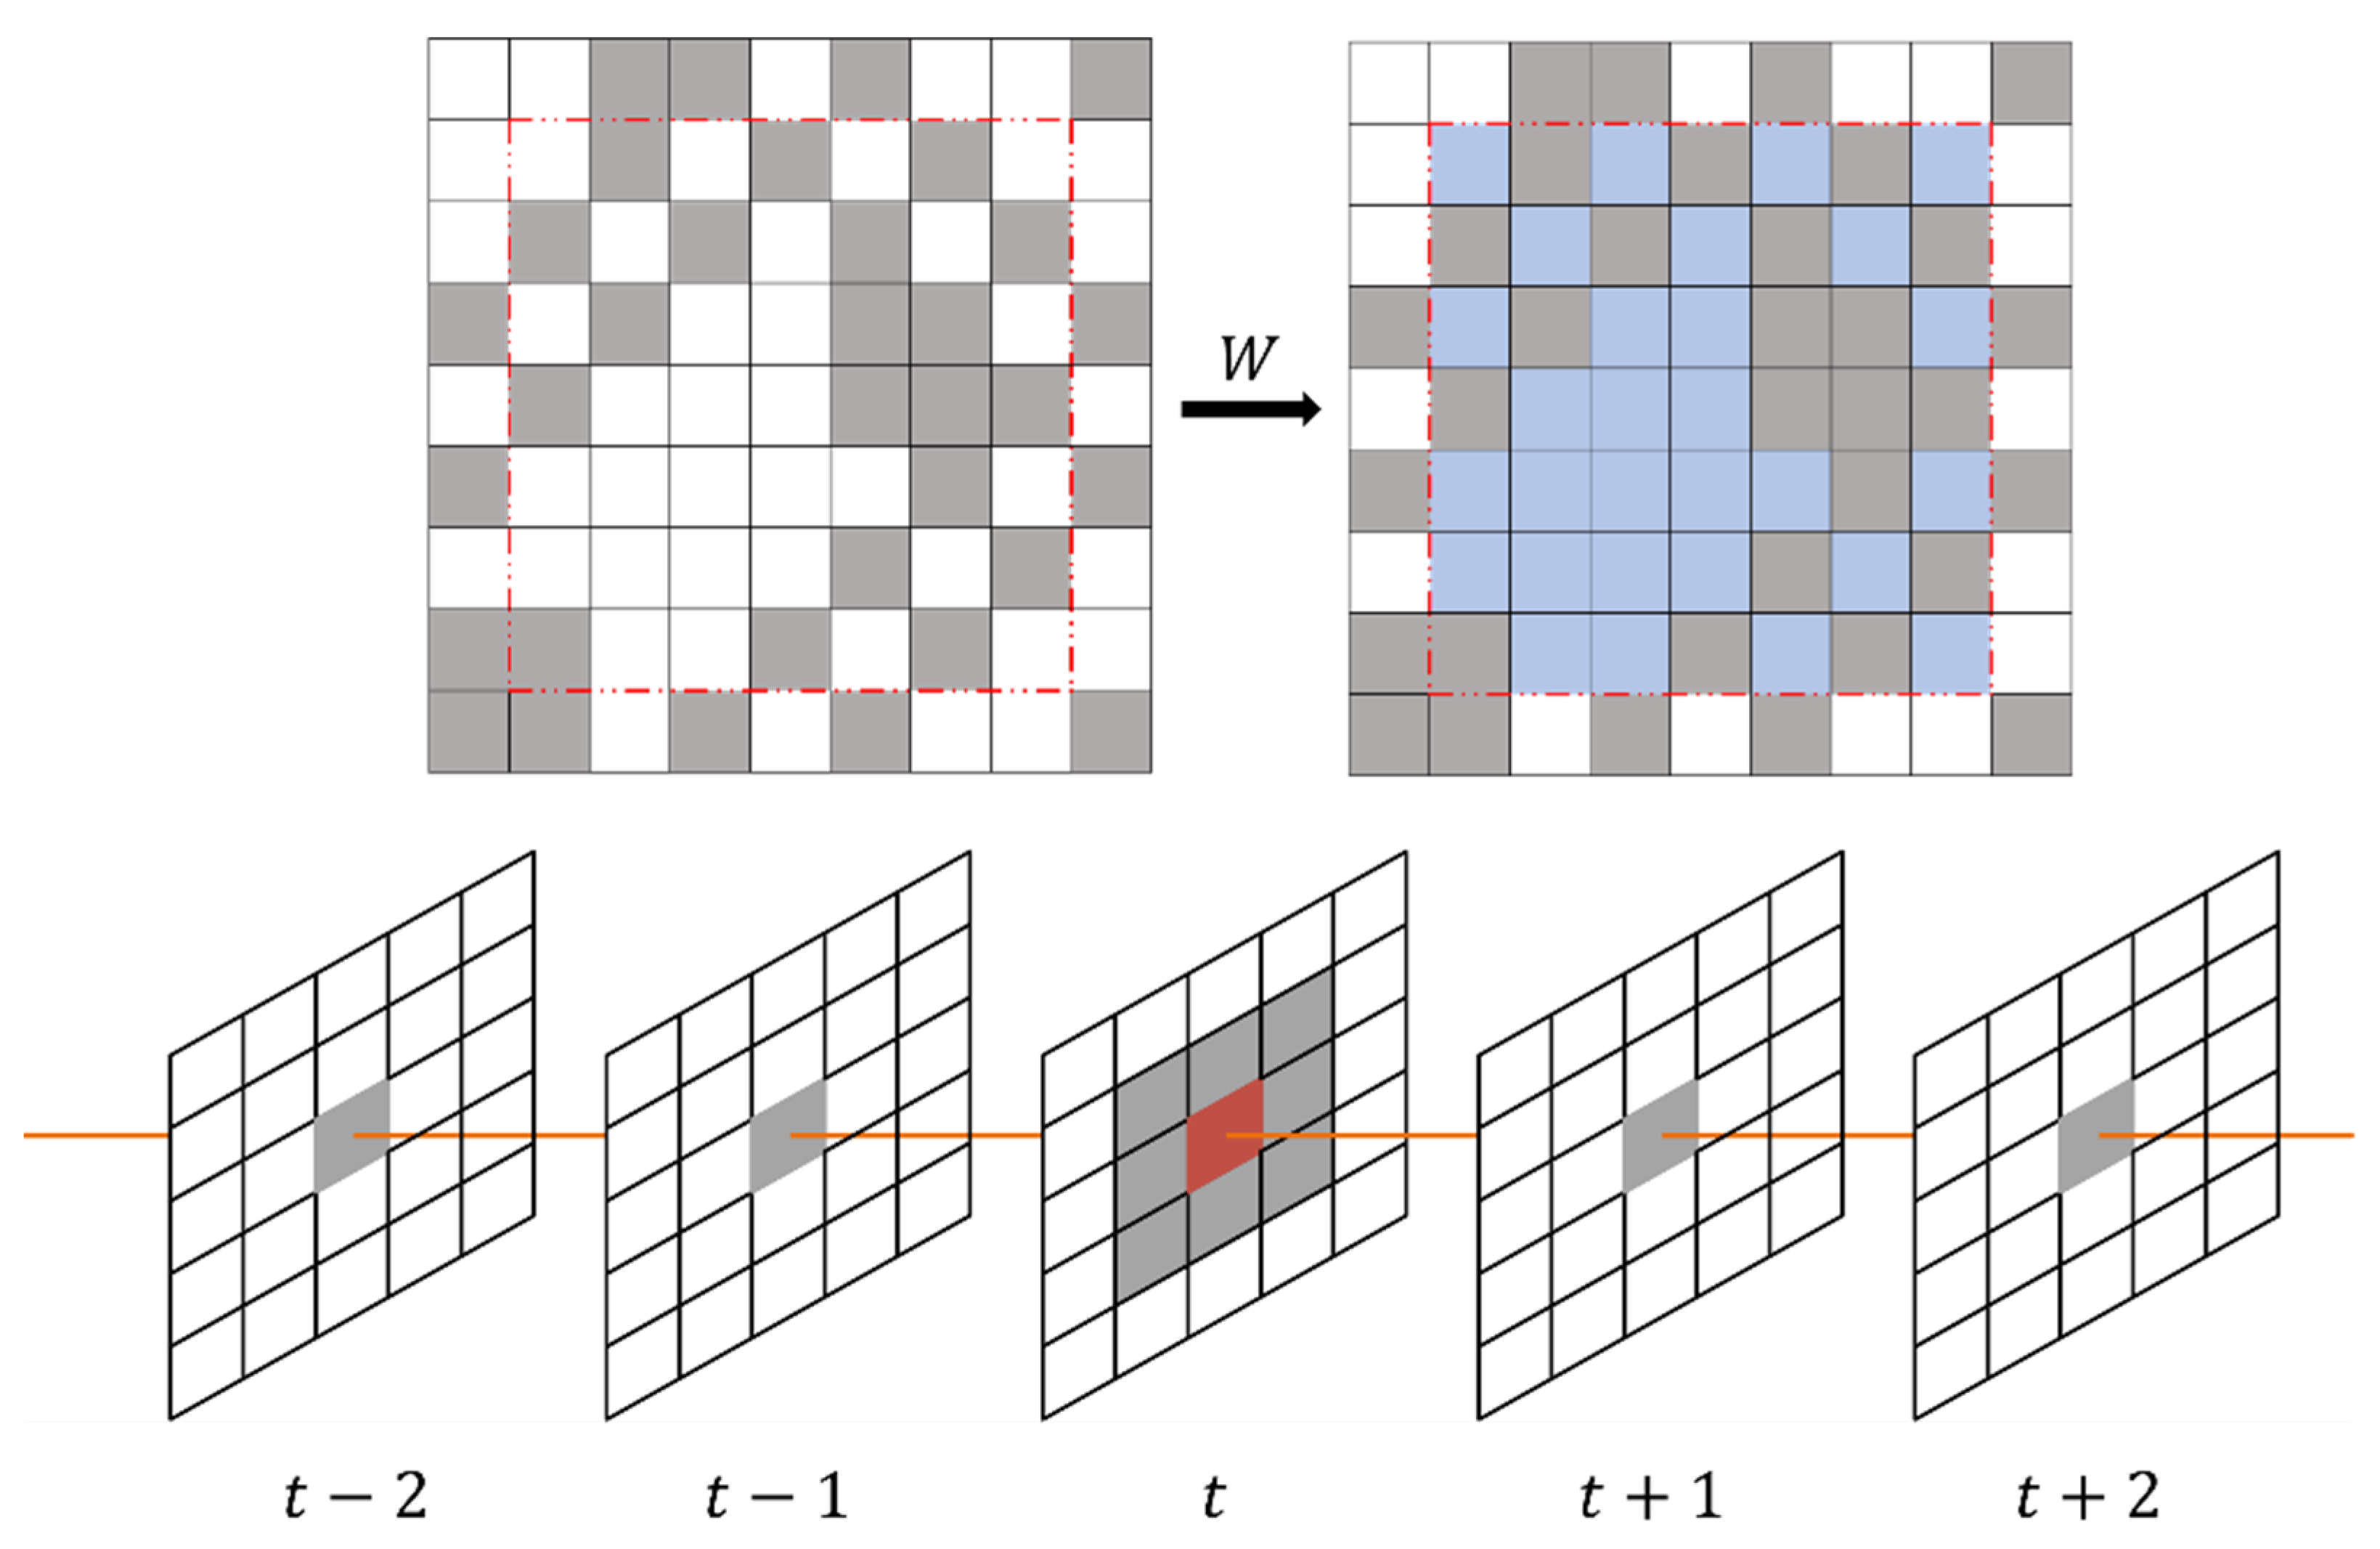
Figure 3.
Spatial correlation. (a–d) represent the semi-variance function curves for each of the four quarters in turn. The horizontal coordinate is the distance, and the vertical coordinate is the semi-variance function value.
Figure 3.
Spatial correlation. (a–d) represent the semi-variance function curves for each of the four quarters in turn. The horizontal coordinate is the distance, and the vertical coordinate is the semi-variance function value.
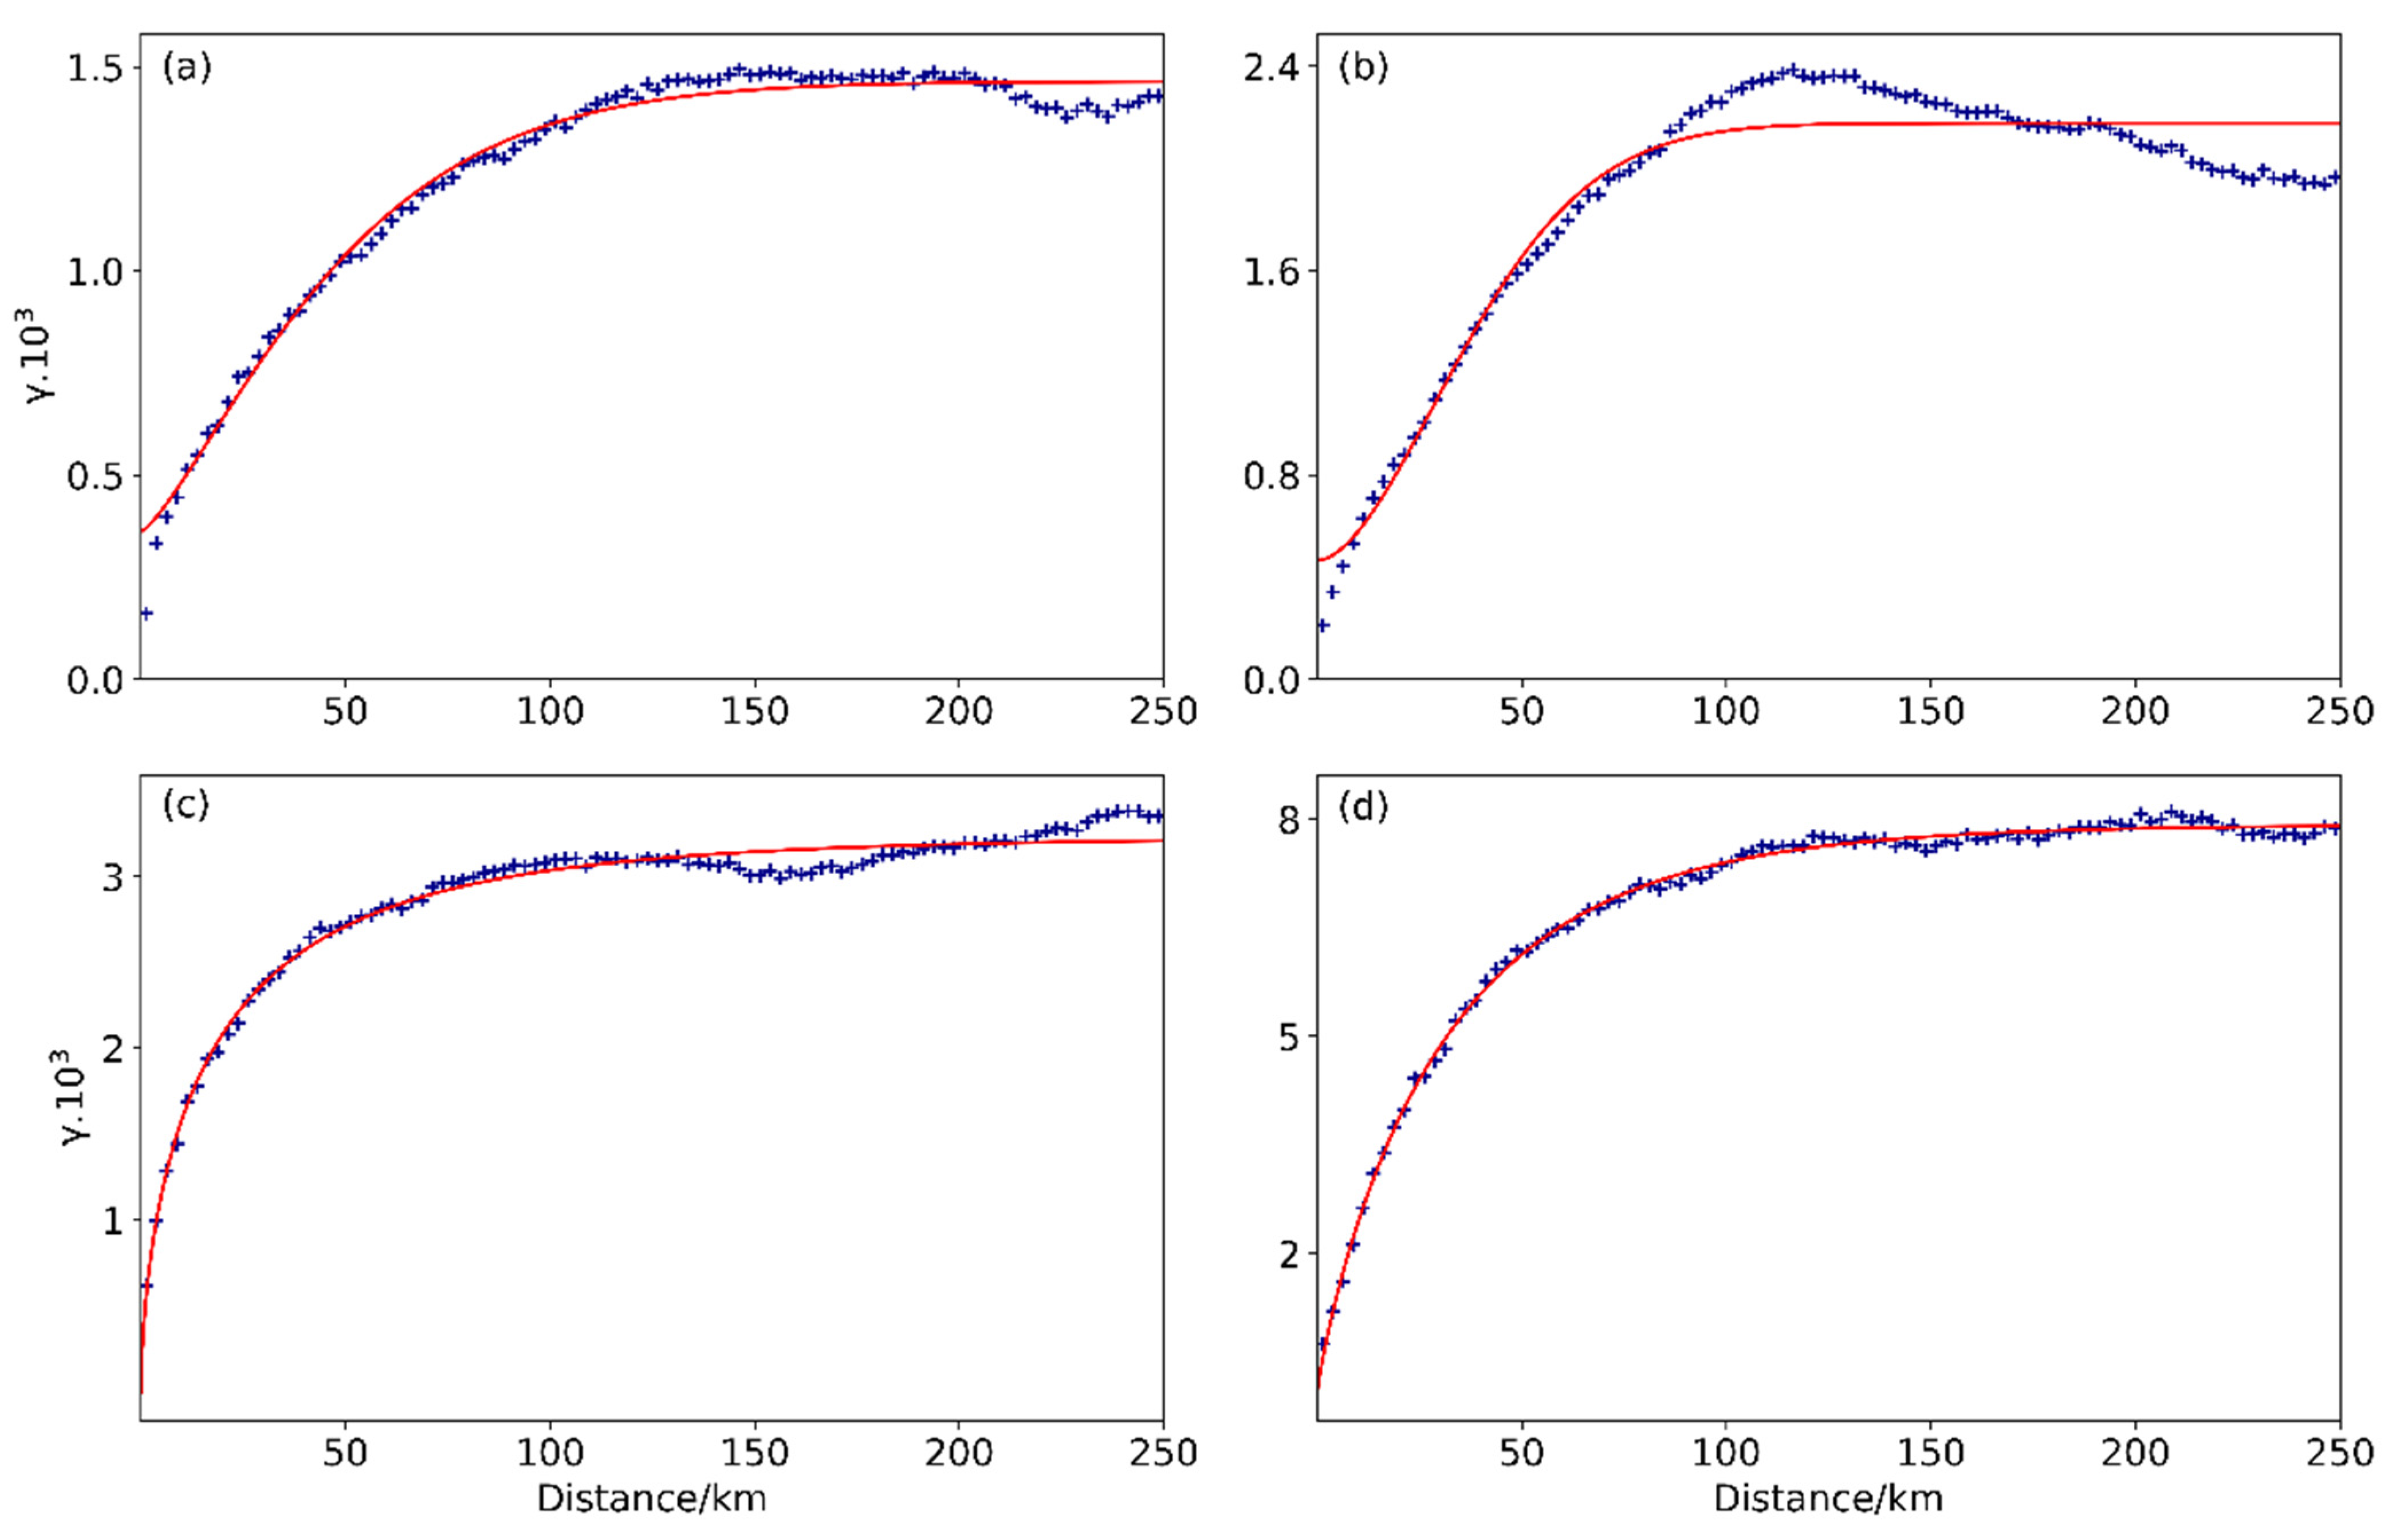
Figure 4.
Time correlation. The horizontal coordinate is the number of days lagged and the vertical axis indicates the correlation between the AOD data on the time series.
Figure 4.
Time correlation. The horizontal coordinate is the number of days lagged and the vertical axis indicates the correlation between the AOD data on the time series.
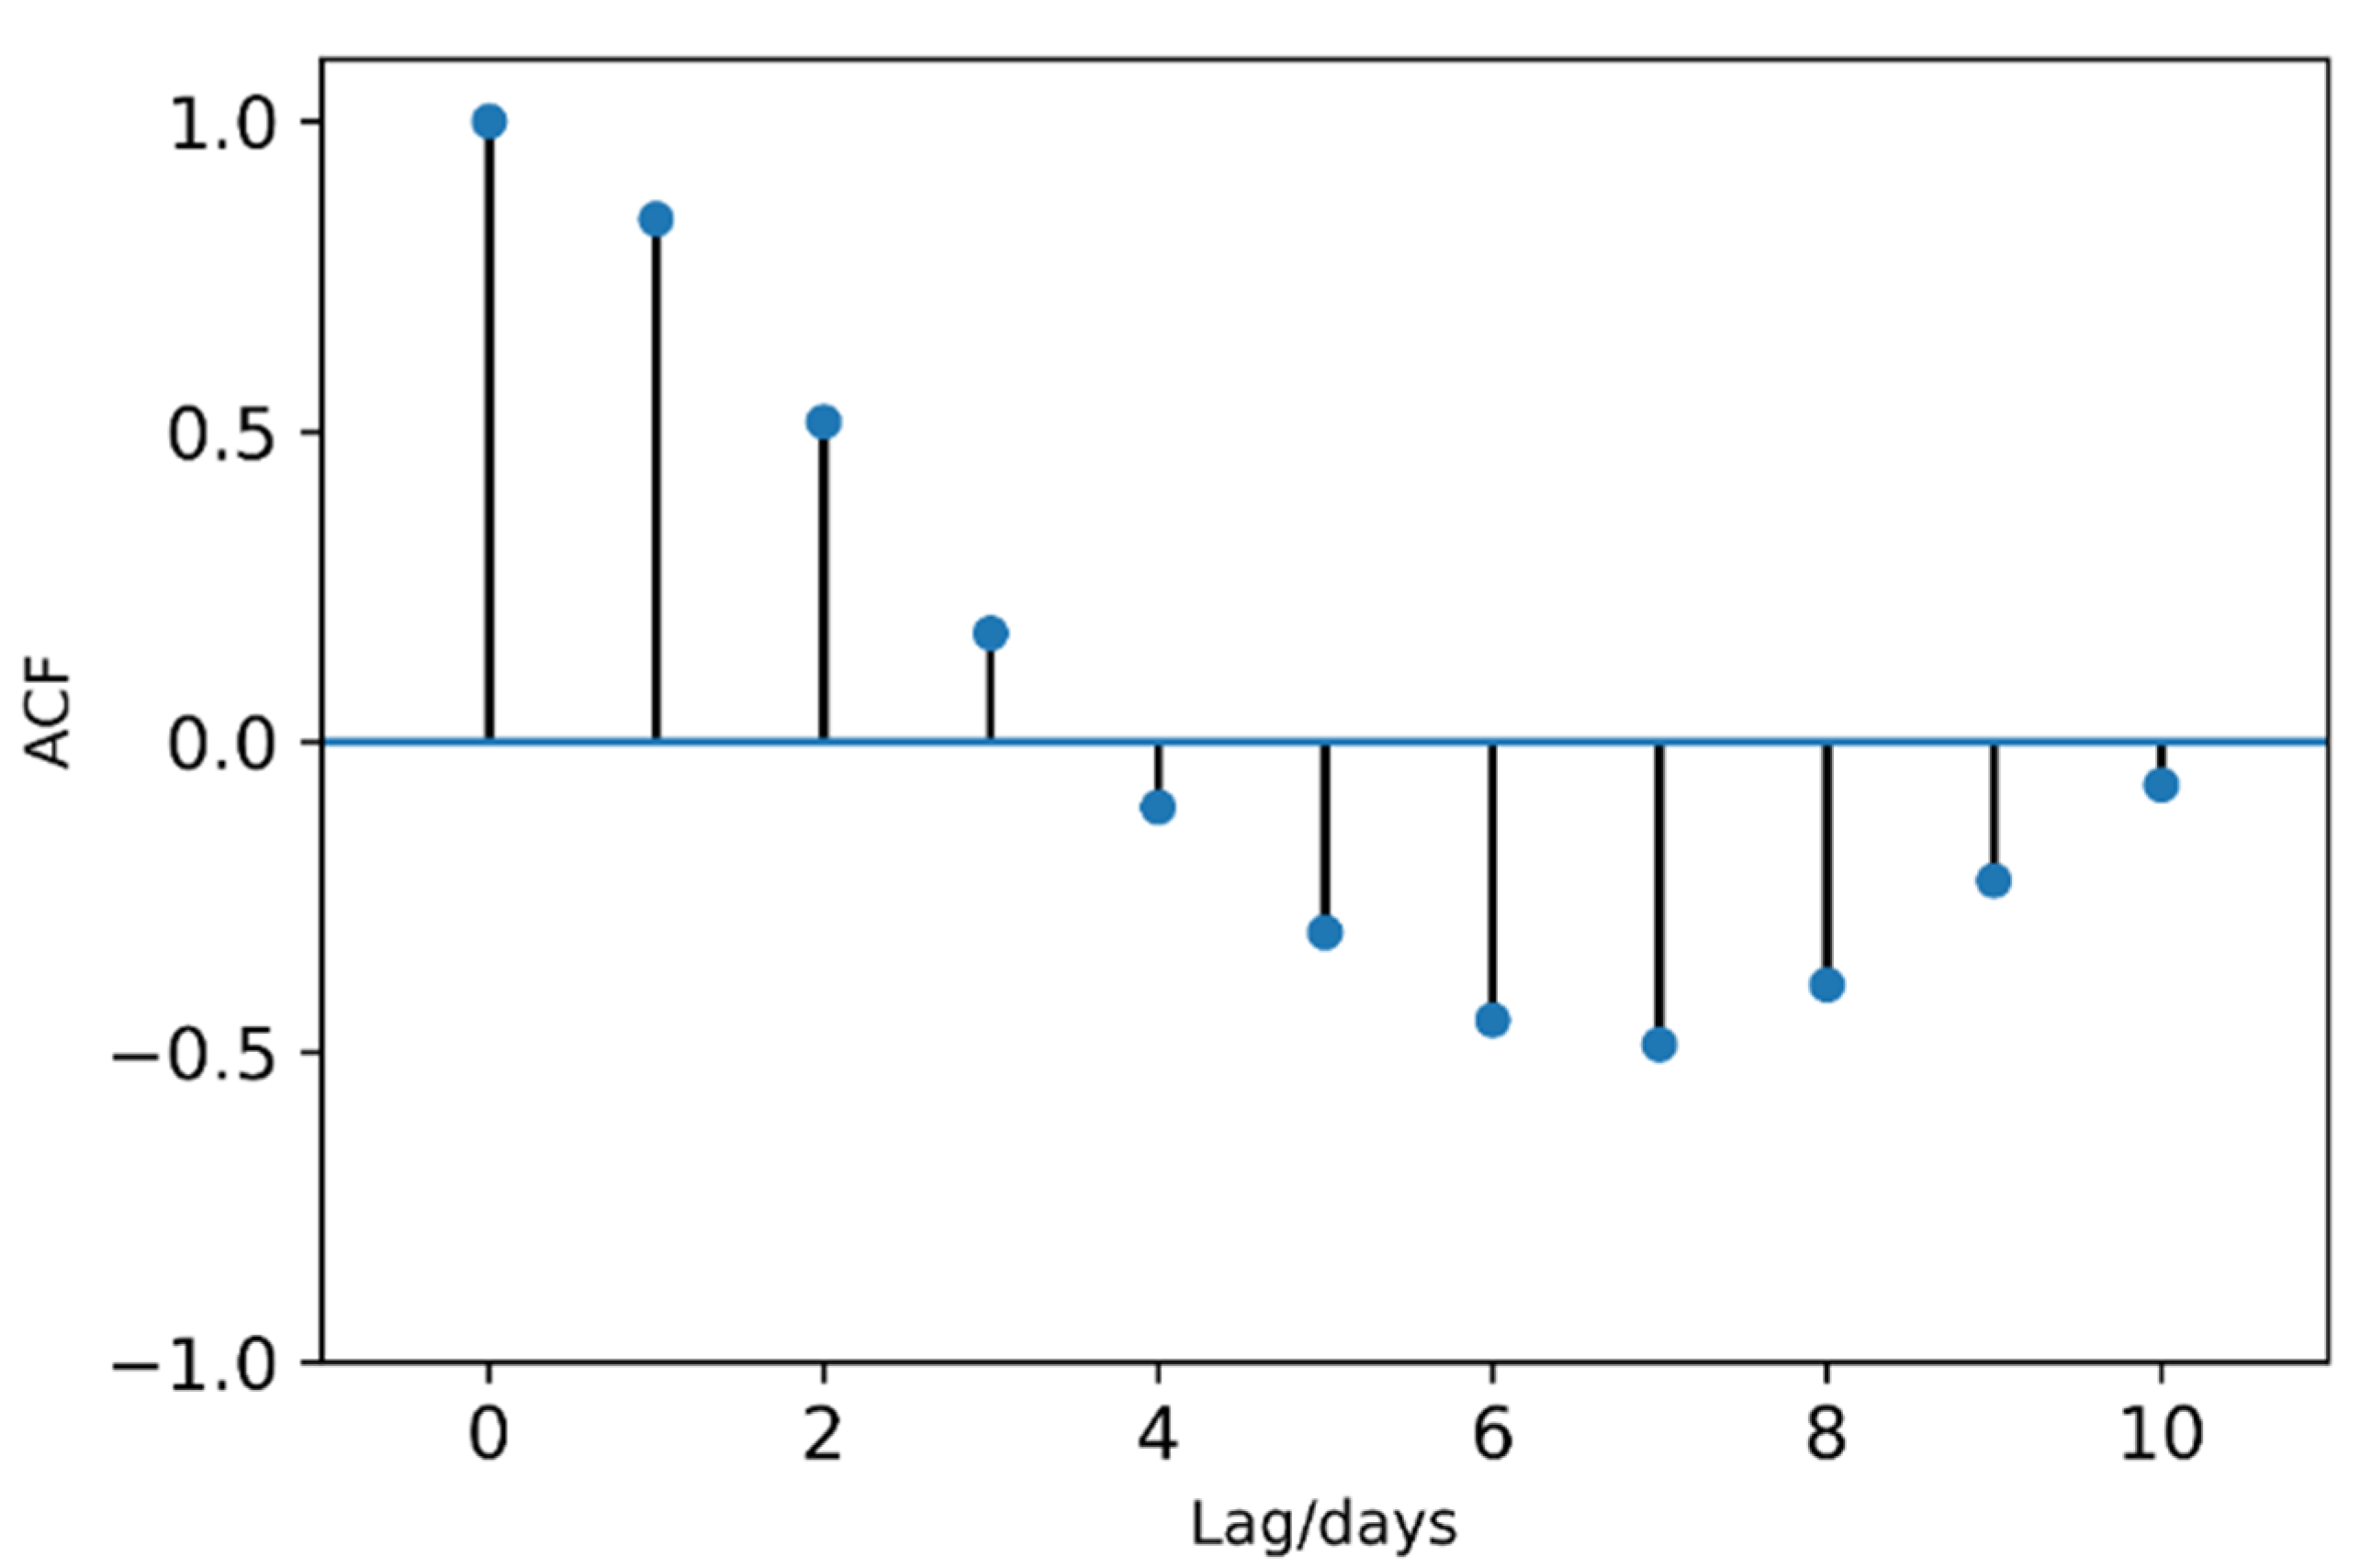
Figure 5.
Spatial and temporal fitting. (a) case where all the images around the image element to be filled are present, red is the target image element, and the gray image element surrounded by the red dashed line is the reference image element; (b) the effect of filling using spatial data, where the horizontal axis is the radius of the reference image element and the vertical axis is the of filling using reference image elements with different radii; (c) the effect of filling using temporal data, the vertical coordinates are the of filling with data at different times, two days before and after in pink and one day before and after in purple.
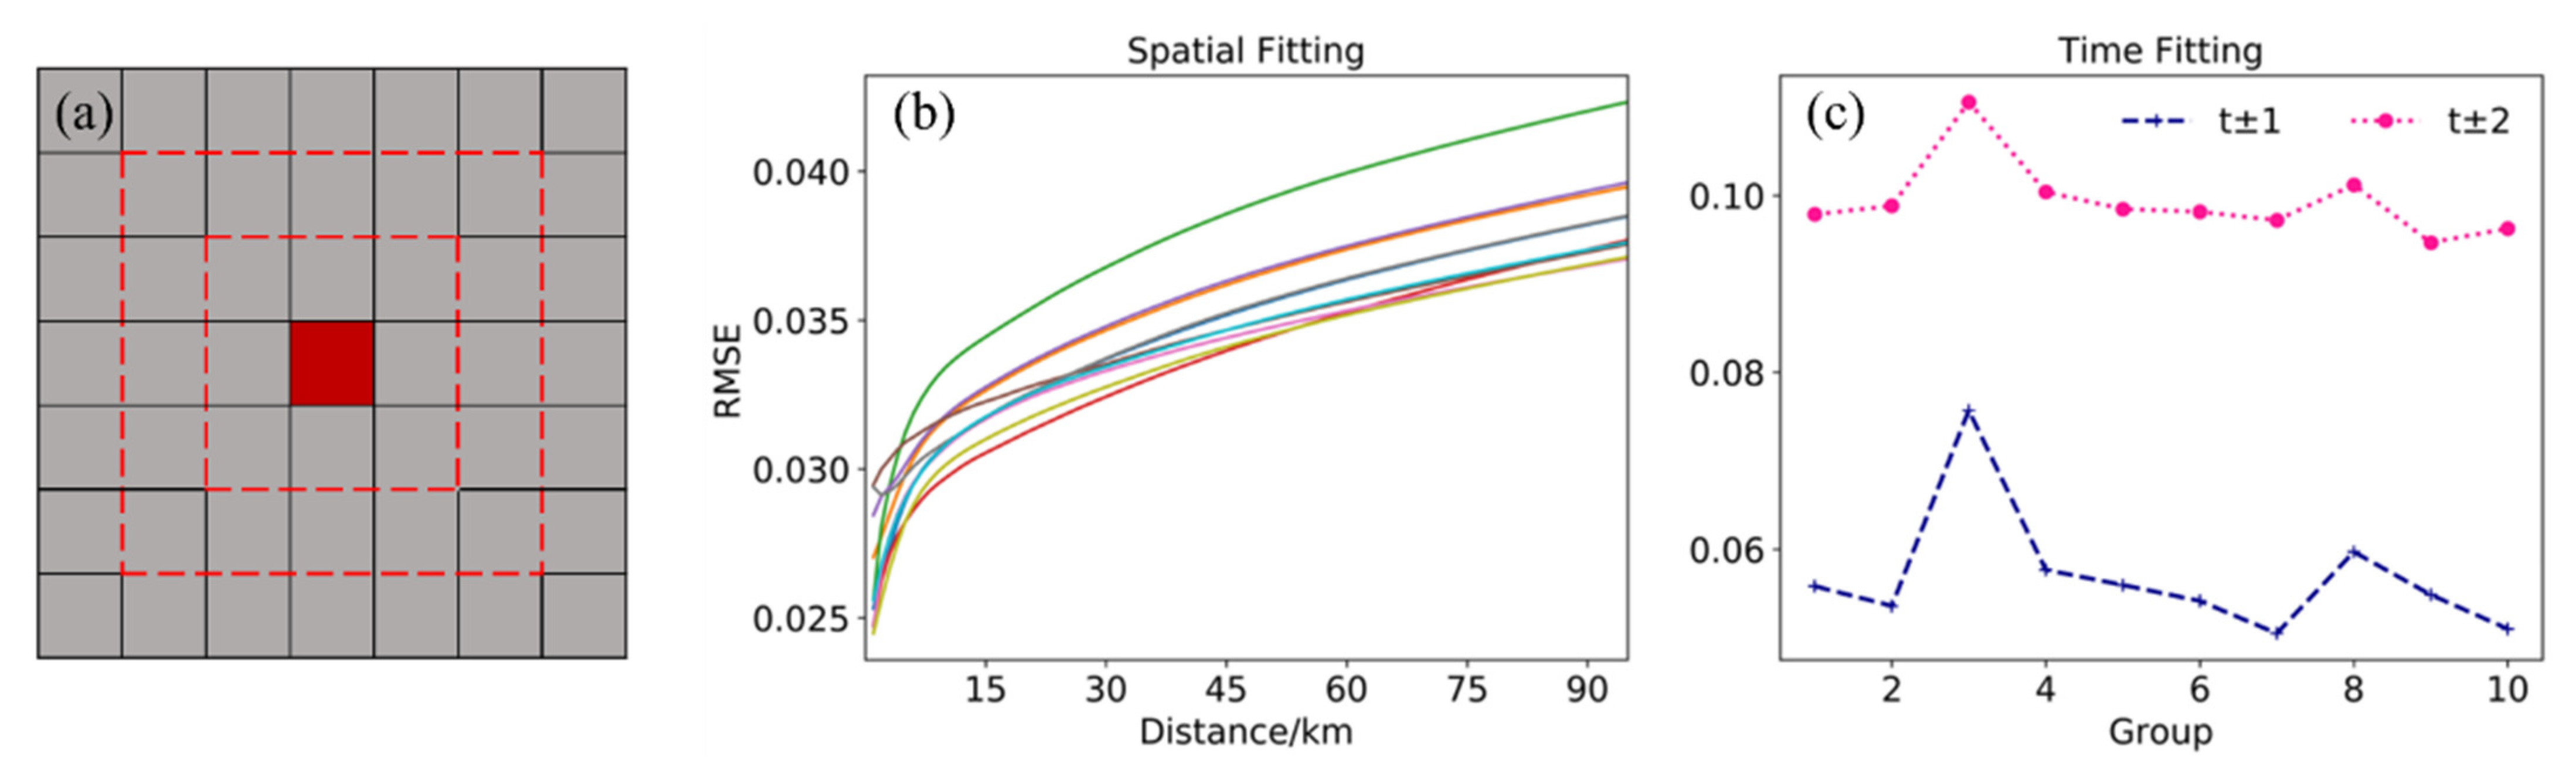
Figure 6.
Spatio-temporal weighted. Each subplot is the fit result for a set of experiments, and is the time weight used to perform the fit. The yellower the color in the plot, the less effective the fit is when using that time weight.
Figure 6.
Spatio-temporal weighted. Each subplot is the fit result for a set of experiments, and is the time weight used to perform the fit. The yellower the color in the plot, the less effective the fit is when using that time weight.

Figure 7.
Filling effect comparison. (a) the case of the AOD data itself, (b) after randomly selecting missing values, (c,d) filling results of the different methods.
Figure 7.
Filling effect comparison. (a) the case of the AOD data itself, (b) after randomly selecting missing values, (c,d) filling results of the different methods.
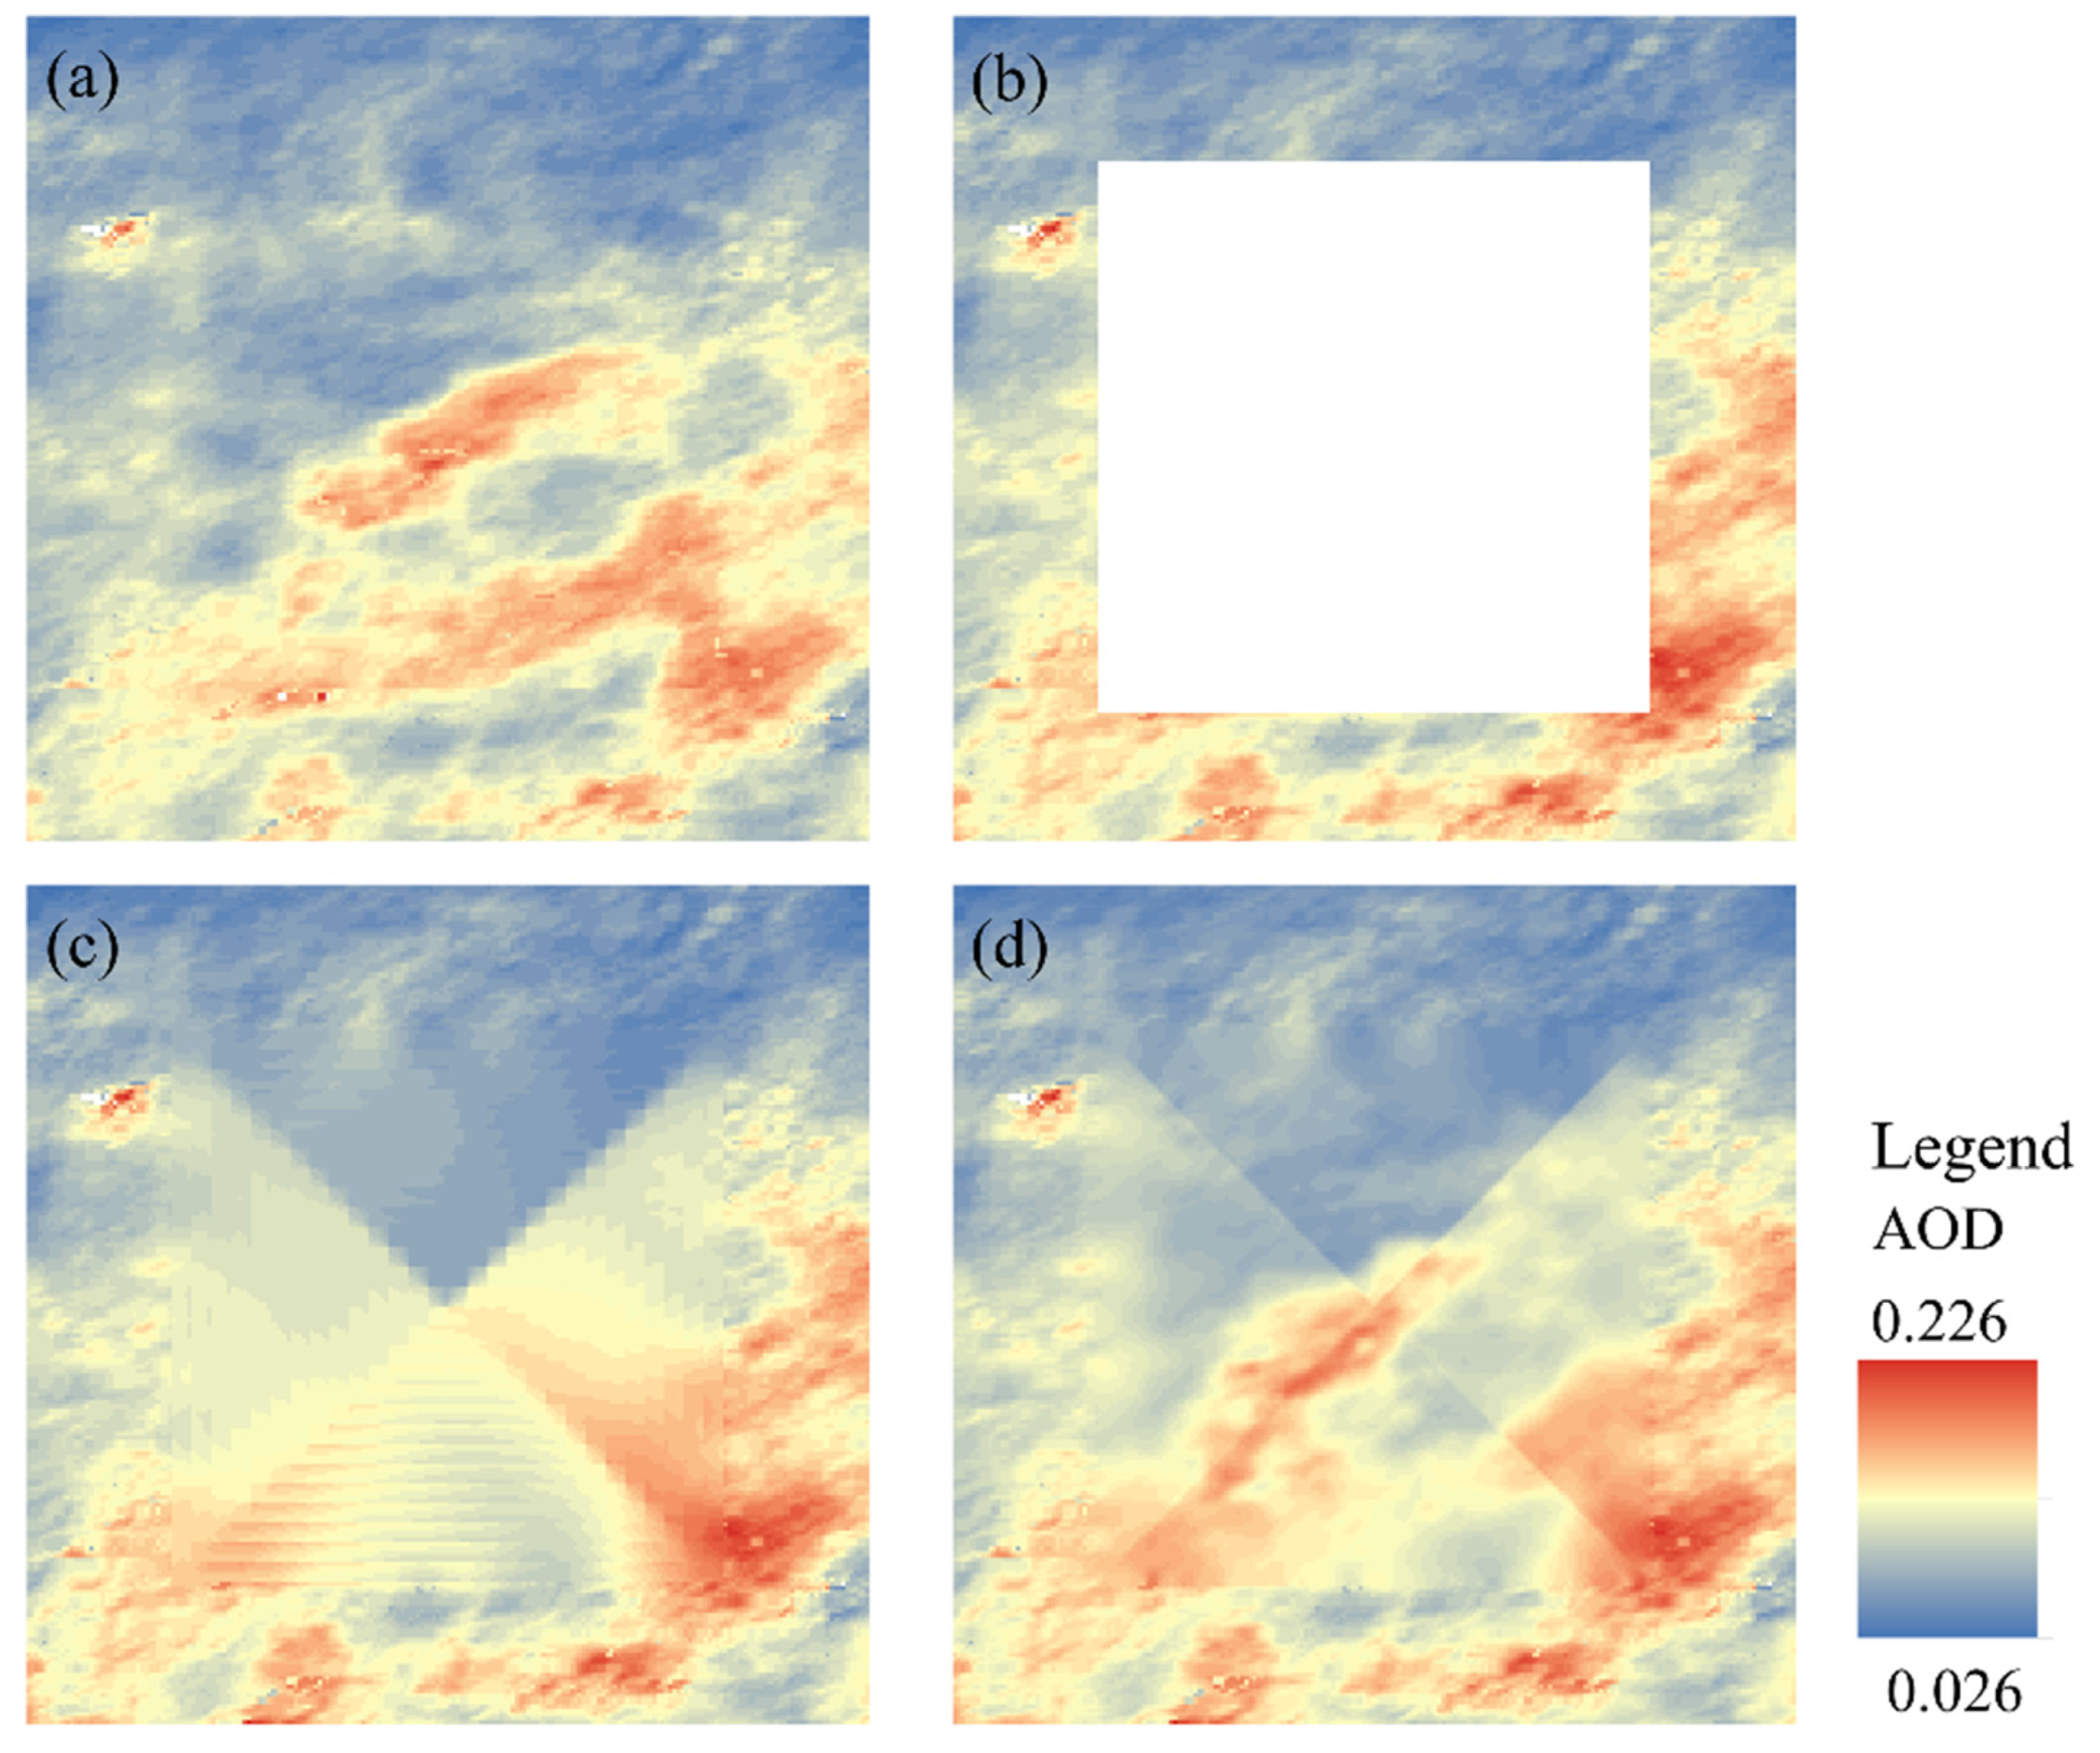
Figure 8.
Accuracy evaluation. The left figure shows the results of mean filling, and the right figure shows the results of filling using the method proposed in this paper. The horizontal coordinate is the original AOD value, the vertical coordinate is the fitted AOD value.
Figure 8.
Accuracy evaluation. The left figure shows the results of mean filling, and the right figure shows the results of filling using the method proposed in this paper. The horizontal coordinate is the original AOD value, the vertical coordinate is the fitted AOD value.

Figure 9.
Relationship between MAIAC AOD and AERONET AOD.
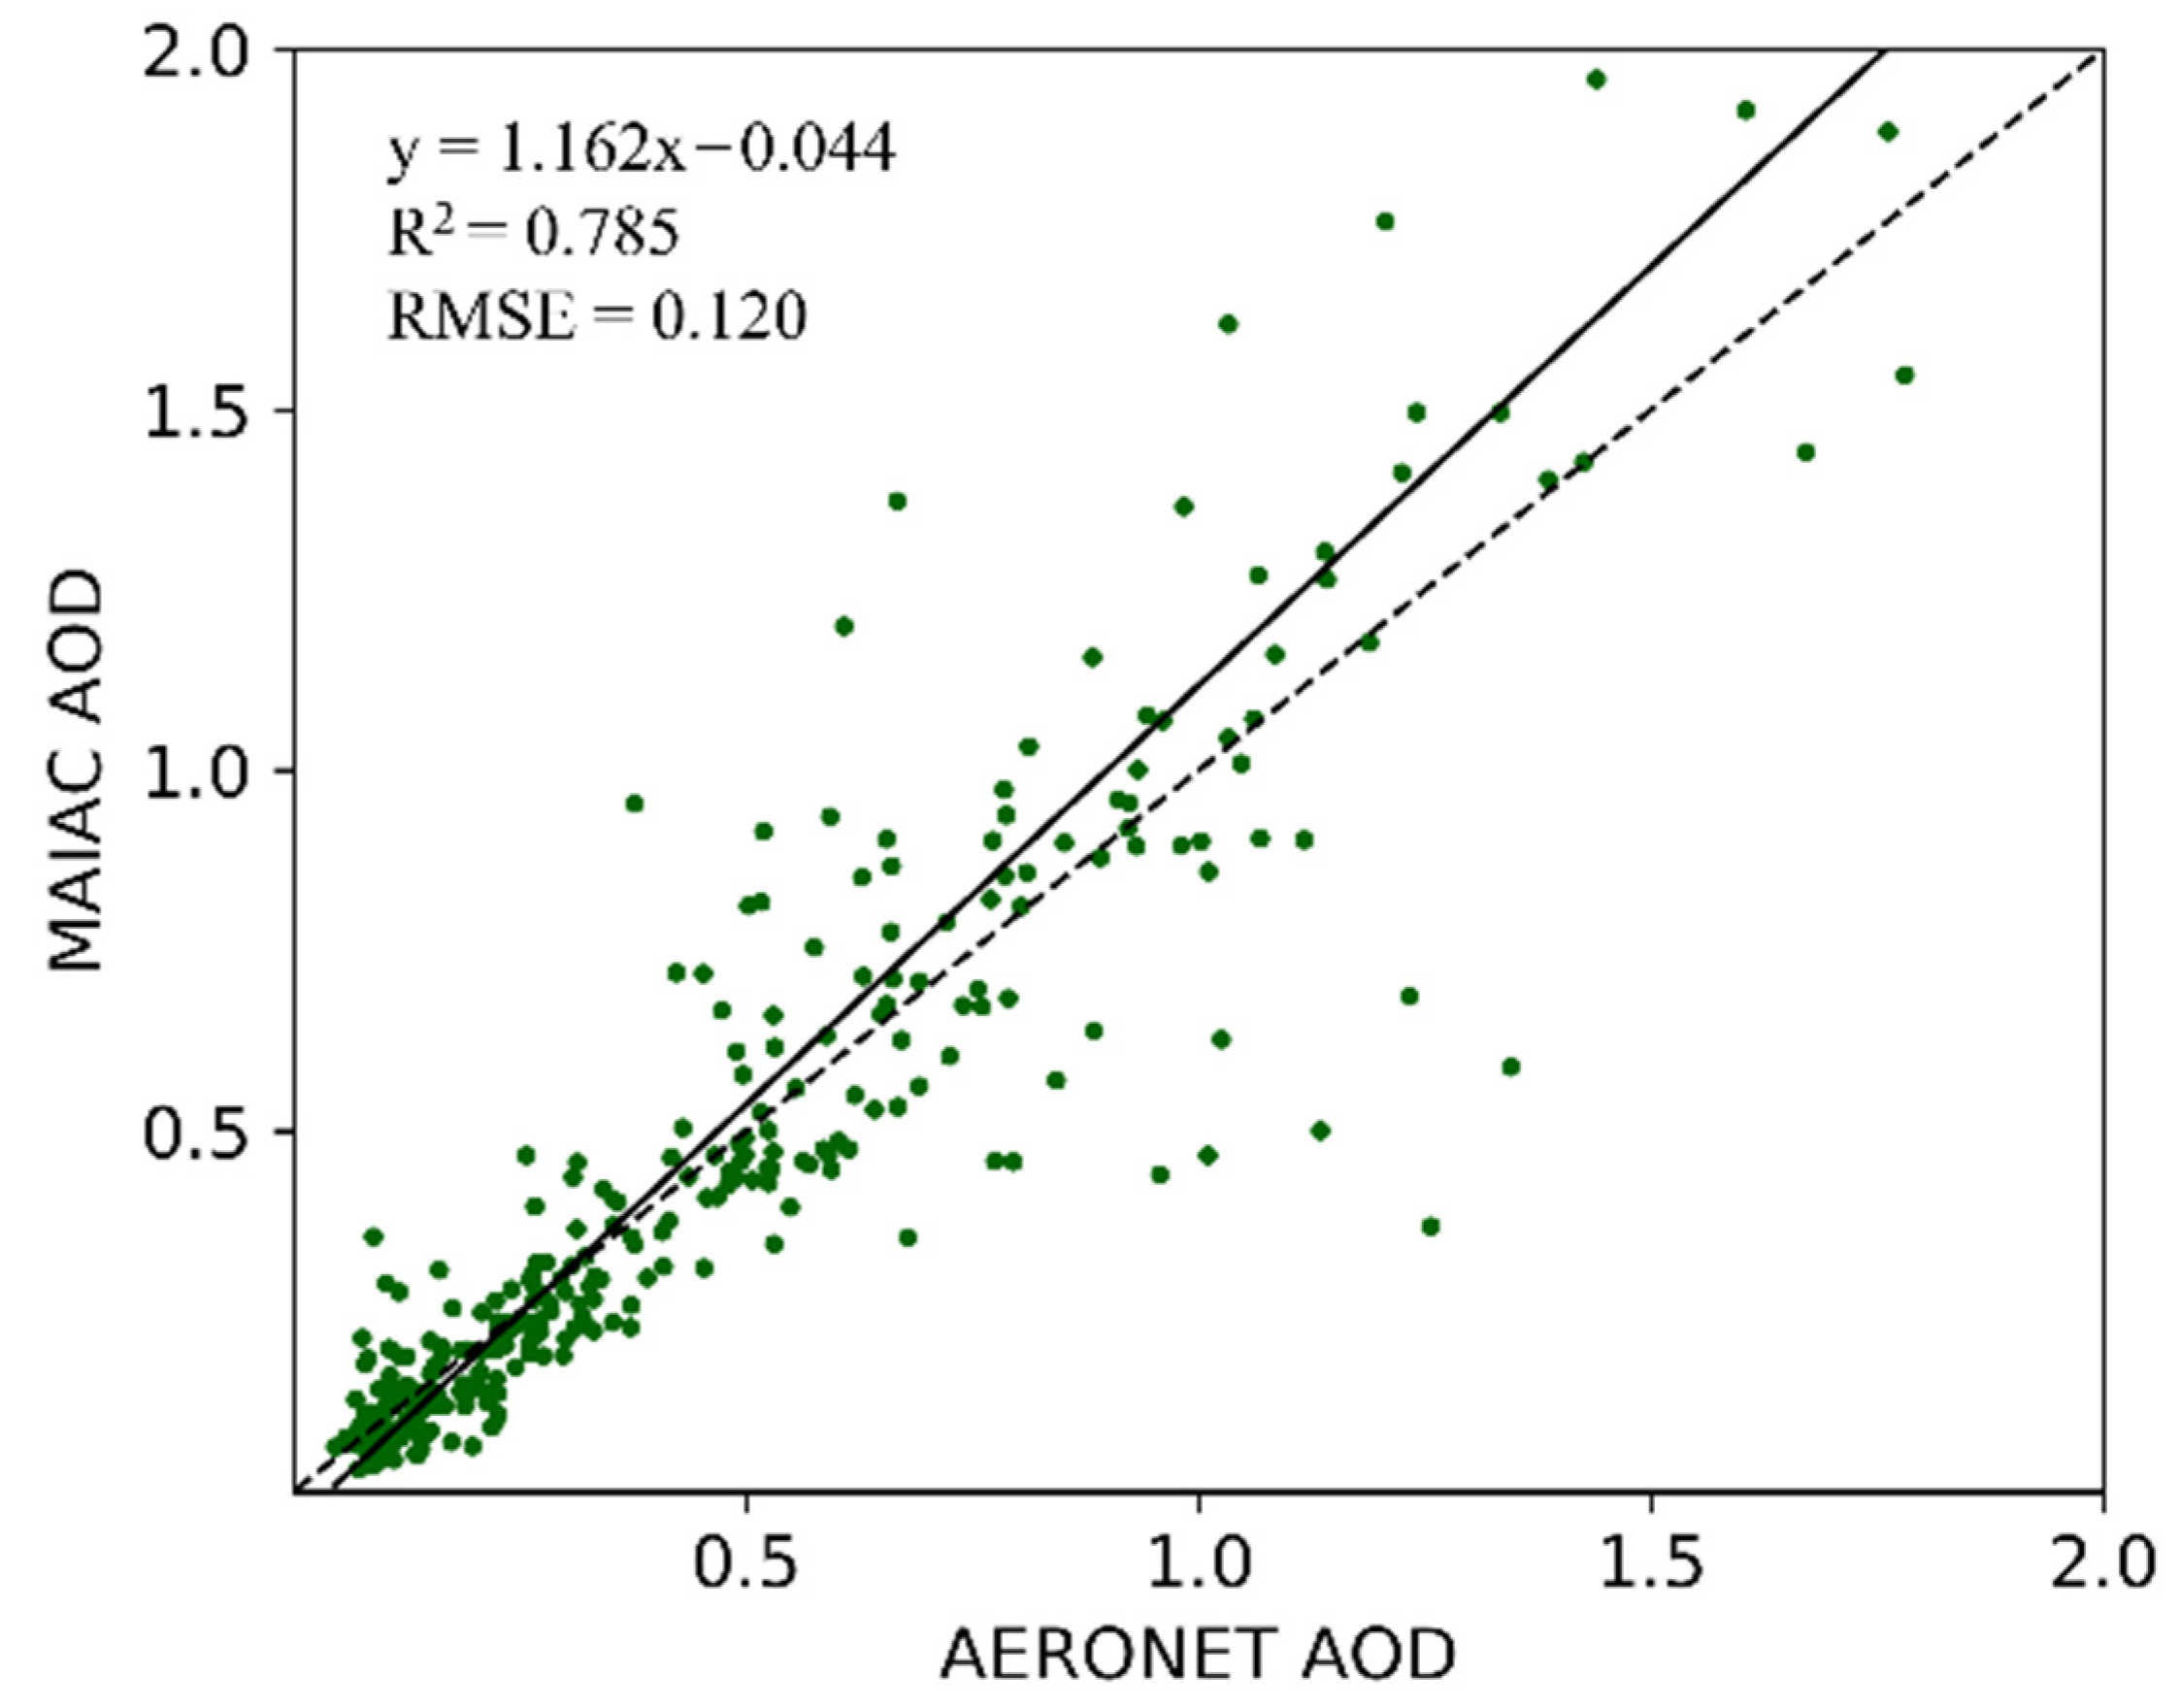
Figure 10.
AOD mean value. The horizontal coordinate being the month and the vertical coordinate being the average value of AOD after filling for each city.
Figure 10.
AOD mean value. The horizontal coordinate being the month and the vertical coordinate being the average value of AOD after filling for each city.
Publisher’s Note: MDPI stays neutral with regard to jurisdictional claims in published maps and institutional affiliations. |
© 2022 by the authors. Licensee MDPI, Basel, Switzerland. This article is an open access article distributed under the terms and conditions of the Creative Commons Attribution (CC BY) license (https://creativecommons.org/licenses/by/4.0/).
Share and Cite
MDPI and ACS Style
Gao, R.; Rui, X.; Tang, J. A Spatio-Temporal Weighted Filling Method for Missing AOD Values. Atmosphere 2022, 13, 1080. https://doi.org/10.3390/atmos13071080
AMA Style
Gao R, Rui X, Tang J. A Spatio-Temporal Weighted Filling Method for Missing AOD Values. Atmosphere. 2022; 13(7):1080. https://doi.org/10.3390/atmos13071080
Chicago/Turabian StyleGao, Rongfeng, Xiaoping Rui, and Jiakui Tang. 2022. "A Spatio-Temporal Weighted Filling Method for Missing AOD Values" Atmosphere 13, no. 7: 1080. https://doi.org/10.3390/atmos13071080
Note that from the first issue of 2016, this journal uses article numbers instead of page numbers. See further details here.