Article

Numerical Study on Thermal-Hydraulic Performance of Printed Circuit Heat Exchangers during Natural Gas Trans-Critical Liquefaction

1
China Tobacco Hubei Industrial LLC, Wuhan 430072, China
2
School of Metrology and Measurement Engineering, China Jiliang University, Hangzhou 310018, China
*
Author to whom correspondence should be addressed.
Atmosphere 2022, 13(5), 730; https://doi.org/10.3390/atmos13050730
Submission received: 8 April 2022 / Revised: 28 April 2022 / Accepted: 1 May 2022 / Published: 2 May 2022
(This article belongs to the Special Issue Industrial Air Pollution Control in China)

Abstract

:
Printed Circuit Heat Exchangers (PCHEs) are considered an excellent alternative for the main cryogenic heat exchanger of Floating Liquefied Natural Gas (FLNG) facilities due to their compact structure and strong heat transfer performance. However, it is unclear how to configure the geometry of the PCHE channels to achieve its optimal performance in the trans-critical liquefaction process of natural gas (NG), which is critical for the main heat exchanger. In this paper, we numerically studied the thermal-hydraulic characteristics of PCHEs with different channel types under the specified condition. The results elucidate that all channels have an enhancement of heat transfer near the pseudo-critical point of NG. All the wavy channels could improve the heat transfer performance of PCHEs, where the trapezoidal channel achieves the largest promotion. Compared with the straight channel, the local heat transfer coefficient could be increased by up to 53% in the trapezoidal channel. Additionally, vortex appeared at the bends of the wavy channels, which greatly increase the local friction loss. Among several channels, the total pressure drop of zigzag, fillet and the sinusoidal channel was almost the same, while that of the trapezoidal channel was the largest. Furthermore, we compared the comprehensive performance of different types of channels and found that the benefit of heat transfer enhancement could not offset the penalty of flow deterioration. Our work provides important guidance for the design of PCHEs employed in FLNG.

1. Introduction

Natural gas (NG) has become increasingly essential among the major energy resources due to the low emission of harmful products and high calorific value [1,2,3]. About 20% of NG reservoirs are located under the sea [4], conventional exploitation through submarine pipelines has the disadvantages of large investment, difficulty in remote control and low security [5]. To tackle these problems, Floating Liquefied Natural Gas (FLNG) facilities have been designed [6]. The liquefaction process of the extracted natural gas which takes place in the main heat exchanger is the key part of the FLNG plant, and the performance of the main heat exchanger would directly affect the economy and applicability of the entire operation of the facility. Recently, the printed circuit heat exchanger (PCHE) has been widely investigated on account of its compact structure, reduced leakage, cryogenic and large pressure endurance and high heat transfer efficiency [7], which could well fulfill the needs of FLNG for the main heat exchanger [7,8].
PCHEs are characterized by their unique manufacturing process [9]. The micro-channels inside PCHEs are processed on the metal substrates using photochemical etching technology. A semi-circle is usually selected as the cross-section of micro-channels, whose diameter ranges from 0.5 mm to 2.0 mm. The thickness of the substrates is about 1.5 mm and the length of the fluid channel is generally set as hundreds of millimeters, allowing PCHEs to have extremely high compactness (up to 2500 m2/m3) and heat transfer efficiency (up to 0.98) [10,11]. Under the same heat transfer area density, the weight and volume of PCHEs are about 1/5 of the shell and tube heat exchangers [8]. Counter-flow type is mostly employed in PCHEs, because it shows the best thermal performance among the three main flow types, i.e., crossflow, parallel flow and counter-flow [12]. The processed metal plates are stacked together through vacuum diffusion welding, which gives the PCHEs a comparable strength to parent materials [9]. Due to their specific structure, PCHEs have a strong endurance with low temperatures (down to -200 ℃) and high pressure (up to 60.0 MPa) [10].
Most of the recent studies focused on high-temperature and high-pressure operating conditions, where the working fluids were in a single phase throughout the heat transfer process [13,14,15,16]. Ma et al. [13] investigated the dynamic response characteristics of PCHE at high temperatures and compared the equilibrium times of PCHEs under different boundary conditions. Shin et al. [14] constructed a high-pressure test system to study the influence of operating pressure on the flow and heat transfer performance. Palko et al. [15] used supercritical water as a working fluid to explore the effect of buoyancy forces on heat transfer deterioration in PCHEs. Aneesh et al. [16] numerically investigated the effect of the channel geometry on the thermal-hydraulic characteristics of PCHEs, and the results indicated that the trapezoidal channels had the best heat transfer performance and largest friction loss.
Several works further explore the flow and heat transfer characteristics of PCHEs with phase transition of working fluids [4,17,18]. Kwon et al. [17] studied the single-phase (N2-N2), boiling (N2-liquefied N2) and condensation (CO2-He) heat transfer process in PCHEs in an ultra-low temperature environment. Additionally, the empirical heat transfer correlations are proposed or modified at each experimental condition. As for the studies of PCHEs employed in the field of the NG industry, the PCHEs are most utilized as vaporizers of liquefied natural gas (LNG). Zhao et al. [18] numerically studied the gasification process of super-critical liquefied natural gas in airfoil fin-based PCHEs, and analyzed the effects of the fin arrangement. Peng et al. [4] studied the conjugate heat transfer between trans-critical gasification of methane and condensation of propane in straight channel PCHE through a numerical method. However, very little research focuses on the liquefaction process of NG in PCHEs [19,20], and there is a lack of comprehensive investigations of channel configuration on flow and heat transfer performance under this specific condition.
Hence, in order to give the detailed effect of different types of channels on the flow and heat transfer characteristics during the liquefaction process of NG in PCHEs, we firstly establish five channels, namely straight, zigzag, fillet, sinusoidal and trapezoidal. Methane is selected as hot fluid because it is the main component of NG, and nitrogen is set as cold fluid due to its cheapness and safety in practical application. Bulk temperature and temperature difference between hot and cold fluid, as well as the local heat transfer coefficients, are calculated to explore the local heat transfer performance among different channels. After which the pressure loss, velocity, Reynolds number, turbulence kinetic energy and vortex structure are computed to study the local hydraulic characteristics. Furthermore, the comprehensive performance of different channels has been compared and it has provided guidance for the design of PCHEs.

2. Numerical Model

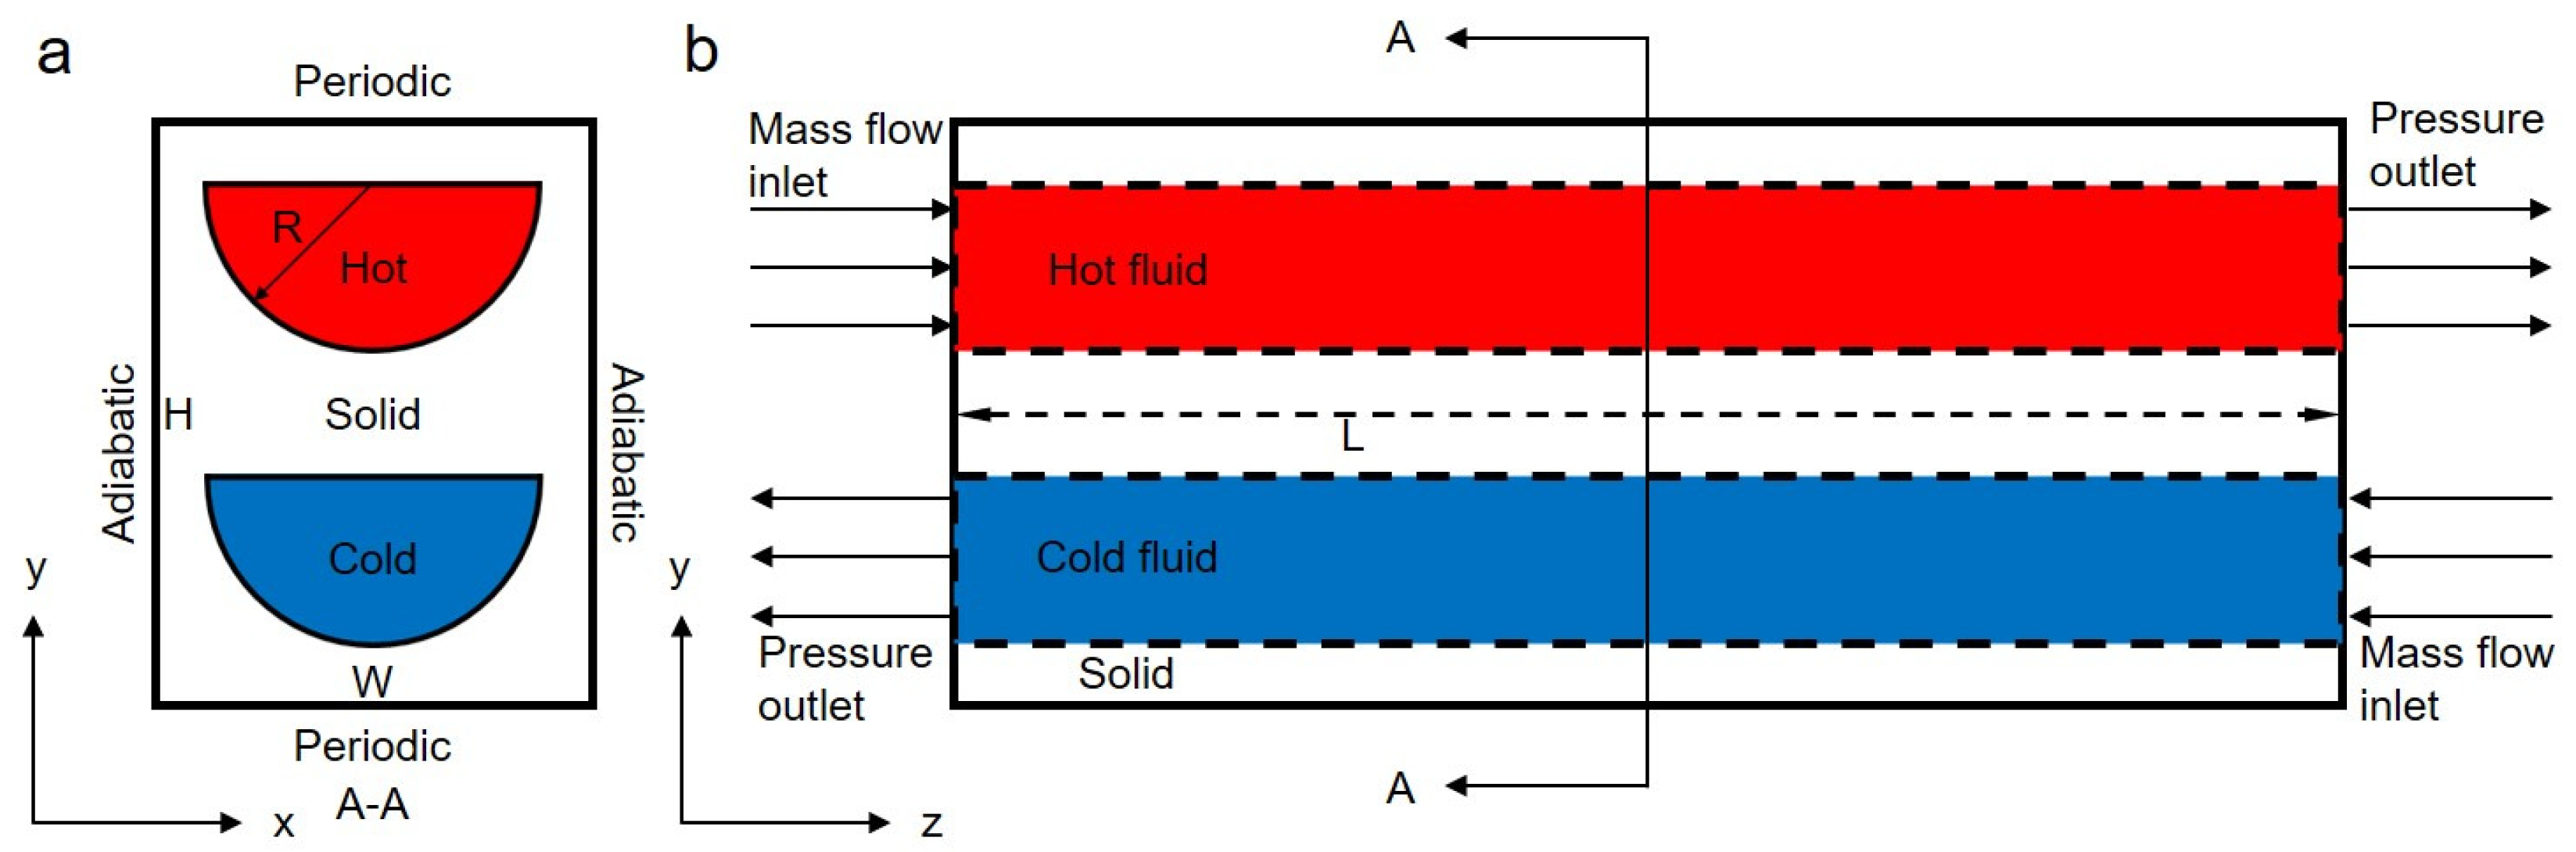
2.1. Computational Domain

Straight channel PCHE with semi-circular cross-section is first established. Counter-flow between hot and cold fluid is adopted to optimize the performance of heat exchange [12]. Figure 1 depicts the boundary conditions and geometry configuration of a double bank unit in the periodically distributed channels. For the flow of the hot and cold fluid, the boundaries of inlets and outlets are set as mass flow inlets and pressure outlets, respectively [19]. The interior walls between the fluid and solid region are set as an interface (dash line in Figure 1b), upper and lower walls of the solid region are defined as periodic boundaries (Figure 1a), and all other exterior walls are set as adiabatic boundaries.
In this study, methane and nitrogen are specified as the heat source and heat sink, respectively. In addition, the mass flow rate of methane is 0.06 g/s with an operating pressure of 6 MPa, and that of nitrogen is 0.27 g/s with an operating pressure of 0.5 MPa [19]. To make the pseudo-critical point of methane appear at the midpoint of the channels, we pre-calculate the model and determine that the inlet temperature of methane and nitrogen are 230 K and 110 K, respectively. Therefore, the Reynolds number for hot fluid at inlet and outlet is about 5.3 × 10³ and 1.3 × 10³, while that for cold fluid at inlet and outlet is near 3.3 × 10⁴ and 2.0 × 10⁴, respectively.
To further study the effect of the geometry configuration on flow and heat transfer characteristics, we establish four wavy-channel models (Figure 2) that share the same R, W, H, and the projection length on the z-axis with the straight channel. Detailed geometry parameters are listed in Table 1. Additionally, we add coupled extension segments of the fluid domain in the inlets and outlets to all the models (including the straight channel). The former is to obtain uniform distribution of flow velocity, and the latter is to avoid the influence of backflow.

2.2. Computational Model
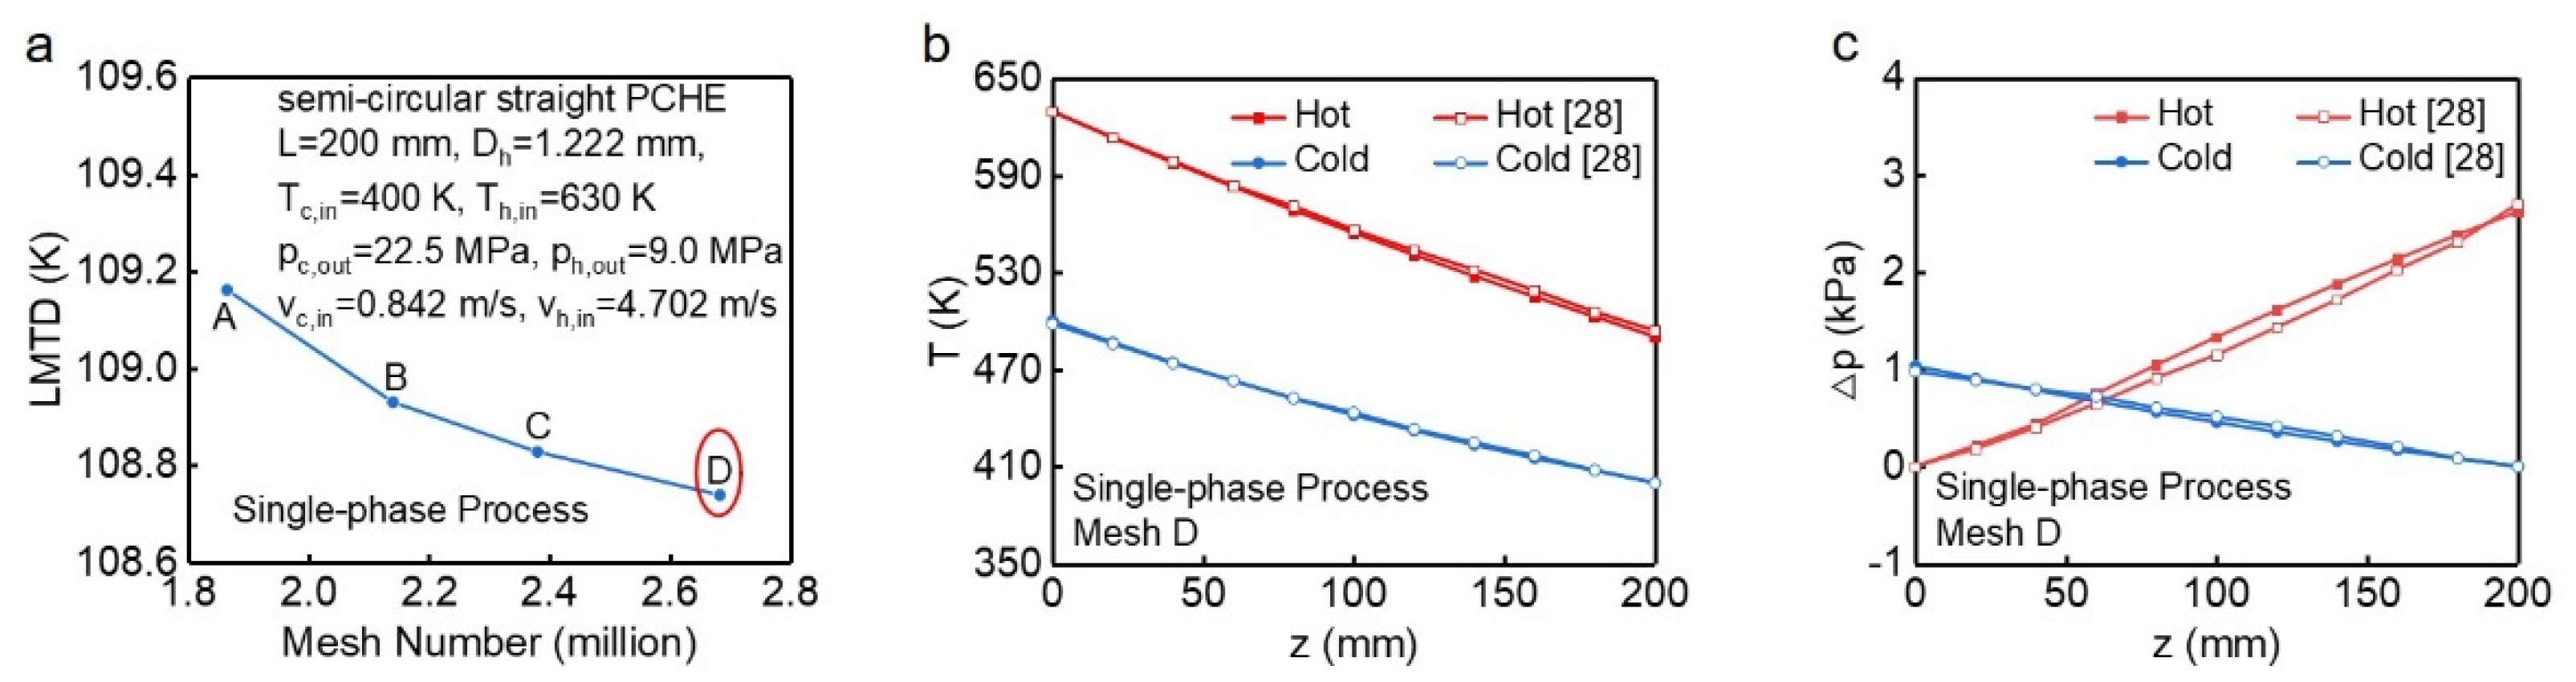
During the heat exchange process, methane has undergone a transition from a supercritical state to a liquefied state. According to Ma [20], there are no volume changes and no interface between the two states in the trans-critical process, therefore, the methane could be treated as a single-phase flow. Figure 3 shows the variation of thermo-physical properties of methane under working conditions. Since the focused properties drastically change with a temperature near the pseudo-critical point, we describe them through piecewise fitting, of which the fitting error is less than 1%. As for nitrogen and solid material, simple polynomial fitting is adopted because their thermal physical properties change gradually in the heat exchange process [21].
The Shear Stress Transport k-ω model (SST) is adopted to compute the turbulent flow of current fluids due to its suitability for trans-critical fluids and accuracy for both bulk and boundary layer regions [4,20,22,23,24,25,26,27]. The height of the first layer of the grid in the boundary region is carefully specified to ensure the grid fulfills the requirement of SST (y+ < 1).
In this work, we adopt FLUENT 15.0 to calculate the three-dimensional steady-state model, where a pressure-based solver and SIMPLE algorithm are utilized to compute the flow field, and the second-order upwind format is selected for convection terms. During computation, the inlet/outlet bulk temperature, mass flow rate and the heat flux between two channels are additionally monitored, when the residuals of all parameters are less than 10−6 and remain stable, the computation is considered to be converged.

2.3. Validation

Due to the lack of experimental results of trans-critical liquefaction of NG, and given that the NG can be treated as single-phase flow during this process [20], we finally adopted the data of coupling heat transfer of single-phase carbon dioxide in PCHEs to validate the current model [28]. Before validation, we first performed a mesh independence test on the single-phase model to ensure the grids had no effect on the calculation results (Figure 4a). When the mesh number increased from point C to D, the Logarithmic Mean Temperature Difference (LMTD) only increased by 0.39%, therefore, the grid’s number corresponding to point D was selected for subsequent calculations. The numerical results of the current model (Figure 4b,c) are highly consistent with the results in the literature [28], where the maximum relative error of bulk temperature and pressures are 0.77% and 18.28%, respectively, indicating the present model is feasible.

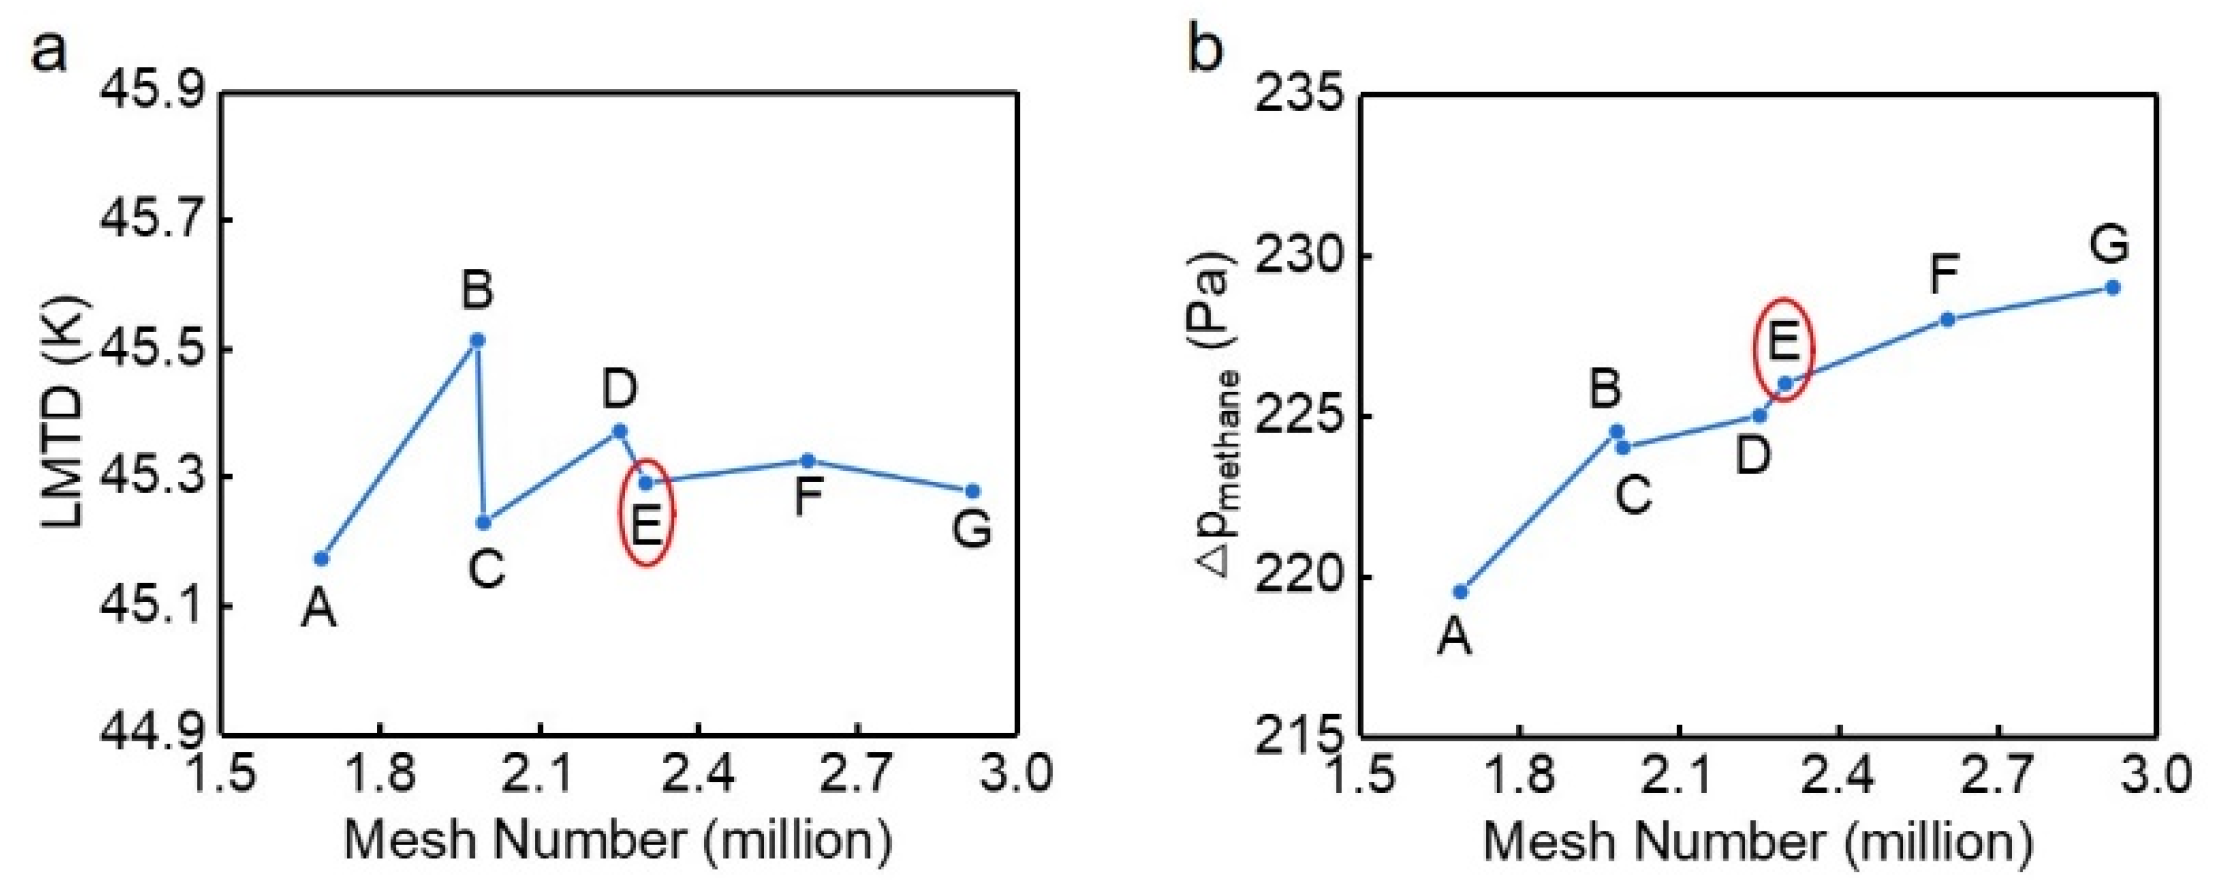
2.4. Mesh Independence Test

We conducted a mesh independence test separately for the nodes number in the cross-section and along the flow direction. The logarithmic mean temperature difference (LMTD) of the PCHE and the pressure drop of the hot fluid were chosen as the two criteria in this work. Figure 5 depicts that, for both criteria, the relative difference between the numerical results corresponding to points E and G is within 1.5%, so we chose the mesh number corresponding to point E.

3. Results and Discussion

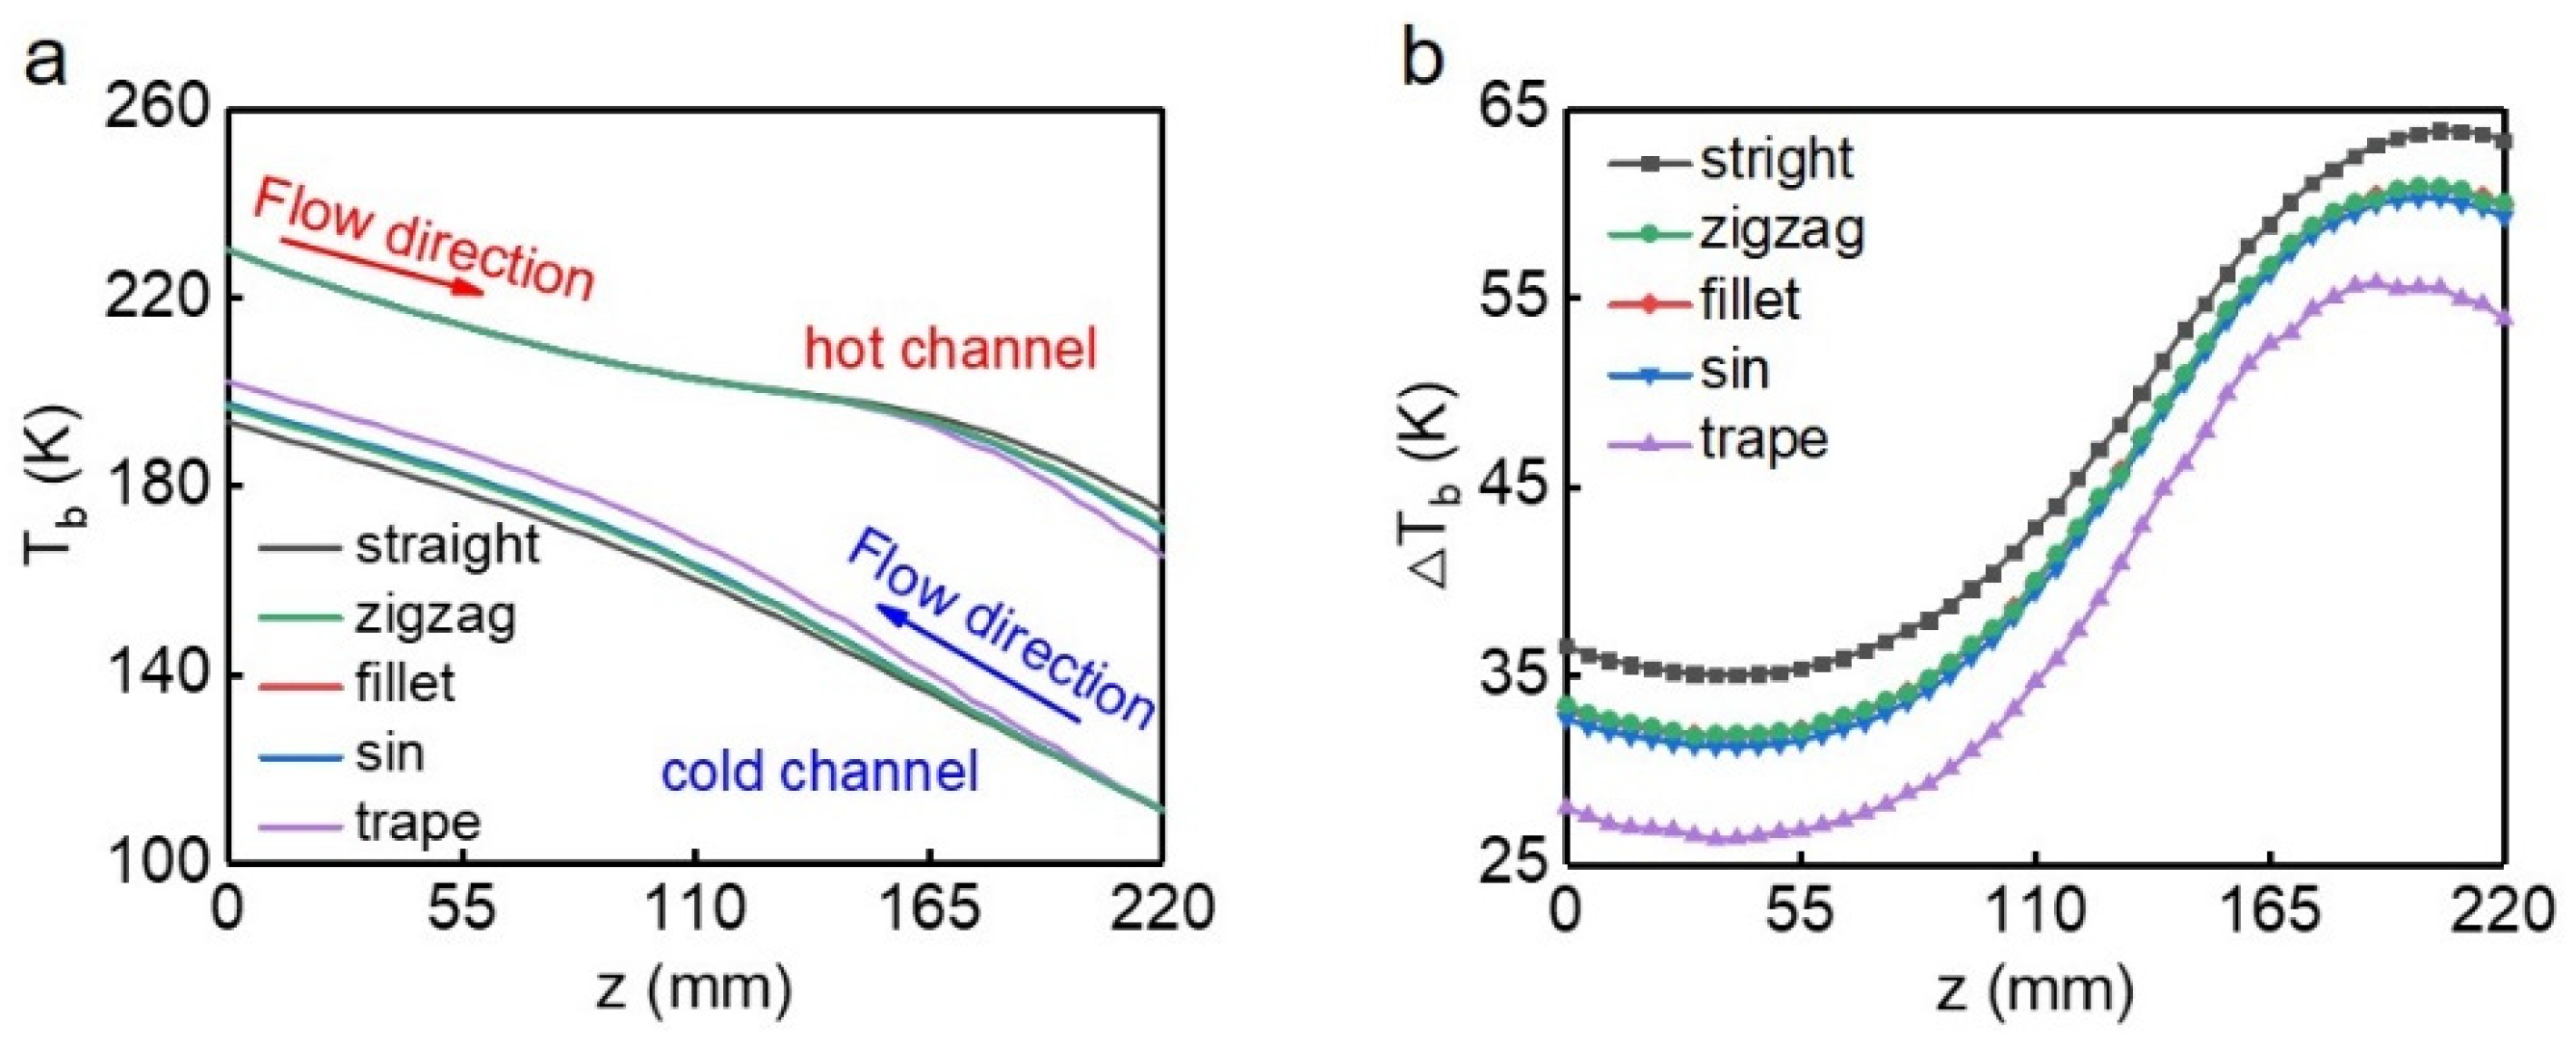
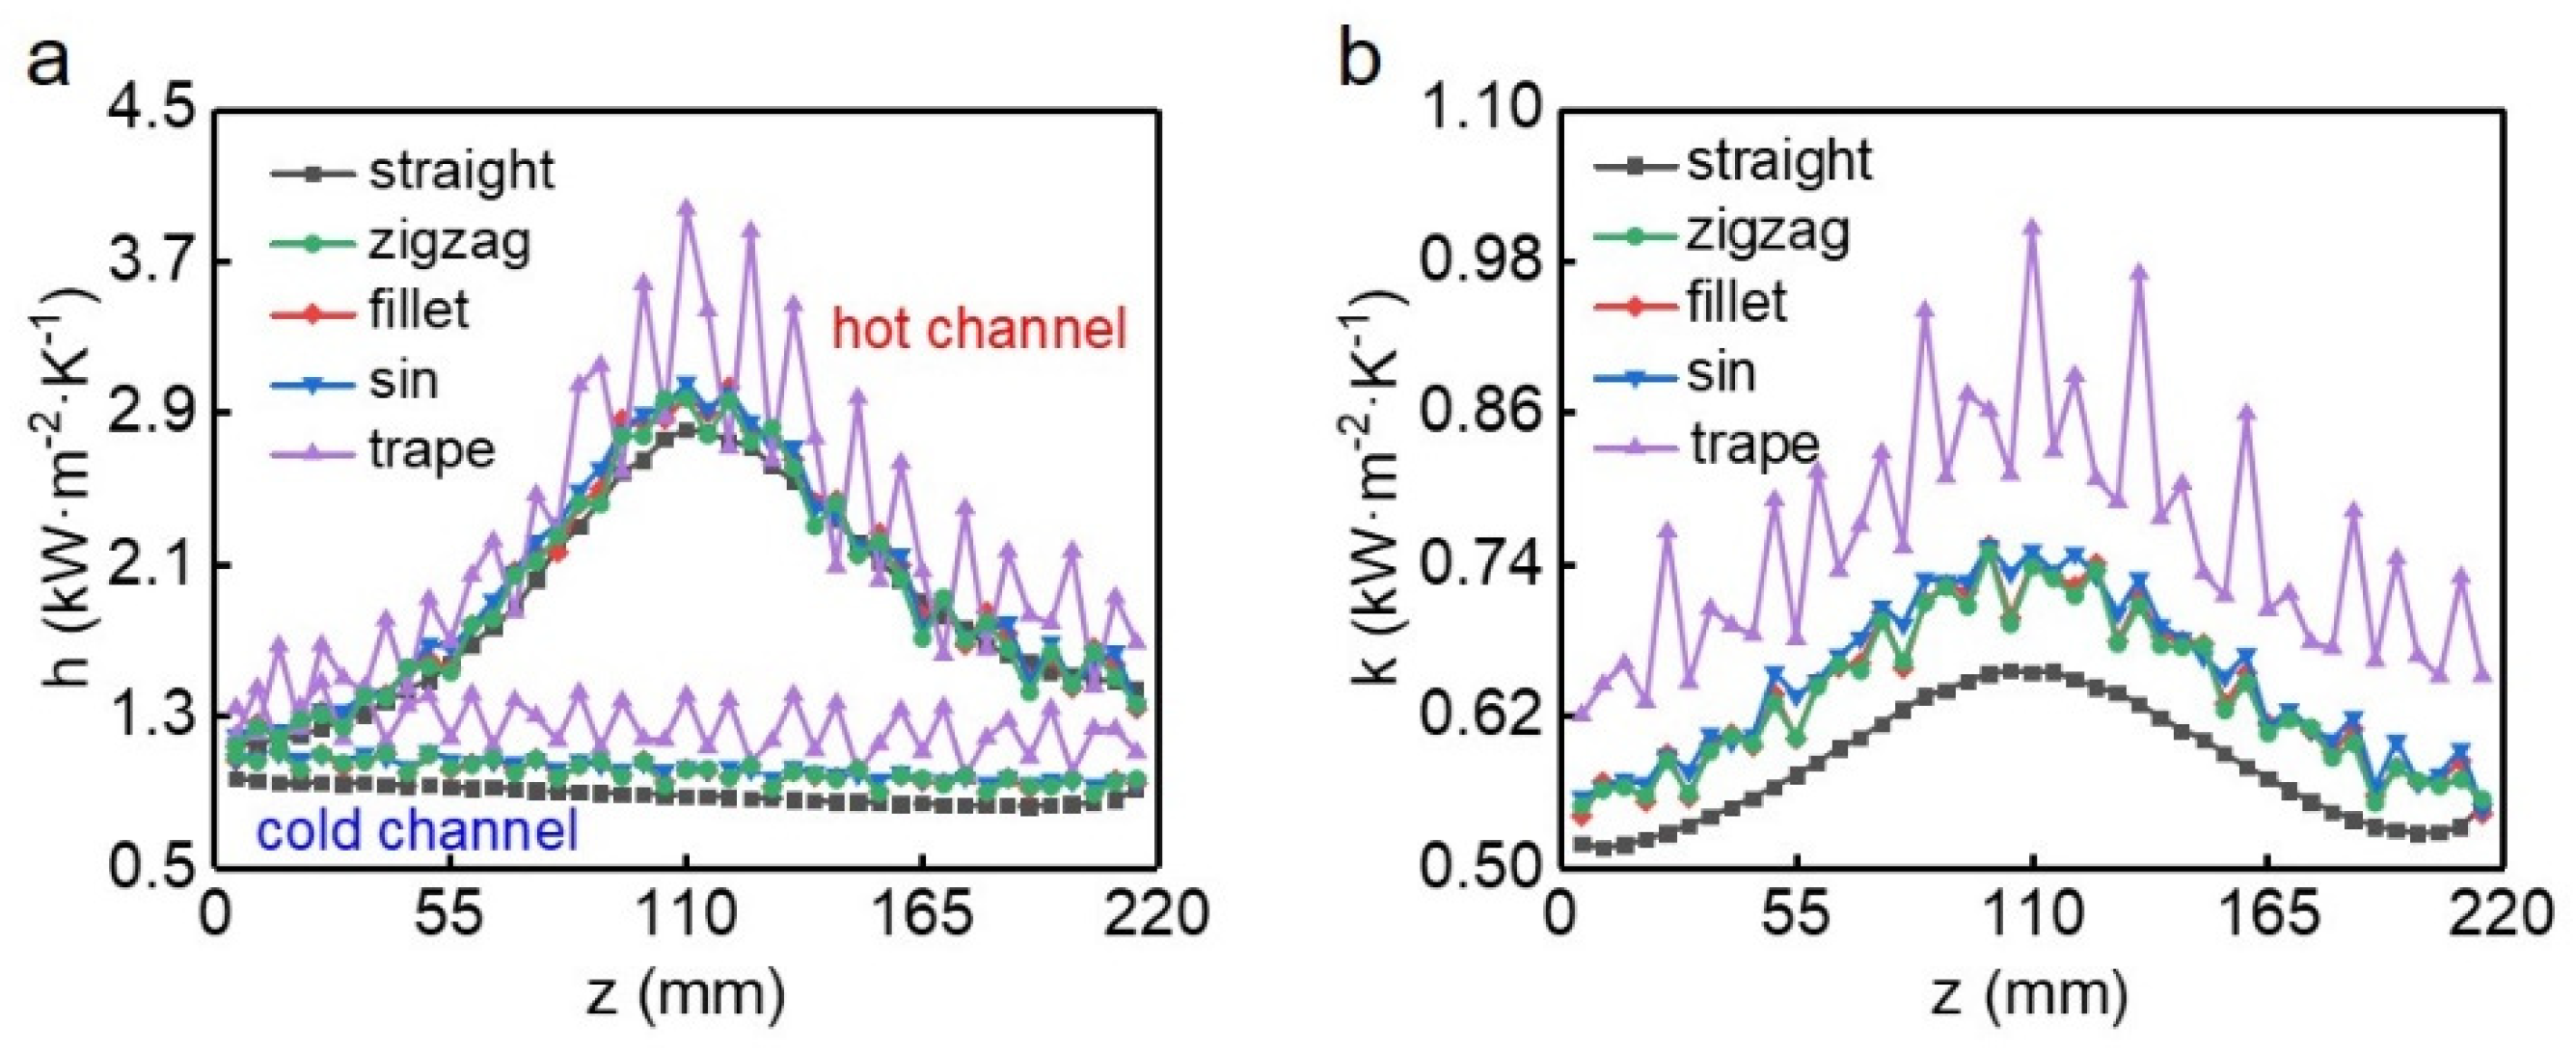
3.1. Heat Transfer Characteristics

From Figure 6a, the temperature of hot fluid changes rapidly with the position in the entrance and exit segments of the channel, this is because the specific heat capacity of methane is relatively small in these locations. At the selected operating pressure, the pseudo-critical temperature of methane is 199.6 K, which is approximately at z = 131 mm for all the channels. When the temperature of methane is in the range of trans-critical process, the hot fluid would release a large amount of heat due to the sharp increase in specific heat capacity (Figure 3), while the specific heat capacity of nitrogen did not change significantly, therefore, a plateau of temperature appears near the pseudo-critical point. After methane reaches the liquefied state, the distribution of temperature among the five channels begins to show differences. Finally, the trapezoidal channel achieved the maximum temperature drop of 66.0 K, the straight channel produces the minimum temperature drop of 56.4 K, and the remaining three channels achieve almost the same temperature drop, which is 60.0 K. As for the cold fluid, it is the trapezoidal channel that shows the most significant temperature rise of nitrogen as well, and a corresponding smallest heat transfer temperature difference is illustrated in Figure 6b. In all the channels, the temperature difference between the hot and cold fluids changes severely with a position near the pseudo-critical point, which is also due to the dramatic change in the thermal physical properties of methane in the process of coupling trans-critical heat exchange.
Then we calculated the local convective heat transfer coefficients (h) and local heat transfer coefficients (k) for different types of channels (Figure 7). In all channels, the maximum local convective heat transfer coefficient of methane appears before the pseudo-critical point (ca. 110 mm), this is because the temperature of methane in the thermal boundary layer first reduces to the pseudo-critical point, where methane reaches the peak value of specific heat capacity [20]. However, on the cold fluid side, the variation of h with positions is less obvious compared to the hot fluids. The flow direction and velocity magnitude of the fluids would change at the corners of the wavy channels, this perturbation to the flow would greatly disrupt the structure of the thermal boundary layer and improve the local performance of heat transfer. Thus, the local convective heat transfer coefficients in these locations are higher than that in non-corner regions, which is shown in Figure 7a as the fluctuation of the coefficients h along the streamwise direction. Since the number of bends in the trapezoidal channel is twice that of the other three wavy channels, the fluids are most disturbed in this channel, and the fluctuation of the local convective heat transfer coefficients is most severe. The variation of local heat transfer coefficient k is similar to that of h in the hot channel, and the difference in the baselines of k among the channels mainly comes from the difference of h in the cold channel (Figure 7b). Of the five channels, the trapezoidal channel has the best heat transfer performance, followed by the zigzag, fillet and sinusoidal channels, with the straight channel last.

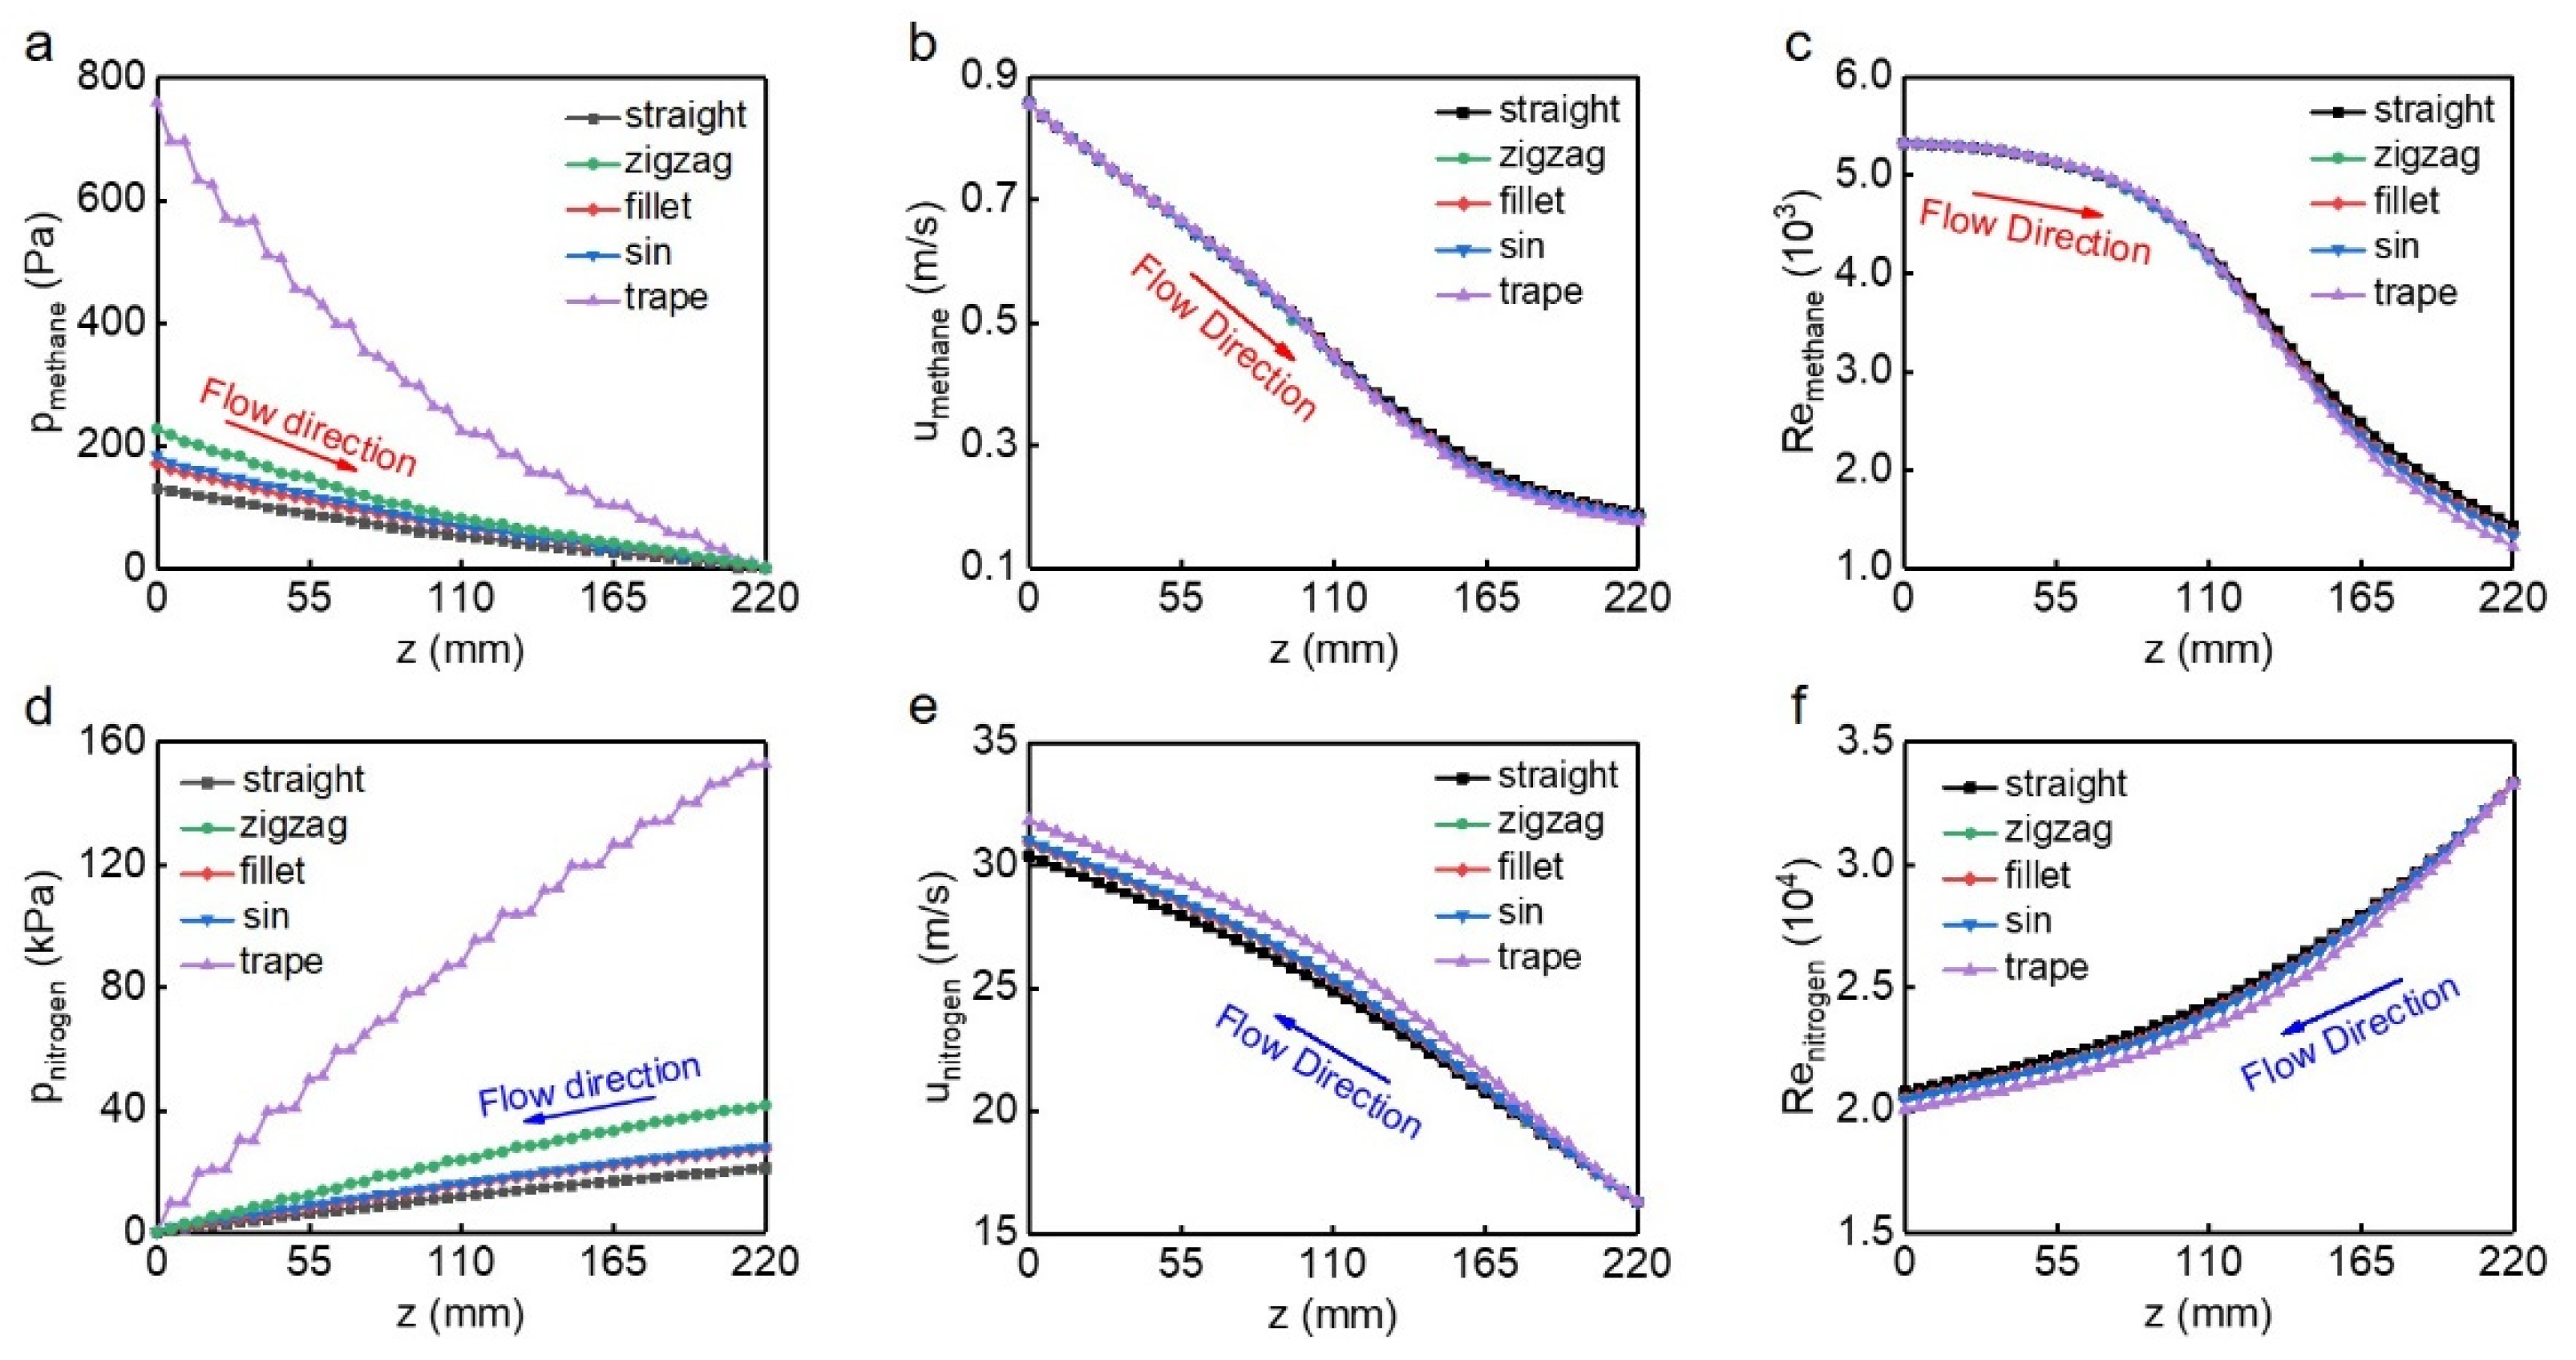
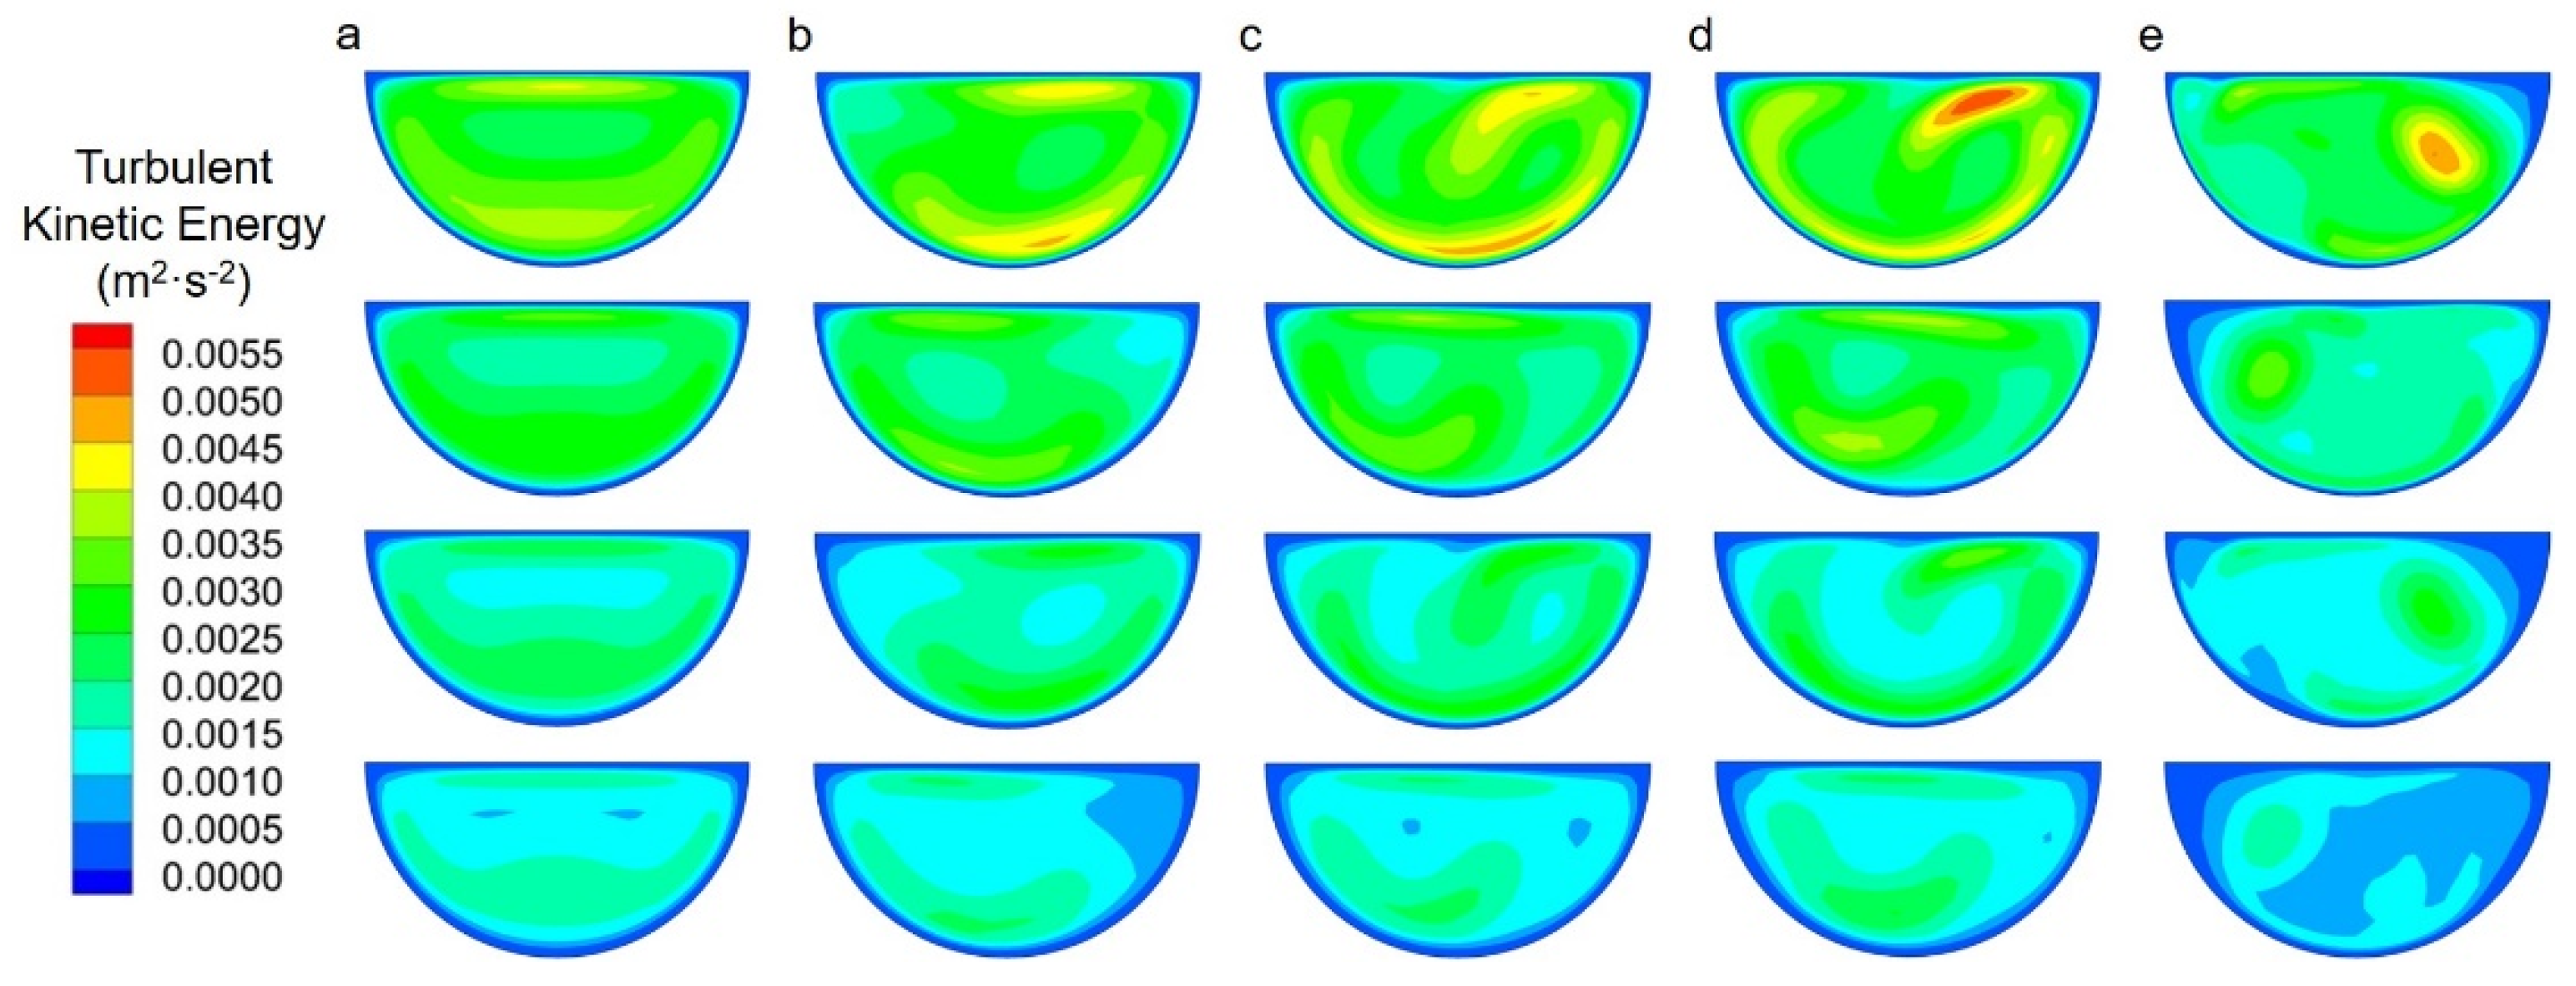
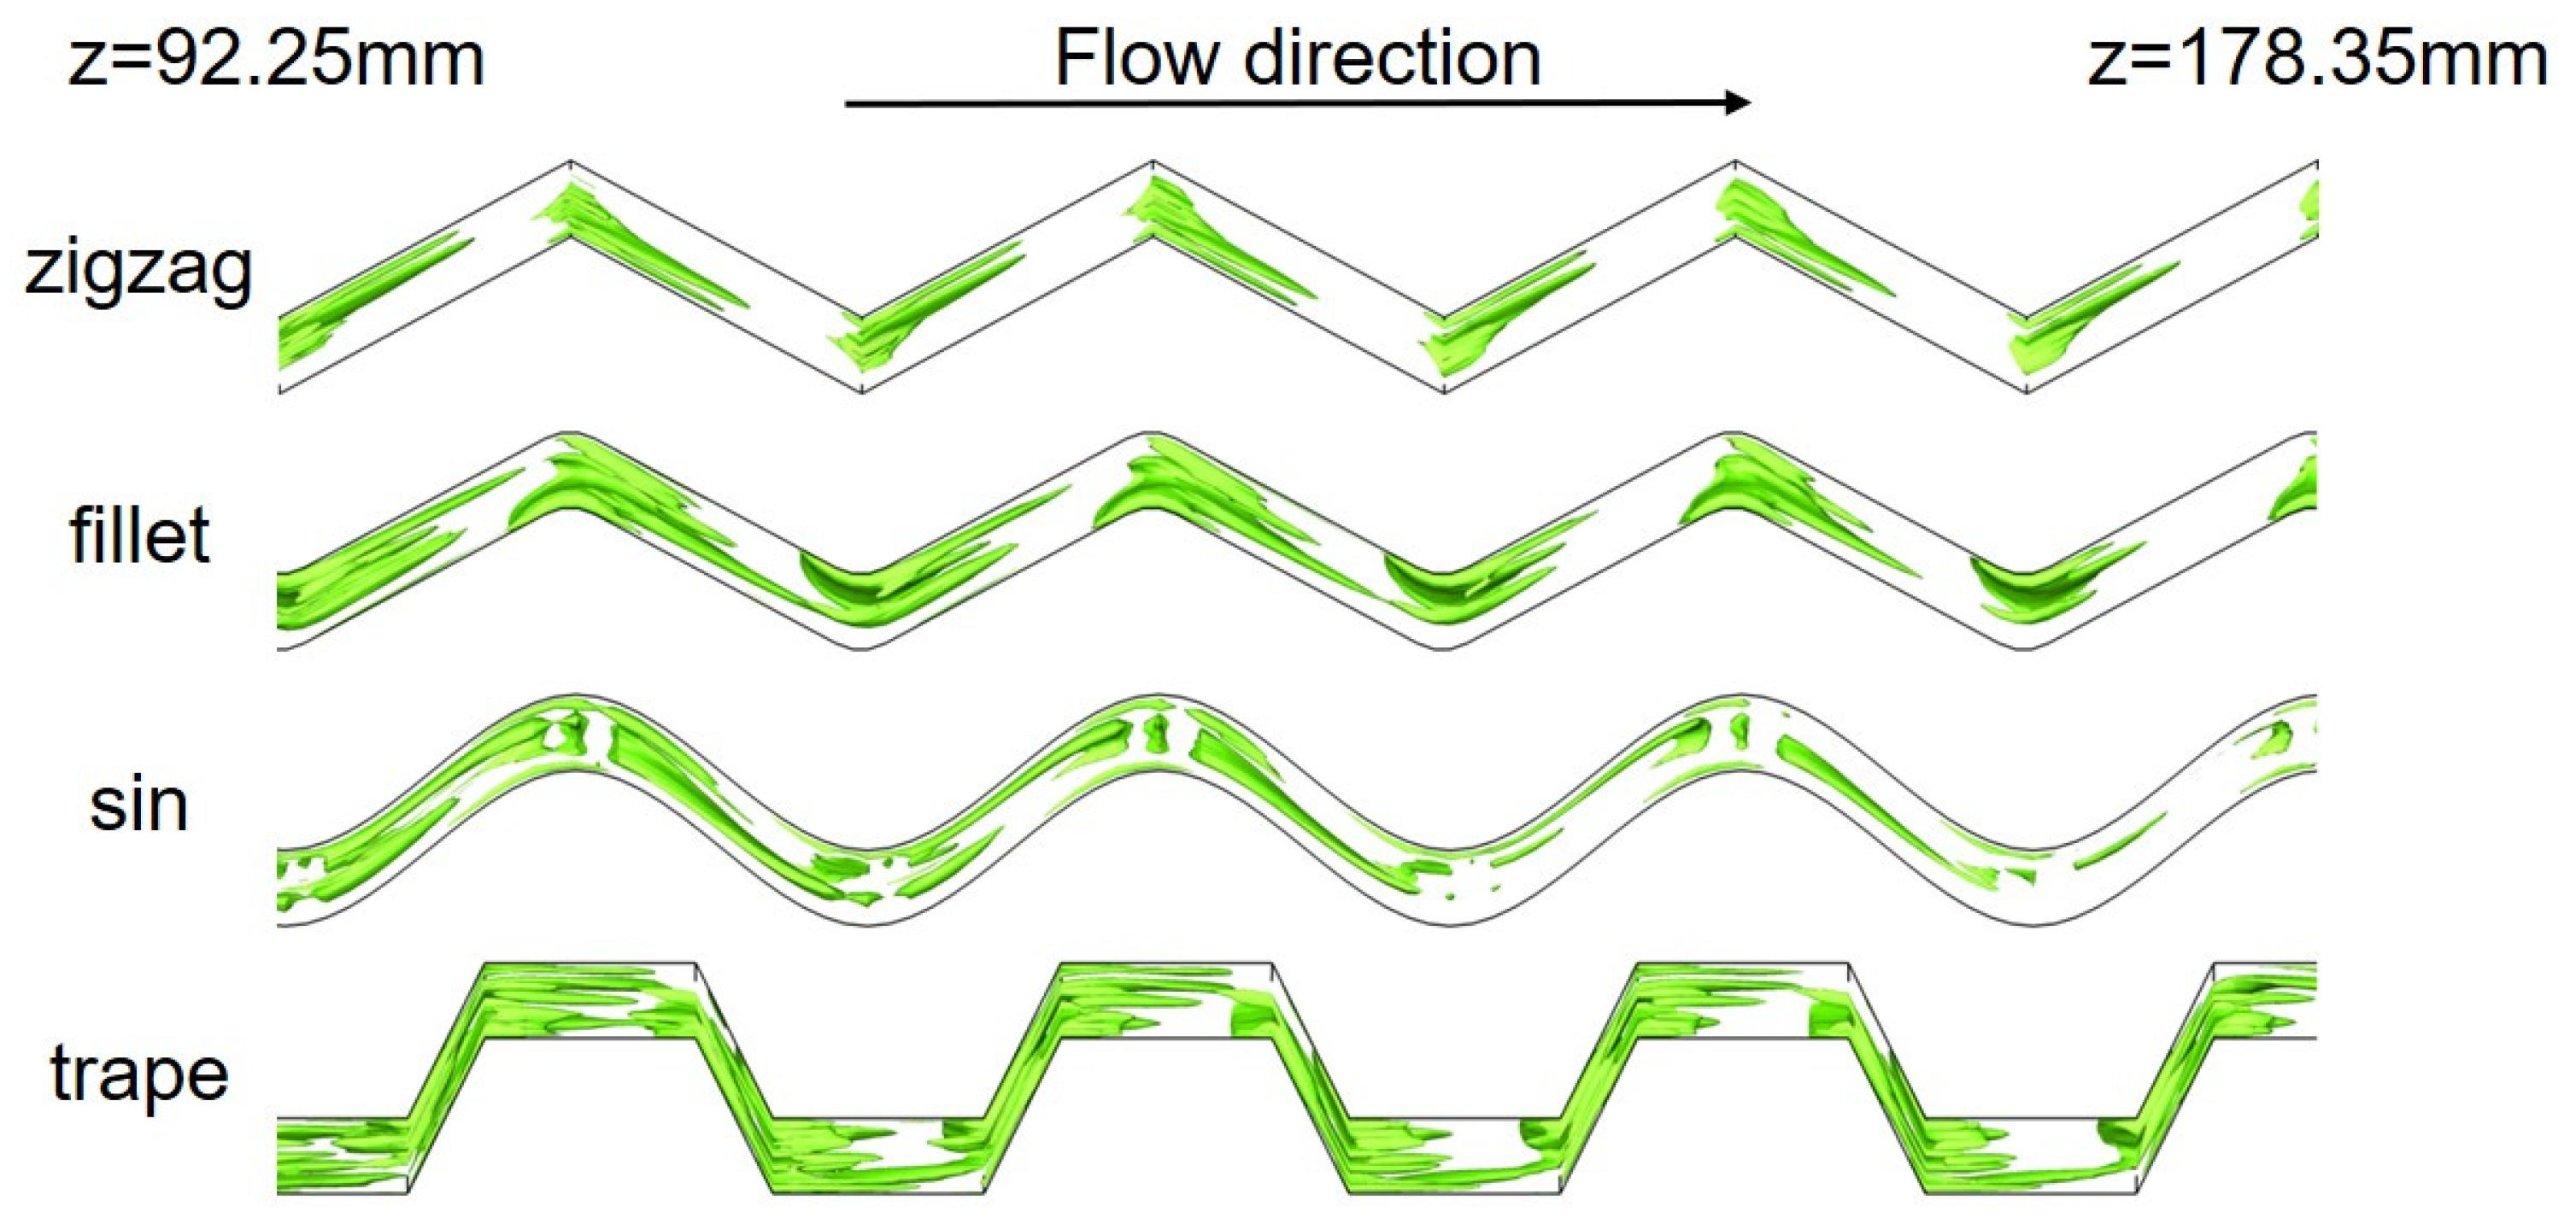
3.2. Flow Characteristics

In order to study the causes of resistance, we investigated the flow characteristics of hot and cold fluids in the process of heat exchange. Among the five channels, the trapezoidal channel has the longest total length and the largest number of corners, resulting in the largest pressure drop which is 3.0 times larger than that of the remaining three wavy channels and nearly 4.5 times larger than that of the straight channel (Figure 8a). Additionally, since the friction loss at the corners is larger than that at non-corners, the pressure drop gradient at these positions is larger, hence the pressure drop in the wavy channels shows a stepped distribution. During the trans-critical process, the density of methane increases sharply, leading to a rapid decrease in its velocity in the streamwise direction (Figure 8b). When the methane completely enters the liquefied zone, the variation of velocity tends to be flattened due to the slight changes in the density. Likewise, the Reynolds number of methane greatly descends near the pseudo-critical point (Figure 8c). It is worth noting that, among the five channels, velocity and Reynolds number of methane differ only after the fluid reaches its liquefied state, which is consistent with the temperature drop. The pressure drop and velocity of the cold fluid are much larger than those of the hot fluid (Figure 8d,e), this is caused by the difference in mass flow rate and thermal physical properties between the two working fluids. During the whole heat exchange process, although the velocity of nitrogen is increasing, its Reynolds number decreases along the flow direction (Figure 8f), which indicates that the effect of increasing viscous force is dominant.
Figure 9 shows the turbulent kinetic energy contour of methane along the streamwise direction, the four cross-sections are located at z = 116.85 mm, 129.15 mm (near pseudo-critical point), 141.45 mm and 153.75 mm. The sections of the zigzag, fillet and sinusoidal channels are all at the bends, while the sections of the trapezoidal channel locate at its 1/4 period [16]. Along the flow direction, the reduction of flow velocity leads to a gradual decrease in the turbulent kinetic energy, while the existence of the bends makes the turbulent kinetic energy of the wavy channels significantly higher than that of the straight channel. There are obvious turbulent cores that appeared in all the wavy channels, and the morphology of the boundary layer is disturbed; it is the strong mixing effect that increases local friction loss and improves local heat transfer performance. Since the cross-section of the trapezoidal channel does not locate at the bends, of which the turbulent kinetic energy is slightly smaller than that of the other three wavy channels. However, the distribution of turbulent kinetic energy on the sections of the trapezoidal channel is still the most inhomogeneous, which can also explain that methane has the largest pressure loss and largest temperature drop in the trapezoidal channel.
The Q criterion (Q = 10,000) was adopted to obtain the vortex structure of the hot fluid among different channels in the range of z = 92.25 to 178.35 mm (Figure 10). In all the wavy channels, the vortex intensity is larger at corners, which increases the local pressure drop gradient and local heat transfer performance at these locations. Part of the strong vortex vanishes as the flow develops at non-corners; therefore, the friction loss is reduced, and the heat transfer enhancement is weakened. The vortex in the trapezoidal channel is strongest, which is consistent with the results shown in Figure 7 and Figure 8.

3.3. Comprehensive Performance

To comprehensively evaluate the several channels, average surface heat transfer coefficient U, Fanning friction factor f and Performance Evaluation Criteria (PEC) were adopted (Figure 11) as in references [29,30]. The average surface heat transfer coefficient U can be calculated as:
U = q A Δ T L M T D
where q (W) is the heat transfer rate, A (m2) is the heat transfer area, ΔTLMTD (K) is the logarithmic mean temperature difference (LMTD) of bulk temperature. The detail can be found can be found in the reference of [17].
The Fanning friction factor f is determined by Equation (2).
f = Δ p D h 2 L ρ m u m 2
where Δp (Pa) is the pressure drop, Dh (m) is the hydraulic diameter, L (m) is the length of the fluid flowing, ρm (kg·m−3) is the mean density of fluid, um (m·s−1) is the mean velocity of fluid.
The Performance Evaluation Criteria (PEC) can be calculated as following:
P E C = N u h o t / N u h o t , s ( f h o t / f h o t , s ) 1 3
N u h o t = h m , h o t D h λ m , h o t
h m , h o t = q h o t A Δ T h o t
where Nu (-) is Nusselt number, f (-) is the Fanning friction factor, hm (W·m−2·K−1) is the average convective heat transfer coefficient, λm (W·m−1·K−1) is the mean thermal conductivity of fluid, q (W) is the heat transfer rate, ΔT (K) is the temperature difference of heat transfer, the subscript hot represents the hot side, s represents the straight channel. In addition, other detailed information can be found in the reference of [30].
Compared with the straight channel, the coefficients U of the other four wavy channels can be improved by 10.26%, 10.83%, 12.90% and 31.44%, respectively. Although the coefficients f would be increased by 56.82%, 20.45%, 22.73% and 281.82% in wavy channels. Consistent with previous results, the trapezoidal channel has the largest heat transfer coefficient and fanning friction factor. However, the PECs of the four wavy channels are all less than 1.0, indicating that the benefit of heat transfer enhancement could not offset the penalty of flow deterioration.

4. Conclusions

In this study, numerical methods are adopted to investigate the flow and heat transfer performance of PCHEs with straight, zigzag, fillet, sinusoidal and trapezoidal channels in the trans-critical liquefaction process of methane. The results indicate that:
(1)
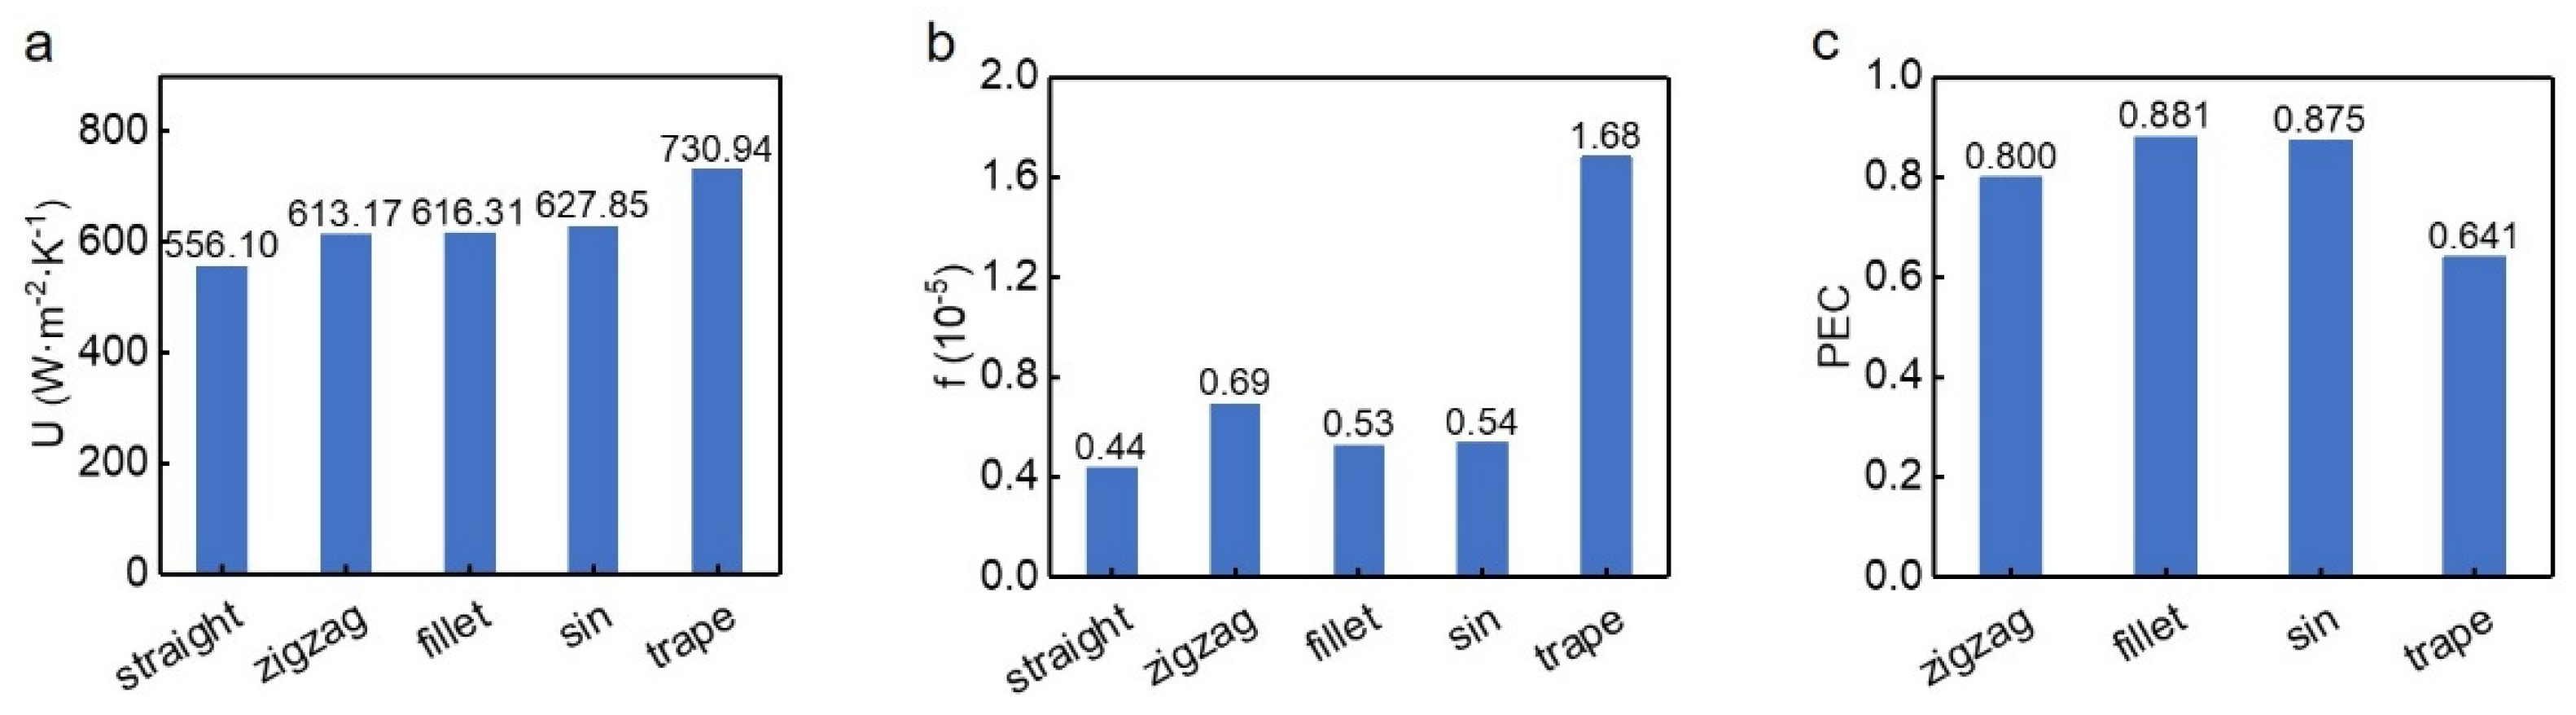
The local heat transfer coefficients peak near the pseudo-critical point of NG among all the channels. Additionally, all the wavy channels can improve the heat transfer performance of PCHEs, where the largest enhancement is achieved by the trapezoidal channel. Compared with the straight channel, the local heat transfer coefficient will be increased by up to 53% in the trapezoidal channel.
(2)
The vortex will greatly increase the local pressure drop gradient in the wavy channels. The trapezoidal channel has the largest pressure loss which is 3.0 times larger than that of the remaining three wavy channels and nearly 4.5 times larger than that of the straight channel.
(3)
All the wavy channels can improve the performance of heat transfer by 10.26%, 10.83%, 12.90% and 31.44%, respectively; however, the benefit of the improvement cannot offset the penalty of flow deterioration.

Author Contributions

Conceptualization, L.L.; methodology, A.Y.; validation, Q.S.; writing—original draft preparation, X.X. and C.Z.; writing—review and editing, X.Y.; supervision, X.Y. All authors have read and agreed to the published version of the manuscript.

Funding

This research was funded by the National Natural Science Foundation of China (Grant No. 51906180 and 51909235).

Institutional Review Board Statement

Not applicable.

Informed Consent Statement

Informed consent was obtained from all subjects involved in the study.

Data Availability Statement

Not applicable.

Acknowledgments

The authors gratefully acknowledge the financial support from the National Natural Science Foundation of China (Grant No. 51906180 and 51909235).

Conflicts of Interest

The authors declare no conflict of interest.

Nomenclature

Aamplitude (mm)
cpspecific heat (J/kg K)
fFanning friction factor
FLNGfloating liquefied natural gas
hlocal convective heat transfer coefficient (W/m2 K)
klocal heat transfer coefficient (W/m2 K)
Lflowchannel length (mm)
Lswsweep length (mm)
LMTDlogarithmic mean temperature difference
LNGliquefied natural gas
NGnatural gas
ppressure (Pa)
PCHEsprinted circuit heat exchangers
PECperformance evaluation criteria
rchamfer radius (mm)
SSTSST kω model
Tbulk temperature (°C)
uvelocity (m/s)
Uaverage surface heat transfer coefficient (W/m2 K)
Greek
λhalf wavelength (mm)
μdynamic viscosity (kg/m s)
ρdensity (kg/m3)

References

  1. Basak, M.; Perrons, R.K.; Coffey, V. Schedule overruns as a barrier for liquefied natural gas projects: A review of the literature and research agenda. Energy Rep. 2019, 5, 210–220. [Google Scholar] [CrossRef]
  2. Zhang, J.; Tan, Y.; Zhang, T.; Yu, K.; Wang, X.; Zhao, Q. Natural gas market and underground gas storage development in China. J. Energy Storage 2020, 29, 101338. [Google Scholar] [CrossRef]
  3. Gowid, S.; Dixon, R.; Ghani, S. Profitability, reliability and condition based monitoring of LNG floating platforms: A review. J. Nat. Gas Sci. Eng. 2015, 27, 1495–1511. [Google Scholar] [CrossRef] [Green Version]
  4. Peng, Z.-R.; Zheng, Q.-Y.; Chen, J.; Yu, S.-C.; Zhang, X.-R. Numerical investigation on heat transfer and pressure drop characteristics of coupling transcritical flow and two-phase flow in a printed circuit heat exchanger. Int. J. Heat Mass Transf. 2020, 153, 119557. [Google Scholar] [CrossRef]
  5. Zhu, J.; Sun, C.; Li, Y.; Shan, W. Experiment on adaptability of feed gas flow rate and sea conditions on FLNG spiral wound heat exchanger. Int. J. Heat Mass Transf. 2019, 138, 659–666. [Google Scholar] [CrossRef]
  6. Lee, S.; Long, N.V.D.; Lee, M. Design and optimization of natural gas liquefaction and recovery processes for offshore floating liquefied natural gas plants. Ind. Eng. Chem. Res. 2012, 51, 10021–10030. [Google Scholar] [CrossRef]
  7. Wang, K.; Ren, T.; Ding, G. Progress of research and application of printed circuit heat exchanger for offshore LNG platform. J. Refrig. 2016, 37, 70–77. [Google Scholar]
  8. McCormack, D. In the application of printed circuit heat exchanger technology in the pebble bed modular reactor demonstration plant. In Proceedings of the Turbo Expo: Power for Land, Sea, and Air, American Society of Mechanical Engineers, New Orleans, LA, USA, 4–7 June 2001; p. V003T01A086. [Google Scholar]
  9. Figley, J.T. Numerical Modeling and Performance Analysis of Printed Circuit Heat Exchanger for Very High-Temperature Reactors. Master’s Thesis, The Ohio State University, Columbus, OH, USA, 2009. [Google Scholar]
  10. Huang, C.; Cai, W.; Wang, Y.; Liu, Y.; Li, Q.; Li, B. Review on the characteristics of flow and heat transfer in printed circuit heat exchangers. Appl. Therm. Eng. 2019, 153, 190–205. [Google Scholar] [CrossRef]
  11. Reay, D. Compact heat exchangers: A review of current equipment and R&D in the field. Heat Recovery Syst. CHP 1994, 14, 459–474. [Google Scholar]
  12. Kim, W.; Baik, Y.-J.; Jeon, S.; Jeon, D.; Byon, C. A mathematical correlation for predicting the thermal performance of cross, parallel, and counterflow PCHEs. Int. J. Heat Mass Transf. 2017, 106, 1294–1302. [Google Scholar] [CrossRef]
  13. Ma, T.; Li, M.-J.; Xu, J.-L.; Cao, F. Thermodynamic analysis and performance prediction on dynamic response characteristic of PCHE in 1000 MW S-CO2 coal fired power plant. Energy 2019, 175, 123–138. [Google Scholar] [CrossRef]
  14. Shin, C.W.; No, H.C. Experimental study for pressure drop and flow instability of two-phase flow in the PCHE-type steam generator for SMRs. Nucl. Eng. Des. 2017, 318, 109–118. [Google Scholar] [CrossRef]
  15. Palko, D.; Anglart, H. Theoretical and numerical study of heat transfer deterioration in high performance light water reactor. Sci. Technol. Nucl. Install. 2008, 2008, 405072. [Google Scholar] [CrossRef] [Green Version]
  16. Aneesh, A.; Sharma, A.; Srivastava, A.; Chaudhury, P. Effects of wavy channel configurations on thermal-hydraulic characteristics of Printed Circuit Heat Exchanger (PCHE). Int. J. Heat Mass Transf. 2018, 118, 304–315. [Google Scholar] [CrossRef]
  17. Kwon, D.; Jin, L.; Jung, W.; Jeong, S. Experimental investigation of heat transfer coefficient of mini-channel PCHE (printed circuit heat exchanger). Cryogenics 2018, 92, 41–49. [Google Scholar] [CrossRef]
  18. Zhao, Z.; Zhao, K.; Jia, D.; Jiang, P.; Shen, R. Numerical investigation on the flow and heat transfer characteristics of supercritical liquefied natural gas in an airfoil fin printed circuit heat exchanger. Energies 2017, 10, 1828. [Google Scholar] [CrossRef] [Green Version]
  19. Zhang, P.; Ma, T.; Ke, H.; Wang, W.; Lin, Y.; Wang, Q. Numerical investigation on local thermal characteristics of printed circuit heat exchanger for natural gas liquefication. Energy Procedia 2019, 158, 5408–5413. [Google Scholar] [CrossRef]
  20. Ma, T.; Zhang, P.; Lian, J.; Ke, H.; Wang, W.; Lin, Y.; Wang, Q. Numerical Study on Flow and Heat Transfer Performance of Natural Gas in a Printed Circuit Heat Exchanger During Transcritical Liquefaction. J. Fluids Eng. 2021, 143, 040901. [Google Scholar] [CrossRef]
  21. Smith, L.; Craig, B. Properties of metallic materials for LNG service. Stainl. Steel World 2001, 13, 27–32. [Google Scholar]
  22. Li, H.; Kruizenga, A.; Anderson, M.; Corradini, M.; Luo, Y.; Wang, H.; Li, H. Development of a new forced convection heat transfer correlation for CO2 in both heating and cooling modes at supercritical pressures. Int. J. Therm. Sci. 2011, 50, 2430–2442. [Google Scholar] [CrossRef]
  23. Li, H.; Zhang, Y.; Zhang, L.; Yao, M.; Kruizenga, A.; Anderson, M. PDF-based modeling on the turbulent convection heat transfer of supercritical CO2 in the printed circuit heat exchangers for the supercritical CO2 Brayton cycle. Int. J. Heat Mass Transf. 2016, 98, 204–218. [Google Scholar] [CrossRef]
  24. Xiang, M.; Guo, J.; Huai, X.; Cui, X. Thermal analysis of supercritical pressure CO2 in horizontal tubes under cooling condition. J. Supercrit. Fluids 2017, 130, 389–398. [Google Scholar] [CrossRef]
  25. Ren, Z.; Zhao, C.-R.; Jiang, P.-X.; Bo, H.-L. Investigation on local convection heat transfer of supercritical CO2 during cooling in horizontal semicircular channels of printed circuit heat exchanger. Appl. Therm. Eng. 2019, 157, 113697. [Google Scholar] [CrossRef]
  26. Zhang, H.; Guo, J.; Huai, X.; Cui, X.; Cheng, K. Buoyancy effects on coupled heat transfer of supercritical pressure CO2 in horizontal semicircular channels. Int. J. Heat Mass Transf. 2019, 134, 437–449. [Google Scholar] [CrossRef]
  27. Xu, X.; Wang, Q.; Li, L.; Chen, Y.; Ma, T. Study on thermal resistance distribution and local heat transfer enhancement method for SCO2–water heat exchange process near pseudo-critical temperature. Int. J. Heat Mass Transf. 2015, 82, 179–188. [Google Scholar] [CrossRef]
  28. Meshram, A.; Jaiswal, A.K.; Khivsara, S.D.; Ortega, J.D.; Ho, C.; Bapat, R.; Dutta, P. Modeling and analysis of a printed circuit heat exchanger for supercritical CO2 power cycle applications. Appl. Therm. Eng. 2016, 109, 861–870. [Google Scholar] [CrossRef] [Green Version]
  29. Webb, R.L. Performance evaluation criteria for use of enhanced heat transfer surfaces in heat exchanger design. Int. J. Heat Mass Transf. 1981, 24, 715–726. [Google Scholar] [CrossRef]
  30. Yang, S.; Zhao, Z.; Zhang, Y.; Chen, Z.; Yang, M. Effects of Fin Arrangements on Thermal Hydraulic Performance of Supercritical Nitrogen in Printed Circuit Heat Exchanger. Processes 2021, 9, 861. [Google Scholar] [CrossRef]
Figure 1. Boundary conditions and geometry configuration of a double bank unit in the straight PCHE. (a) Front view of cross section and (b) Side view along flow direction. The detail of geometry configuration is the following: R = 0.8 mm, W = 2.1 mm, H = 2.8 mm, L = 221.4 mm.
Atmosphere 13 00730 g001
Figure 2. Computational domain of the four wavy channels. (a) Zigzag channel; (b) Fillet channel; (c) Sinusoidal channel (Sin channel); (d) Trapezoidal channel (Trape channel). Insert: top view of the wavy channel in a half period.
Atmosphere 13 00730 g002
Figure 3. Variation of thermo-physical properties of methane. (a) Thermal conductivity; (b) Density; (c) Specific heat capacity; (d) Dynamic viscosity.
Atmosphere 13 00730 g003
Figure 4. Validation of coupling trans-critical heat transfer process. (a) Mesh independence test. (b) Bulk temperature and (c) Pressure drop of current model and reference.
Atmosphere 13 00730 g004
Figure 5. The numerical results with different mesh number. (a) LMTD; (b) Pressure drop in hot channel.
Atmosphere 13 00730 g005
Figure 6. The distribution of (a) Bulk temperature of hot and cold fluids and (b) Temperature difference along the flow direction among five channels.
Atmosphere 13 00730 g006
Figure 7. The distribution of (a) Local convective heat transfer coefficient h and (b) Local heat transfer coefficient k on both hot and cold sides along the flow direction in the five channels.
Atmosphere 13 00730 g007
Figure 8. Pressure, velocity and Reynolds number of the hot (ac) and cold (df) fluids, respectively. The outlet pressure is set at 0 MPa in (a,d).
Atmosphere 13 00730 g008
Figure 9. Turbulent kinetic energy contour of methane along flow direction in (a) Straight channel, (b) Zigzag channel, (c) Fillet channel, (d) Sinusoidal channel, (e) Trapezoidal channel.
Atmosphere 13 00730 g009
Figure 10. Vortex structure of the hot fluid among four wavy channels.
Atmosphere 13 00730 g010
Figure 11. Comprehensive performance of the channels. (a) Average surface heat transfer coefficient and (b) Fanning friction factor in all the channels. (c) Performance Evaluation Criteria value of the wavy channels.
Atmosphere 13 00730 g011
Table 1. Detailed geometry coefficients of the four wavy channels. All length units are in mm.
Geometry ParameterZigzagFilletSinTrape
Half wavelength λ12.312.312.312.3
Amplitude A1.6481.5071.6481.648
Chamfer radius r (or Sweep length Lsw)-4-9.004
Channel length Lflow229.212228.312230.662245.970
Publisher’s Note: MDPI stays neutral with regard to jurisdictional claims in published maps and institutional affiliations.

