
Comparison and Improvement of Bioinspired Mobile Algorithms to Trace the Emission Source Based on the Simulation Scenarios


1
School of Mechanical Engineering, Xi’an Jiaotong University, 28 West Xianning Road, Xi’an 710049, China
2
State Key Laboratory for Manufacturing Systems Engineering, Xi’an Jiaotong University, Xi’an 710049, China
3
Department of Mechanical and Materials Engineering, Wright State University, Dayton, OH 45354, USA
*
Author to whom correspondence should be addressed.
Atmosphere 2022, 13(5), 661; https://doi.org/10.3390/atmos13050661
Submission received: 17 March 2022
/
Revised: 18 April 2022
/
Accepted: 19 April 2022
/
Published: 21 April 2022
(This article belongs to the Special Issue Effects of Outdoor Pollutants on Human Health)
Abstract
:Hazardous gas emissions may have serious consequences for surrounding residents and the environment. Bioinspired mobile robots equipped with gas sensors have the potential to become a solution for precisely tracking and locating emission sources. In this study, the performance, efficiency, and accuracy of various bionic algorithms with bioinspired mobile sensors, i.e., silkworm, E. coli, ZigZag, and step-up algorithms, were compared using field simulations to track emission sources in the atmosphere. In the tracing process, the determination criteria of maximum concentration, minimum concentration (i.e., 0), and concentration gradient were discussed quantitatively. The simulation results showed that the silkworm algorithm has the best performance in locating the emission source, while the E. coli algorithm has the highest tracking efficiency. Therefore, a single source-determination criterion may be insufficient, since tracking accuracy and efficiency can vary with different simulation algorithms. To address these concerns, a new tracking strategy driven by the inverse motion and interface gradient (RMIG) was proposed, based on the behaviors of female mosquitoes seeking hosts by tracking CO2 plumes, to improve tracking efficiency. It was found that the locating efficiency driven by RMIG is greatly improved and higher than that of the E. coli algorithm in the tested cases, with 40% to 100% explicitly enhanced. Finally, the optimal correlated matching of concentration distribution (OCMCD) method was used to locate the source with a mobile sensor. Compared with traditional and common source-determination criteria, the RMIG-OCMCD method can significantly improve location accuracy. The proposed RMIG-OCMCD method could be a practical choice for tracking emission sources in the atmosphere if an appropriate search strategy is designed.

1. Introduction
The emission of hazardous gases in the production, transportation, storage, and utilization of chemicals has threatened human life, the environment, and the chemical production process. Hence, it is crucial to determine information about the source term after an emergency emission event occurs. A source locating investigation can provide effective and accurate information for emergency management and treatment following a hazardous substance emission event [1]. To improve efficiency and accuracy in tracing an emission source, many efforts have been deployed and can be categorized into two types of source-tracing methods [2,3]. One is based on static sensors combined with an inverse problem-solution method; the other is based on a mobile sensor integrated with a source-searching strategy.
The principle of the source-tracing method with static sensors is based on solving inverse problems corresponding to the forward gas dispersion process. After acquiring information about gas concentrations, atmospheric conditions, and environmental conditions, the source term parameters can be determined using various inverse problem-solution methods. Since the gas emission inverse problem is ill-posed, it is difficult to resolve it directly. Thus, the optimization method is proposed to identify source parameters. Haupt et al. [4] utilized genetic algorithms to estimate source terms. Ma et al. [5] also combined a classical optimization method with a heuristic method to determine source parameters. Due to the uncertainty of optimization in source identification, stochastic probability methods were applied to estimate source parameters with assumed confidence intervals. Bayesian theory is the core of the stochastic probability method, which requires prior information to infer the posterior probability about a source term. Hazarta et al. [6] and Kopka et al. [7] used the Markov Chain Monte Carlo (MCMC) method to provide samples for Bayesian inference to reconstruct a source term. Ma et al. [8] combined minimum relative entropy (MRE) with the particle optimization (PSO) method to estimate source parameters with probability distributions with assumed confidence intervals. Further, the Tikhonov parameter regularization method was applied to identify source parameters with the linear and nonlinear forward dispersion model proposed by Ma et al. [9,10]. Moreover, a method based on the inverse Lagrangian stochastic (LS) dispersion model was proposed to predict gas emission dispersion and to determine a source term [11]. Although the method of static sensors combined with a complex inverse algorithm is capable of estimating a source term successfully, there are still some limitations: (1) the accuracy of source estimation depends on information provided by the sensors, while limited static sensors cannot provide enough information for source estimation, and (2) the results of inverse estimation are often affected by the form and amount of sensor distribution.
It would be expensive and time-consuming to obtain accurate estimation results, since a large number of sensors would be needed. Nevertheless, the distribution of sensors is restricted by the field environment and by prior information. The algorithms of source estimation based on the inverse model rely on the accurate monitoring of data and detailed atmospheric information, such as wind speed, atmospheric stability, temperature, and wind direction. In addition, some parameters (i.e., atmospheric stability) are difficult to measure directly and require complex calculation processes. Further, some algorithms, such as MCMC and LS, are time-consuming and intensive for large scale applications.
Alternatively, an odor source trace with a mobile sensor becomes a solution. Mobile devices, such as robots or unmanned aerial vehicles (UAVs), integrated with gas sensors, can overcome the limitations of distributed static sensors, and have advantages in flexibility. In particular, mobile sensors become increasingly less expensive as electric technology is developed, which provides mobile sensors with more possibilities in their applications to source estimation tasks.
Current studies of mobile sensors for source emission location mainly involve gas discrimination, path planning, and source determination. Based on the behaviors of animals or microbes, different bioinspired algorithms have been proposed [12,13] to track emission sources. Generally, there are two kinds of source tracking algorithms with mobile sensors. One algorithm is based on chemical plume reaction. This method is inspired by the behavior of some microbes, insects, and crustaceans, which control their source-tracking process by information of chemical substances acquired from a dispersed chemical plume. Plume-tracking algorithms can be divided into three methods, based on the characteristics of chemotaxis, anemotaxis, and fluxotaxis. Chemotaxis algorithms are guided by chemical distribution gradients. For instance, the E. coli algorithm stimulates the behaviors of E. coli bacteria in moving to a high nutrition zone [14]. Using the advantage that flowing fluid can provide more information, the E. coli method, integrated with anemotaxis and chemotaxis, was developed.
One of classical methods is the ZigZag approach, which involves a moving process to find the edge of the plume based on odor concentration and to move forward guided by wind direction [15]. A plume-centered upwind search strategy was designed using bilateral measurements on a robot, which could modify its direction to move toward the side with the higher concentration. Another well-known bioinspired algorithm is the silkworm moth method, which was inspired by male silkworm moth behaviors in locating female moths by tracking a pheromone plume; the moving process is guided by two actions: surging in an upwind direction, and casting with increasing amplitude until the pheromone fails to be detected. This step-by-step method creates a movement in the direction between the concentration gradient and the upwind direction [2]. Further, the fluxotaxis method was proposed, by estimating the mass flux gradient during the searching process [16]. Another category of source location with mobile sensors is a method based on a model and an information-driven process [17,18,19], where the next movement is predicted with the forward model and the acquired information. The movement of a robot may be predicted with complex algorithms, such as the Bayesian-based search model [20], the hidden Markov model [21], the particle filter model [17], the naïve reasoning machine model [22], and the Entrotaxis-Jump model [23]. In recent years, some researchers developed robots combined with vision and olfactory sensors to search source locations, as well as robot swarms working in coordination to trace a source [24,25].
However, to best of our knowledge, previous studies have not quantitatively compared the performance of different bioinspired search strategies. The rules and features of a tracing path can reflect search performance, but the variations of the features during the searching process have not been mentioned. The tracing strategies based on chemical reactions always depend on predominantly on the concentration, and the location accuracy still needs to be improved. Moreover, a searching method based on information perception and model identification can utilize captured information with complex pattern identification algorithms to obtain control parameters. This method depends less on concentration and locates a source with high accuracy. However, methods such as the Markov chain, the Bayesian model, and the particle filter model are time-consuming and costly, and require much previous information. Additionally, the determination of a source location at the end of a search is an unsolved problem. For most strategies, maximum concentration is viewed as the indicator to determine source position. However, in actual emission scenarios it may not be correct to assume that the location with maximum concentration is the emission source, because the maximum concentration always depends on the search rule. Therefore, different source-determination criteria need to be discussed, based on searching rules and features. Furthermore, the reported work on mobile sensors is limited to small scale searches, e.g., 10 cm to 10 m. The tracing process for longer distances needs to be investigated as well, based on the simulation scenarios.
In the present research, the performances of different common source-tracing algorithms are compared quantitatively, based on simulation scenarios. Then, a new bionic source-tracing algorithm, inspired by the behavior of female mosquitos in seeking hosts, is discussed. Finally, an acceleration strategy for a source-tracing algorithm and a new source-determination method, based on distribution correlation, are investigated. The proposed method can be a practical choice in tracing an emission source in the atmosphere, if a fitted searching strategy is designed.
2. Simulation Model
In this study, the conditions of a classic prairie grass gas emission experiment [26] was selected to simulate gas dispersion. The emission source was assumed to be a continuous point with an emission rate (Q) of 97 g·s−1 and an effective source height (h) of 0.06 m. The average wind speed (u) was 6.7 m·s−1 at 1 m height under unstable atmosphere conditions (“E” Pasquill class). The temperature was assumed to be 25 °C. The emission dispersion was predicted by the Gaussian dispersion model, expressed by Equation (1).
where C(x,y,z) (g·m−3) is the concentration of emission gases at the position of (x,y,z), x is the downwind distance, y is the crosswind distance, and z is the vertical distance above ground. In addition, and are the velocity deviation coefficients in crosswind and vertical directions, respectively [27,28].
The detective limitation of the common gas sensor, e.g., MOS, was 10−6 g·m−3 [29]. Therefore, the zone under the lower limit was assumed as the no response zone. Further, random noises with 10% intensity (i.e., ±5%) were added in the simulation results. The mobile sensor started at the position of 1500 m away from the emission source in the downwind direction. The cross distance of the starting point was set from different positions. One was 100 m, which was inside the valid plume, and another was 500 m, which was outside the plume.
3. Performance of Source-Tracing Algorithms
The source-tracing process of a mobile sensor consisted of four steps: finding the plume, tracing the plume, tracing the termination, and source discrimination. Finding the plume was carried out by the mobile sensor, in or out of the plume. If the sensor was out of the detectable plume at the beginning or during the tracing process, the codes could be executed to drive the mobile to find the plume. Once the valid concentration was detected, the sensor could move toward the emission source, according to the corresponded tracing strategies. Hence, different cases, with the starting point in and out of the plume, were initially simulated.
When the mobile device was near to the source, the termination criteria could be satisfied, and they could guide the sensor in determining the source location. The features of the walking trajectory varied with different tracing routes; thus, the termination criteria could be variances with different tracing strategies. A better termination strategy should be designed, based on the variations in the tracing information near the source. The mobile device may be terminated after detecting abnormal information near the source. The sensor will continue for a short time after crossing the source point. Hence, the final stopping position can be different from the real emission source. The emission source must be determined based on the collected information and the termination criteria.
The real source for our simulation scenarios was assumed at point (0, 0). Two parameters were defined to evaluate the performance of the source-tracing algorithm. One was the location error (Ed), which was the error between the real source and the estimated source. Another was the ratio of the total walking length (Dl) during the tracing process in a straight-line distance (D0) from the starting point to the source. The value of D1/D0 could be used to evaluate the tracing efficiency. Assuming the same movement speed for different scenarios, a lesser value of D1/D0 will result in the higher tracing efficiency.
In this work, different common source-tracing algorithms, including the silkworm, and step-by-step algorithms, were compared quantitatively. Then, a new bionic source-tracing algorithm, inspired by the behavior of female mosquitos in seeking hosts was discussed and compared with other common methods, based on field simulations.
3.1. Field Simulations Using Designated Tracing Strategies
The tracing strategies were designed based on the silkworm, E. coli, and step-by-step algorithms. The termination criterion was based on the abrupt variation of the concentration or the gradient. The source location was determined by the singular or the maximum values of the concentration and its gradient.
3.1.1. Silkworm Algorithm
The silkworm algorithm stimulates the female moth’s searching process for a male moth by tracing the pheromone released by the female moth. The principle of the silkworm algorithm is shown in Figure 1. During the silkworm moth tracing process, surging in an upwind direction and casting in a vertical direction are motivated by the concentration and by wind direction detection until the concentration cannot be acquired in continuous steps (Ns) at the end of searching. In this study, two scenarios, i.e., initialized from inside the plume and outside the plume, were investigated. Additionally, the movement step was set randomly, from 5 to 8 m.
Scenario I: Mobile Sensor Initiating from Inside the Plume
In this case, the mobile sensor started tracing at the point (1500, 100), initiating from the detectable inside of the plume. The searching trajectory is shown in Figure 2a. It should be noted that the mobile sensor moved upwind directly when the concentration was detected at the beginning. Then, when it reached the edge of the plume, the mobile sensor started to swing in a vertical direction until the valid concentration could be captured again. In this algorithm, the concentration provided the excitation signal to move, and only the wind direction guided the sensor moving forward; thus, it is an anemotaxis algorithm. In this case, the mobile sensor finished the tracing process at the point (5.86, 8.86), and the total walking length was 1.47 × 10⁴ m. The variations in the concentration, the maximum concentration, and the gradient are shown in Figure 2b, which indicates that the point with the maximum concentration appears at the beginning; therefore, the maximum concentration cannot be used to determine the source location in this case. The concentration gradient reached the maximum value at the end, and it later decreased to zero, which can be the indicator to locate the source position according to the maximum-concentration gradient criterion. Moreover, the first zero concentration of the final continuous zero-concentration steps appeared at the end, which can also be considered as the source location according to the zero-concentration criterion. The source was located at the points (9.37, 1.84) and (3.54, 7.65), respectively, based on the above two source-determination criteria, as indicated by the circle and the star, respectively, in Figure 2a.
Scenario II: Mobile Sensor Initiating from the Plume Outside
In this case, the mobile sensor started at point (1500, −500), initiating from the outside of the detectable plume. The mobile sensor stopped at point (5.0, −2.9) and the total walking length of the whole searching process was 7.91 × 10⁴ m. Compared with the results in Figure 2, the mobile sensor needed to find the plume at the beginning by swinging in the crosswind direction, and then moving along the edge of the plume with a casting and surging movement. As shown in Figure 3, the maximum concentration and the gradient were both at the end of the searching trajectory, and they were at the same point (8.9, −1.7). The location of the source estimated by the zero-concentration criterion was (2.07, −7.02).
3.1.2. E. coli Algorithm
The E. coli algorithm stimulates the behavior of E. coli bacteria, causing the bacteria to move toward the nutrition zone in a viscosity-dominated environment. The process based on the E. coli algorithm is shown in Figure 4.
Scenario I: Mobile Sensor Initiating from Inside the Plume
The trajectory of the mobile sensor in this case is shown in Figure 5a. The wind direction is not required in the E. coli algorithm, and the concentration gradient between two adjacent steps navigates the mobile sensor to move forward. The mobile sensor walked toward the source near the midline of the plume. The total walk length was 9.58 × 10³ m. As demonstrated in Figure 5b, the maximum gradient did not occur at the end and the mobile sensor stopped at point (41.05, −11.93) with the first zero gradient. The maximum value of the concentration was observed at the end of the tracing. It sat at point (30.67, −0.24) with the maximum concentration.
Scenario II: Mobile Sensor Initiating from Outside the Plume
The mobile sensor also moved forward to the midline of the plume when it started at the point outside the plume, as shown in Figure 6a. When it came close to the plume midline, the mobile sensor walked toward the source. The total walk length of the mobile sensor was 9.66 × 10³ m. It can be seen from Figure 6b that the concentration and the gradient have maximum values near the final position. The estimated source location based on the zero gradient was (37.17, −12.68), while it was (36.23, −1.16) according to the maximum-concentration criterion.
3.1.3. Step-by-Step Algorithm
The step-by-step algorithm combines the concentration gradient and the upwind direction; the search direction in the next step is set between the gradient and the upwind direction, as shown in Figure 7.
Scenario I: Mobile Sensor Initiating from Inside the Plume
Figure 8a shows that the mobile sensor found the edge of the plume, guided by the upwind direction and the concentration gradient, and then traced the leak source along the edge of the plume, as it did with the silkworm algorithm. However, the mobile sensor in the step-by-step algorithm did not need to swing in the crosswind direction by using the information from the upwind direction. The mobile sensor adjusted the search direction continuously and then stopped when the concentration decreased to zero, after striding over the zone near the source. The total length of movement was 3.27 × 10³ m in the test case. As shown in Figure 8b, the concentration and the gradient reached peak values near the end and then those values fell sharply; that information could be used to determine the source location. The estimated source position was at point (12.06, −9.71) based on zero concentration, while it was (40.84, 3.68) with the maximum-concentration criterion.
Scenario II: Mobile Sensor Initiating from Outside the Plume
The detailed tracing process is shown in Figure 9a, indicating that the mobile sensor could still find the plume boundary even when beginning at the outside of the plume. When it entered the plume, the mobile sensor adjusted the moving direction based on the concentration gradient and the upwind direction, and then it reached the edge of the plume. Finally, the mobile sensor walked forward to the source position and stopped near the source. The total walking length in this case was 6.24 × 10³ m. As shown in Figure 9b, the concentration reached its maximum at the end of the searching, while the gradient attained its maximum at beginning. Therefore, the maximum concentration could be used in this scenario to decide the source location. When the mobile sensor could not capture any source concentration continuously, the tracing was terminated. The source position was at (20.36, −23.05) based on the zero-concentration criterion and it was (19.85, 11.79) according to the maximum-concentration criterion.
3.2. Performance Comparisons of the Designated Algorithms
The location error and D1/D0 were calculated to compare the performances of the different algorithms. The walking length D1 is the mobile sensor’s total walking length from the starting point to the end of the search. The source location accuracy is the position deviation of the evaluated location from the real source (0, 0) in the simulation scenarios, which can be evaluated with location error. The situations with different starting points were discussed, and the results are listed in Table 1.
Because the real value of the emission source is (0, 0), the location error was calculated with the position of the estimated source location using source-determination criteria. The estimated source location error using the silkworm algorithm was the minimum among the three algorithms tested in this work. However, the silkworm algorithm had the lowest tracing efficiency, and the tracing length was higher than that of the other two algorithms. The searching strategies of the studied algorithms had a significant impact on performance. The silkworm algorithm depended on the wind direction to navigate the sensor, and the mobile sensor with the silkworm algorithm did not move forward and swing only in the crosswind direction when there was no valid concentration response; the silkworm algorithm was also time-consuming. The E. coli algorithm mainly relies on the concentration gradient, and its efficiency was much higher than that of the silkworm algorithm. However, only the gradient between two adjacent points was utilized; thus, the efficiency of the E. coli algorithm’s performance was not sufficiently determined. The step-by-step algorithm employed the wind direction and the concentration gradient to navigate the movement, leading to the result that the tracing efficiency of the step-by-step algorithm was higher than that of the silkworm algorithm or the E. coli algorithm. In addition, it was found that the step-by-step algorithm performed better than the E. coli algorithm in terms of locating accuracy.
Table 1 shows that the source location varies with different determination conditions. The estimated source location determined by the maximum concentration was different from the location based on the minimum estimation deviation. In some cases, the maximum concentration appeared at the beginning of the tracing process (see Figure 3). The accuracy with the criterion of zero concentration or the zero gradient was better than that of the maximum-concentration criterion. However, zero concentration and the zero gradient were not the sole criteria during the tracing process, and the maximum concentration may not have occurred at the end of the searching. Therefore, it is necessary to consider the other effective criterion to judge the termination and to determine the source location.
4. Improvement of Bioinspired Algorithms
4.1. Tracking Strategy Inspired by the Behavior of Female Mosquitoes
Dekker et al. [30] and Breugel et al. [31] investigated the tracking behavior of female mosquitos in seeking hosts via experiments tracing the CO2 plume. The results indicated that only the female mosquito had a response to the CO2 plume, and it fled from the plume with its special tracking behavior. The female mosquito showed a pattern of track reversal behavior in vertical and crosswind planes during the flying process to seek the host, and it could effectively transect the area where the plume was previously perceived. Inspired by the patterns of track reversals and the memory effect of the female mosquito during CO2 plume tracing, a new tracking strategy based on reverse movement and interfacial gradient (RMIG) was proposed in this research to navigate the movement of the mobile sensor, as shown in Figure 10.
In the RMIG strategy, as shown in Figure 10, the maximum gradient between two moving faces guides the movement. The mobile sensor will move on the first moving face with a form of zigzag (1-1→1-2→1-3→1-4), with a tendency that is the reverse of that of the upwind direction. Then, the gradient between every two steps in the first moving face is calculated and the gradient with the maximum value is set as the direction for the next step. The mobile sensor repeats this strategy until arriving near to the source. Compared with the E. coli algorithm, the RMIG strategy provides more useful gradient direction information and utilizes the gradient between two faces, rather than two points. This method widens the searching area and potentially obtains the maximum gradient in the area effectively. Moreover, the reverse movement increases the walking length, but obtains more useful information for tracing. Based on the idea of the RMIG strategy, the performance of the mobile sensor in tracking the leakage source in simulation scenarios was investigated.
4.2. Source Tracing with the RMIG Algorithm
4.2.1. Scenario I: The Mobile Sensor Initializing from Inside the Plume
In this case, the mobile sensor started tracing at point (1500, 100), which was inside the detectable plume. The trajectory of the mobile sensor driven by the RMIG algorithm is shown in Figure 11a. The total walking length was 4477 m. The sensor moved from the starting point toward the midline of the plume and then continued to walk forward.
The maximum concentration and the gradient both varied at the end of the tracking process, as shown with Figure 11b. The concentration gradient retained the peak value during the tracing and later became zero, which could be the indicator to locate the source position (the maximum-concentration/gradient criterion). Moreover, the first zero concentration of the final continuous zero-concentration steps at the end could also be assumed to be the source location (the zero-concentration criterion). The source location was estimated to be at (14.54, −10.47) according to the zero-concentration criterion, while it was at (26.97, −10.68) based on the maximum-concentration criterion.
4.2.2. Scenario II: Mobile Sensor Initializing from Outside the Plume
In this case, the mobile sensor started at point (1500, −500), which is outside the detectable plume. The tracing process of the mobile sensor starting from the point outside the plume is shown in Figure 12a. The whole length was 3239 m. Therefore, the search efficiency of mobile sensor was improved when the RMIG algorithm was adopted. As indicated in Figure 12b, the maximum concentration and gradient were observed at the end of searching. The source position was estimated to be at (4.01, 12.51) based on the zero-concentration criterion, while it was at (25.26, −0.66) based on the maximum-concentration criterion.
The source-tracing results with different algorithms are summarized in Figure 13. It can be concluded that both the source location accuracy and the tracing efficiency were improved with the RMIG algorithm, compared to the E. coli algorithm. The tracing efficiency of the RMIG algorithm was much higher than that of the silkworm algorithm. However, the efficiency of the RMIG algorithm was just slightly higher than that of the step-by-step algorithm. Hence, the tracing efficiency requires further enhancement.
Table 1 shows that the source location is estimated at different positions under different determination conditions. The estimated source location determined by maximum concentration is different from the minimum estimation deviation. In some cases, the maximum concentration even occurs at the beginning of the tracing process, as shown in Figure 5. The source-locating accuracy with the criterion of zero concentration or zero gradient seems slightly better than that with the maximum-concentration criterion. However, zero-concentration or the zero gradient were not the sole criteria during the tracing process, and the maximum concentration may not have occurred at the end of the searching. Therefore, it was necessary to seek other effective criteria to judge the termination and to determine the source location.
4.3. Acceleration Strategy for Source Tracing with RMIG
From the trajectories of the mobile sensor with the RMIG algorithm, it can be found that the sensor will move forward to the source along the midline of the plume after finding the plume. Hence, it was not necessary to calculate the gradient between every two steps in this stage and the sensor could be accelerated while tracing the midline. The variations of the trajectory curvature and the displacement of the sensor in the crosswind direction could be used to check the time taken to move in a straight line. Hence, the acceleration movement, which is the accelerated search path for the mobile sensor in some conditions, can be designed to accelerate the searching process.
The simulation results of the source-tracing process driven by the RMIG algorithm with the acceleration strategy at different starting points are shown in Figure 14, and the results for source location are listed in Table 2. The performance of the RMIG algorithm with and without the acceleration strategy is shown in Figure 15.
It is noted that the efficiency of source tracing was improved with adaptive acceleration strategy. In the simulations, the searching efficiency was increased by 100% when the sensor started inside the plume, while it increased by 40% when the sensor started outside the plume at the beginning. Compared with the results in other algorithms (see Table 1), the efficiency was also enhanced with the acceleration strategy in all tested cases. However, the accuracy of source location was not improved by the acceleration strategy, and the source-determination method should be improved.
4.4. Improvement in Source Determination
Although source location can be estimated with the zero-concentration and maximum-concentration criteria, the features of concentration, the concentration gradient, and the maximum concentration varied with the tracing strategies in the test cases, and a single criterion may be invalid in some cases. The source locations obtained with different criteria were still far from the real source. Therefore, the tracking process was terminated too early or too late, based on the zero-concentration criterion or the maximum-concentration criterion. It is necessary to study a more precise determination method. The source-location method with information perception, proposed by other researchers, utilized the information perceived from the last step combined with the inverse algorithm to plan a route for the next movement [18,19]. The searching efficiency was too low with the information perception method. Therefore, the methods to identify the source location with the optimization method, and monitoring data with high efficiency and accuracy, were employed in this study [5,8,9]. A method based on the optimal correlated matching of concentration distribution (OCMCD) was proposed to locate the emission source with high accuracy [32]. In the OCMCD method, only the information relating to the concentration is required, with rare dependence on data accuracy; an absolute concentration value is not required. The basic principle of OCMCD is shown in Equation (2):
where Cmea are the monitoring data, Cpre are the results from the prediction model, and Fcor is the function for calculating the correlation coefficient between concentration distribution from the sensors and the prediction model. ε0 is a small positive value to avoid the zero denominator. The cost function includes two terms, i.e., the distribution correlation error and the concentration error. Two weighted parameters, w1 and w2, are assigned to the two terms, respectively. The sum of w1 and w2 is 1, and w1 is much larger than w2 to ensure that the distribution correlation error dominates the estimation results. Fnorm is one order norm function, which normalizes the measured concentration and the predicted concentration to the same range. 1/n is the order of the error term. It can be seen that the cost function becomes less with a greater correlation between the predicted and the measured information distribution.
In this case, the concentration related information was acquired by a bioinspired mobile sensor with the RMIG strategy. After it was terminated, OCMCD was used to determine the source position with a genetic algorithm (GA). The results for the mobile sensor with the RMIG-OCMCD algorithm at different starting points under simulation scenarios are summarized in Table 3.
Table 3 shows that the source location determined by the RMIG-OCMCD algorithm is close the real source at different starting positions, and the accuracy of location estimation is much higher than it is with the criteria of zero concentration or maximum concentration. The source location with RMIG-OCMCD was estimated with an inverse algorithm, and all concentrations were captured during the tracing process, including the values near the source, with common determination criteria. Therefore, the OCMCD method can be used to determine the source location using a mobile sensor with higher accuracy than that of common determination criteria.
5. Conclusions
This work compared different biomimetic algorithms in simulated scenarios using mobile sensors to track the emission sources in the atmosphere, and proposed improved tracking planning, accelerated movement, and source-determination strategies. Specifically, the main conclusions are as follows:
- (1)
- For different algorithms, the efficiency and accuracy of source tracking are various. The step-by-step algorithm has the highest search efficiency, while the silkworm algorithm has the highest positioning accuracy. However, during the entire search, the mobile sensor traveled with the furthest distance. The E. coli algorithm mainly depends on the concentration gradient between every two steps.
- (2)
- The concentration and gradient characteristics in the source tracking process vary with biomimetic algorithms. The maximum concentration does not always occur at the end of the tracing process, and a change in zero concentration can also be used to terminate the search. However, neither is unique in the tracking process; therefore, source determination should be further improved.
- (3)
- According to the behavior of female mosquitoes in finding hosts by tracking CO2 plumes, a new tracking strategy is proposed. With this algorithm, the mobile sensor is driven by inverse motion and the interface gradient (RMIG). The simulation results show that, compared with the E. coli algorithm that is driven by the linear gradient between two steps, the tracking efficiency and localization accuracy of the RMIG algorithm are greatly improved.
- (4)
- In the simulation scenarios, the acceleration strategy of the RMIG algorithm can improve the search efficiency of a mobile sensor by 40–100%.
- (5)
- The source location determined by the RMIG-OCMCD method is close to the real source, and the location estimation accuracy is much higher than that of the zero-concentration and maximum-concentration standards.
In conclusion, the use of mobile sensors to locate emission sources has the potential to be a good option for tracking emission sources in the atmosphere. Algorithms based on biological behavior can provide a useful strategy for finding a source, and can be applied to trace the emission source of an atmospheric contaminant emission source as well as a leakage source for hazardous chemical gases or VOCs. Hence, implementing these algorithms into practical operation and tracing emission sources in turbulent environments require further consideration in our future work.
Author Contributions
Conceptualization, D.M.; Investigation, G.X.; Methodology, D.M.; Supervision, J.G.; Writing—original draft, D.M.; Writing—review & editing, G.X., W.M., J.G., H.Y. and D.L. All authors have read and agreed to the published version of the manuscript.
Funding
This work was supported by the National Natural Science Foundation of China (21808181), Key Projects in Shaanxi Province (2017ZDXM-GY-115), the China Postdoctoral Science Foundation (2019M653651), the Basic Research Project of Natural Science in Shaanxi Province (2020JM-021), and the Postdoctoral Science Foundation of Shaanxi Province (2017BSHYDZZ09).
Institutional Review Board Statement
Not applicable.
Informed Consent Statement
Not applicable.
Data Availability Statement
Not applicable.
Conflicts of Interest
The authors declare no conflict of interest.
References
- Ma, D.L.; Gao, J.M.; Zhang, Z.X.; Zhao, H.; Wang, Q.S. Locating the gas leakage source in the atmosphere using the dispersion wave method. J. Loss Prev. Process Ind. 2020, 63, 104031. [Google Scholar] [CrossRef]
- Kowadlo, G.; Russell, R.A. Robot odor localization: A taxonomy and survey. Int. J. Robot. Res. 2008, 27, 869–894. [Google Scholar] [CrossRef]
- Hutchinson, M.; Oh, H.; Chen, W.H. A review of source term estimation methods for atmospheric dispersion events using static or mobile sensors. Inf. Fusion 2017, 36, 130–148. [Google Scholar] [CrossRef] [Green Version]
- Haupt, S.E. A demonstration of coupled receptor/dispersion modeling with a genetic algorithm. Atmos. Environ. 2005, 39, 7181–7189. [Google Scholar] [CrossRef]
- Ma, D.L.; Deng, J.Q.; Zhang, Z.X. Comparison and improvements of optimization methods for gas emission source identification. Atmos. Environ. 2013, 81, 188–198. [Google Scholar] [CrossRef]
- Hazart, A.; Giovannelli, J.F.; Dubost, S.; Chatellier, L. Inverse transport problem of estimating point-like source usinga Bayesian parametric method with MCMC. Signal Process. 2014, 96 Pt B, 346–361. [Google Scholar] [CrossRef]
- Kopka, P.; Wawrzynczak, A.; Borysiewicz, M. Application of the approximate bayesian computation methods in the stochastic estimation of atmospheric contamination parameters for mobile sources. Atmos. Environ. 2016, 145, 201–212. [Google Scholar] [CrossRef]
- Ma, D.L.; Wang, S.M.; Zhang, Z.X. Hybrid algorithm of minimum relative entropy-particle swarm optimization with regularization parameters for gas source term identification. Atmos. Environ. 2014, 94, 637–640. [Google Scholar] [CrossRef]
- Ma, D.L.; Tan, W.; Zhang, Z.X.; Hu, J. Parameter identification for continuous point emission source based on Tikhonov regularization method coupled with particle swarm optimization algorithm. J. Hazard. Mater. 2017, 325, 239–250. [Google Scholar] [CrossRef]
- Ma, D.L.; Tan, W.; Zhang, Z.X.; Hu, J. Gas emission source term estimation with 1-step nonlinear partial swarm optimization–Tikhonov regularization hybrid method. Chin. J. Chem. Eng. 2018, 6, 356–363. [Google Scholar] [CrossRef]
- Flesch, T.K.; Wilson, J.D.; Harper, L.A. Deducing ground-to-air emissions from observed trace gas concentrations: A field trial with wind disturbance. J. Appl. Meteorol. Climatol. 2005, 44, 475–484. [Google Scholar] [CrossRef]
- Lilienthal, A.; Reimann, D.; Zell, A. Gas source tracing with a mobile robot using an adapted moth strategy. In Autonome Mobile Systeme; Dillmann, R., Wörn, H., Gockel, T., Eds.; Informatik Aktuell; Springer: Berlin/Heidelberg, Germany, 2003; pp. 150–160. [Google Scholar]
- Russell, R.A. Tracking chemical plumes in 3-dimensions. In Proceedings of the IEEE International Conference on Robotics and Biomimetics, Kunming, China, 17–20 December 2006. [Google Scholar]
- Russell, R.A. Locating underground chemical sources by tracking chemical gradients in 3 dimensions. In Proceedings of the IEEE/RSJ International Conference on Intelligent Robots and Systems, Sendai, Japan, 28 September–2 October 2004. [Google Scholar]
- Ishida, H.; Kagawa, Y.; Nakamoto, T.; Moriizumi, T. Odor-source localization in the clean room by an autonomous mobile sensing system. Sens. Actuator B Chem. 1996, 33, 115–121. [Google Scholar] [CrossRef]
- Zarzhitsky, D.; Spears, D.F.; Spears, W.M.; Thayer, D.R. A fluid dynamics approach to multi-robot chemical plume tracing. In Proceedings of the Third International Joint Conference on Autonomous Agents and Multiagent Systems, New York, NY, USA, 23–23 July 2004. [Google Scholar]
- Li, J.G.; Meng, Q.H.; Wang, Y. Odor source localization using a mobile robot in outdoor airflow environments with a particle filter algorithm. Auton. Robot. 2011, 30, 281–292. [Google Scholar] [CrossRef]
- Ristic, B.; Skvortsov, A.; Gunatilaka, A. A study of cognitive strategies for an autonomous search. Inf. Fusion 2016, 28, 1–9. [Google Scholar] [CrossRef]
- Hutchinson, M.; Oh, H.; Chen, W.H. Entrotaxis as a strategy for autonomous search and source reconstruction in turbulent conditions. Inf. Fusion 2018, 42, 179–189. [Google Scholar] [CrossRef] [Green Version]
- Farrell, J.A.; Pang, S.; Li, W.; Arrieta, R. Chemical plume tracing experimental results with a REMUS AUV. In Proceedings of the IEEE OCEANS 2003, San Diego, CA, USA, 22–26 September 2003. [Google Scholar]
- Pang, S.; Farrell, J.A. Chemical plume source localization. IEEE Trans. Syst. Man Cybern. Part B 2006, 36, 1068–1080. [Google Scholar] [CrossRef]
- Kowadlo, G.; Russell, R.A. Improving the robustness of Naive Physics airflow mapping, using Bayesian reasoning on a multiple hypothesis tree. In Proceedings of the 2006 IEEE International Conference on Robotics and Biomimetics, Kunming, China, 17–20 December 2006. [Google Scholar]
- Zhao, Y.; Chen, B.; Zhu, Z.Q.; Chen, F.R.; Wang, Y.D.; Ma, D.L. Entrotaxis-Jump as a hybrid search algorithm for seeking an unknown emission source in a large-scale area with road network constraint. Expert Syst. Appl. 2020, 157, 113484. [Google Scholar] [CrossRef]
- Cui, X.H.; Tim, H.; Ragade, R.K.; Elmaghraby, A.S. A Swarm Approach for Emission Sources Localization. In Proceedings of the 16th IEEE International Conference on Tools with Artificial Intelligence (ICTAI 2004), Boca Raton, FL, USA, 15–17 November 2004. [Google Scholar]
- Yeon, A.S.A.; Visvanathan, R.; Mamduh, S.M.; Kamarudin, K.; Kamarudin, L.M.; Zakaria, A. Implementation of Behaviour Based Robot with Sense of Smell and Sight. Procedia Comput. Sci. 2015, 76, 119–125. [Google Scholar] [CrossRef] [Green Version]
- Barad, M.L. Project Prairie Grass: A Field Program in Diffusion. Geophysical Research Paper; Tech. Rep. AFCRC-TR-58-235(I); Air Force Cambridge Res. Center, Wright-Patterson Air Force Base: Hanscom, MA, USA, 1958. [Google Scholar]
- Hanna, S.R.; Briggs, G.A.; Hosker, R.P. Handbook on Atmospheric Diffusion; U.S. Department of Energy, Technical Information Center: Oak Ridge, TN, USA, 1982. [Google Scholar]
- Pasquill, F.; Smith, F.B. Atmospheric Diffusion, 3rd ed.; Ellis Horwood Limited: Chichester, UK, 1983. [Google Scholar]
- Ma, D.; Gao, J.; Zhang, Z.; Zhao, H. Gas recognition method based on the deep learning model of sensor array response map. Sens. Actuators B. Chem. 2021, 330, 129349. [Google Scholar] [CrossRef]
- Dekker, T.; Cardé, R.T. Moment-to-moment flight manoeuvres of the female yellow fever mosquito (Aedesaegypti L.) in response to plumes of carbon dioxide and human skin odour. J. Exp. Med. 2011, 214, 3480–3494. [Google Scholar]
- Breugel, F.; Riffell, J.; Fairhall, A.; Dickinson, M.H. Mosquitoes use vision to associate odor plumes with thermal targets. Curr. Biol. 2015, 25, 2123–2129. [Google Scholar] [PubMed] [Green Version]
- Ma, D.L.; Tan, W.; Wang, Q.S.; Zhang, Z.X.; Gao, J.M.; Zeng, Q.F.; Wang, X.Q.; Xia, F.S.; Shi, X.G. Application and improvement of swarm intelligence optimization algorithm in gas emission source identification in atmosphere. J. Loss Prev. Process Ind. 2018, 56, 262–271. [Google Scholar] [CrossRef]
Figure 1.
The flow chart of classic bioinspired tracing algorithms.
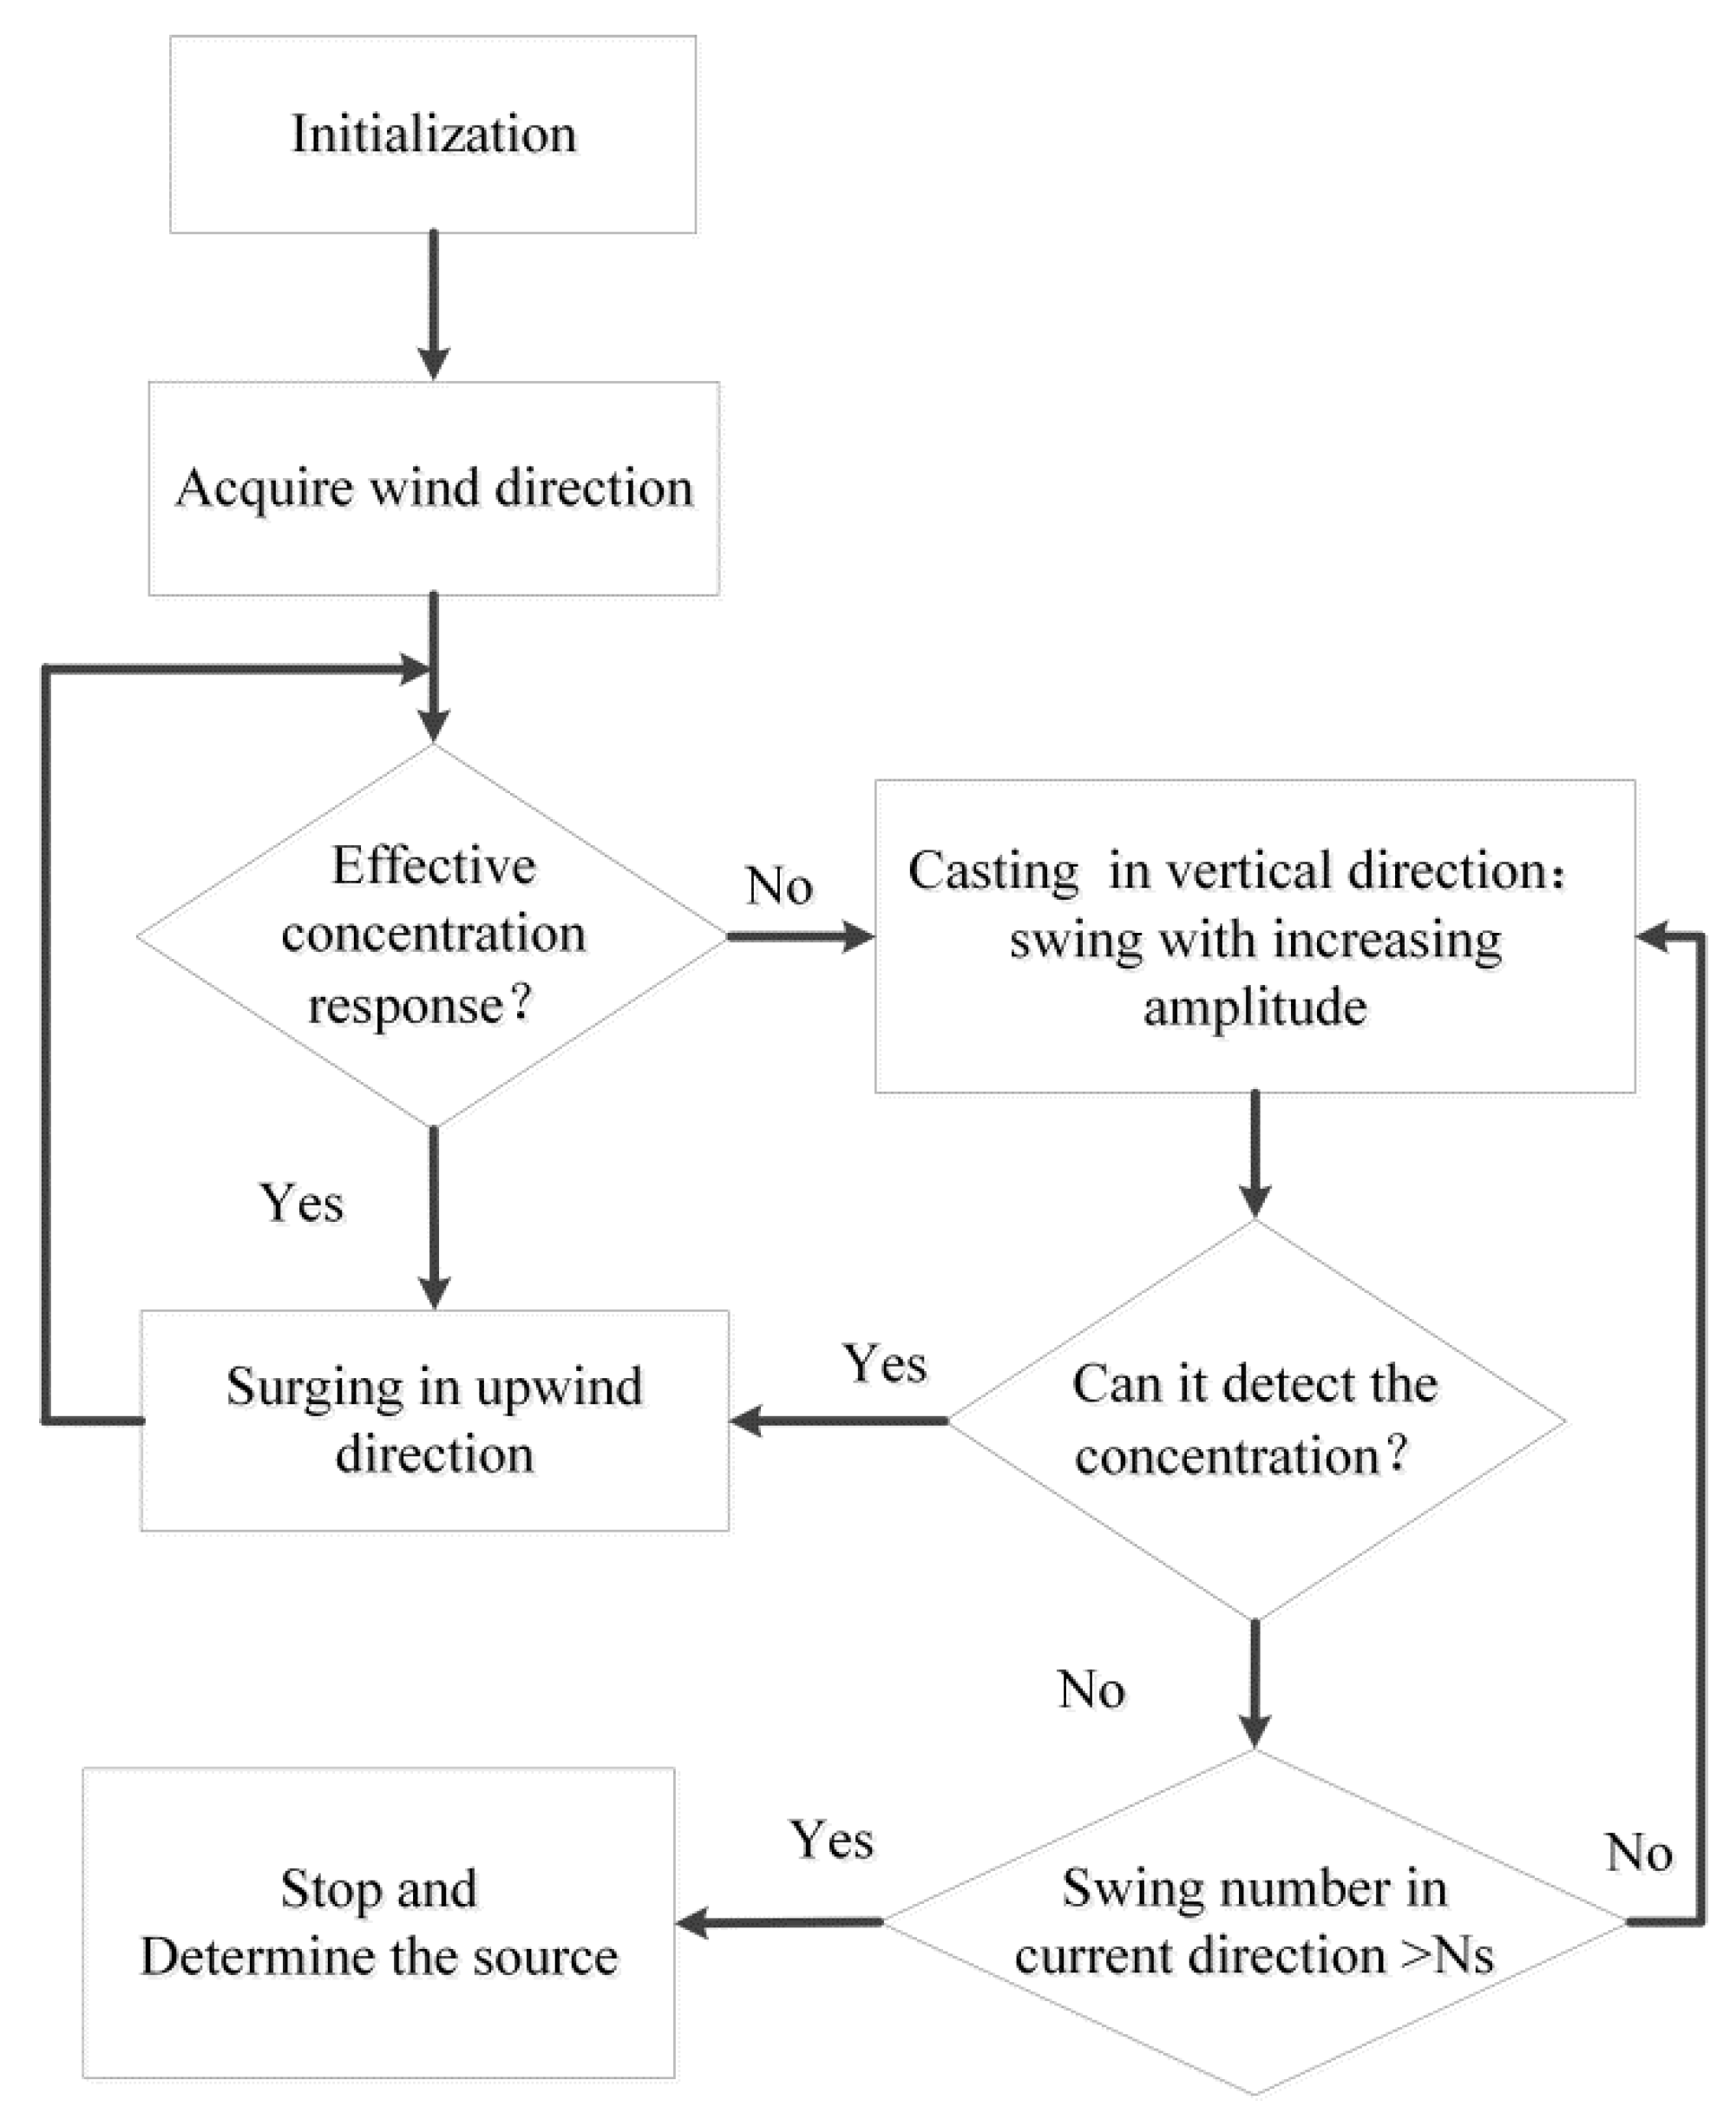
Figure 2.
The trajectory of the silkworm algorithm starting from the point in the plume (a) and the variations in concentration, maximum concentration, and gradient (b).
Figure 2.
The trajectory of the silkworm algorithm starting from the point in the plume (a) and the variations in concentration, maximum concentration, and gradient (b).
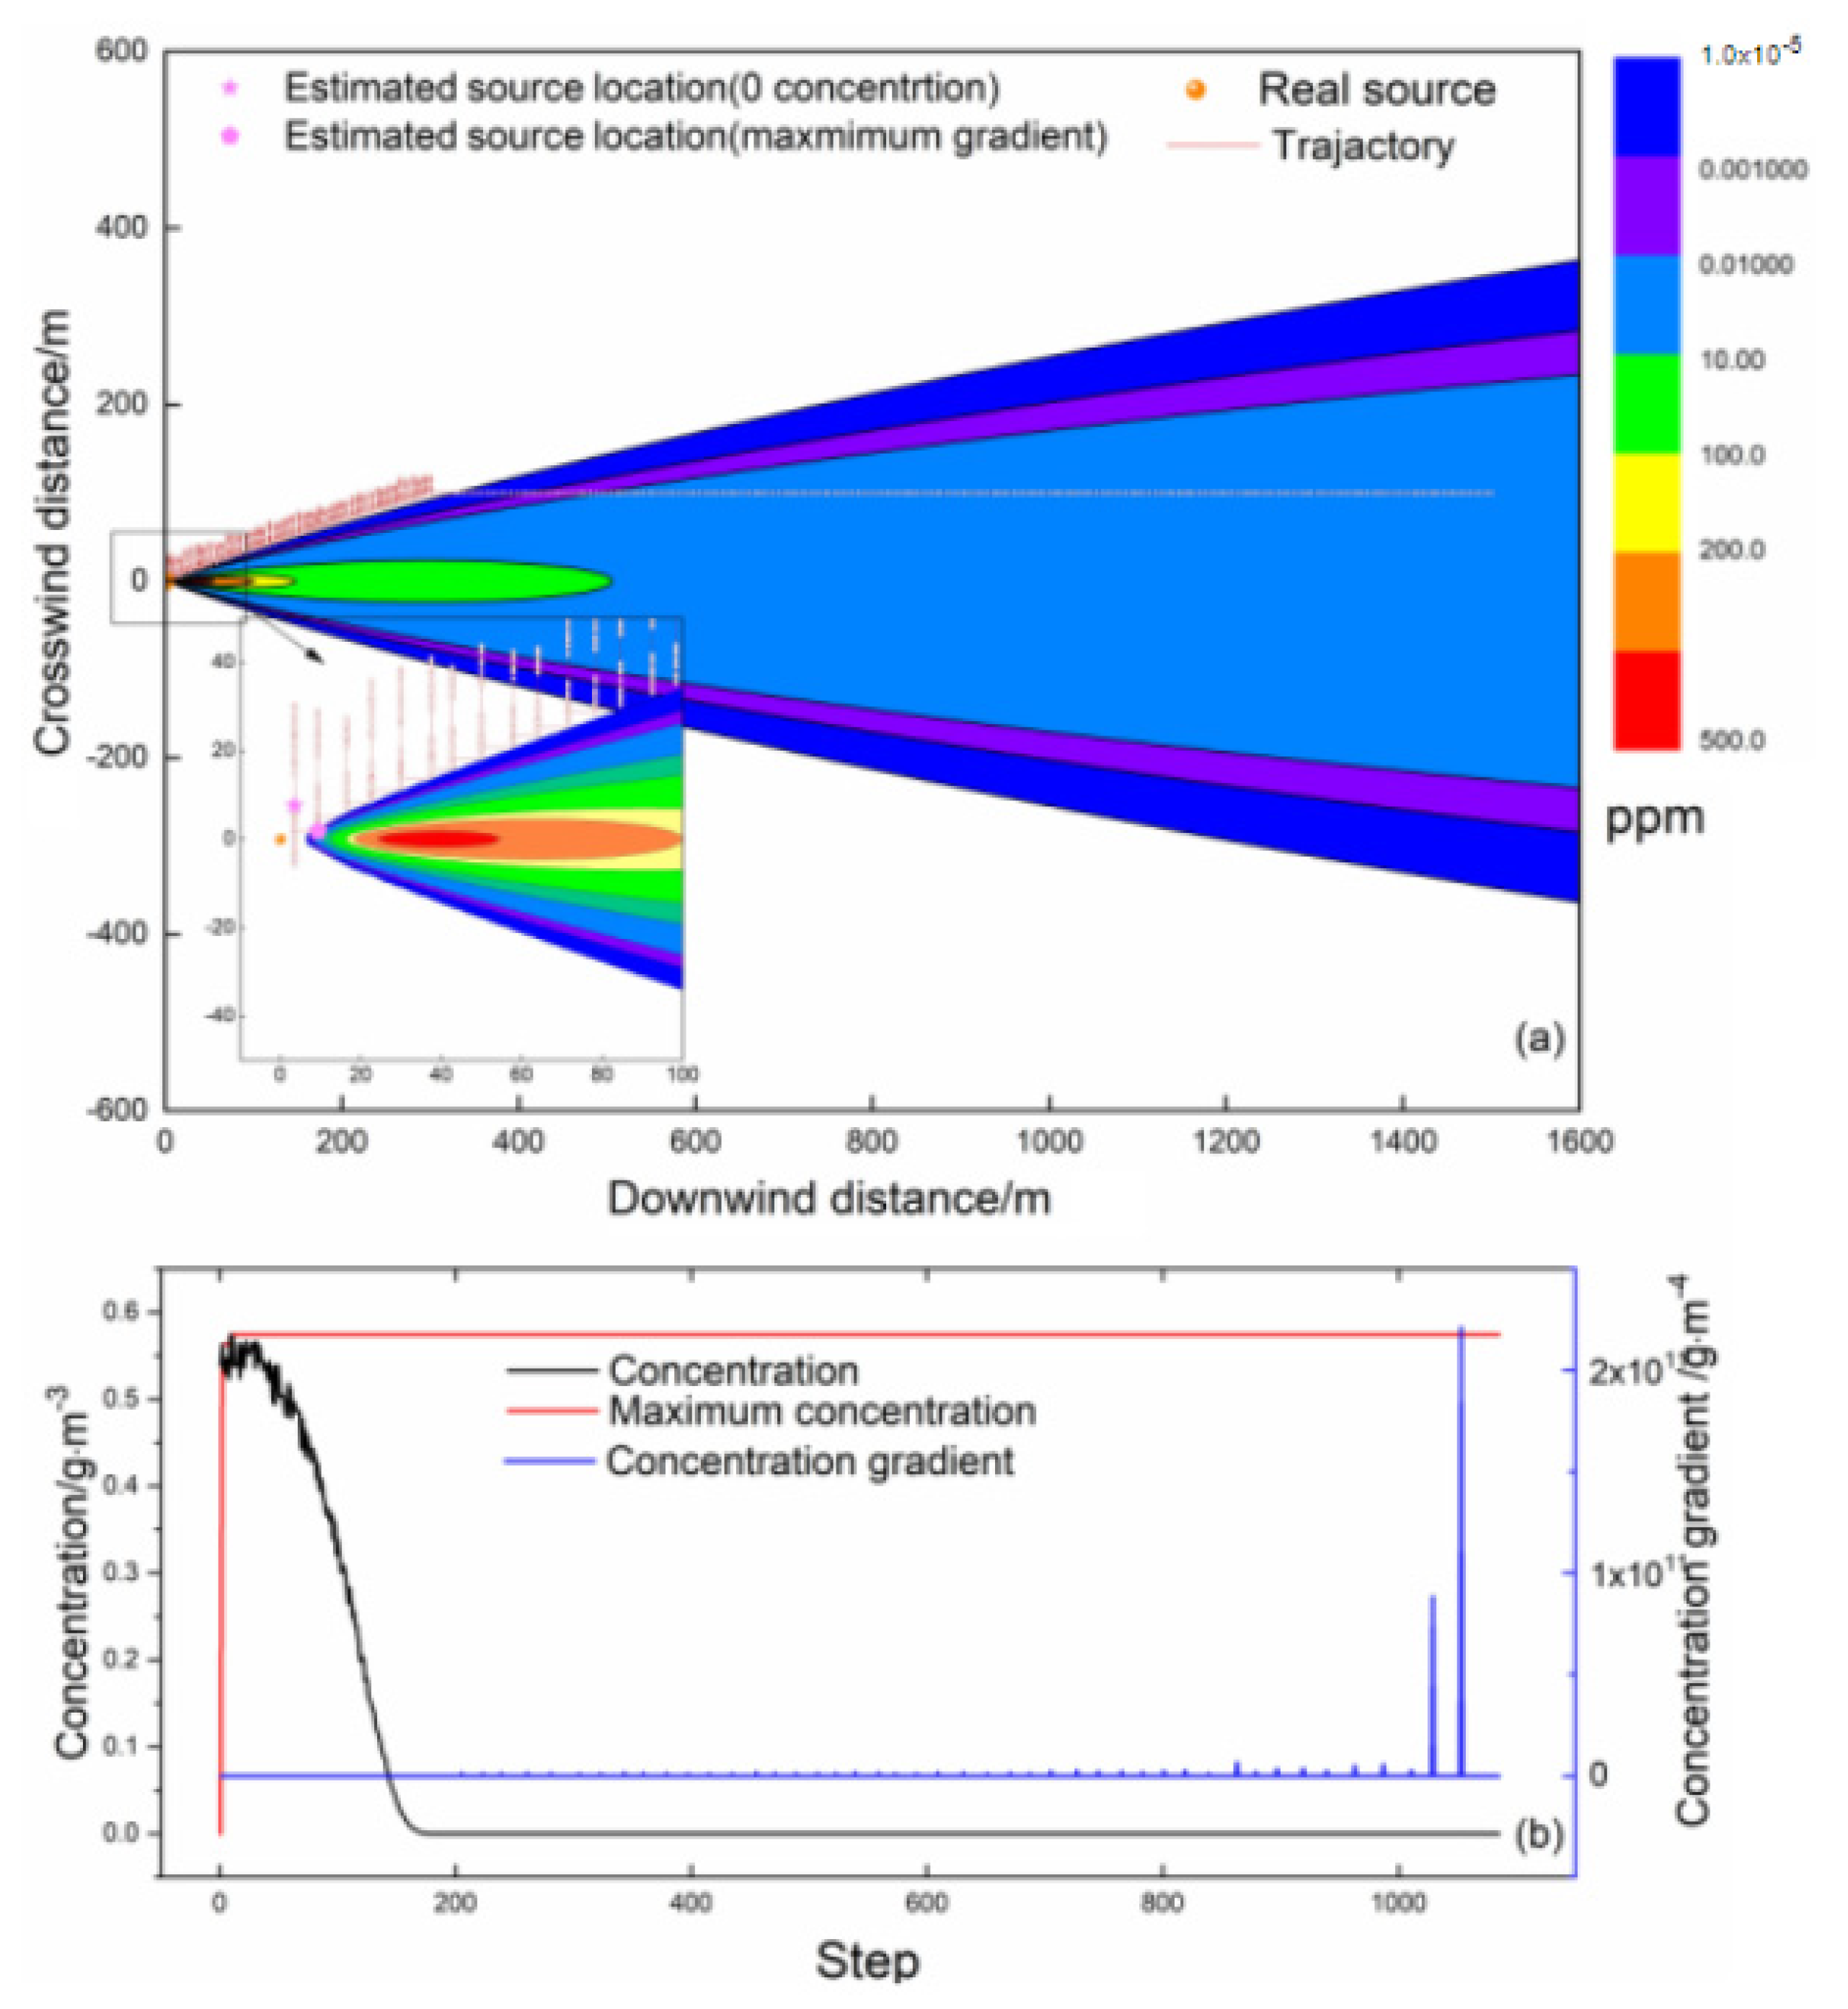
Figure 3.
The trajectory of the silkworm algorithm starting from the point out of the plume (a) and the variations in concentration, maximum concentration, and gradient (b).
Figure 3.
The trajectory of the silkworm algorithm starting from the point out of the plume (a) and the variations in concentration, maximum concentration, and gradient (b).
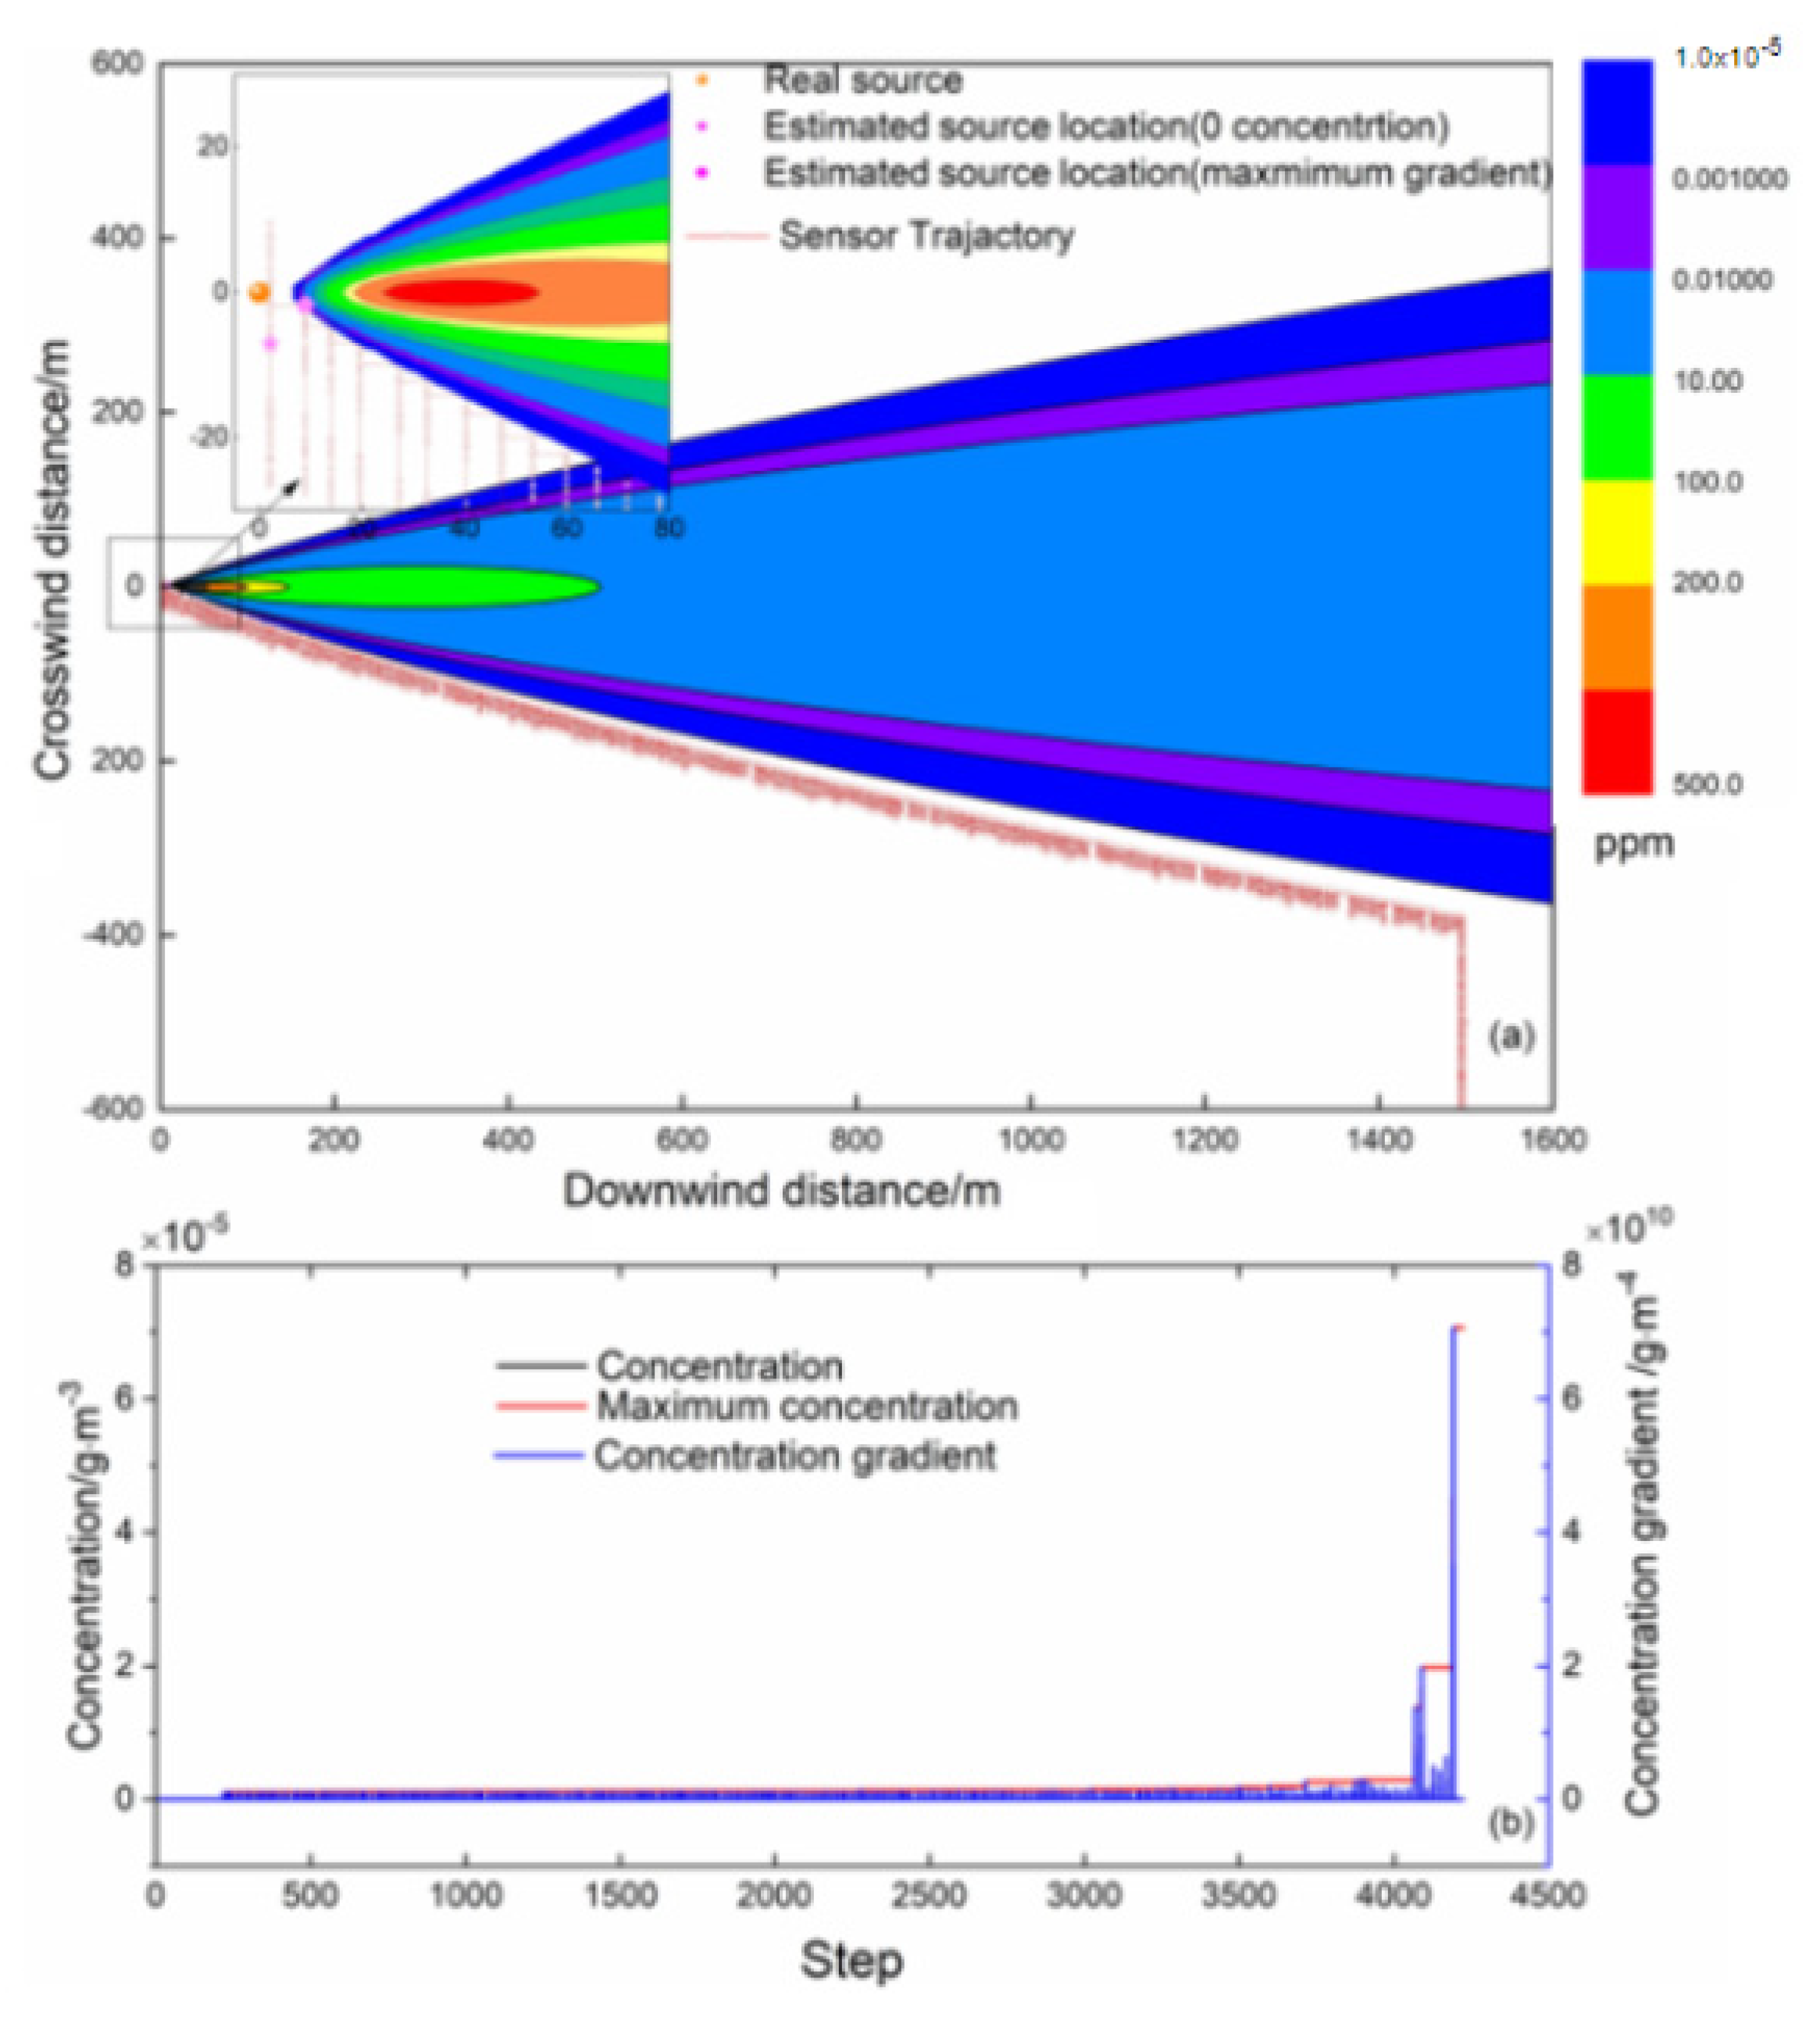
Figure 4.
The flow chart of the E. coli algorithm.
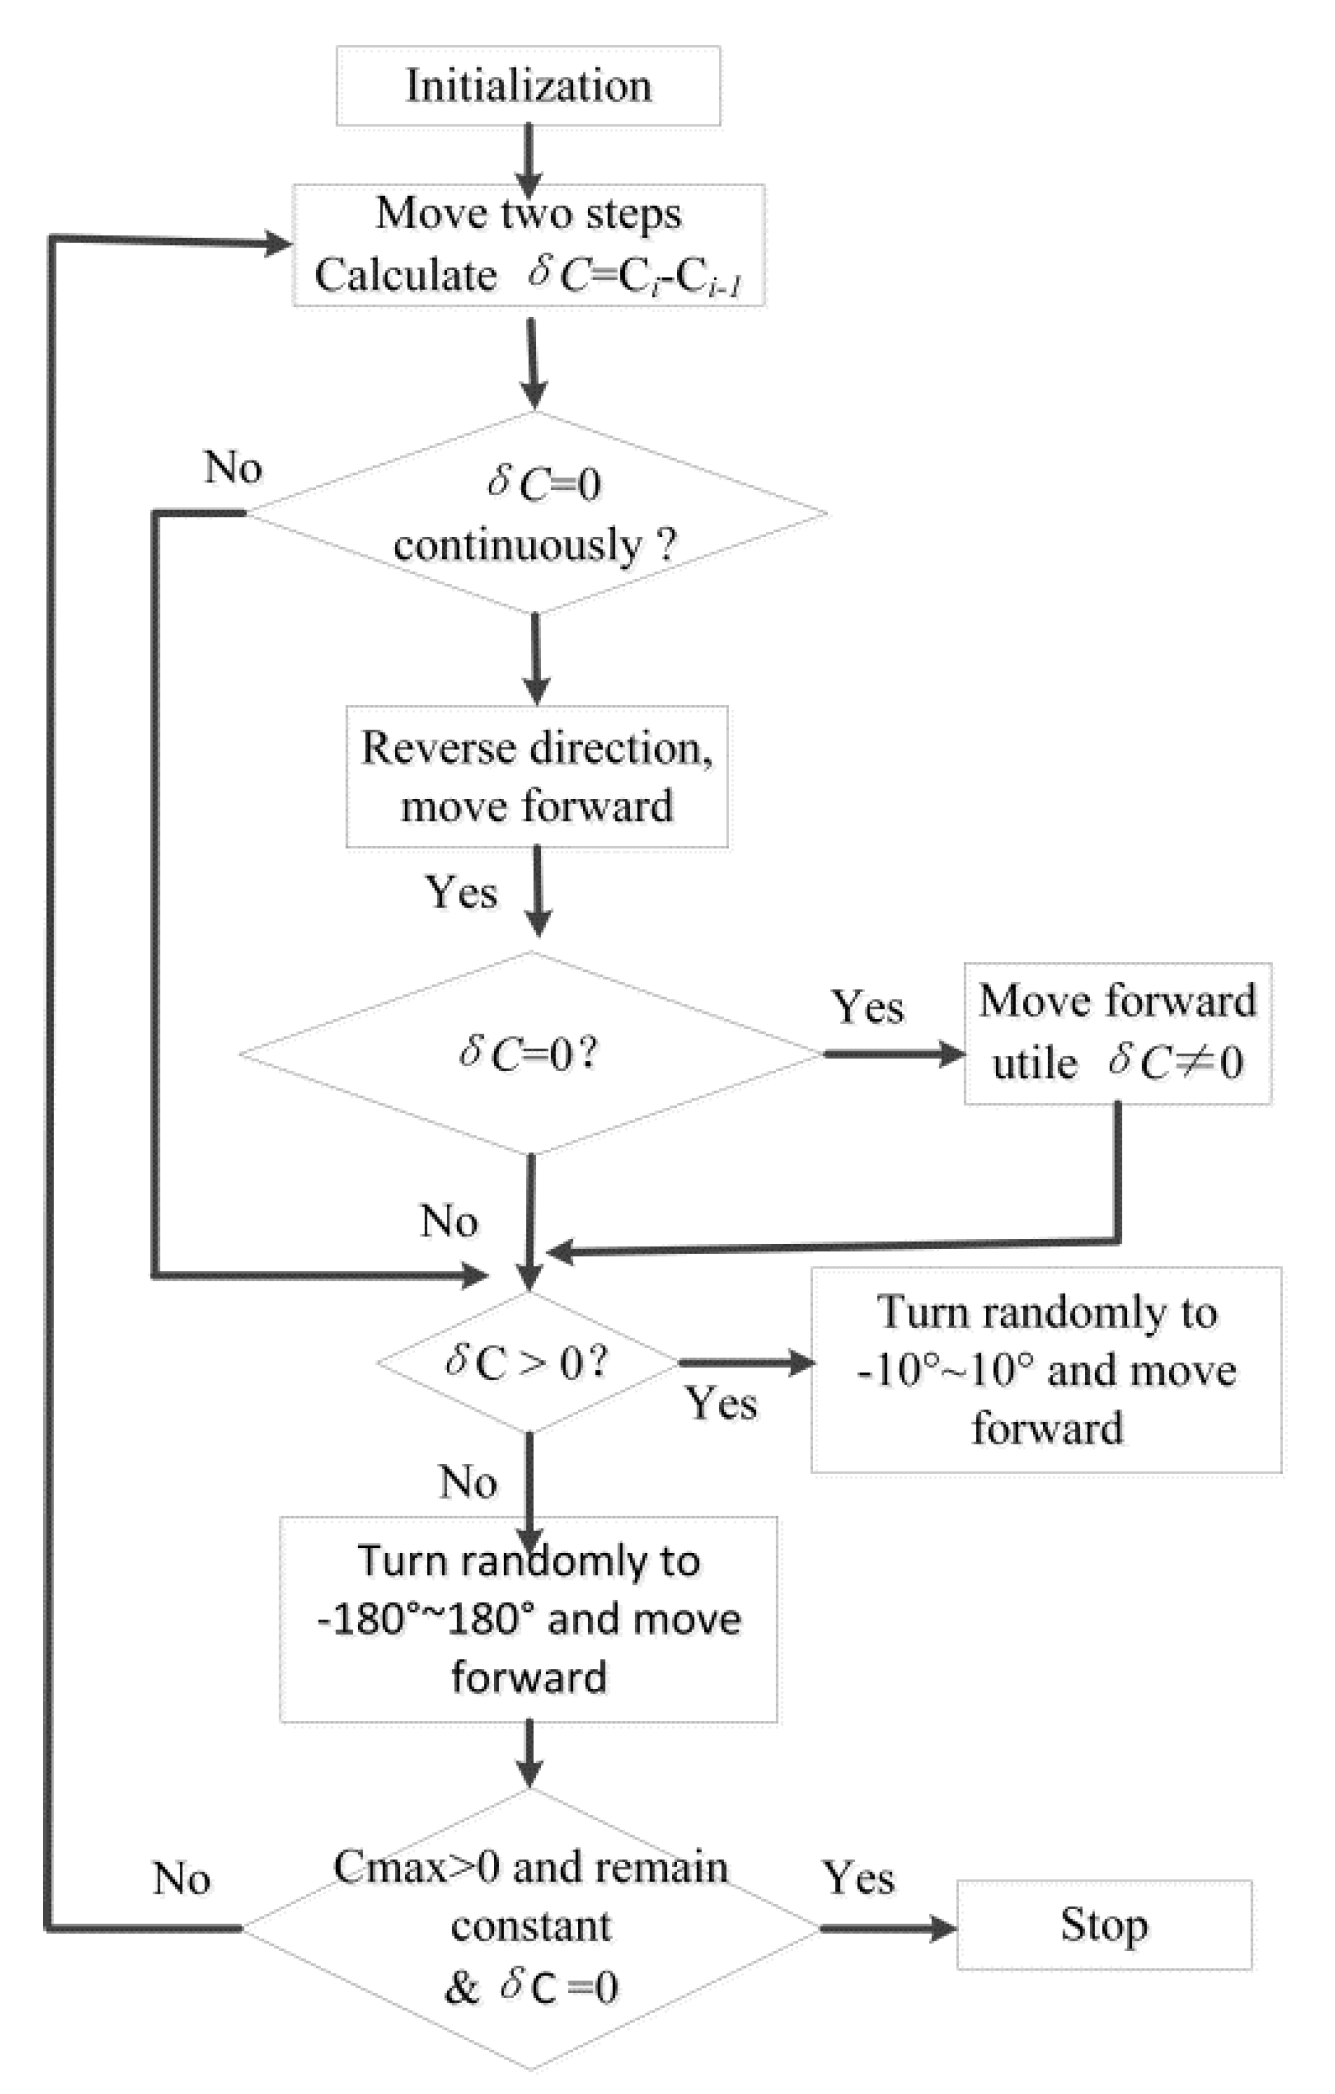
Figure 5.
The trajectory of the E. coli algorithm starting from the point in the plume (a) and the variations in concentration, maximum concentration, and gradient (b).
Figure 5.
The trajectory of the E. coli algorithm starting from the point in the plume (a) and the variations in concentration, maximum concentration, and gradient (b).

Figure 6.
The trajectory of the E. coli algorithm starting from the point outside the plume (a) and the variations in concentration, maximum concentration, and gradient (b).
Figure 6.
The trajectory of the E. coli algorithm starting from the point outside the plume (a) and the variations in concentration, maximum concentration, and gradient (b).
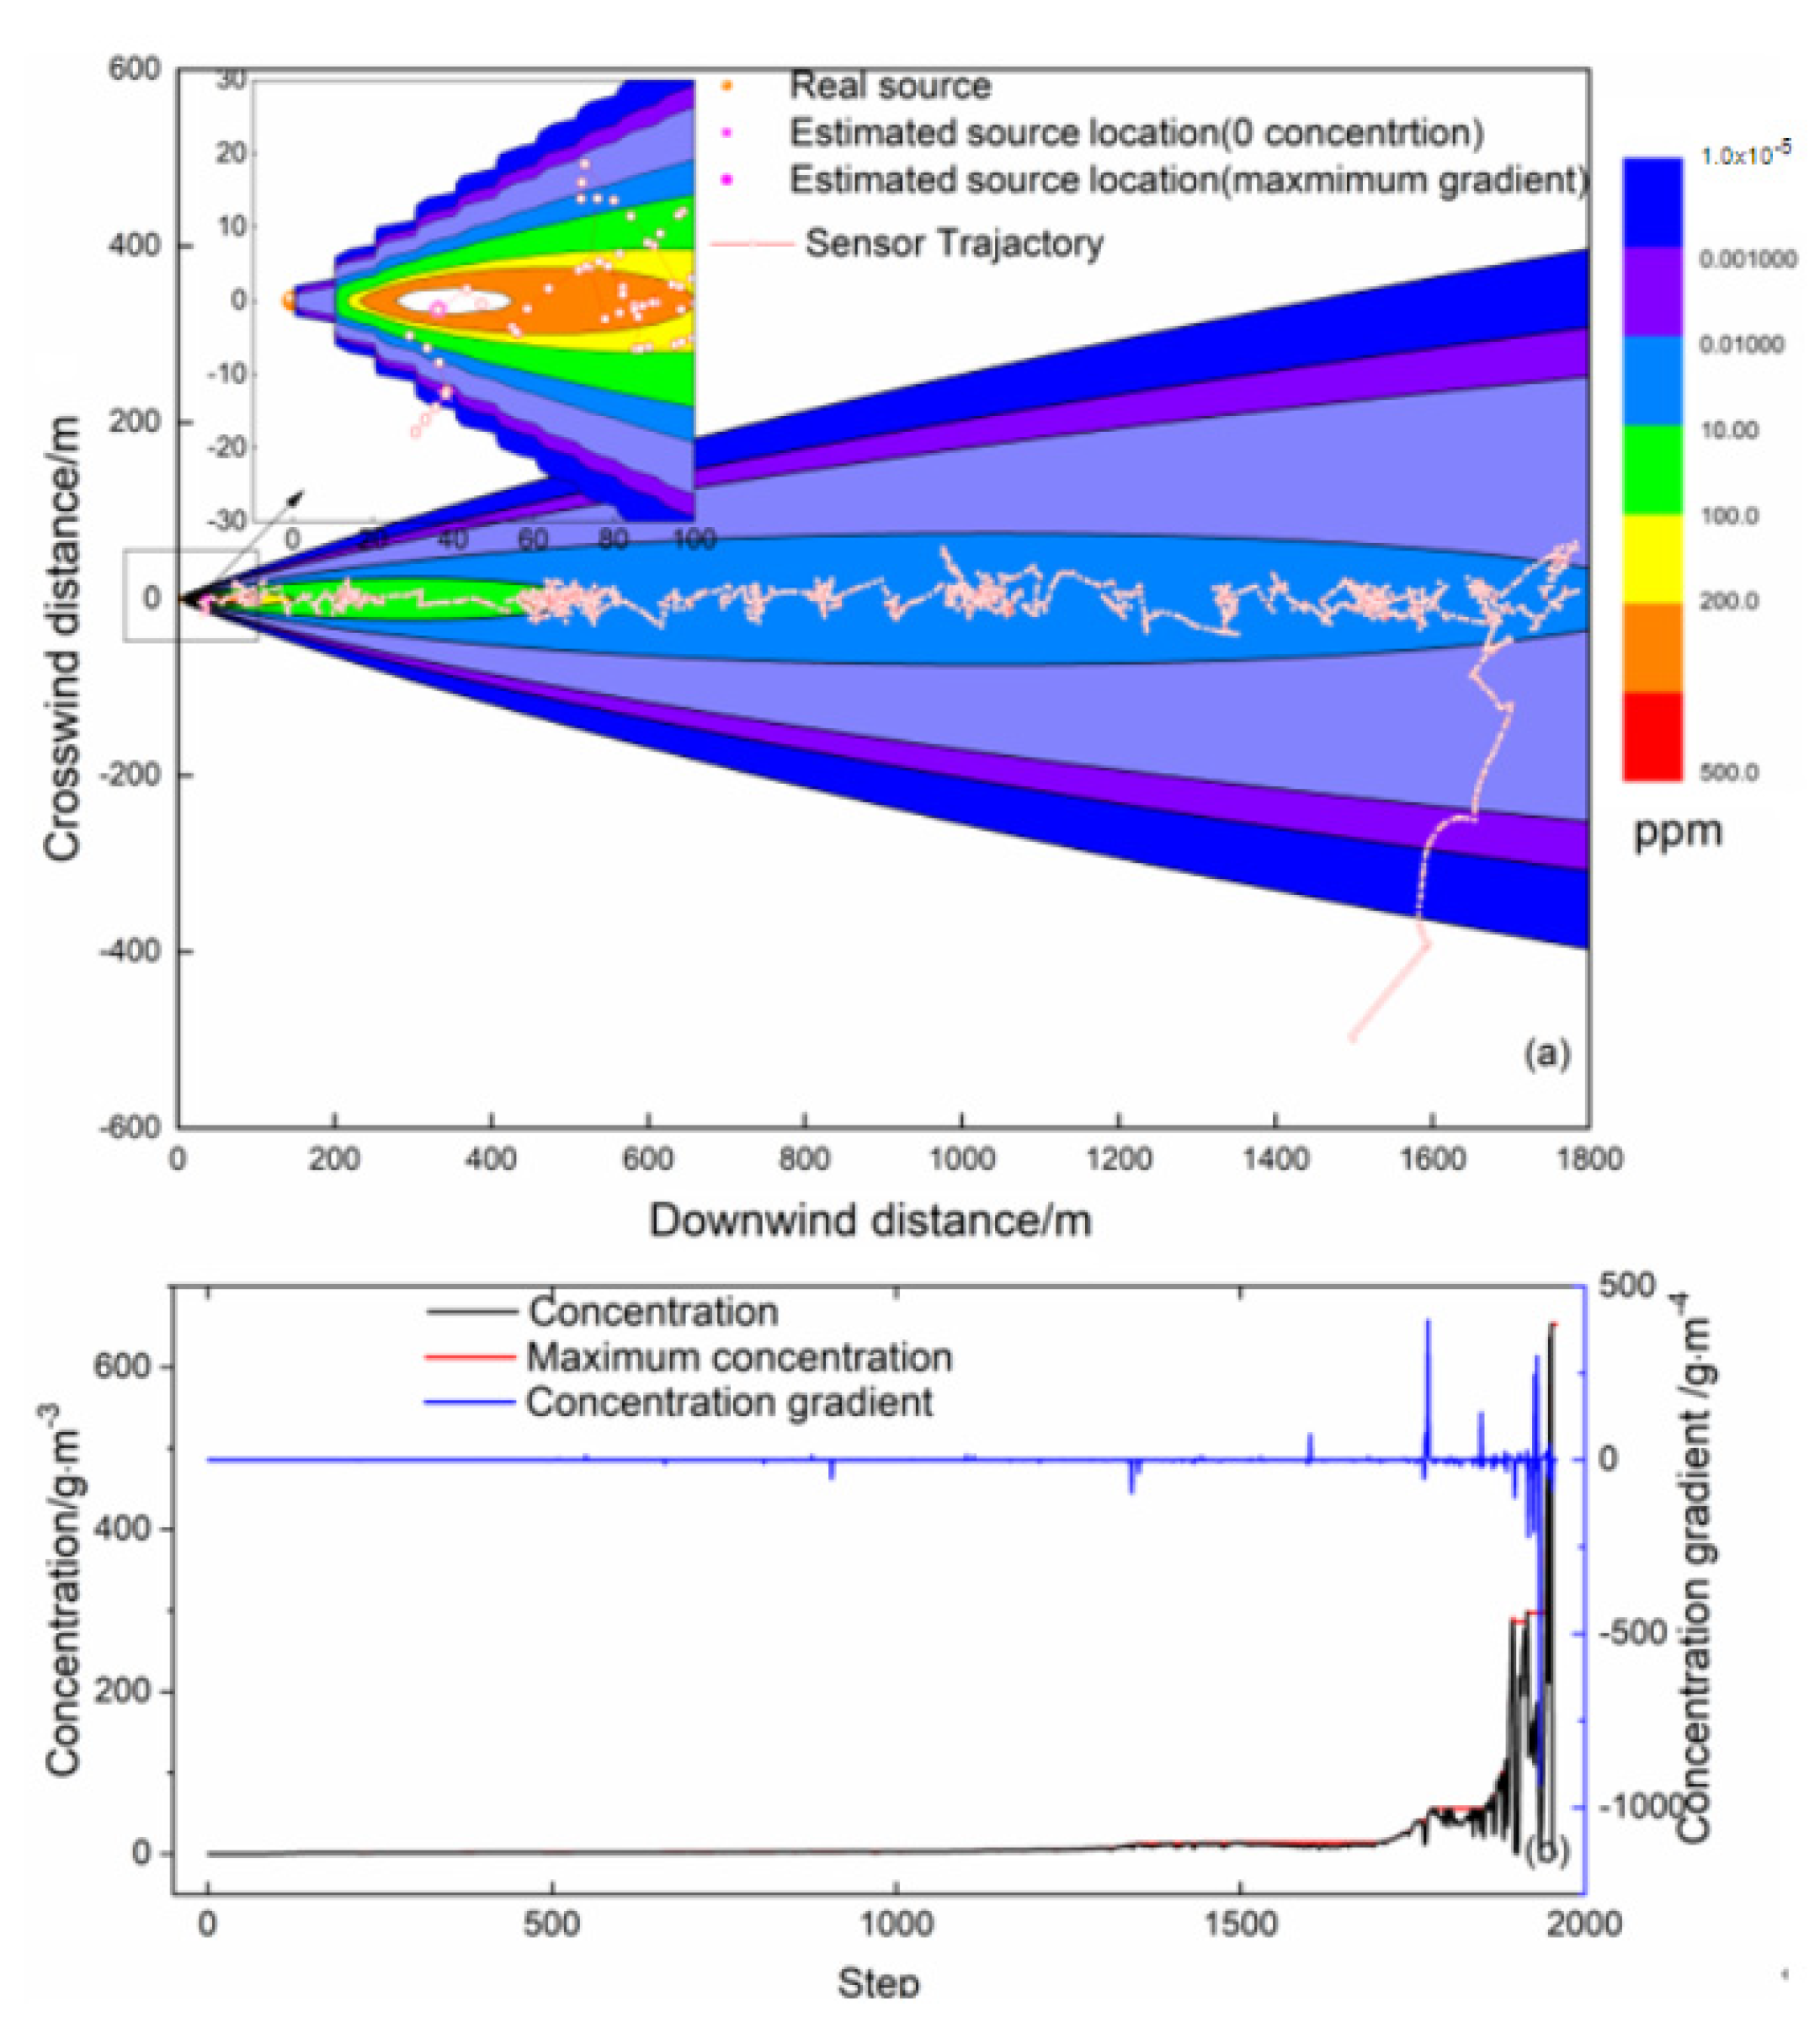
Figure 7.
Flow chart of the step-by-step algorithm.
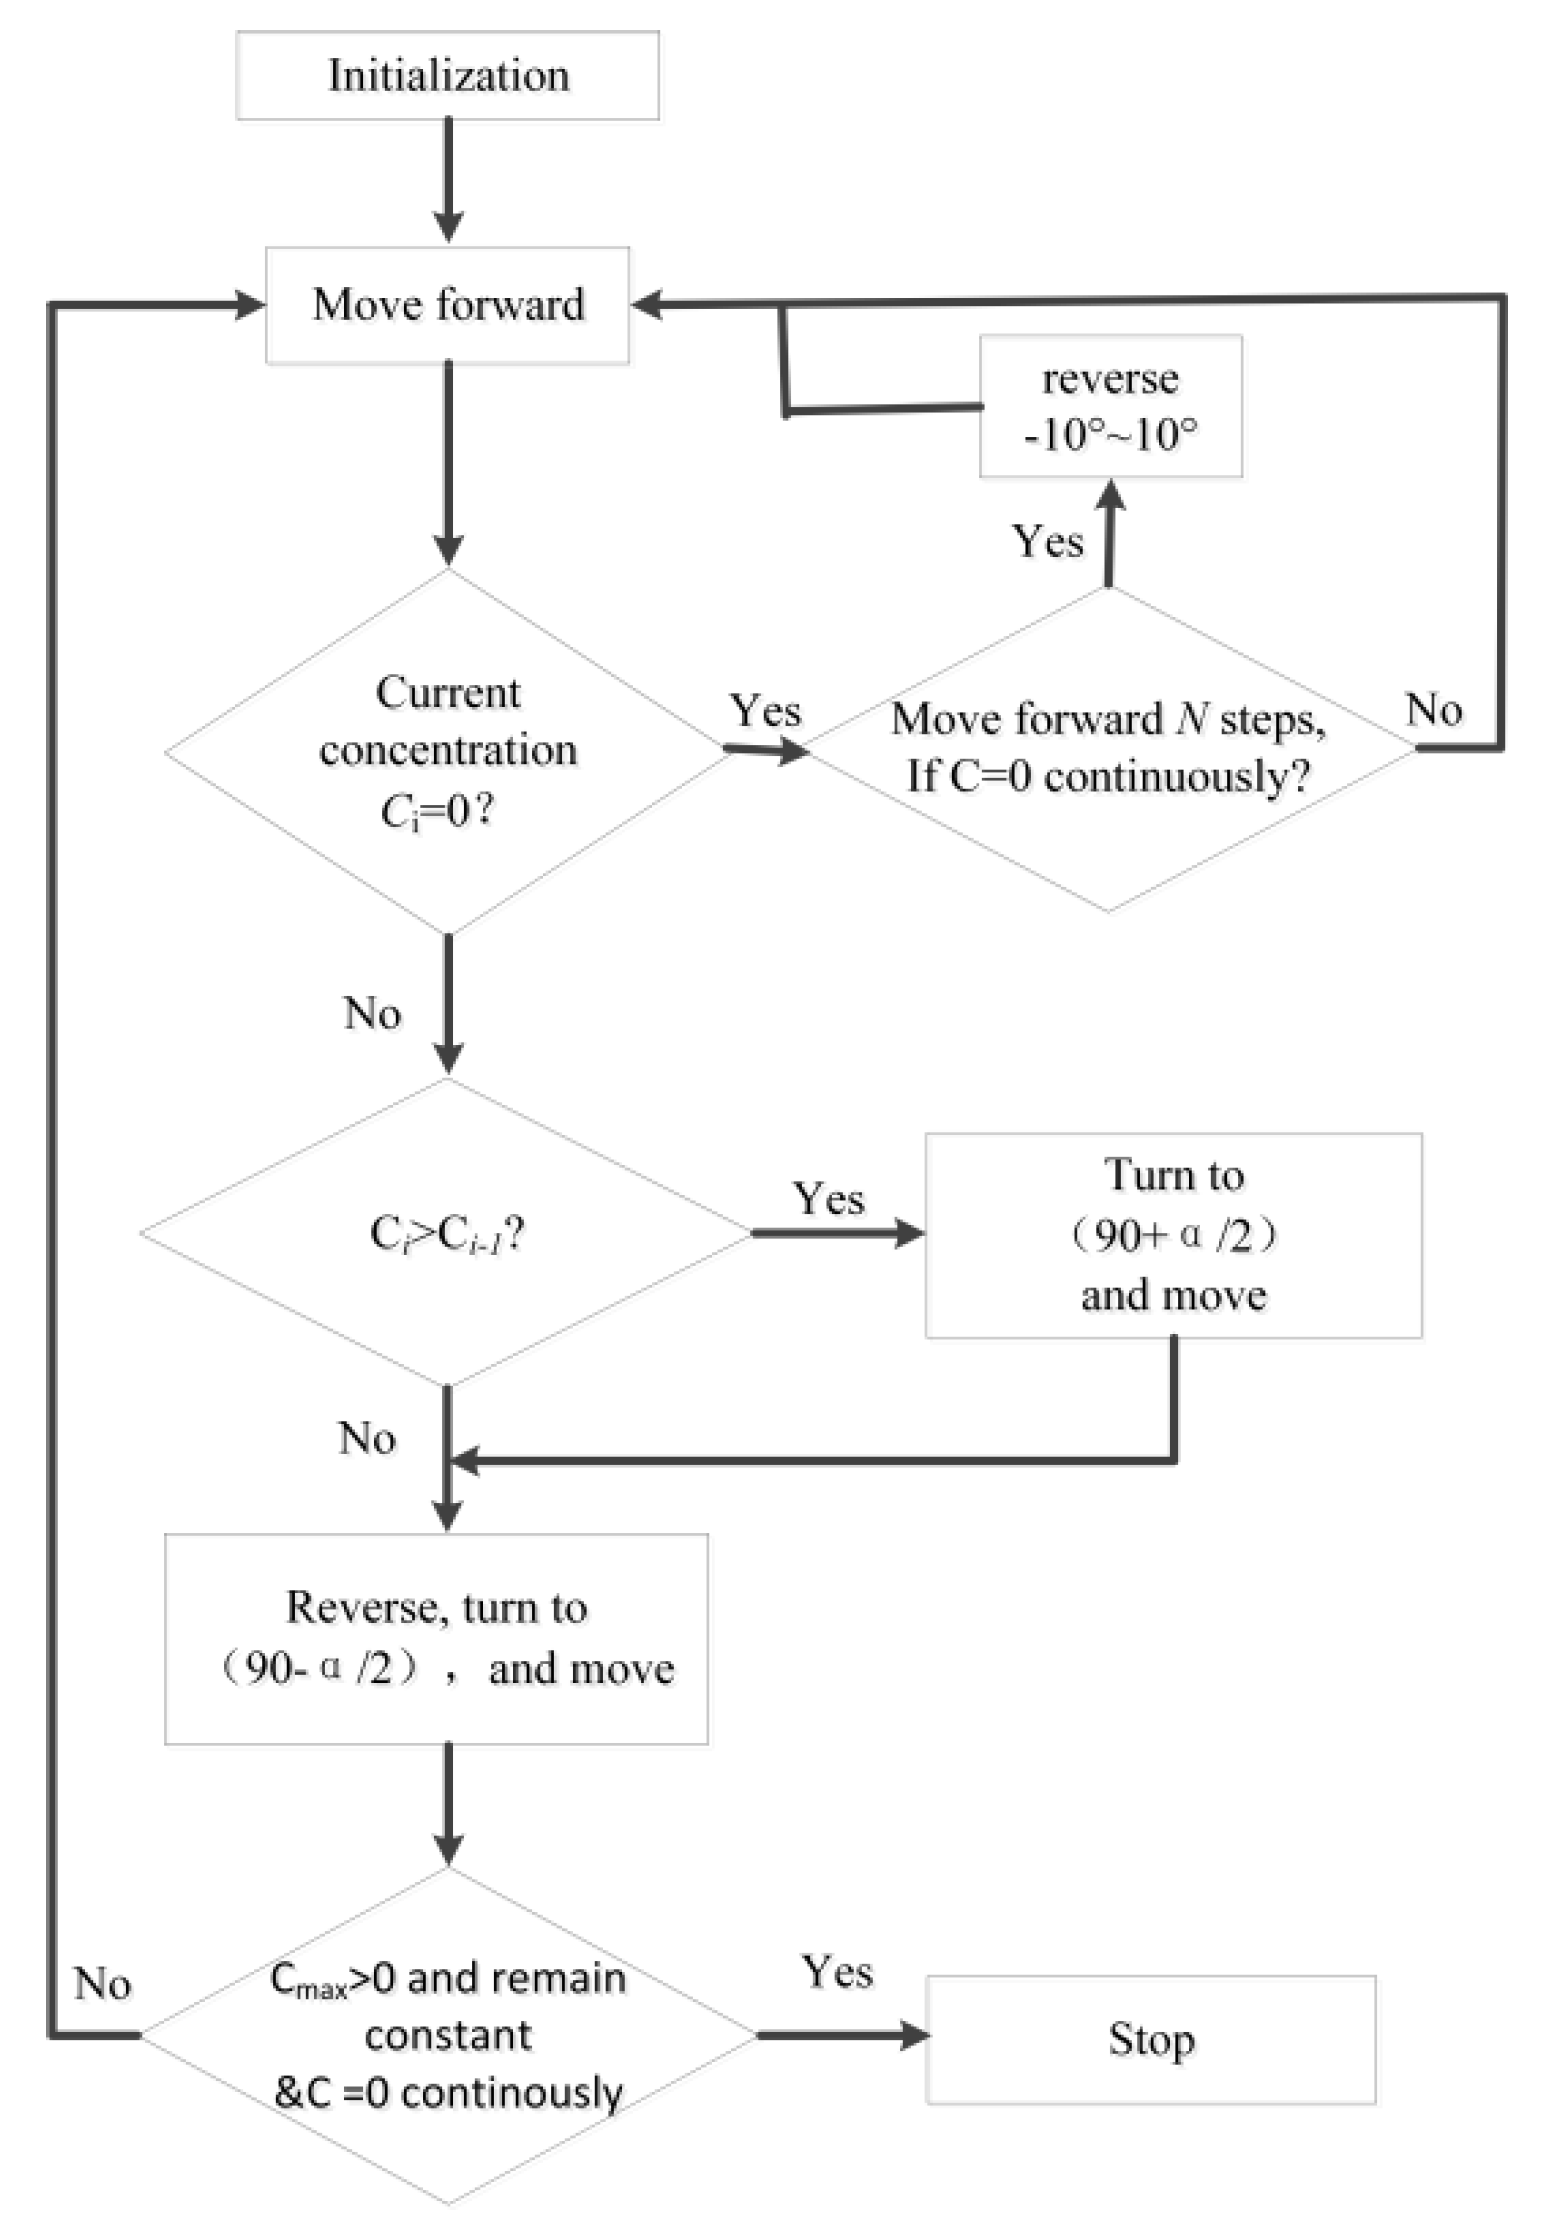
Figure 8.
The trajectory of the step-by-step algorithm starting from the point inside the plume (a) and the variations in concentration, maximum concentration, and gradient (b).
Figure 8.
The trajectory of the step-by-step algorithm starting from the point inside the plume (a) and the variations in concentration, maximum concentration, and gradient (b).
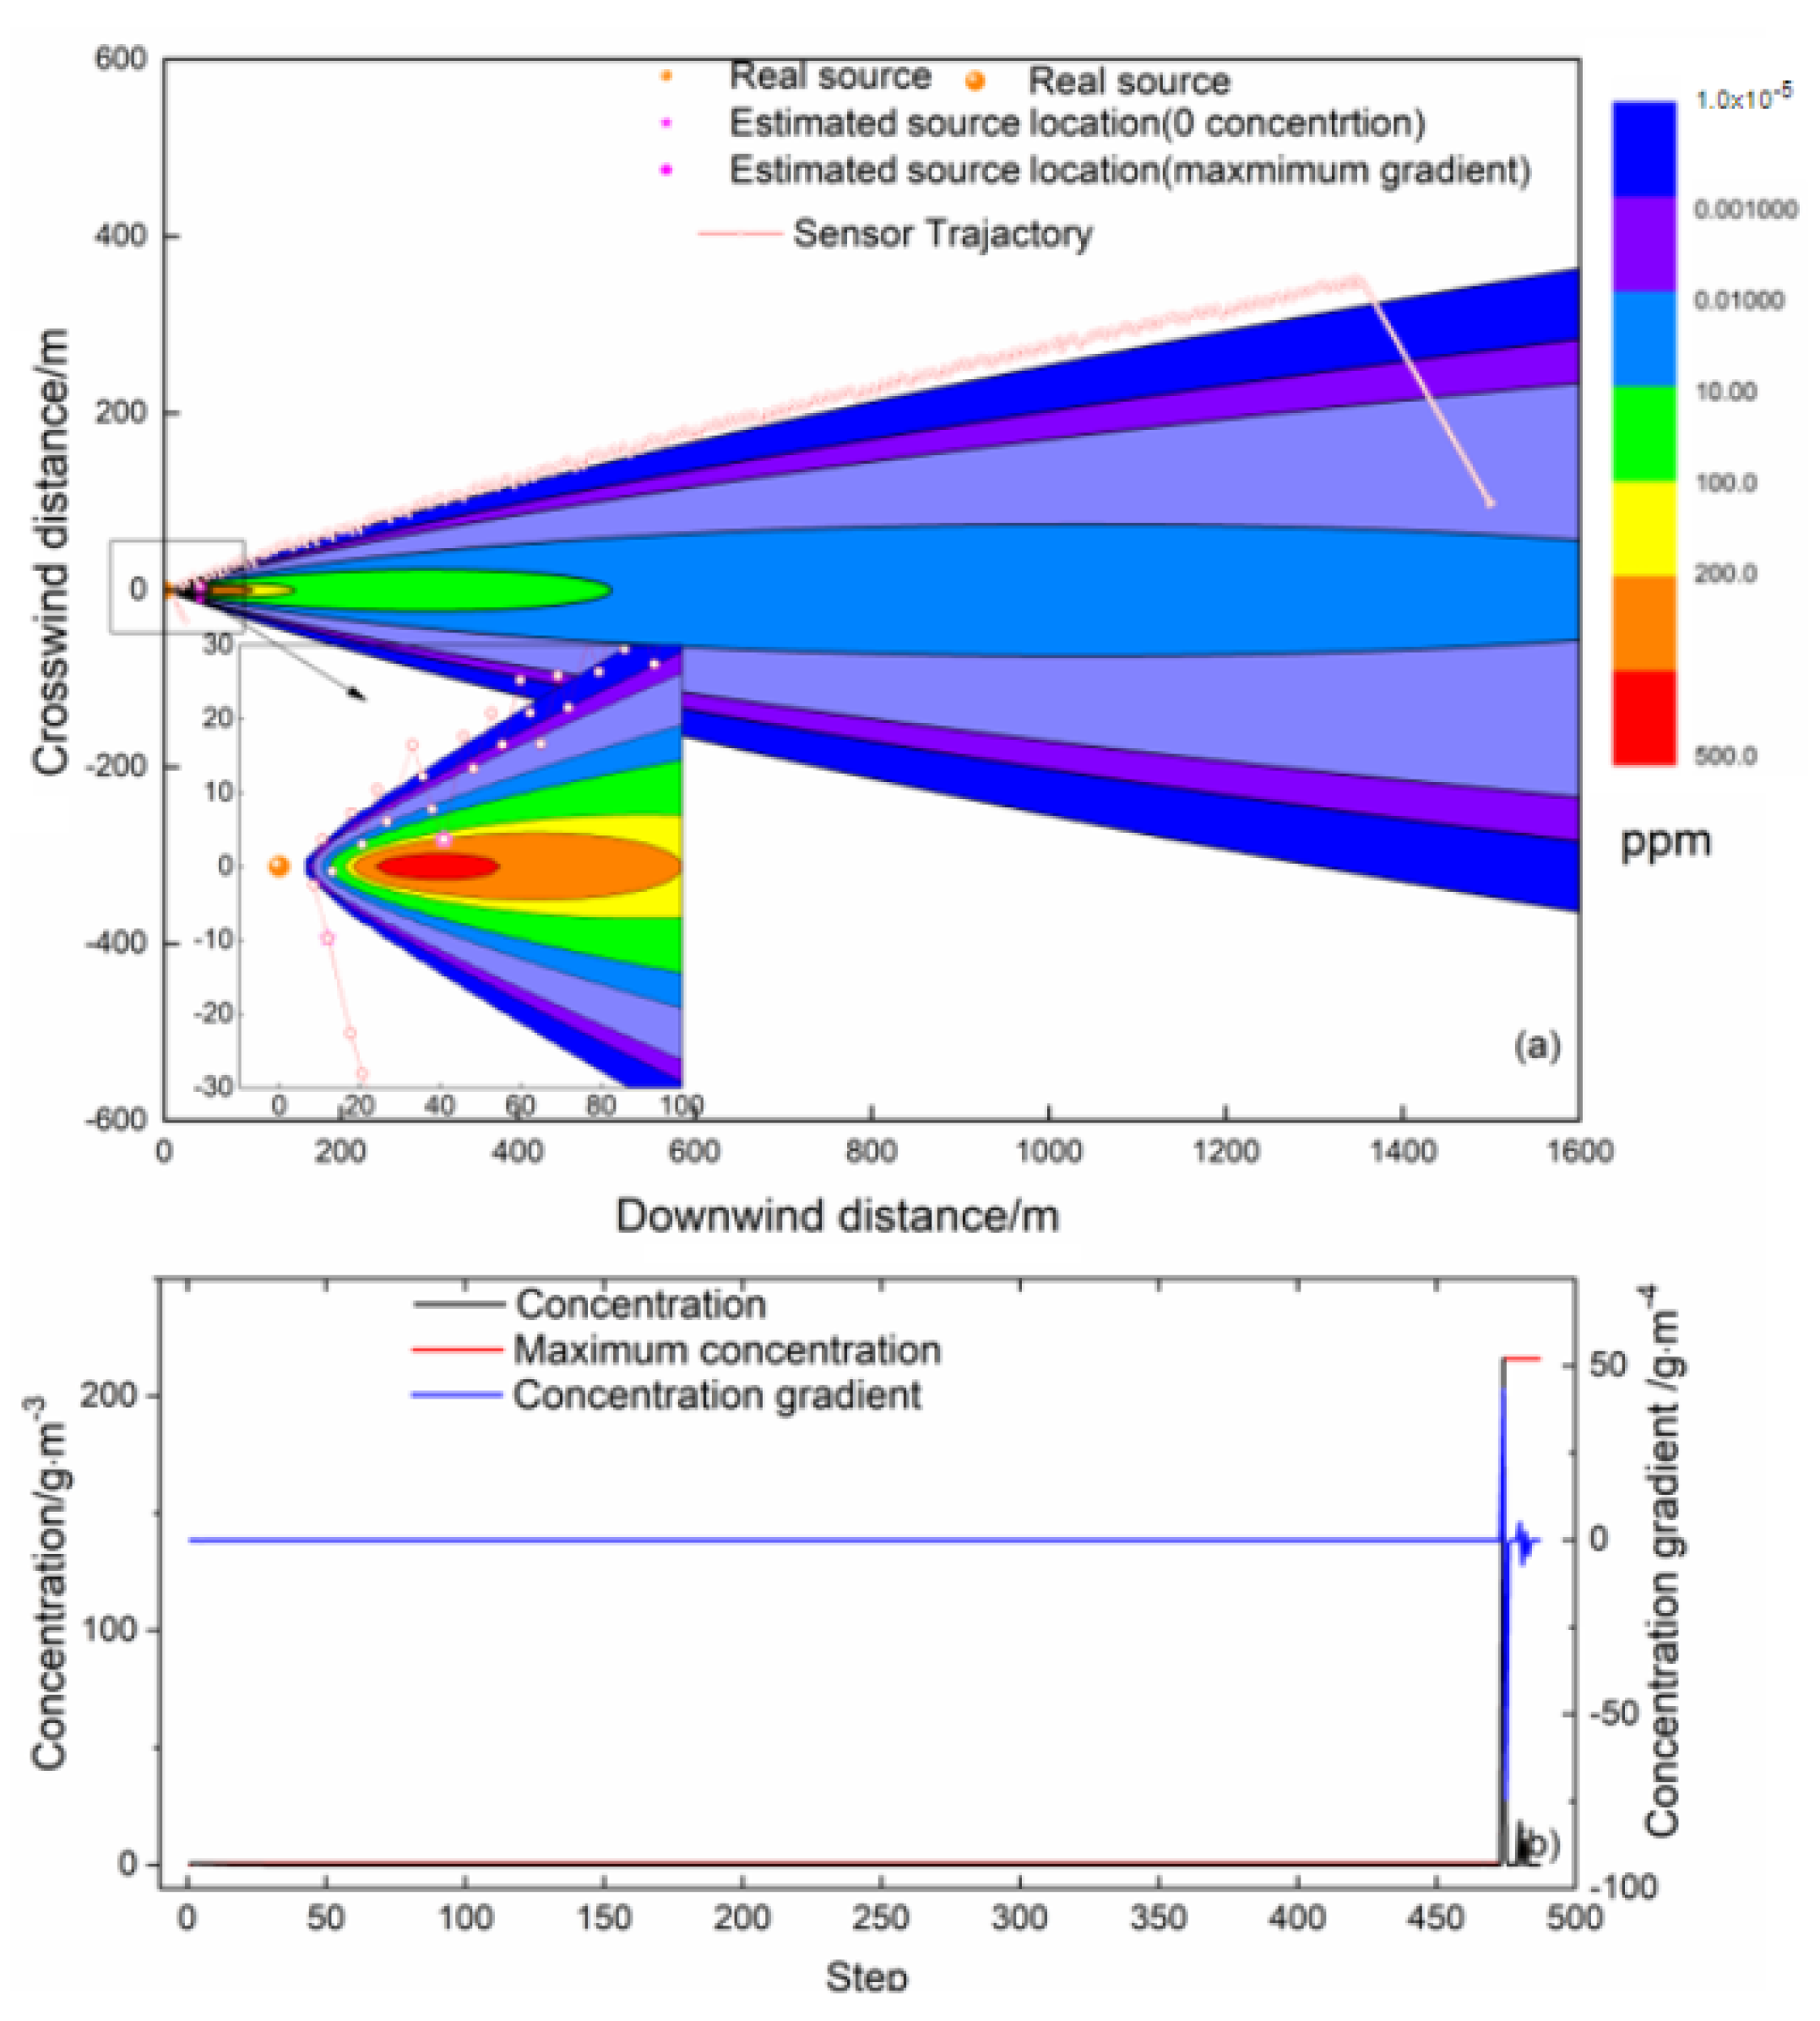
Figure 9.
The trajectory of the step-by-step algorithm starting from the point outside the plume (a) and the variations in concentration, maximum concentration, and gradient (b).
Figure 9.
The trajectory of the step-by-step algorithm starting from the point outside the plume (a) and the variations in concentration, maximum concentration, and gradient (b).
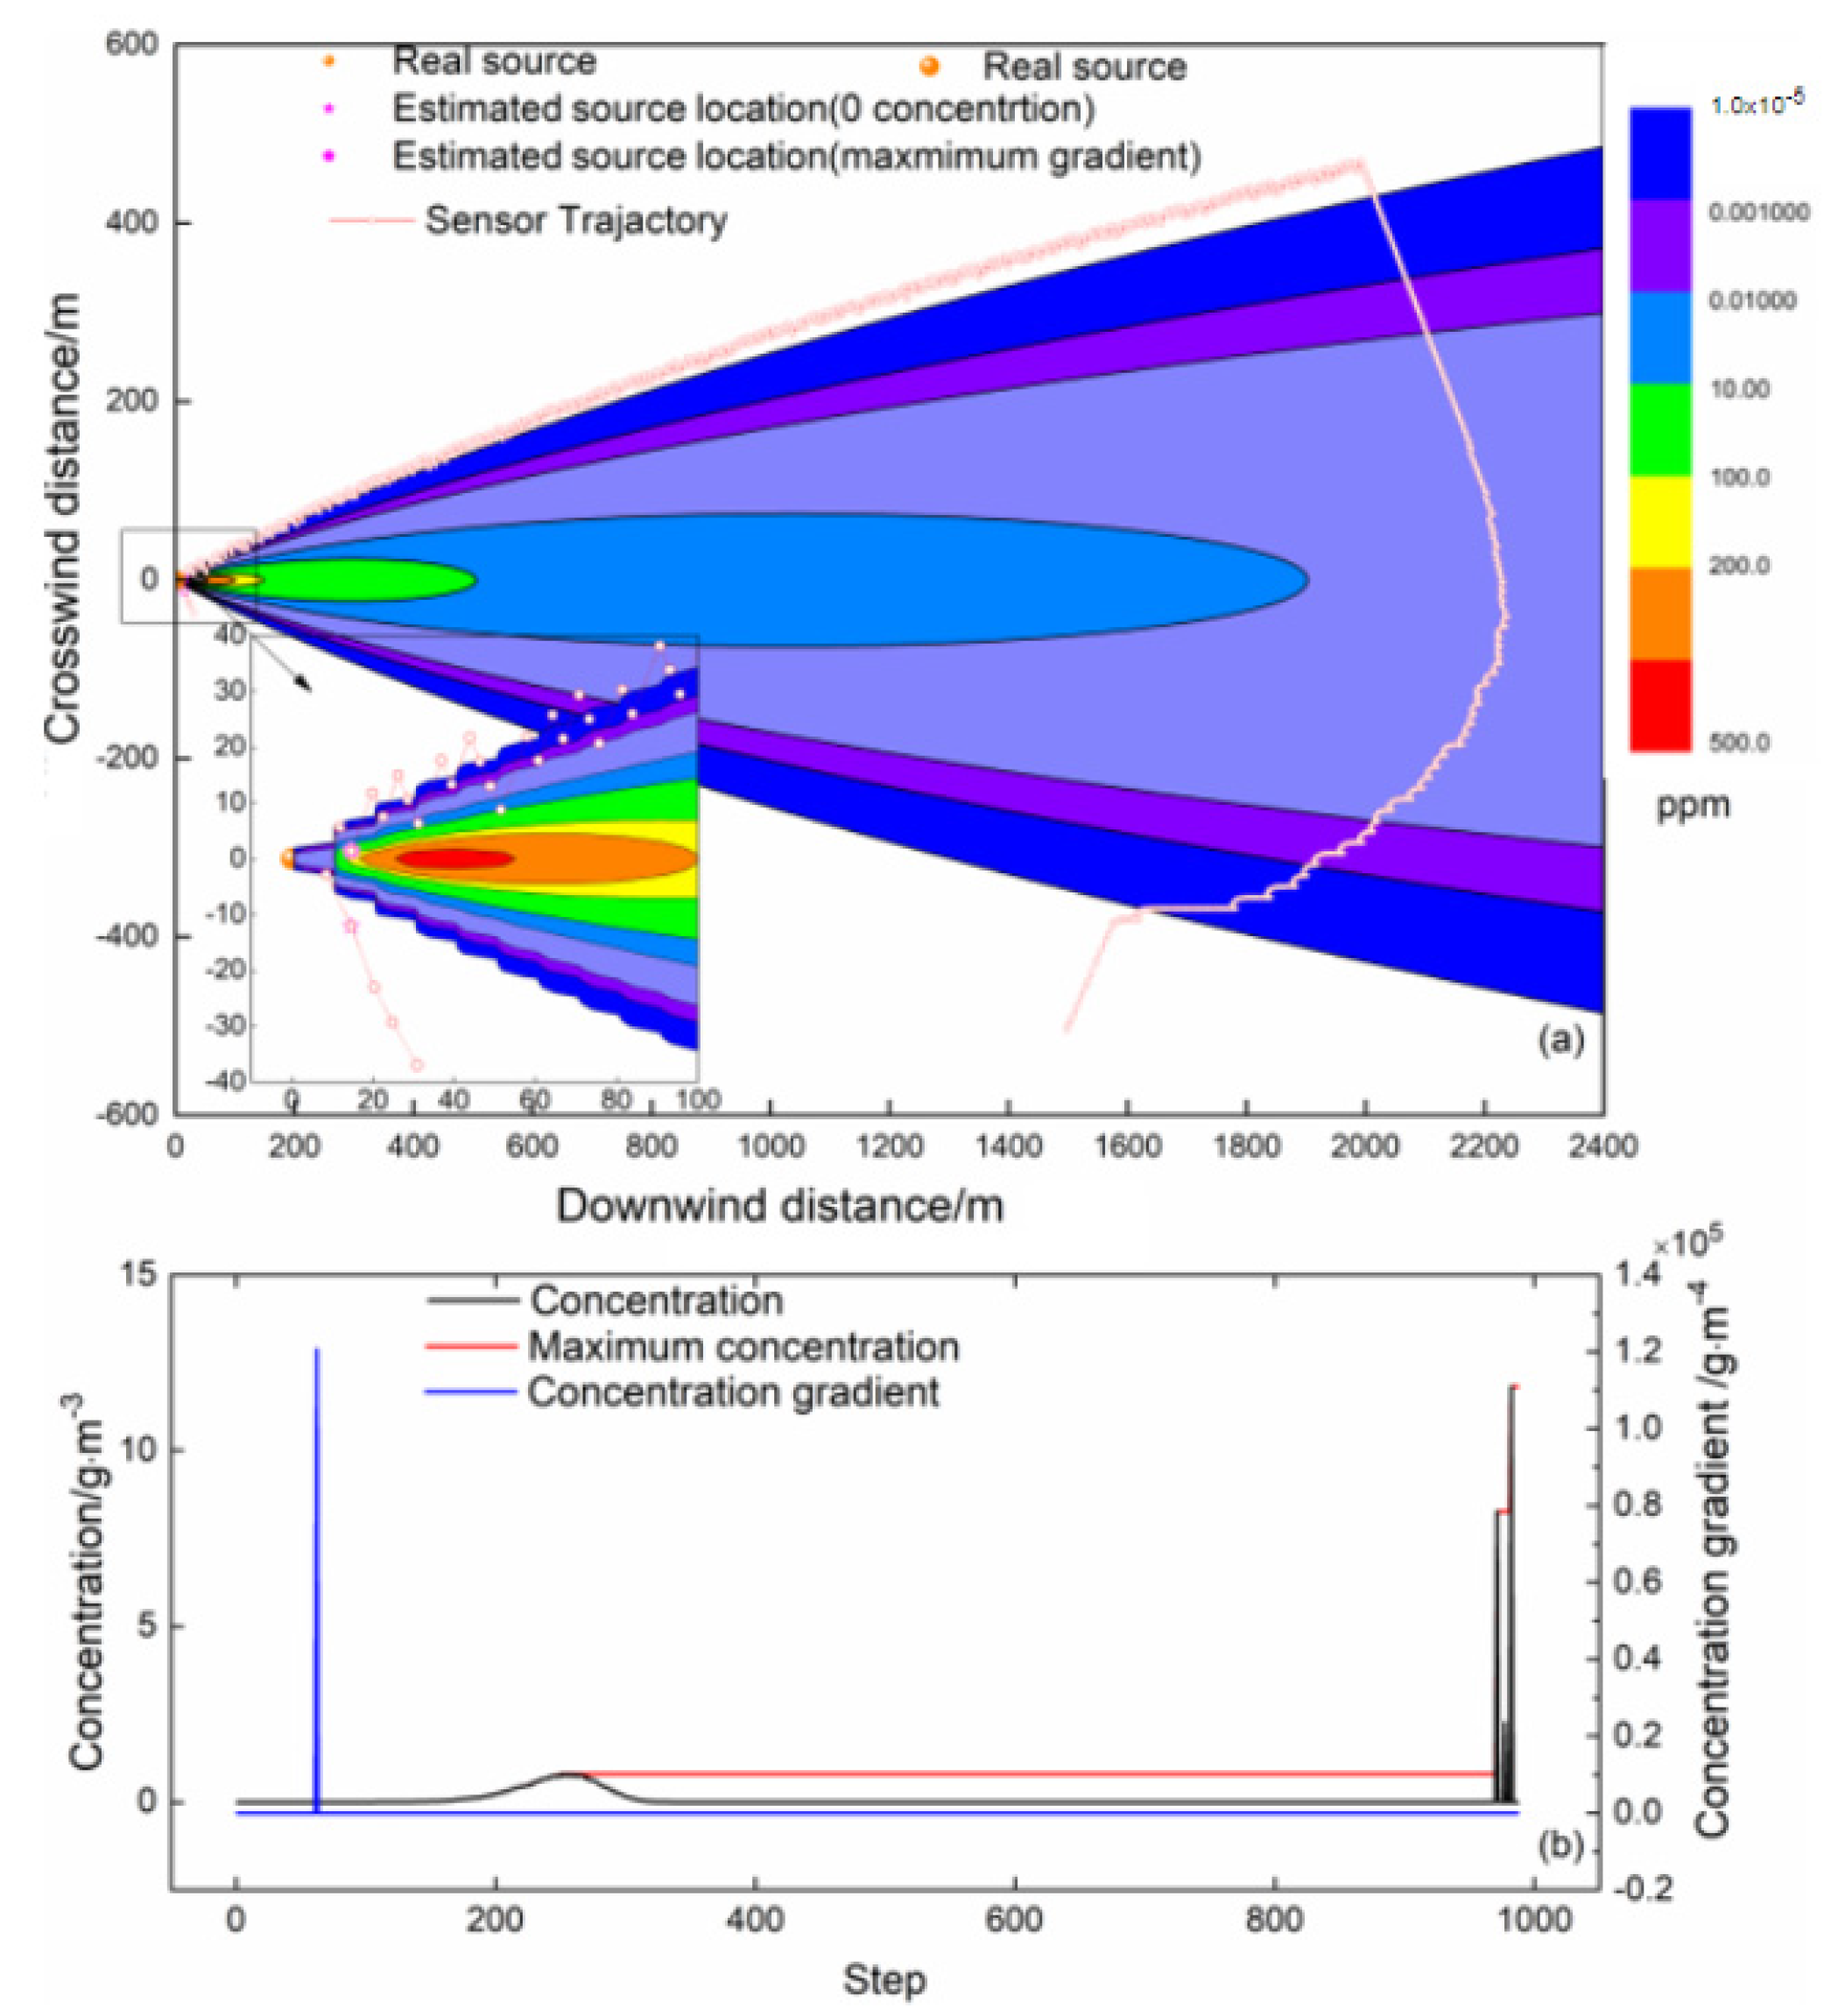
Figure 10.
The principle of RMIG tracking strategy.

Figure 11.
The trajectory of the RMIG algorithm starting from the point inside the plume (a) and the variations in concentration, maximum concentration, and gradient (b).
Figure 11.
The trajectory of the RMIG algorithm starting from the point inside the plume (a) and the variations in concentration, maximum concentration, and gradient (b).
Figure 12.
The trajectory of the RMIG algorithm starting from the point outside the plume (a) and the variations in concentration, maximum concentration, and gradient (b).
Figure 12.
The trajectory of the RMIG algorithm starting from the point outside the plume (a) and the variations in concentration, maximum concentration, and gradient (b).

Figure 13.
Performance comparison of different source-tracing algorithms. (a–c) are the results starting inside the plume, and (d–f) are the results starting outside the plume. (a,d) are the results of the distance of the estimated source to the real source with the zero-concentration criterion, while (b,c) are the results with maximum-concentration criterion. (c,f) are the total walking lengths of the mobile sensor.
Figure 14.
The trajectory of the RMIG algorithm with the acceleration strategy in cases starting from different points: (a) is from (1500, 100), (b) is from (1500, −100), (c) is from (1500, 500), and (d) is from (1500, −500).
Figure 14.
The trajectory of the RMIG algorithm with the acceleration strategy in cases starting from different points: (a) is from (1500, 100), (b) is from (1500, −100), (c) is from (1500, 500), and (d) is from (1500, −500).

Figure 15.
Comparison of the RMIG algorithm with and without the acceleration strategy at different starting points: A (1500, 100), B (1500, −100), C (1500, 500), and D (1500, −500).
Figure 15.
Comparison of the RMIG algorithm with and without the acceleration strategy at different starting points: A (1500, 100), B (1500, −100), C (1500, 500), and D (1500, −500).

Table 1.
Comparison of different bioinspired algorithms.
| Situation | Algorithms | Zero-Concentration Criterion | Maximum-Concentration/Gradient Criterion | Dl | Dl/D0 | ||||
|---|---|---|---|---|---|---|---|---|---|
| x | y | Ed1 | x | Y | Ed2 | ||||
| Start inside the plume | Silkworm | 3.54 | 7.65 | 8.43 | 9.37 | 1.84 | 9.55 | 14,700 | 9.78 |
| E. coli | 41.05 | −11.93 | 42.75 | 30.67 | −0.24 | 30.67 | 9580 | 6.37 | |
| Step-by-step | 12.06 | −9.71 | 15.48 | 40.84 | 3.68 | 41.00 | 6240 | 4.15 | |
| Start outside the plume | Silkworm | 2.07 | −7.02 | 7.32 | 8.9 | −1.71 | 9.06 | 79,100 | 50.03 |
| E. coli | 38.17 | −12.68 | 40.22 | 36.23 | −1.16 | 36.25 | 9660 | 6.111 | |
| Step-by-step | 20.36 | −23.05 | 30.75 | 19.85 | 11.79 | 23.08 | 3270 | 2.07 | |
Table 2.
Results of the RIMIG algorithm with the acceleration strategy.
| Starting Point | Zero-Concentration Criterion | Maximum-Concentration Criterion | Dl | D0 | Dl/D0 | ||||
|---|---|---|---|---|---|---|---|---|---|
| x | y | Ed | X | Y | Ed | ||||
| 1500, 100 | 32.76 | −3.15 | 32.91 | 56.76 | −3.14 | 56.84 | 1910 | 1503.32 | 1.27 |
| 1500, −100 | 5.07 | 16.24 | 17.01 | 23.41 | −0.75 | 23.42 | 1950 | 1503.32 | 1.30 |
| 1500, 500 | 9.55 | 2.51 | 9.87 | 43.55 | 2.51 | 43.62 | 2878 | 1581.13 | 1.82 |
| 1500, −500 | 60.68 | −14.21 | 62.32 | 60.68 | 14.21 | 62.32 | 2015 | 1581.13 | 1.27 |
Table 3.
Results of the RMIG-OCMCD algorithm at different initial positions.
| Starting Position | Zero-Concentration Criterion | Maximum-Concentration Criterion | OCMCD | ||||||
|---|---|---|---|---|---|---|---|---|---|
| x | y | Ed | X | Y | Ed | X | y | Ed | |
| 1500, 100 | 64.32 | 20.34 | 67.46 | 69.99 | 268.33 | 277.313 | −0.03 | 0.05 | 0.06 |
| 1500, −100 | 38.61 | −8.45 | 39.52 | 331.35 | −25.93 | 332.36 | 3.75 | −0.41 | 3.77 |
| 1500, 500 | 30.91 | 4.75 | 31.27 | 72.91 | 4.75 | 73.06 | 1.62 | 0.11 | 1.62 |
| 1500, −500 | 16.73 | 4.41 | 17.30 | 22.93 | −1.13 | 22.96 | 0.8 | 0.12 | 0.81 |
Publisher’s Note: MDPI stays neutral with regard to jurisdictional claims in published maps and institutional affiliations. |
© 2022 by the authors. Licensee MDPI, Basel, Switzerland. This article is an open access article distributed under the terms and conditions of the Creative Commons Attribution (CC BY) license (https://creativecommons.org/licenses/by/4.0/).
Share and Cite
MDPI and ACS Style
Ma, D.; Xie, G.; Mao, W.; Gao, J.; Yi, H.; Li, D. Comparison and Improvement of Bioinspired Mobile Algorithms to Trace the Emission Source Based on the Simulation Scenarios. Atmosphere 2022, 13, 661. https://doi.org/10.3390/atmos13050661
AMA Style
Ma D, Xie G, Mao W, Gao J, Yi H, Li D. Comparison and Improvement of Bioinspired Mobile Algorithms to Trace the Emission Source Based on the Simulation Scenarios. Atmosphere. 2022; 13(5):661. https://doi.org/10.3390/atmos13050661
Chicago/Turabian StyleMa, Denglong, Guofang Xie, Weigao Mao, Jianmin Gao, Hang Yi, and Dangchao Li. 2022. "Comparison and Improvement of Bioinspired Mobile Algorithms to Trace the Emission Source Based on the Simulation Scenarios" Atmosphere 13, no. 5: 661. https://doi.org/10.3390/atmos13050661
Note that from the first issue of 2016, this journal uses article numbers instead of page numbers. See further details here.