
Vehicular Traffic in Urban Areas: Health Burden and Influence of Sustainable Urban Planning and Mobility


Institute of Environmental Assessment and Water Research (IDAEA)-CSIC, 08034 Barcelona, Spain
*
Author to whom correspondence should be addressed.
Atmosphere 2022, 13(4), 598; https://doi.org/10.3390/atmos13040598
Submission received: 24 February 2022
/
Revised: 18 March 2022
/
Accepted: 31 March 2022
/
Published: 8 April 2022
(This article belongs to the Special Issue Feature Papers in Air Pollution, Health Effects Indicators, Exposome, and One Health)
Abstract
:Vehicular traffic is one of the major sources of air pollution in European cities. This work aims to understand which characteristics of the urban environment could influence mobility-related air pollution, quantify the health impacts of exposure to traffic-derived PM2.5 and NO2 concentrations, and assess the potential health benefits expected from traffic interventions. The health benefits modeled are intended to provide a set of comparable data to support decision-makers and encourage informed decision-making to design healthier cities. Targeting a large geographical coverage, 12 European cities from 9 countries were comparatively assessed in terms of mean daily traffic volume/area, the number of public transport stops/area, and the percentage of green and outdoor leisure areas, among other urban indicators. This was implemented using an open-source data mining tool, which was seen as a useful engine to identify potential strategies to improve air quality. The comparison of urban indicators in the selected cities evidenced two trends: (a) cities with the most heterogeneous distribution of public transport stops, as an indicator of poor accessibility, are also those with the lowest proportion of km dedicated to cycleways and footways, highlighting the need in these cities for more sustainable mobility management; and (b) the percentage of green and outdoor leisure areas may influence the share of journeys by bicycle, pointing out that promoting the perception of green routes is relevant to enhance the potential of active transport modes. Socioeconomic factors can be key determinants of the urban indicators and would need further consideration. For the health impact assessment (HIA), two baseline scenarios were evaluated and compared. One is based on mean annual traffic contributions to PM2.5 concentrations in each target city (ranging between 1.9 and 13 µg/m3), obtained from the literature, and the second is grounded on mean annual NO2 concentrations at all available traffic and urban background stations within each city (17.2–83.5 µg/m3), obtained from the European Environment Agency database. The intervention scenarios modeled were designed based on traffic mitigation strategies in the literature, and set to ranges of 6–50% in traffic-derived PM2.5 concentrations and of 4–12.5% in NO2 concentrations. These scenarios could result in only a 1.7% (0.6–4%) reduction in premature mortality due to exposure to traffic-derived PM2.5, and 1.0% (0.4–2%) due to exposure to NO2, as the mean for all the cities. This suggests that more ambitious pollution abatement strategies should be targeted.
1. Introduction
Exposure to air pollutants is of special concern in urban areas because of the dense populations exposed and the diversity of emission sources, with complex chemical patterns. Air pollution is associated with a number of adverse health impacts, including chronic obstructive pulmonary disease (COPD), acute lower respiratory illness (ALRI), cerebrovascular disease (CEV), ischaemic heart disease (IDD), lung cancer (LC) respiratory Tuberculosis and diabetes mellitus, among others [1,2,3]. During recent decades, epidemiological and toxicological studies have provided evidence for the implementation of health impact assessments (HIA) of air pollution [4].
Reducing health impacts from air pollution requires understanding the sources contributing to human exposure and quantifying their contributions. Vehicular traffic is one if not the major source of air pollution in urban areas [5,6,7]. It has become the dominant source of air pollutants, including carbon monoxide (CO), carbon dioxide (CO2), volatile organic compounds (VOCs) or hydrocarbons (HCs), nitrogen oxides (NOx), and particulate matter (PM), especially carbonaceous particles, contributing with around 11% to PM2.5 concentrations across Europe and 28% to Black Carbon (as annual means for 2017) [8] Policies aiming to reduce traffic emissions comprise measures such as reducing the number of vehicles (congestion charges and parking restrictions), the progressive increase of active transport, such as cycling and walking, the transition to electric vehicles, low emission zones, and/or speed limit reduction. Studies evidencing the effectiveness of these local policies in reducing air pollution are somewhat scarce and conclusions show differences but their results are encouraging [9,10,11,12]. There is an agreement in the literature that traffic primary emissions are relatively well understood and that technological improvement in vehicle engines and fuels are efficiently decreasing their contribution to PM2.5 concentrations [8,13,14]. However, a more detailed and quantitative understanding of the organic and inorganic fractions of secondary aerosol is necessary to help countries meet more ambitious targets. Further evaluation of these pollutants and their ultimate effect on public health is of interest to city air quality managers [15]. In this framework, more efforts are required to improve data availability and evaluation, as well as data openness for future smart city development [16,17], to further combine with other types of information in view of increasing their impact in terms of policymaking.
A number of studies have evidenced that information on the shape of a city and the land use distribution determine the location of emission sources and the pattern of urban traffic, affecting urban air quality. Urban configuration has long been known to be a major cause of poor air quality [18]. Previous research has demonstrated the relationship between sprawl indicators, such as density and street network, and air quality. However, the exact relationship between development patterns and air quality has been elusive due to difficulties in quantifying patterns or using indicators poorly suited for spatial analysis [19]. In McCarty and Kaza [20], authors found that after controlling for demographic factors and the level of urbanization, both the pattern of urbanization and the mixing of different land cover types are important determinants of pollutant levels and air quality, and, thus, conclude that public action for mitigating pollutant levels could refer to land-use strategies in addition to other emission control mechanisms. New techniques which integrate satellite remote sensing and Geographical Information Systems (GIS) are being recently used to continually monitor air quality at the microscale level to effectively evaluate the role of urban conditions [21,22].
With regards to the health benefits of reducing air pollution, previous works have frequently been based on air quality measurements, largely focusing on the urban pollution mix [23,24]. Health impact assessment applies a health impact function combining risk estimates (from the epidemiological literature), which relate hypothesized air quality changes to a population at risk [25]. This kind of study frequently assesses scenarios where air pollutant concentrations are reduced to meet national limit values or WHO guidelines, obtaining satisfactory results with evidence of postponed mortality and reduced hospital admissions [26,27,28,29,30,31,32,33,34,35,36,37,38,39]. Other studies address stricter limits to achieve significant health benefits [40,41]. Recently, Malmqvist et al. [42] concluded on a substantial possibility to reduce the health burden attributed to tail-pipe emissions. A number of these studies underscored the importance of using spatially and temporally resolved data in local air quality impact assessments to characterize the overall city burden and identify areas of high vulnerability. However, it is important to note that the amount of studies focusing on a specific pollution source, with a quantified contribution to a selected parameter, is relatively scarce [2,29,37,42,43,44,45,46], which could be related to the lack of source-specific epidemiological studies, both short- and long-term. In Mak et al. [2], geo-processed traffic emission figures were distributed to respective districts of Hong Kong via mathematical means, finding correlations between NOx and mortality within different case studies in the range 0.371 to 0.783, while varying from 0.509 to 0.754 for PM2.5. On the other hand, Stockfelt et al. [47] reported that associations between source-specific PM air pollution and incident cardiovascular disease were mixed and generally weak.
In this framework, the aim of this work was to assess traffic-related air pollution in urban areas from a holistic perspective, addressing urban characteristics, health impact assessment and traffic mitigation strategies. To this end, urban indicators and air pollutants (traffic-derived PM2.5 and NO2) from 12 urban environments in Europe were evaluated, providing a broad geographic perspective. Traffic-related PM2.5 scenarios (all of them pre-COVID19) were selected to capitalize on the availability of comparable PM2.5 source apportionment assessments, already published in the literature. The specificity of these source apportionment assessments, based on well-established chemical compositions, was compared with the higher spatial availability of NO2 concentrations, with a more typical distinct local pattern than PM2.5, in order to describe differences and highlight the strengths and weaknesses of each parameter when feeding HIA models. Traffic reductions were proposed through an extensive literature review and contextualized according to the current state of urban planning factors in the cities. The avoided premature mortality resulting from the effect on air quality of the selected traffic reductions was modeled. A conceptual model of the methodological approach is shown in Figure S1 in Supplementary Materials.
2. Methodology
A summary of the methodology steps as a flow diagram is shown in the Supplementary Materials (Figure S1).
2.1. Selection of Study Cities and Baseline Scenarios
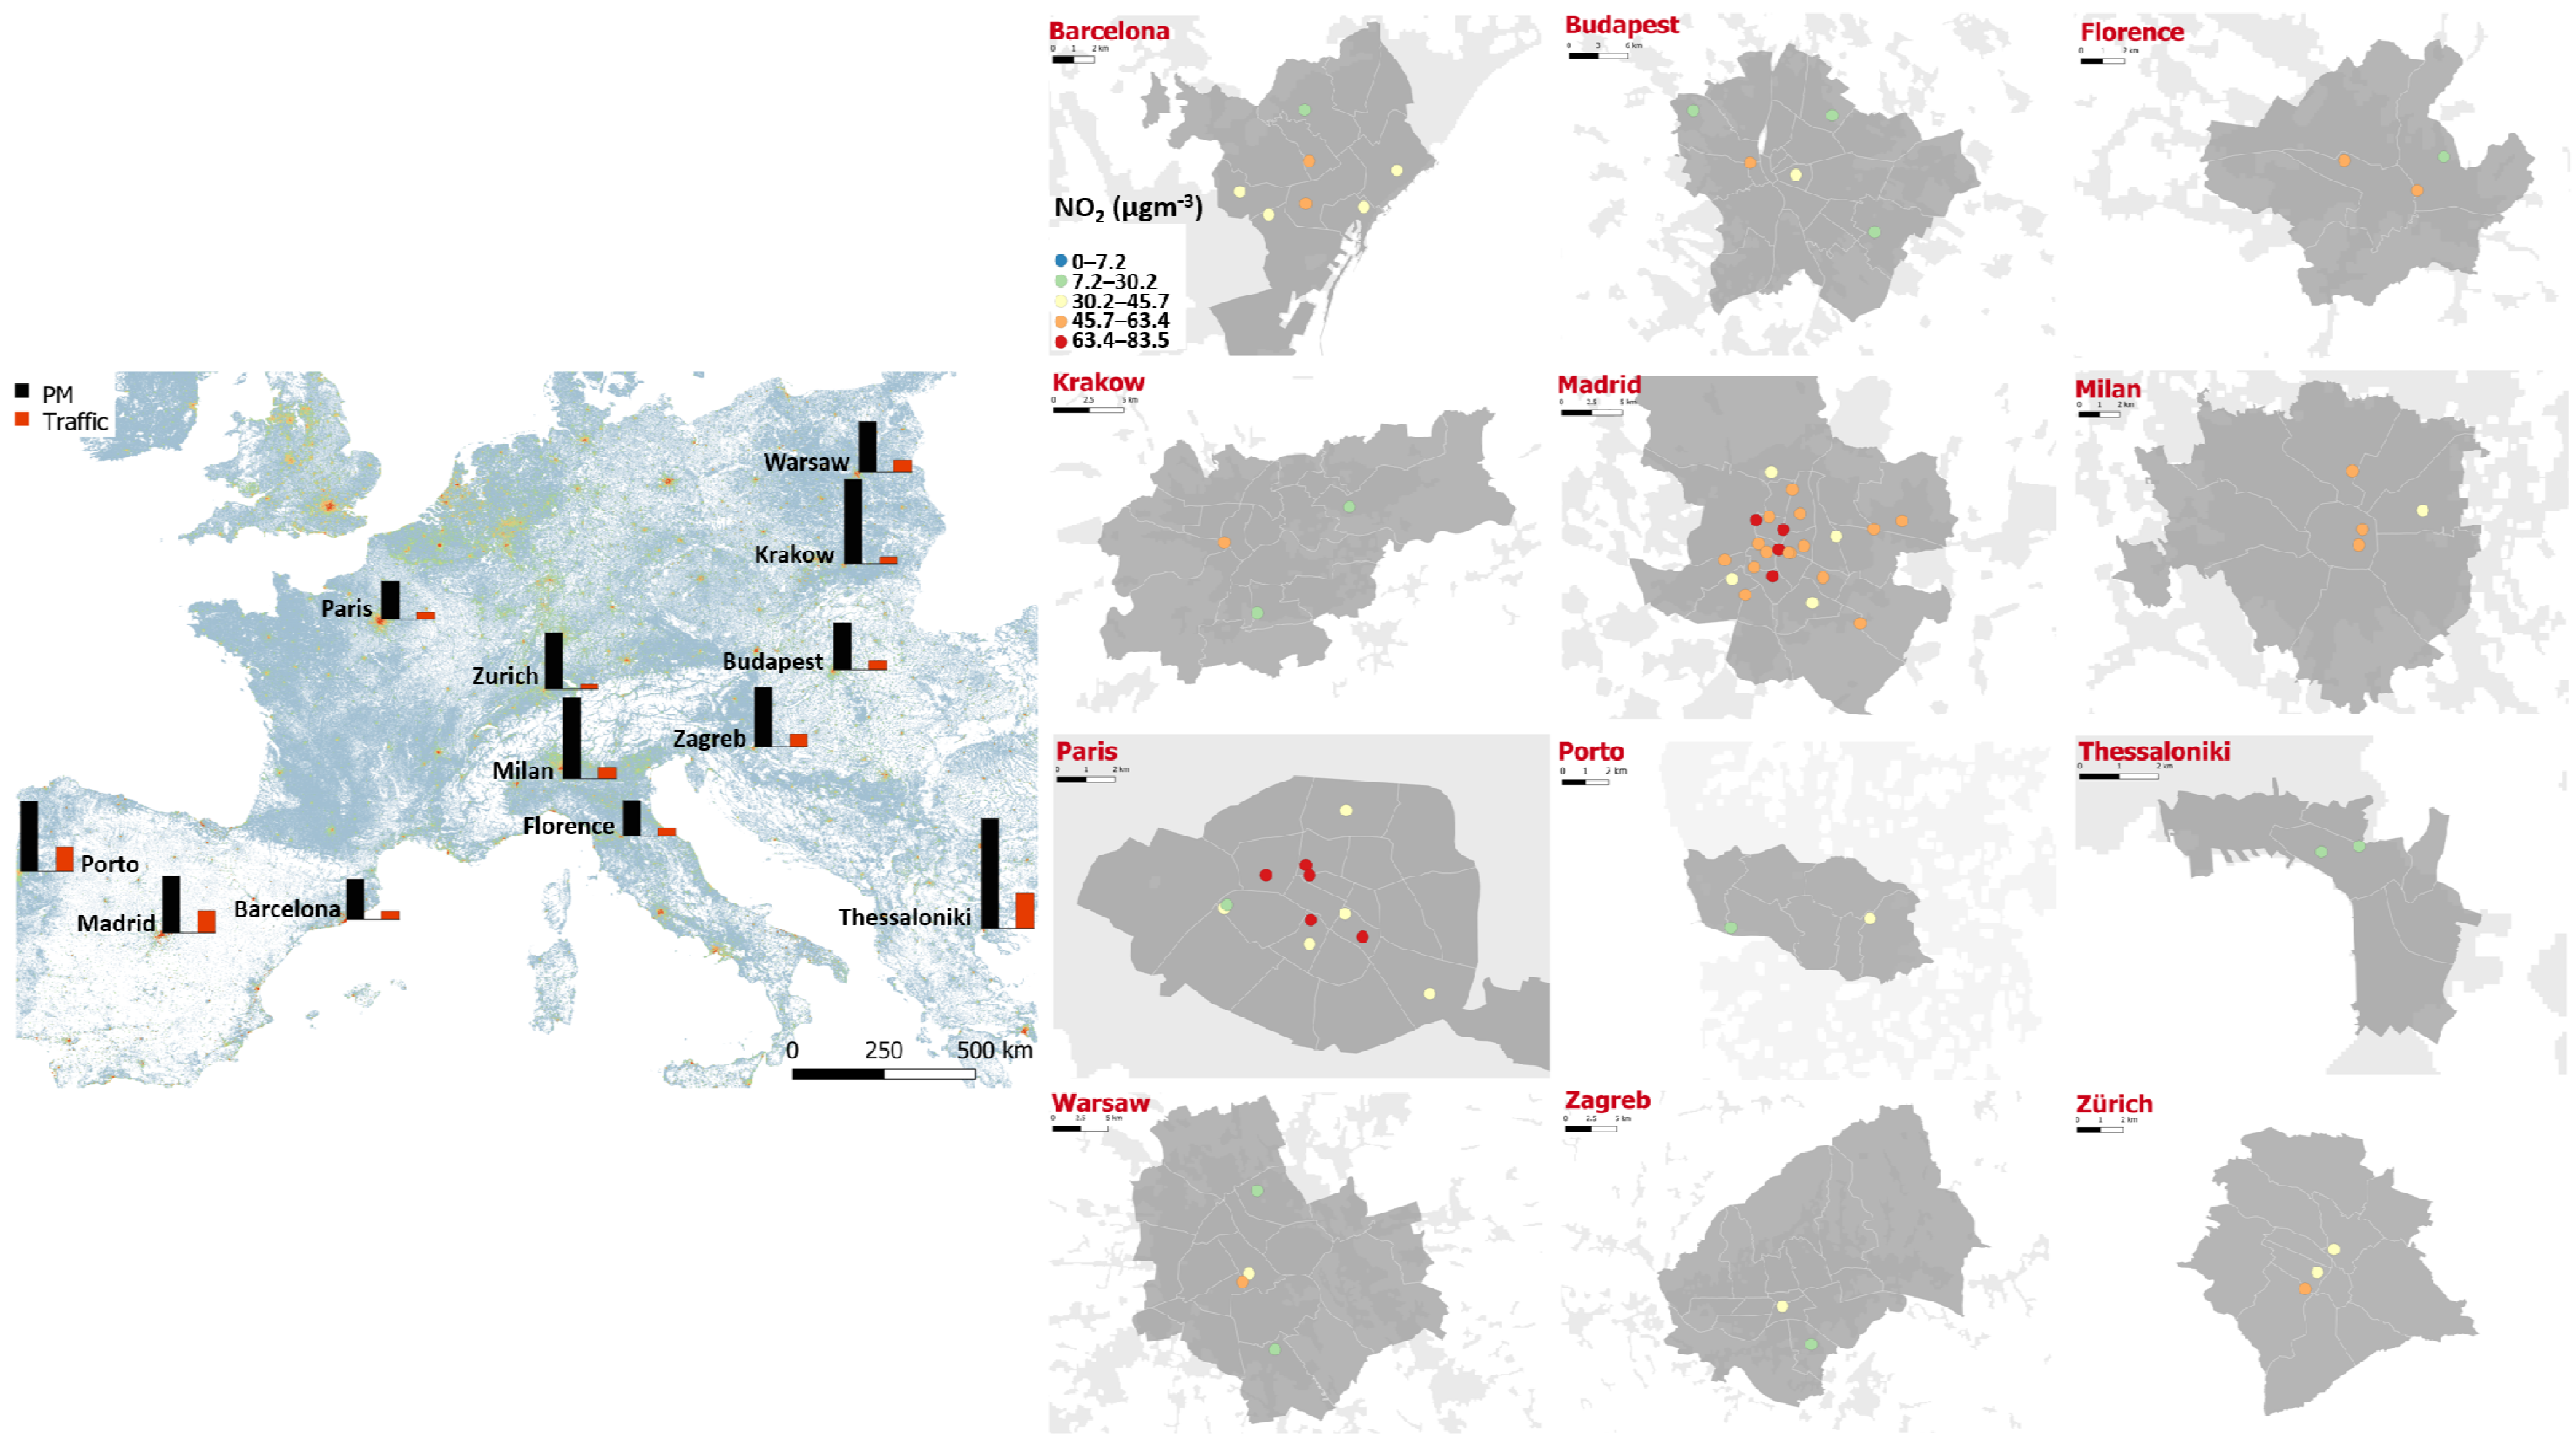
The analyses in this work focused on PM2.5 and NO2 as the main tracers of vehicular traffic in urban areas [8,48]. An extensive literature review was carried out to identify urban environments in Europe with published data on the contribution of road traffic emissions to PM2.5 (Figure 1 and Table 1). The initial review was based on that reported by the World Health Organization [49]. Cities where a comparable methodology was applied were selected for this study. This methodology should meet specific requirements, namely: (1) PM2.5 samples should have been collected using high volume samplers, and following the current standard protocols (EN 12341), (2) a representative number of samples should have been collected along at least one year, (3) a widely used and standardized source apportionment method, based on an extensive chemical database (major and trace inorganic compounds), should have been used to identify and quantify the contribution of traffic emissions, (4) all those studies reporting data prior to 2005 were discarded, due to a lower traffic contribution observed at a global level after that date, partly explained by more stringent environmental and exhaust regulations/policies (e.g., EURO-emission standards). The traffic contributions to PM2.5 obtained (Table 1) were considered as the baseline scenario, and as average contributions for the entire city given that the site typology was urban background (Table 1). The study period considered ranged between 2007 and 2016. Even though the emission and environmental conditions of the earlier studies in this period may not be representative of current scenarios, they were still considered relevant from the point of view of (methodological) comparability with more current studies. The source apportionment method in the studies selected is Positive Matrix Factorization (PMF). It should be mentioned that the chemical species included in the analyses differed across studies, and even though this should be considered a limitation, it was considered the best approximation possible. The absence of uncertainty estimates (e.g., bootstrapping), which is frequent in receptor modelling studies, should also be considered a limitation of this work. Despite this, targeting receptor modelling studies was estimated to facilitate comparability between studies due to the comparable sampling methodologies and the fact that most studies used the same receptor models for data processing [15]. The uncertainties of the alternative approach (i.e., dispersion models) are described in the literature [50,51,52,53].
Concentrations of NO2 for the study period, and for all the traffic and urban background stations in each city, were obtained from the European Environment Agency database [54]. These concentrations were considered as a second baseline scenario for comparisons. Annual mean concentrations for each station used in this study were calculated from daily concentrations (Figure 1).
These two baseline scenarios (traffic-related PM2.5 and NO2) represent an opportunity to compare different approaches to provide traffic impact estimations through a HIA model. One is based on a receptor model fed with an extensive chemical database, resulting in accurate quantification of the contribution; another is based on a tracer, without exact quantification of the traffic impact but with a commonly higher spatial coverage in urban air quality monitoring networks, together with a more distinct local pattern.

Table 1.
Summary of the traffic contributions to PM2.5 and PM2.5 concentrations in the cities selected.
Table 1.
Summary of the traffic contributions to PM2.5 and PM2.5 concentrations in the cities selected.
| Site Location | Population Estimate | Population Density | GDP (PPP) * | Latitude | Longitude | Site Typology | PM2.5 (µgm−3) | Source Apportionment Method | Reference Author | Reference Year | Study Year | Season | Traffic (%) | Traffic (µgm−3) |
|---|---|---|---|---|---|---|---|---|---|---|---|---|---|---|
| (Inhabitants km−2) | ||||||||||||||
| Barcelona (Spain) | 1,593,083 | 15,726 | 45,752 | 41.39 | 2.17 | urban | 15 | PMF | Amato et al. [55] | 2016 | 2013–2014 | year | 20.0 | 3.1 |
| Budapest (Hungary) | 1,757,618 | 3347 | 37,399 | 47.50 | 19.04 | urban | 17.4 | PMF | Perrone et al. [56] | 2018 | 2015 | year | 19.0 | 3.3 |
| Florence (Italy) | 370,292 | 3616 | 44,543 | 43.77 | 11.26 | urban | 13 | PMF | Amato et al. [55] | 2016 | 2013–2014 | year | 20.0 | 2.8 |
| Krakow (Poland) | 761,873 | 2330 | 29,695 | 50.06 | 19.94 | urban | 31 | PMF | Samek et a. [57] | 2017 | 2014–2015 | year | 8.3 | 2.6 |
| Madrid (Spain) | 3,172,867 | 5250 | 43,074 | 40.42 | −3.68 | urban | 21 | PMF | Salvador et al. [58] | 2011 | 2007–2008 | year | 39.0 | 8.1 |
| Milan (Italy) | 1,316,000 | 7239 | 51,768 | 45.46 | 9.19 | urban | 30 | PMF | Amato et al. [55] | 2016 | 2013–2014 | year | 14.0 | 4.3 |
| Paris (France) | 2,221,000 | 21,072 | 61,883 | 48.86 | 2.35 | urban | 14 | PMF | AIRPARIF/LSCE [59] | 2012 | 2009–2011 | year | 18.0 | 2.5 |
| Porto (Portugal) | 222,252 | 5366 | 24,819 | 41.15 | −8.61 | urban | 25.8 | PMF | Pio et al. [60] | 2020 | 2013–2014 | year | 36.0 | 9.2 |
| Thessaloniki (Greece) | 315,196 | 16,323 | 19,745 | 40.64 | 22.93 | urban | 40.5 | PMF | Saraga et al. [61] | 2019 | 2011–2012 | year | 32.0 | 13.0 |
| Warsaw (Poland) | 1,735,442 | 3355 | 49,722 | 52.23 | 21.01 | urban | 18.8 | PMF | Juda-Rezler et al. [62] | 2020 | 2016 | year | 24.2 | 4.6 |
| Zagreb (Croatia) | 791,946 | 1235 | 21,600 | 45.84 | 15.98 | urban | 21.9 | PMF | Perrone et al. [56] | 2018 | 2013 | year | 21.0 | 4.6 |
| Zurich (Switzerland) | 366,765 | 4173 | 64,302 | 47.38 | 8.53 | urban | 21 | PMF | Richard et al. [63] | 2011 | 2008–2009 | year | 9.0 | 1.9 |
* Gross Domestic Product (GDP) at purchasing power parity prices (PPP) per capita ($). Available at: https://statisticstimes.com/economy/european-countries-by-gdp-per-capita.php (accessed on 23 February 2022).
2.2. Intervention Scenarios
A literature review was carried out to select studies reporting reductions in traffic emissions linked to specific abatement measures, as a basis for establishing the intervention scenarios to be tested in this study by means of a HIA model. Detailed information can be found in the Supplementary Materials (Supporting Information SI1 and Table S1). The review accounts for studies published between 2009 and 2020 in peer-reviewed journals, based on research databases Scopus and ScienceDirect. The search terms included “abatement measures”, “traffic contribution” and “air quality”. The measures considered in this review comprise: (a) the creation of low emissions zones (LEZ), (b) long-term strategies to foster active transport mode, (c) spatial planning-redistribution of public space, (d) promotion of public transport, (e) traffic policies, and (f) technological improvements/roads management.
2.3. Population and Mortality Statistics
Statistics on population data were obtained from the JRC-GEOSTAT 2018 regular grid map of 1 × 1 km cells [64], which reports the number of residents for the year 2018 in Europe. Each sampling point was assigned geographic coordinates corresponding to its centroid, and the population grid was then overlapped using GIS software to calculate the number of residents for a circular buffer of 1 km around each monitoring site.
All-cause mortality was obtained from the official agencies in each country, as published by Eurostat [64], with data corresponding to 2018. Mortality incidence corresponds to all-cause mortality and all ages per city, so the same incidence was assigned to the different sampling points within a city. Default death rates were expressed at an annual time step and were scaled down to daily levels when needed, as described in Section 2.5.
2.4. Urban Indicators
For further information, a search for key indicators of the state of each city was carried out. The objective of this methodological step was to establish a potential tool to select the most promising traffic intervention approach for a specific urban environment. Data was exported in shapefile format, using Overpass turbo (overpass-turbo.eu; accessed on November 2021), a web-based data mining tool for OpenStreetMap, and analyzed using GIS software. Results are discussed in Section 3. The included indicators are: (1) mean daily traffic volume/total area of the city: as available in opentransportmap.info (accessed on November 2021), (2) kilometers of primary and secondary roads/kilometers of cycleways and footways: tagged in OpenStreetMap as highway: primary/secondary/cycleway/footway, (3) mean distance between primary roads and residential buildings: with residential buildings tagged as land use: residential, (4) percentage of green and outdoor leisure areas: tagged as land use: grass and leisure: park, (5) number of public transport stops/total area of the city: using the tags highway: bus_stop, railway: subway_entrance/tram_stop, (6) index of distribution of public transport stops: it was calculated applying the nearest neighbor index tool in GIS software to the location of public transport stops and interpreted as an indicator of good homogeneity of accessibility to public transport throughout the city, the larger it is, the better accessibility, and (7) implementation of low emission zones: using the tag boundary: low emission zone.
2.5. Health Impact Functions
Several studies link acute exposure to PM air pollution with premature mortality and morbidity, but questions remain about which species and sources in the vast PM mix are responsible for the health effects observed. Although a few studies exist on the effects of species and sources in U.S. cities [65], European cities—with a higher proportion of diesel engines and denser urban populations—have not been well characterized, with only a few examples available for short-term studies including sources or PM chemical components [45,66,67]. Similarly, the risks of long-term exposures are often based on ambient air pollution levels and on results from cohort studies, not including information on specific sources or chemical components [68].
The risk functions used in this work were all collected from the literature:
- For short-term exposures: Ostro et al. [45] for specific chemical components in PM2.5 related to traffic.
- For long-term exposures: Hoek et al. [68] for bulk PM2.5 mass, while Atkinson et al. [69] was used for NO2 concentrations. It is worth mentioning that the coefficients reported in Hoek et al. [68] are based on a meta-analysis of 13 cohort studies, and are recommended by the HRAPIE project [4]. Atkinson et al. [69] is a recent study that calculates meta-analytic summary estimates using fixed/random-effects models, based on 48 articles analyzing 28 cohorts, with a high proportion of them performed in Europe.
The health impact functions were calculated following a log-linear model (1). Risk ratios reported in this study were in the range of those reported in the literature [70,71,72,73,74,75,76,77,78].
where:
∆Y = YO (1 − e−ß∆PM) POP A*
- ß: mortality risk estimate
- Yo: baseline mortality rate
- POP: exposed population
- ∆Y: mortality change (change in the number of deaths expected per year)
- ∆PM: change in concentration
- A: 1/365
- *Applied when mortality risk ratios were obtained from short-term assessments
A summary of the epidemiological studies considered is reported in Table 2. It should be noted that when considering short-term effects, the incidence was multiplied by a correction factor (A) in order to scale an annual mortality rate to a daily rate, as specified in function (1).
2.6. Health Impact Assessment Model
BenMAP-CE is a US-EPA health benefits modelling tool, used to analyze air pollution intervention scenarios [79]. A number of studies have implemented this tool for a variety of air pollutants and based on different epidemiological studies, associating reductions in specific pollutants, mainly PMX and O3, with health impact reductions, including premature mortality, chronic bronchitis, and hospital admissions [26,80]. The standards that epidemiological and air pollution studies should meet to be applied in BenMAP are: (1) to use the concentrations of the considered parameter as primary exposure pollutant, (2) to cover the potentially exposed population, (3) to present appropriate model specifications (e.g., controlling for confounding pollutants), and (4) to be published in peer-reviewed journals.
The BenMap HIA was run for 12 European cities in this work, according to the information indicated in Section 2.1, Section 2.3 and Section 2.5. Thus, the model was run for two baseline scenarios: (a) mean traffic contribution to PM2.5 in each city for the whole corresponding study periods, and (b) mean NO2 concentrations for all the available measurement points within a city for the same periods. The benefit of selected traffic intervention scenarios was tested based on the literature review described in Section 2.2.
2.7. Methodological Limitations
The following aspects should be considered as limitations of this work: (a) the predominance of health-hazardous particle components is source and size-dependent, and hence when PM is treated as a bulk in HIA, the specific constituents potentially responsible for acute health outcomes may not be identified; (b) the NO2 monitoring locations within the cities ranged between traffic and urban background sites, and were considered representative of city-wide contributions for the purpose of comparison with population and health incidence statistics; (c) the source apportionment data spanned between years 2007 and 2016, and therefore different years were assessed for the different cities; (d) due to the different study years selected, different traffic mitigation strategies may have been in place in the different study locations and lower traffic contributions are expected to be found in several of the study locations, if the studies were repeated at the present time [8]; (e) spatial heterogeneity within a city was not considered in terms of mortality incidence due to data availability. All the datasets selected for this work were acquired from free Open Data Sources.
3. Results
3.1. Review of Mitigation Strategies
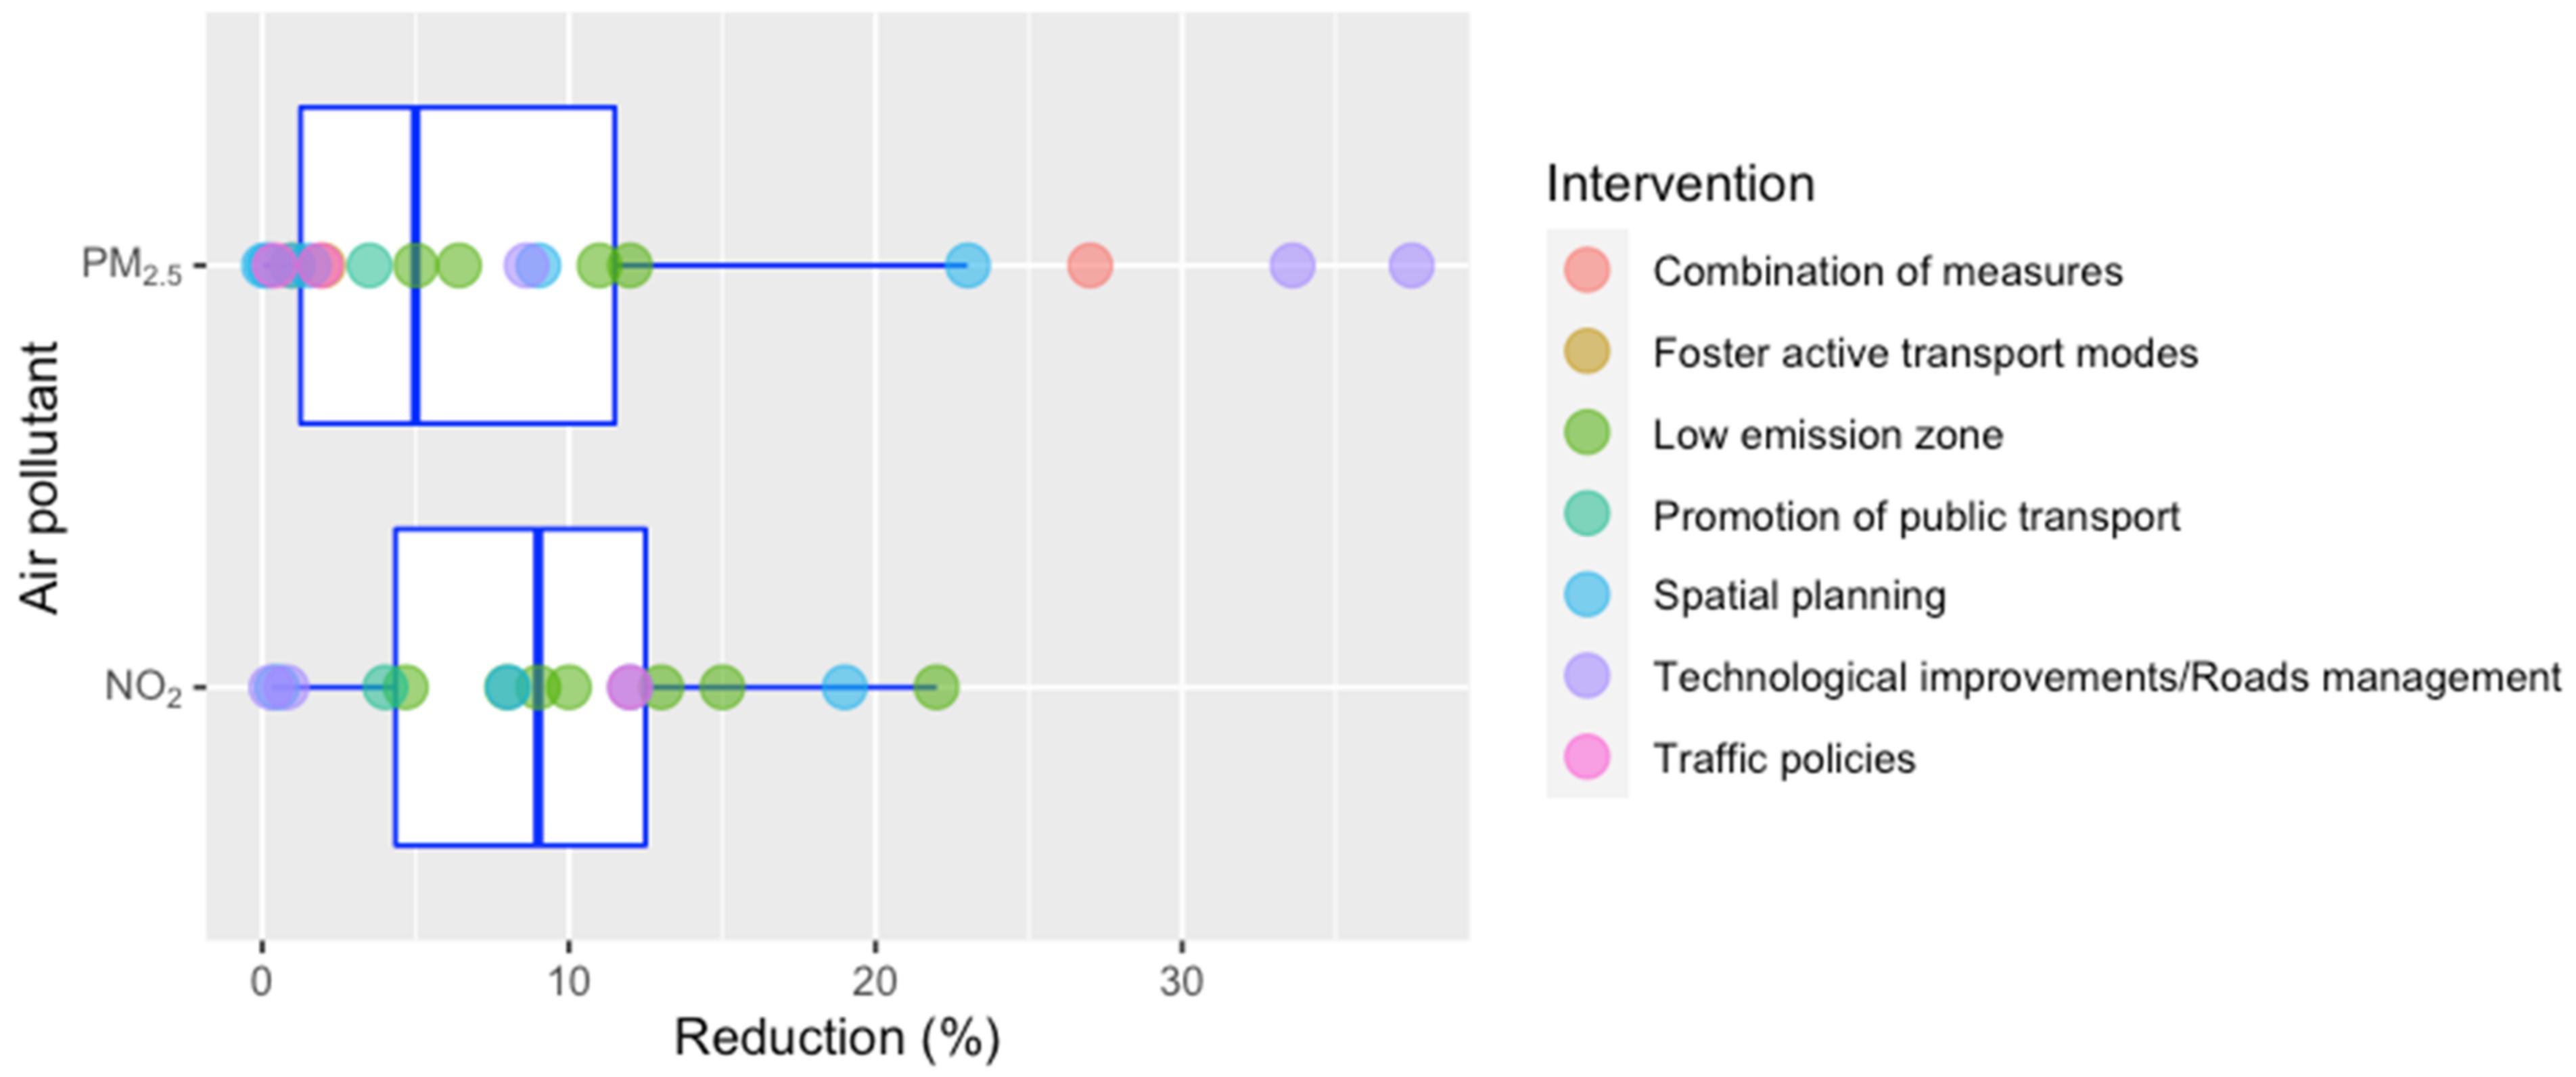
Table S1 shows the results of the literature review of studies on mitigation strategies targeting traffic emissions. 40 studies were finally selected. The abatement measures considered showed reductions in PM2.5 ranging between 0.05% [32] (associated with PM removal by trees) and 38% [13] (implementation of diesel particle filters). In the case of NO2 concentrations, reductions ranged between 0.3% [81] (replacement of non-electric vehicles with electric ones) and 22% [82] (LEZ). Figure 2 shows a graphical summary of all the results considered in this review as box plots, indicating high variability of values, even for measures in the same category. In view of this, percentages corresponding to median, 25th and 75th percentile values were selected as intervention scenarios, assuming that they could be reasonably achieved by several of the approaches discussed in this section. This means reductions of 1.5 (25th percentile), 5 (median) and 11.5% (75th percentile) for PM2.5, which would correspond to estimated reductions of the PM2.5 traffic contribution of 6, 22 and 50%, respectively, according to mean contributions reported in Table 1. In the case of NO2, the selected intervention scenarios correspond to percentages of 4 (25th percentile), 9 (median) and 12.5% (75th percentile). In spite of the associated uncertainty of this selected reduction, it was considered that this is a reasonable threshold that could offer key information and encourage stakeholders to act on vehicular traffic management.
In Supplementary Materials Table S2 summarizes the traffic-related air pollution abatement measures reviewed and already implemented in some European cities, with good performance. The effectiveness of ongoing measures such as the installation of electric vehicle charging stations, or ecological distinctive to classify vehicles according to their emissions, still has to be assessed in the long term. Special efforts to reduce traffic emissions have been made the last decade, including intensive street cleaning, the age-based limit for taxis and public transport, low emission zones, planting of trees, reducing unnecessary engine idling of vehicles and school buses, charging flat rates to enter central areas, or bike-sharing programs, among others. The extension of these efficient measures should be encouraged.
3.2. City Characteristics
The interpretation of the HIA requires contextualizing relevant parameters that characterize each city, such as population density or land uses, among others. These parameters are also relevant for identifying those aspects that pollution abatement measures should target. In spite of the complexity of urban areas, interventions at the community level, such as urban and transport planning, have been demonstrated to be promising to improve environmental factors in a cost-effective way, and in many cities, there is still scope for further improvement in environmental quality through assessment of targeted indicators [83]. Thus, this section aims to understand the potential link between sustainable urban practices and reductions in traffic emissions, by assessing existing case studies where the characteristics described in Section 2.4 are relevant.
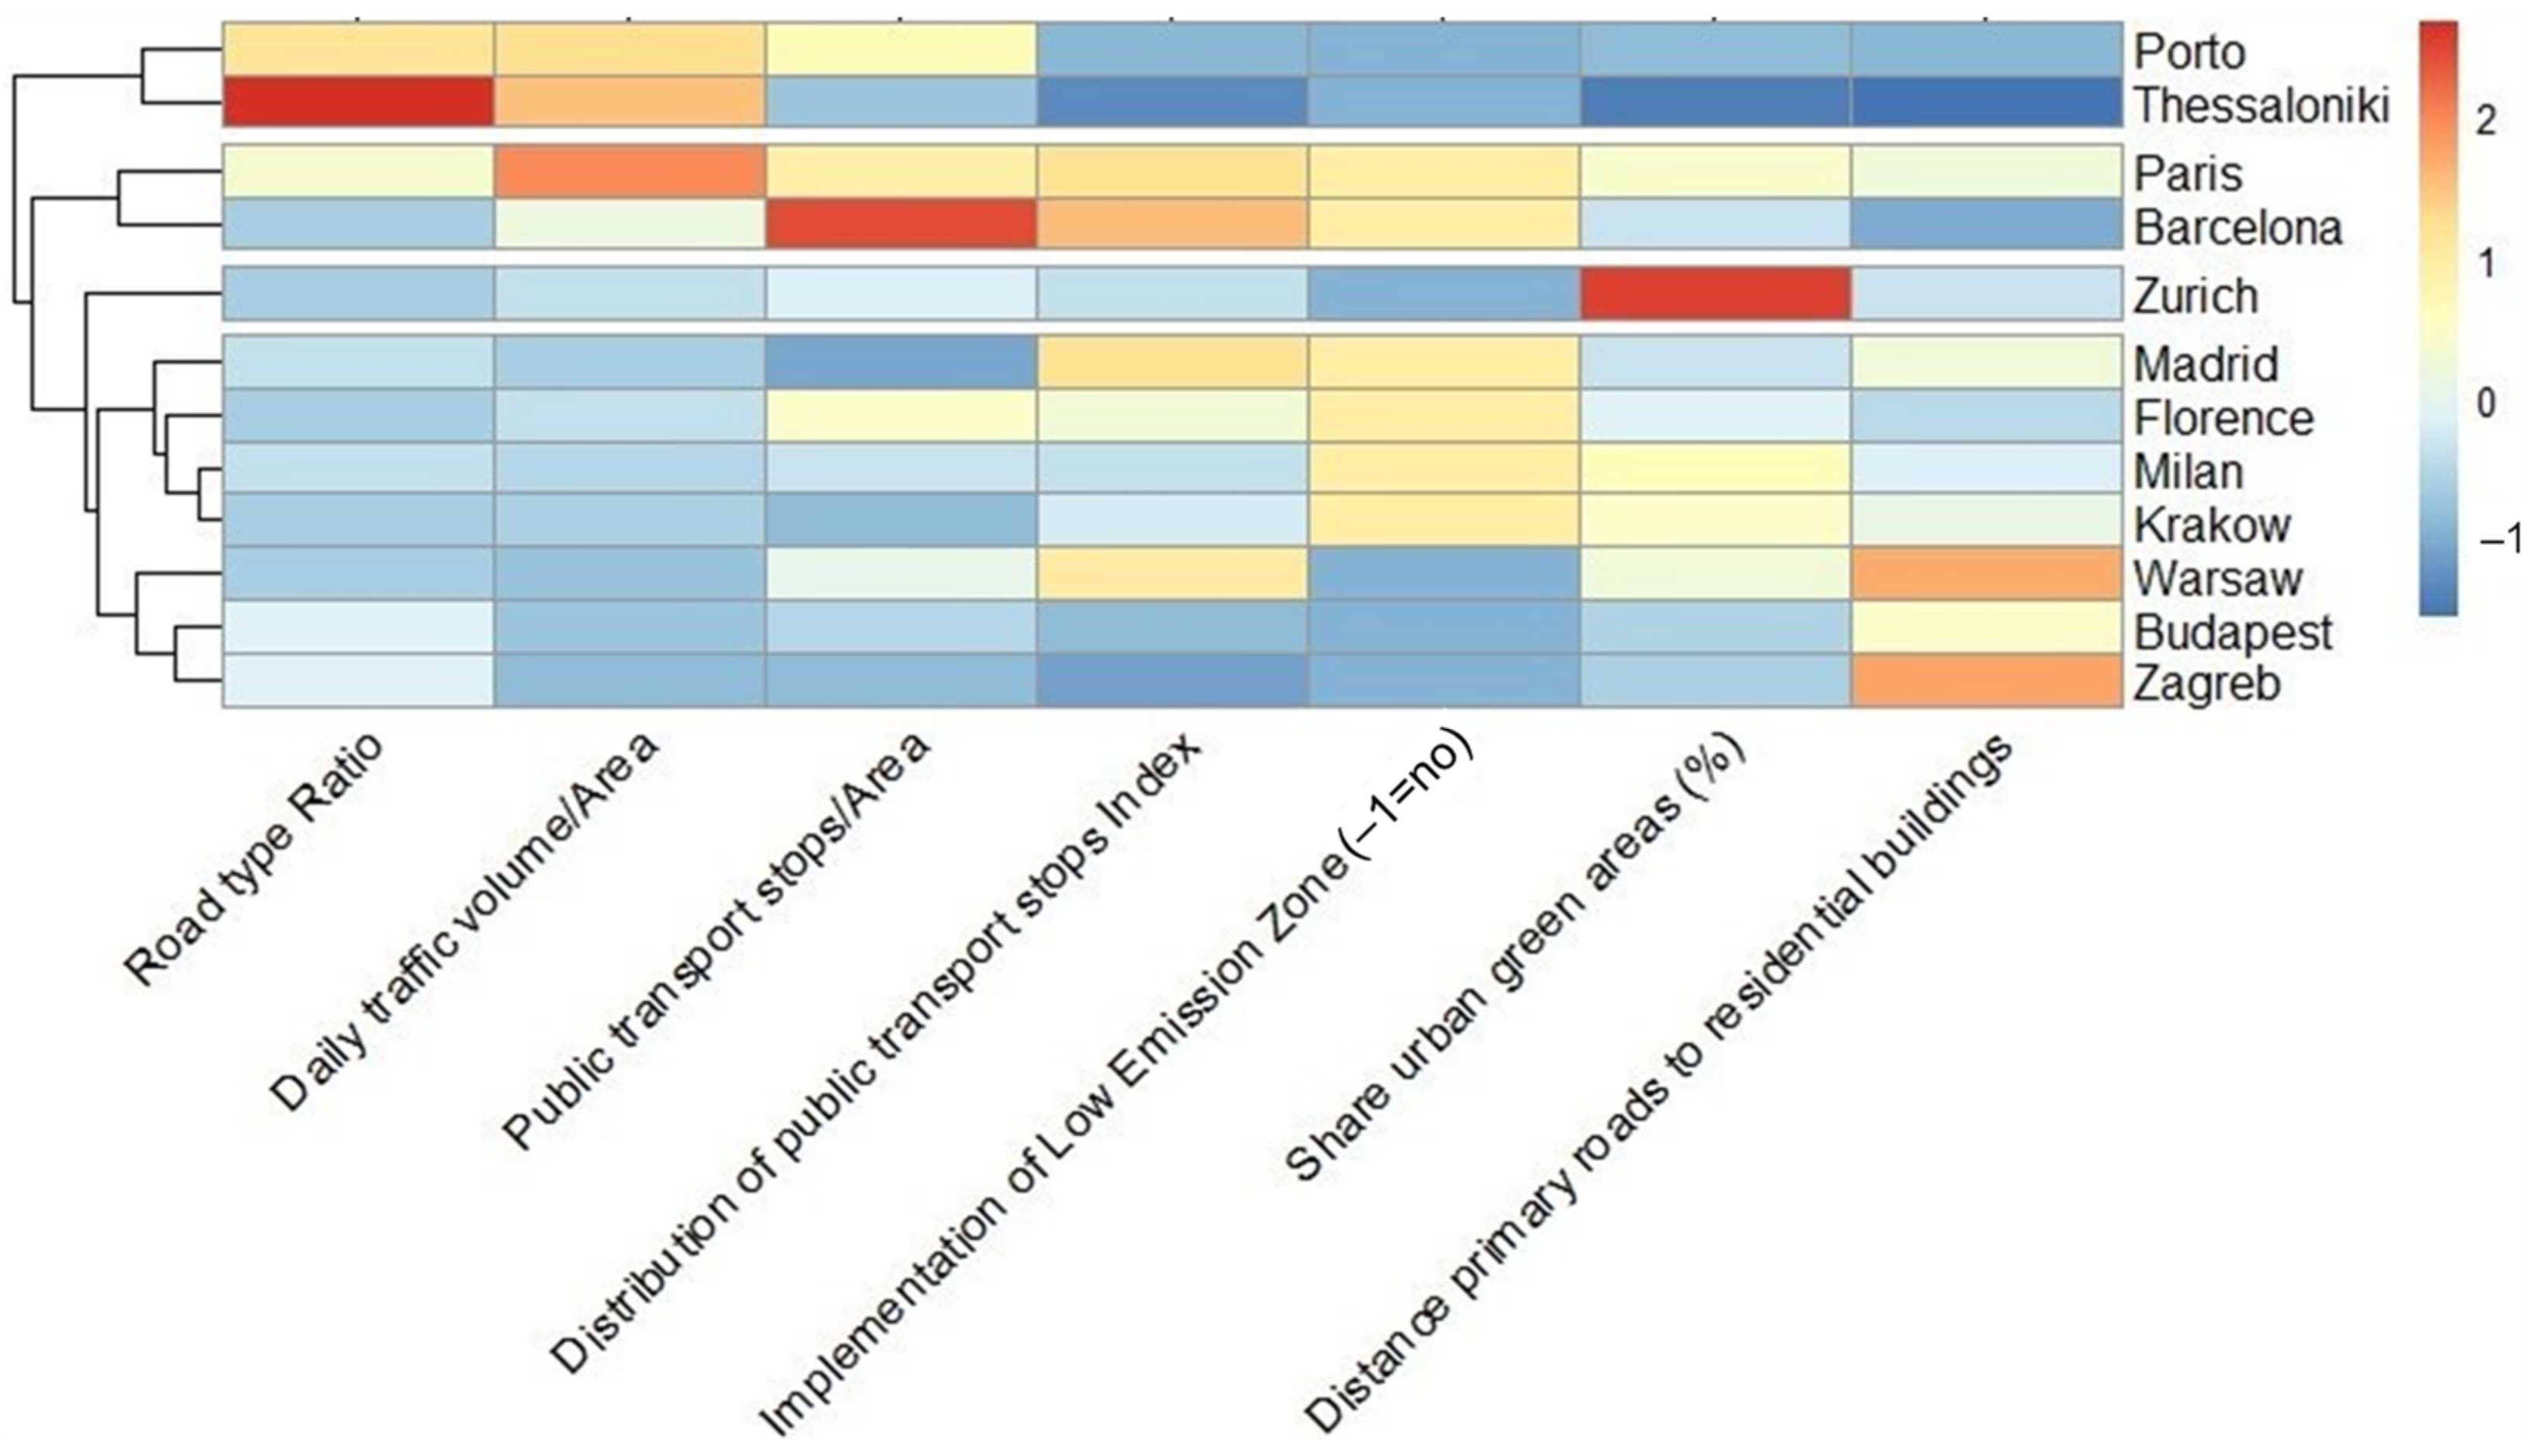
Population densities in the selected cities show great variability (Table 1), ranging from 1235 to 21,072 inh km−2, with the lowest values corresponding to Zagreb, Krakow and Budapest, and the highest to Paris, Barcelona and Thessaloniki. Figure S2 shows the boxplots of the distribution of different indicators in the selected cities, considered relevant from an air quality perspective, and thus directly related to the previous described air pollution mitigation strategies. The indicators with higher differences between cities, with a wide distribution of values, are the mean daily traffic volume/area, the number of public transport stops/area, and the percentage of green and outdoor leisure areas, in the range of 1.3–42.7, 1.3–25.8 and 5–27%, respectively. The ratio of kilometers of primary and secondary roads/kilometers of cycleways and footways is the one showing the narrowest distribution, ranging between 0.1–1.4, while the mean distance between primary roads and residential buildings throughout each city comprises values between 1.9 and 11.3 km. A classification of the selected cities based on these indicators has been attempted, using hierarchical clustering as a statistical approach. Results have been represented as a heatmap for easy interpretation, where data values have been transformed into a color scale (Figure 3). This method allows the distinguishing of cities with common strengths/weaknesses, which could in turn be useful to provide recommendations on urban planning and traffic policies, with demonstrated effects on air quality and pollutants exposure. When focusing on the relative weak aspects of the different cities, Paris, Barcelona, Porto and Thessaloniki stand out with the comparatively highest daily traffic volume/area and/or ratio of kilometers of primary and secondary roads/kilometers of cycleways and footways. Barcelona, Porto and Thessaloniki also show the shortest distances between primary roads and residential buildings. On the other hand, Krakow, Zagreb and Budapest combine a relatively low number of public transport stops/area with a heterogeneous distribution throughout the city. Porto and Thessaloniki account for the lowest percentage of green and outdoor leisure areas, and Porto, Thessaloniki, Warsaw, Zagreb, Zurich and Budapest lack LEZ. A remarkable pattern is that cities with the most heterogeneous distribution of public transport stops are also those with the highest ratio of kilometers of primary and secondary roads/kilometers of cycleways and footways, highlighting the need in these cities for more sustainable mobility management. According to the studies previously discussed in Section 3.1, measures to improve these indicators would mean reducing NO2 concentrations by up to 22% and PM2.5 concentrations by up to 38%.
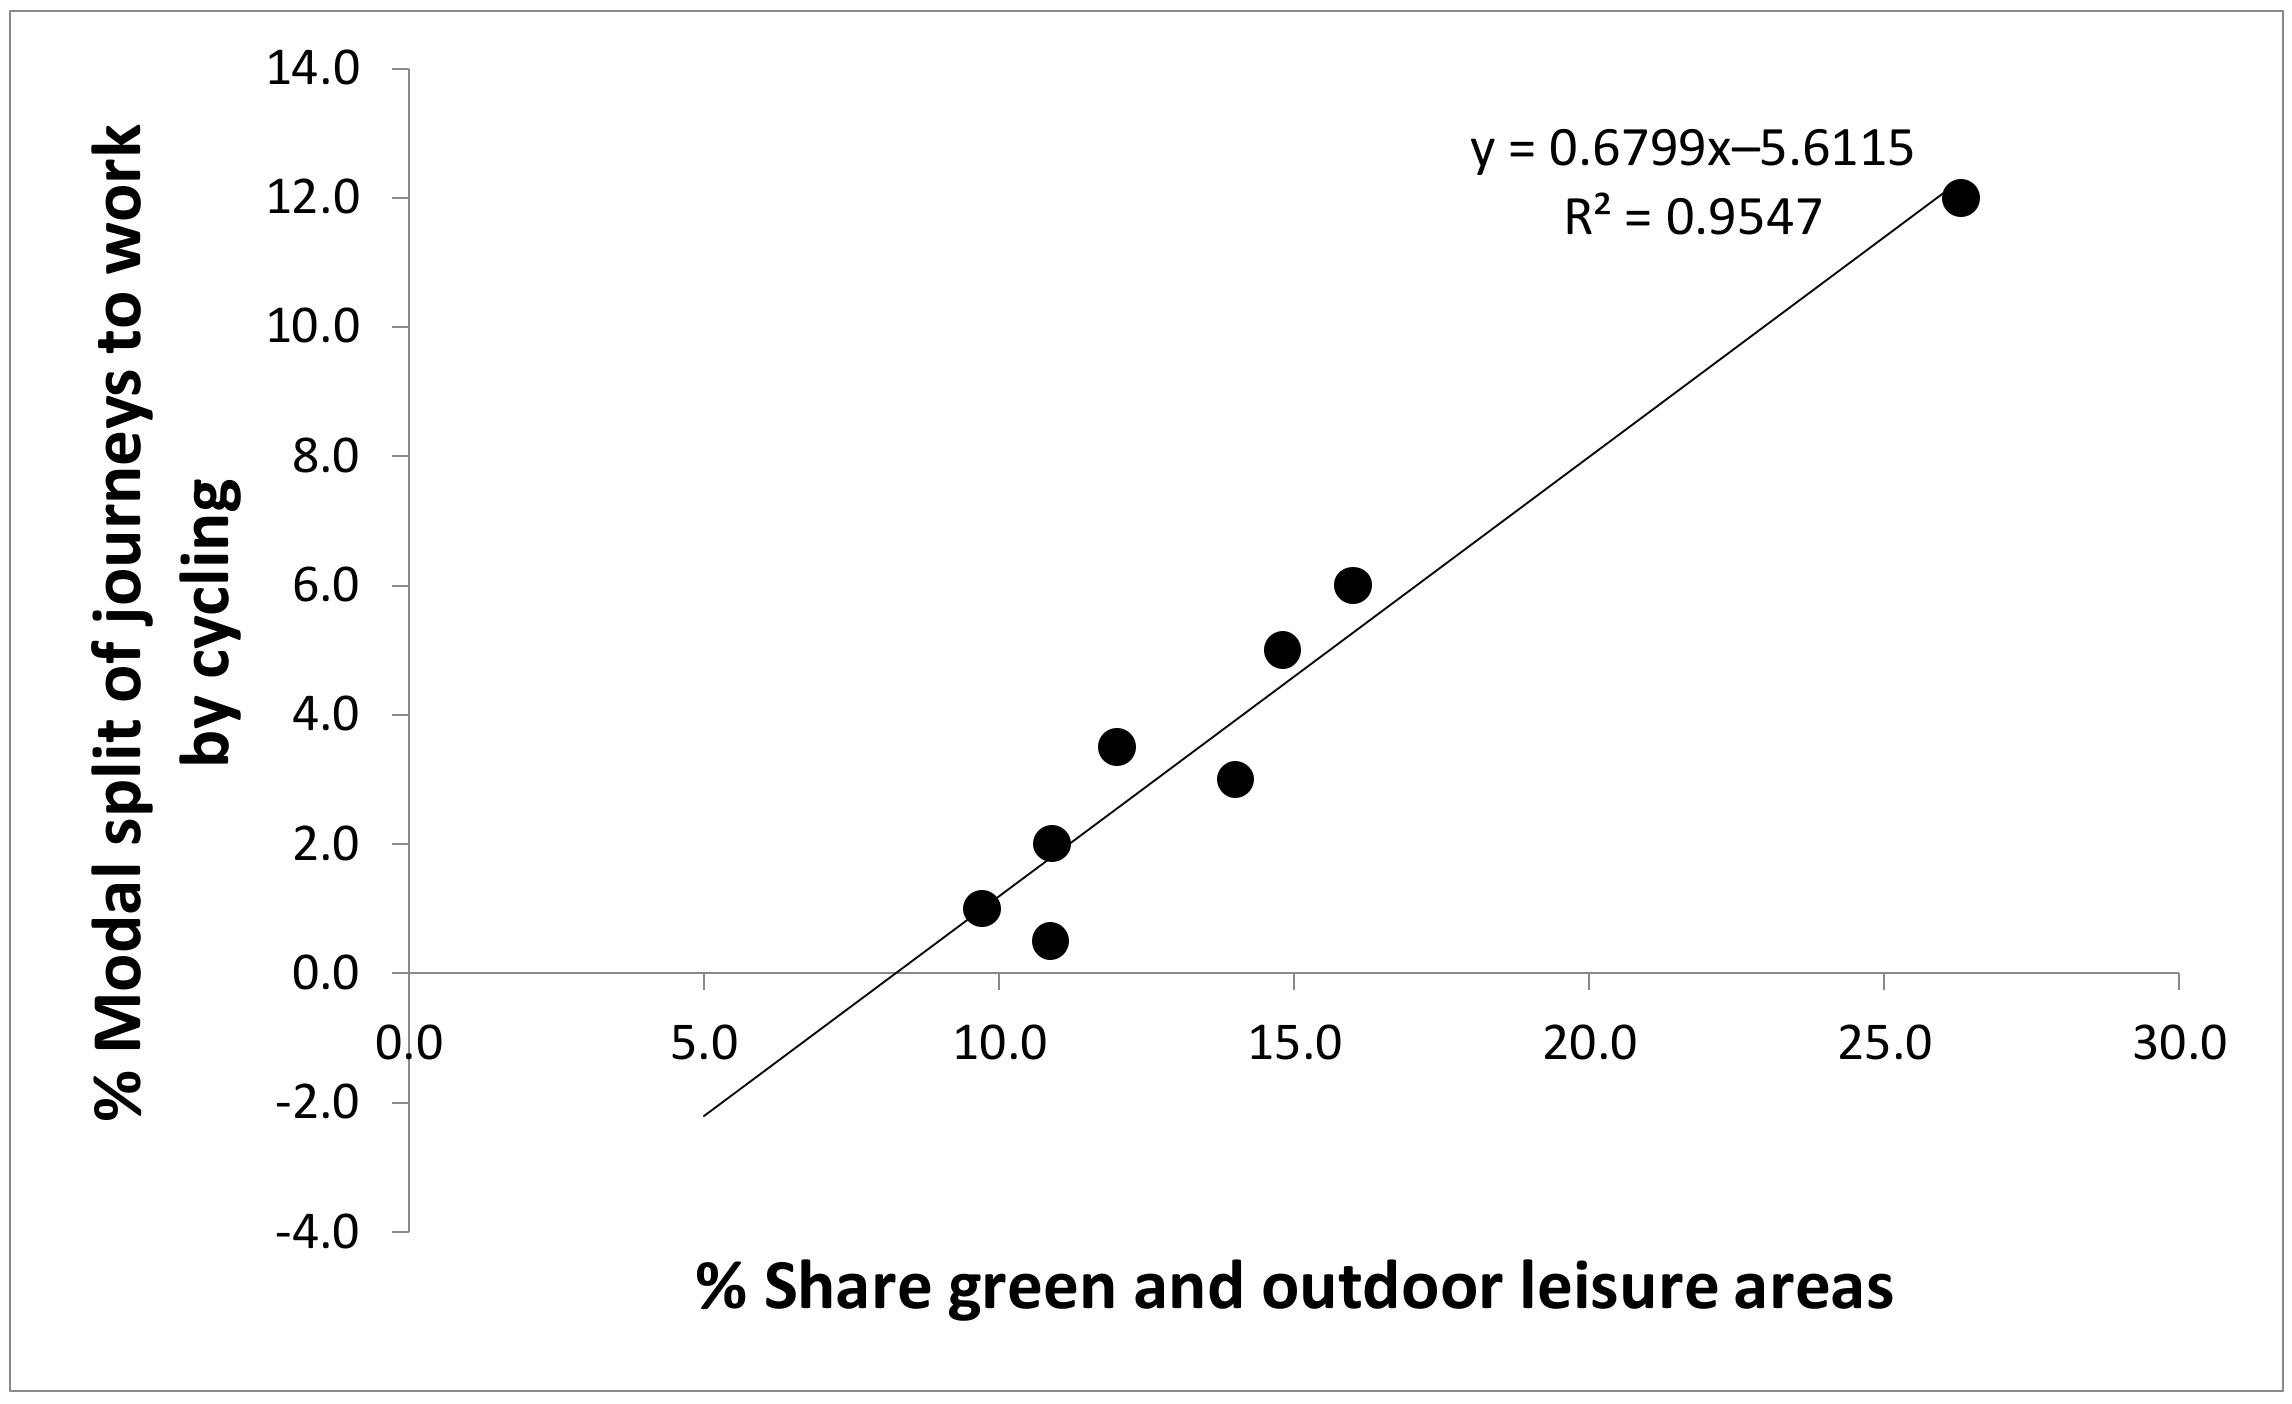
Conversely, some positive aspects should be also highlighted, such as the relatively high number of public transport stops, with a homogeneous distribution, as a proxy of accessibility, in Paris and Barcelona, as well as the relatively high percentage of green and outdoor leisure areas in Zurich, Paris, Milan, Krakow and Warsaw. This percentage shows good agreement with the data available on the percentage of share of journeys to work by bicycle, as reported by Eurostat [64]. Information on commuting modes was available for 8 of the 12 selected cities, and the coefficient of determination between the two referred indicators was >0.90 (p-value < 0.001; Figure 4). This seems to point out that promoting the perception of green routes is fundamental to tapping into the existing potential of active transport modes.
Relationships between the city indicators described and the corresponding mean concentrations of NO2 and PM2.5 traffic contribution will be discussed in the following section.
On the other hand, although it is outside the scope of this work, it is worth mentioning that the socioeconomic sector can play a very important role during the urbanization process of a city and, thus, in the transportation plans. Previous studies suggest that good sustainability performance during urbanization is characterized by several indicators such as a high GDP level and stable economic condition [84,85]. Figure S3 shows a correlation matrix of GDP (PPP) in the selected cities against the described city characteristics. GDP (PPP) seems to partly determine the percentage of green and outdoor leisure areas and also the considered public transport indicators. Further research on how inequalities bear on sustainability should be addressed as an environmental challenge.
3.3. Road Traffic Contributions to PM2.5 and NO2 Concentrations
PM2.5 source contributions reported in the literature for the different cities are shown in Figure 1 and Figure S4 (references in Table 1). A total of 9 studies was finally selected out of 38 works reviewed. Causes for rejection were: (1) reported data was collected prior to 2005, (2) no clear information of total PM2.5 concentrations was available, (3) the chemical composition of the traffic source was not clearly described, and/or (4) mortality statistics were not available for the corresponding city. For better comparability, source classification was unified as traffic, sea salt, dust, industry, and biomass burning/residential, with the rest of the mass being considered as “Others + Unaccounted”. Traffic-PM2.5 concentrations refer to annual averages comprising from 1 to 3 years and spanning across the period 2007–2016.
The traffic contribution to PM2.5 concentrations in the selected cities ranged between 1.9 and 13 µgm−3, representing relative contributions of 8.3–39%. Concentrations of this source show a moderate negative linear relationship against the mean percentage of green and outdoor leisure areas at each city (Pearson’s r = 0.66; R2 = 0.44; p-value < 0.05; Figure S5). Traffic was the main source of PM2.5 in most of the cities, except in Zagreb, Warsaw, Milan and Budapest, with a high contribution of biomass burning/residential heating. In Budapest and Zurich, the contribution of the dust source was also higher than that reported for traffic. Bulk PM2.5 concentrations showed high variability, ranging between 13 and 40.5 µgm−3. The highest concentrations were recorded in Thessaloniki (40.5 µgm−3), followed by Krakow (31 µgm−3), and Milan (30 µgm−3). According to the present categorization, the highest PM2.5 percentage of unaccounted mass was reported in Zurich. As reported in Section 2.6, it should be noted that traffic contributions, NO2 and PM mass concentrations may be significantly different at present.
Concentrations of NO2 for the same periods, and for all the traffic and urban background stations in each city, were obtained from the European Environment Agency database [54]. Mean concentrations ranged between 18 and 56 µgm−3 (2.5th percentile: 17; 97.5th percentile: 84), with the highest mean concentrations reported for Madrid (56 µgm−3), followed by Milan (53 µgm−3), and Paris (43 µgm−3). Mean NO2 concentrations at each city did not show agreement with the corresponding PM2.5 traffic concentrations, which could be due to: (a) the presence of other sources probably affecting NO2 concentrations, such as industrial emissions, (b) mean NO2 concentrations were calculated considering both, traffic and urban background measurement sites, and/or (c) a more distinct local pattern of NO2 compared to PM2.5. This more marked local influence could be evidenced by the significant linear relationship of mean NO2 concentrations at each sampling site and the mean distance of each site to the primary roads of the city (R2 = 0.36, p-value < 0.001; Figure S6). This relationship was not significant when considering PM2.5 traffic contributions at the different monitoring stations (Figure S6). Thus, the NO2 concentrations considered, with a higher number of sampling points, seem able to better trace the complex urban-scale air pollution.
3.4. Health Impact Assessment
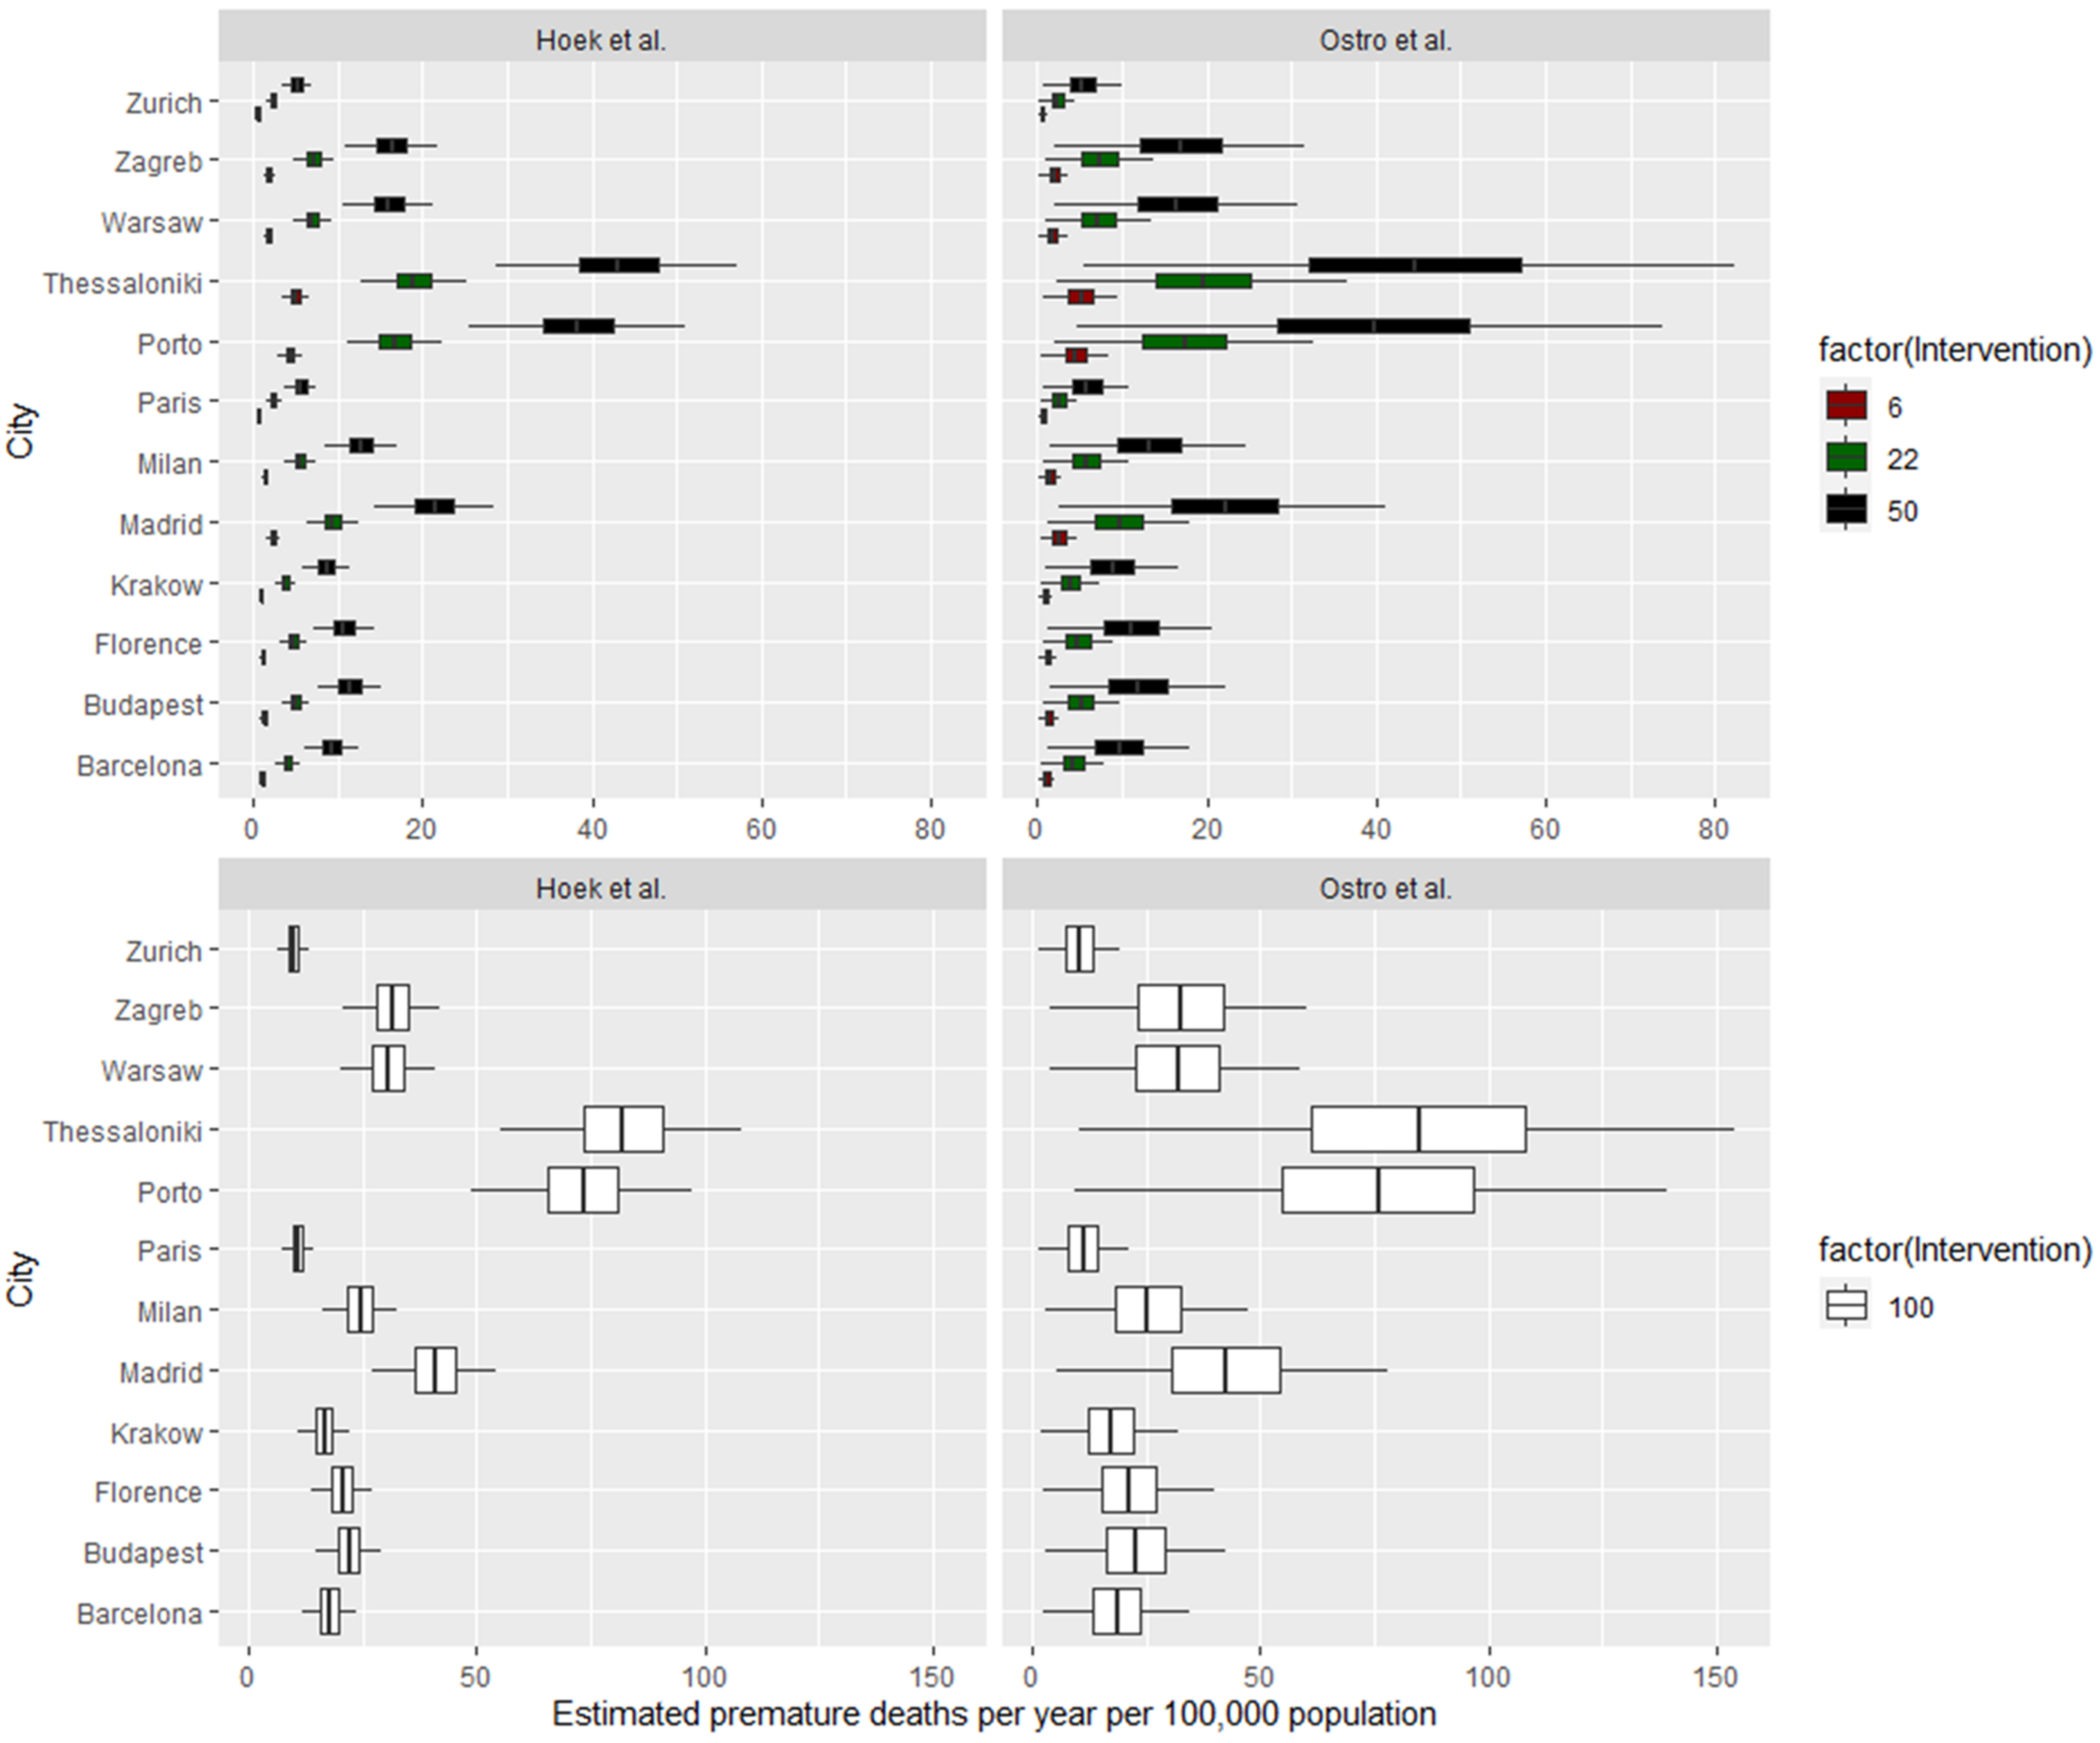
Figure 5 and Figure 6 summarize the HIA findings in terms of estimated premature mortality per year and per 100,000 inhabitants, in the intervention and baseline/control scenarios, for long- and short-term exposures. The intervention scenario simulated 4–50% reductions in traffic contributions, as estimated in Section 3.1.
Long and short-term health impacts and potential reductions of traffic-derived PM2.5 concentrations.
Health impacts from traffic were estimated using the Hoek et al. [68] risk estimates, obtained from an extensive review of epidemiological studies on long-term exposure to bulk fine and coarse particles. The risk estimates from Ostro et al. [45] were used for comparison and to assess the sensitivity of the HIA model, given that Ostro et al. [45] reports risk estimates for short-term exposure specifically to traffic-derived PM2.5.
Using the source-specific risk estimates from Ostro et al. [45], short-term exposure to traffic emissions (baseline/control scenario) accounted for 10–90 (CI: 4–150) premature deaths per 100,000 inhabitants, annually. Similarly, when the risk ratio for long-term exposure to bulk PM2.5 was used [68] the results were 10–85 (CI: 7–108) premature deaths due to traffic. Thus, significant differences between long-term and short-term estimates were not observed, due to the fact that health impacts were estimated for bulk PM2.5 for long-term exposures, as opposed to traffic-related PM2.5 for short-term exposures. The estimated health impacts using source-specific risk ratios were expected to be higher than those for bulk PM2.5, given the differential toxicity of traffic aerosols (containing mostly black carbon and organic aerosols) when compared to bulk PM2.5 (a mix of chemical components including mineral matter and inorganic salts). In relative terms, the premature mortality due to exposure to traffic-PM2.5 accounted for between 0.9% and 8.2% of the baseline mortality (due to all causes), with an average of 3.5%.
When analyzing the data spatially, the highest impacts estimated were obtained for Thessaloniki and Porto (with >80 premature deaths/year per 100,000 inhabitants due to traffic emissions in each city, based on Ostro et al. [45]), and the lowest for Zurich, Krakow and Paris (with <15 premature deaths/year per 100,000 inhabitants in each city). A negative correlation between latitude and avoidable premature mortality can be deduced, with higher numbers in the south of Europe, regardless of the measurement year, highlighting the special need for effective actions to decrease traffic emissions in these cities. The negative correlation found between the concentrations of the traffic contributions to PM2.5 and the mean percentage of green and outdoor leisure areas may be seen as an opportunity to incentivize more sustainable land use management.
The intervention scenario was set to a range of 6–50% reduction in traffic-derived PM2.5 concentrations, according to the described literature review (Section 3.1). Given that the mean annual traffic-PM2.5 in the baseline scenarios in the different cities ranged between 1.9 and 13 µg/m3, the proposed reductions would range between 0.1–6.5 µg/m3 in the mean annual traffic-PM2.5 concentrations. If the maximum proposed reduction in traffic-PM2.5 were achieved in the different cities, by implementing measures such as those reported in Table S1, the premature mortality avoided per year could range between 5–48 per 100,000 inhabitants (CI: 1–72), according to Ostro et al. [45], and between 5–44 per 100,000 inhabitants (CI: 1–54), according to Hoek et al. [68] (Figure 5). This would account for a 1.7% reduction in premature mortality on average. Given that traffic contributions accounted on average for 3.5% of the baseline mortality, a 1.7% improvement could seem adequate; however, more ambitious targets should probably be set when aiming to significantly improve public health.
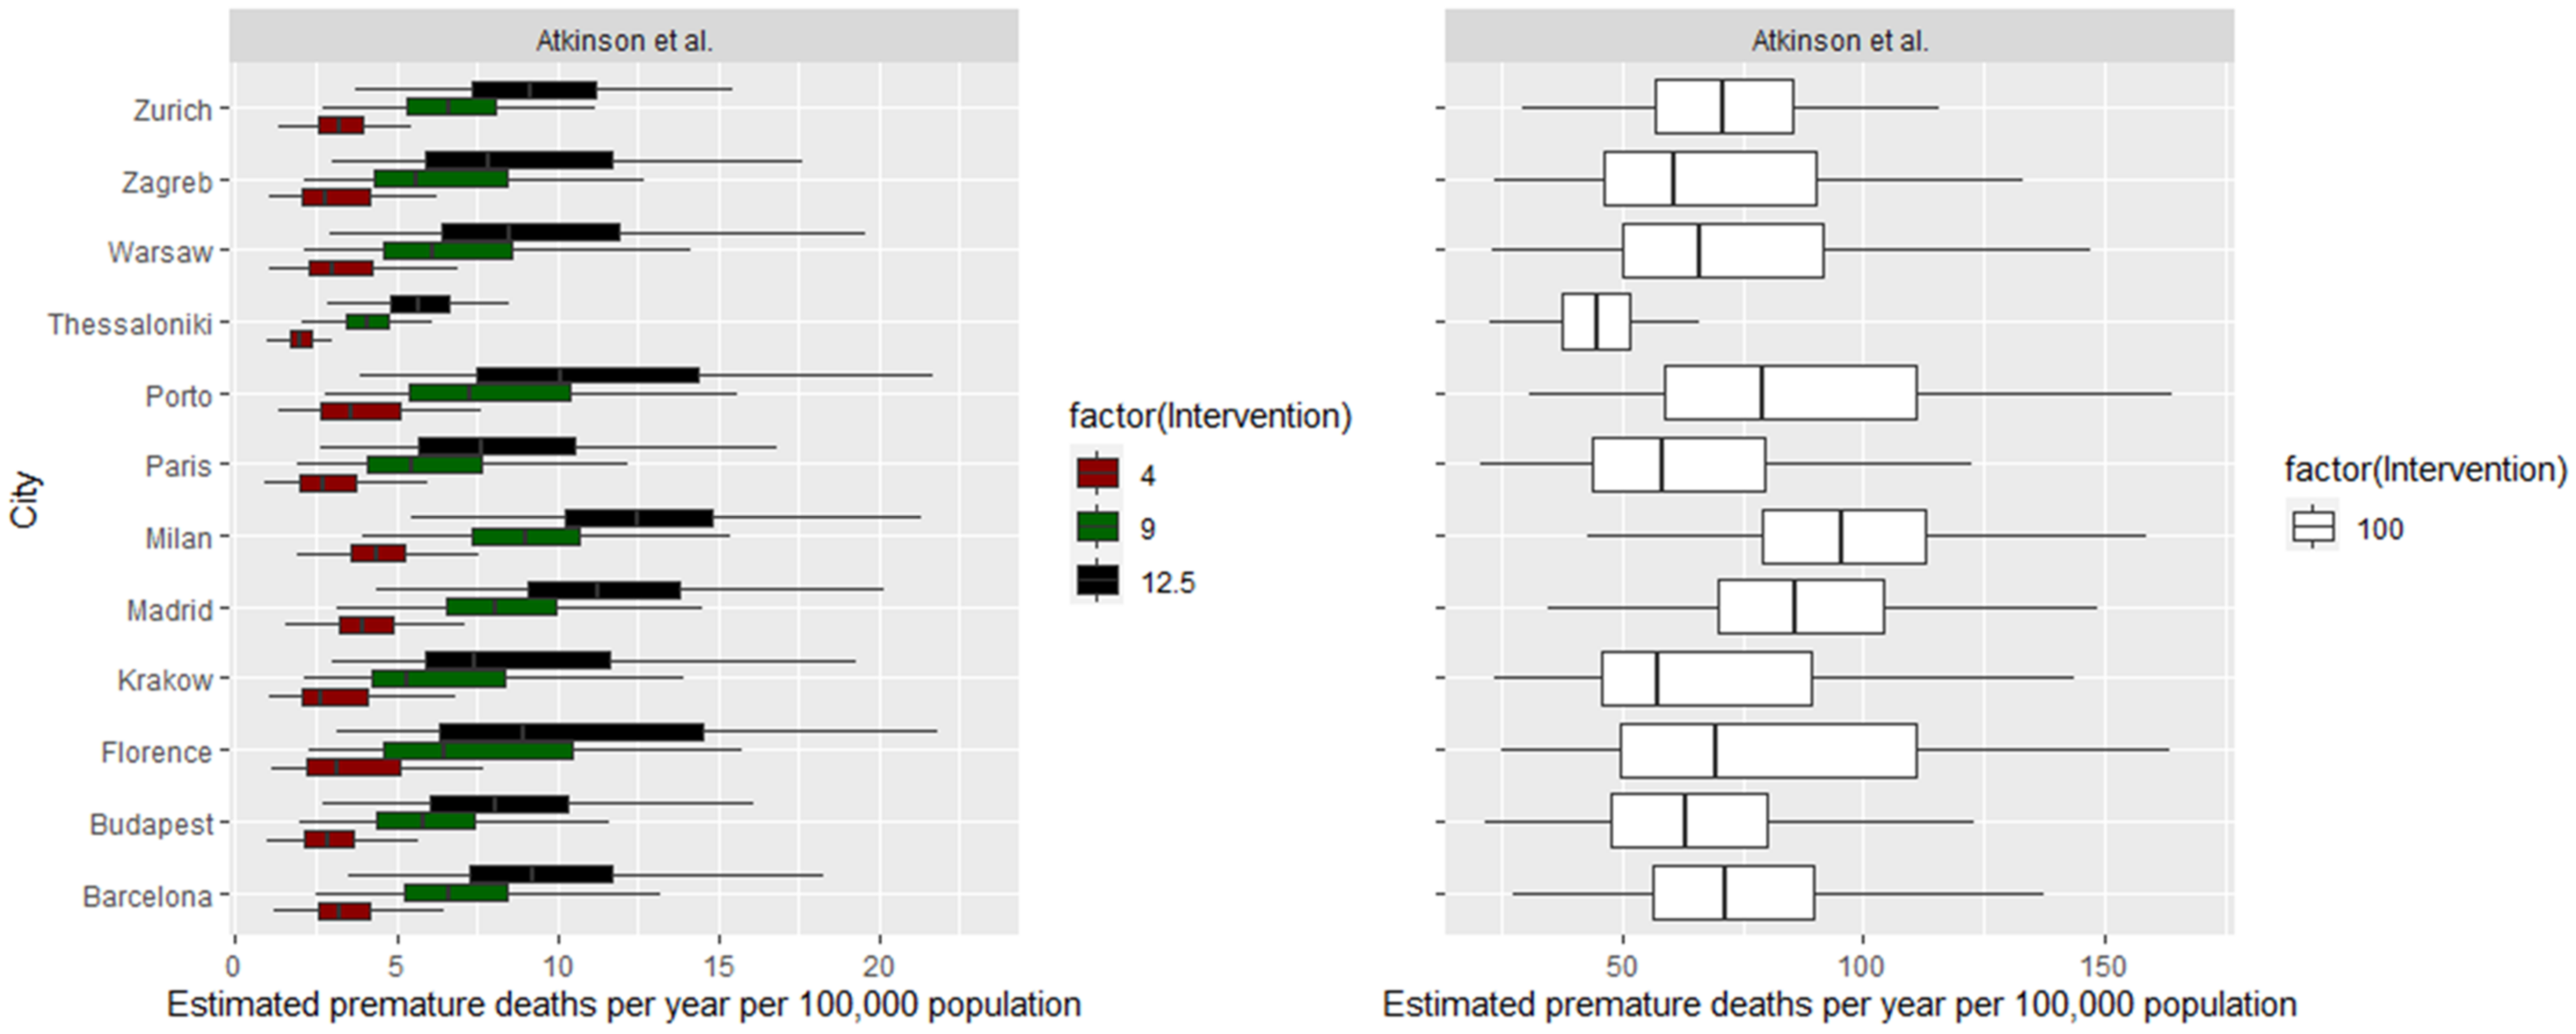
Long-term health impacts and potential reductions of NO2 concentrations.
A similar analysis was carried out for long-term exposures to NO2. In this case, the risk ratio used was from Atkinson et al. [69]. It is important to mention that authors conclude on an important heterogeneity between studies, depending on the spatial resolution of pollution estimates, and adjustment for smoking and body mass index, among other specifications. An accurate review is therefore required before conducting health impact assessments, so that the reported results comprise a representative range of values, accounting for the inherent uncertainties of the analysis and the specific population characteristics.
Using the risk estimates from Atkinson et al. [69] (Figure 6), long-term exposure to NO2 emissions (control scenario) accounted for 42–122 (CI: 20–170) premature deaths per 100,000 inhabitants, annually. These values are relatively higher but in the range of those deduced from traffic-derived PM2.5 exposures. In relative terms, the premature mortality due to exposure to NO2 in the selected cities accounted for between 3% and 15% of the baseline mortality (due to all causes), with an average of 8.5%.
The intervention scenarios (4–12.5% reduction in NO2 emissions) would result in reductions of 0.7–7 µg/m3 in the mean annual NO2 concentrations. Hypothesizing that the most ambitious reduction is achieved, the premature mortality avoided per year would account for 1.0% on average (Figure 6).
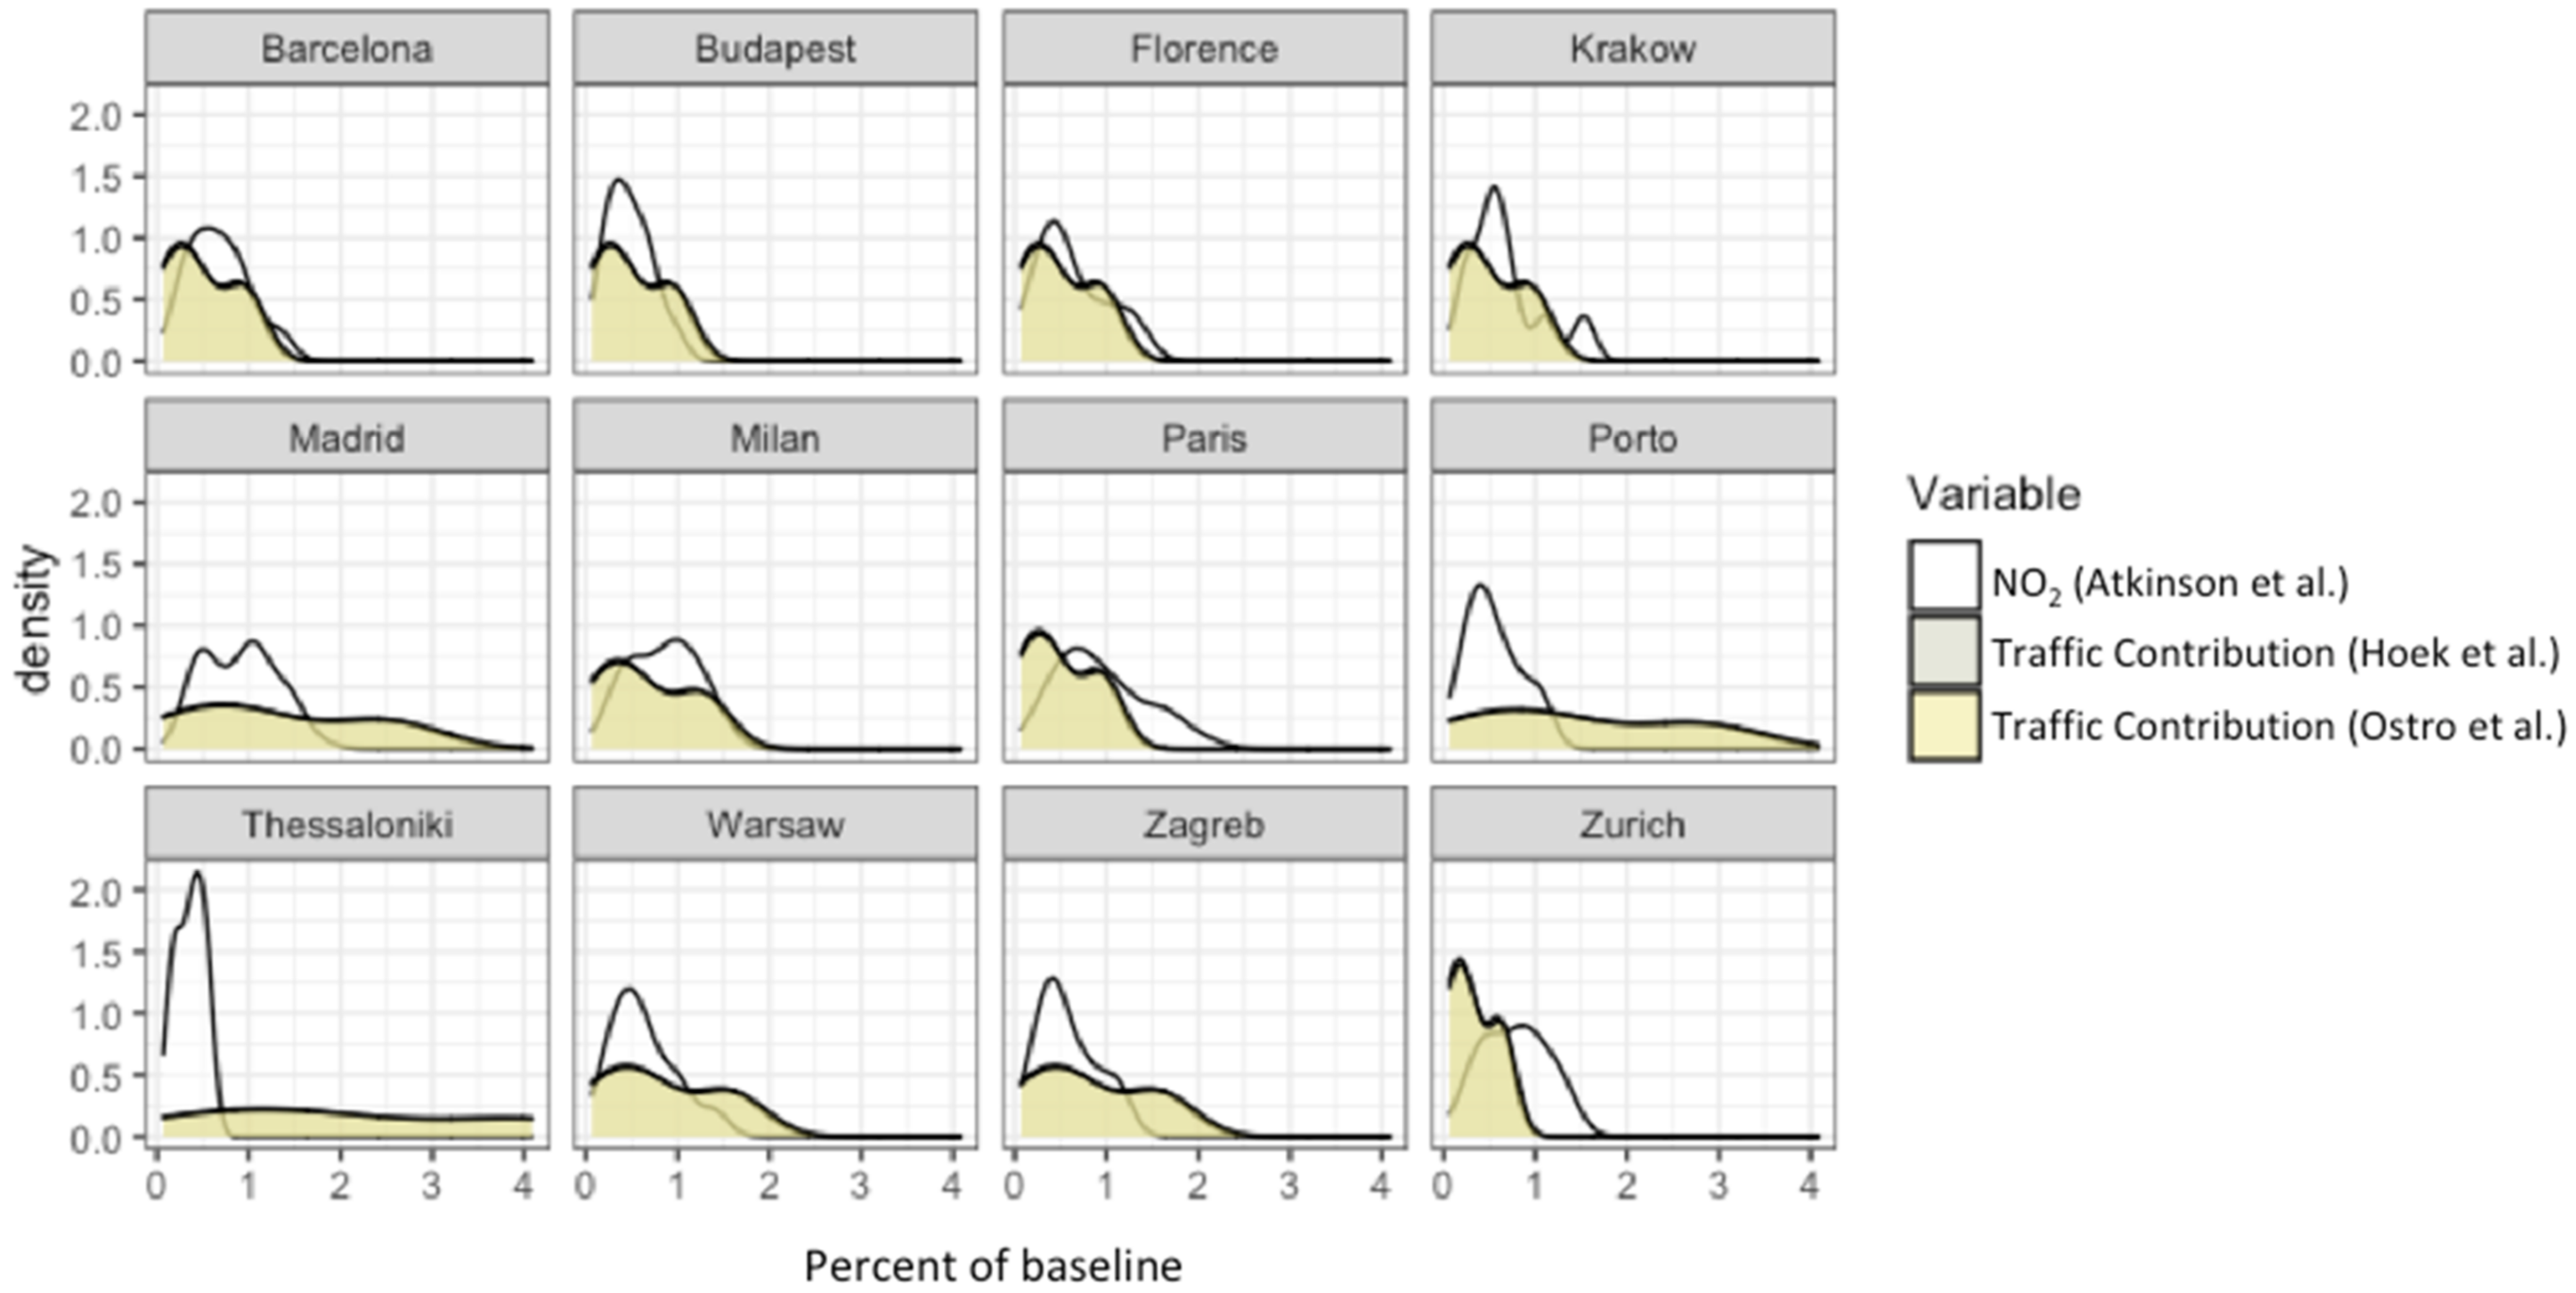
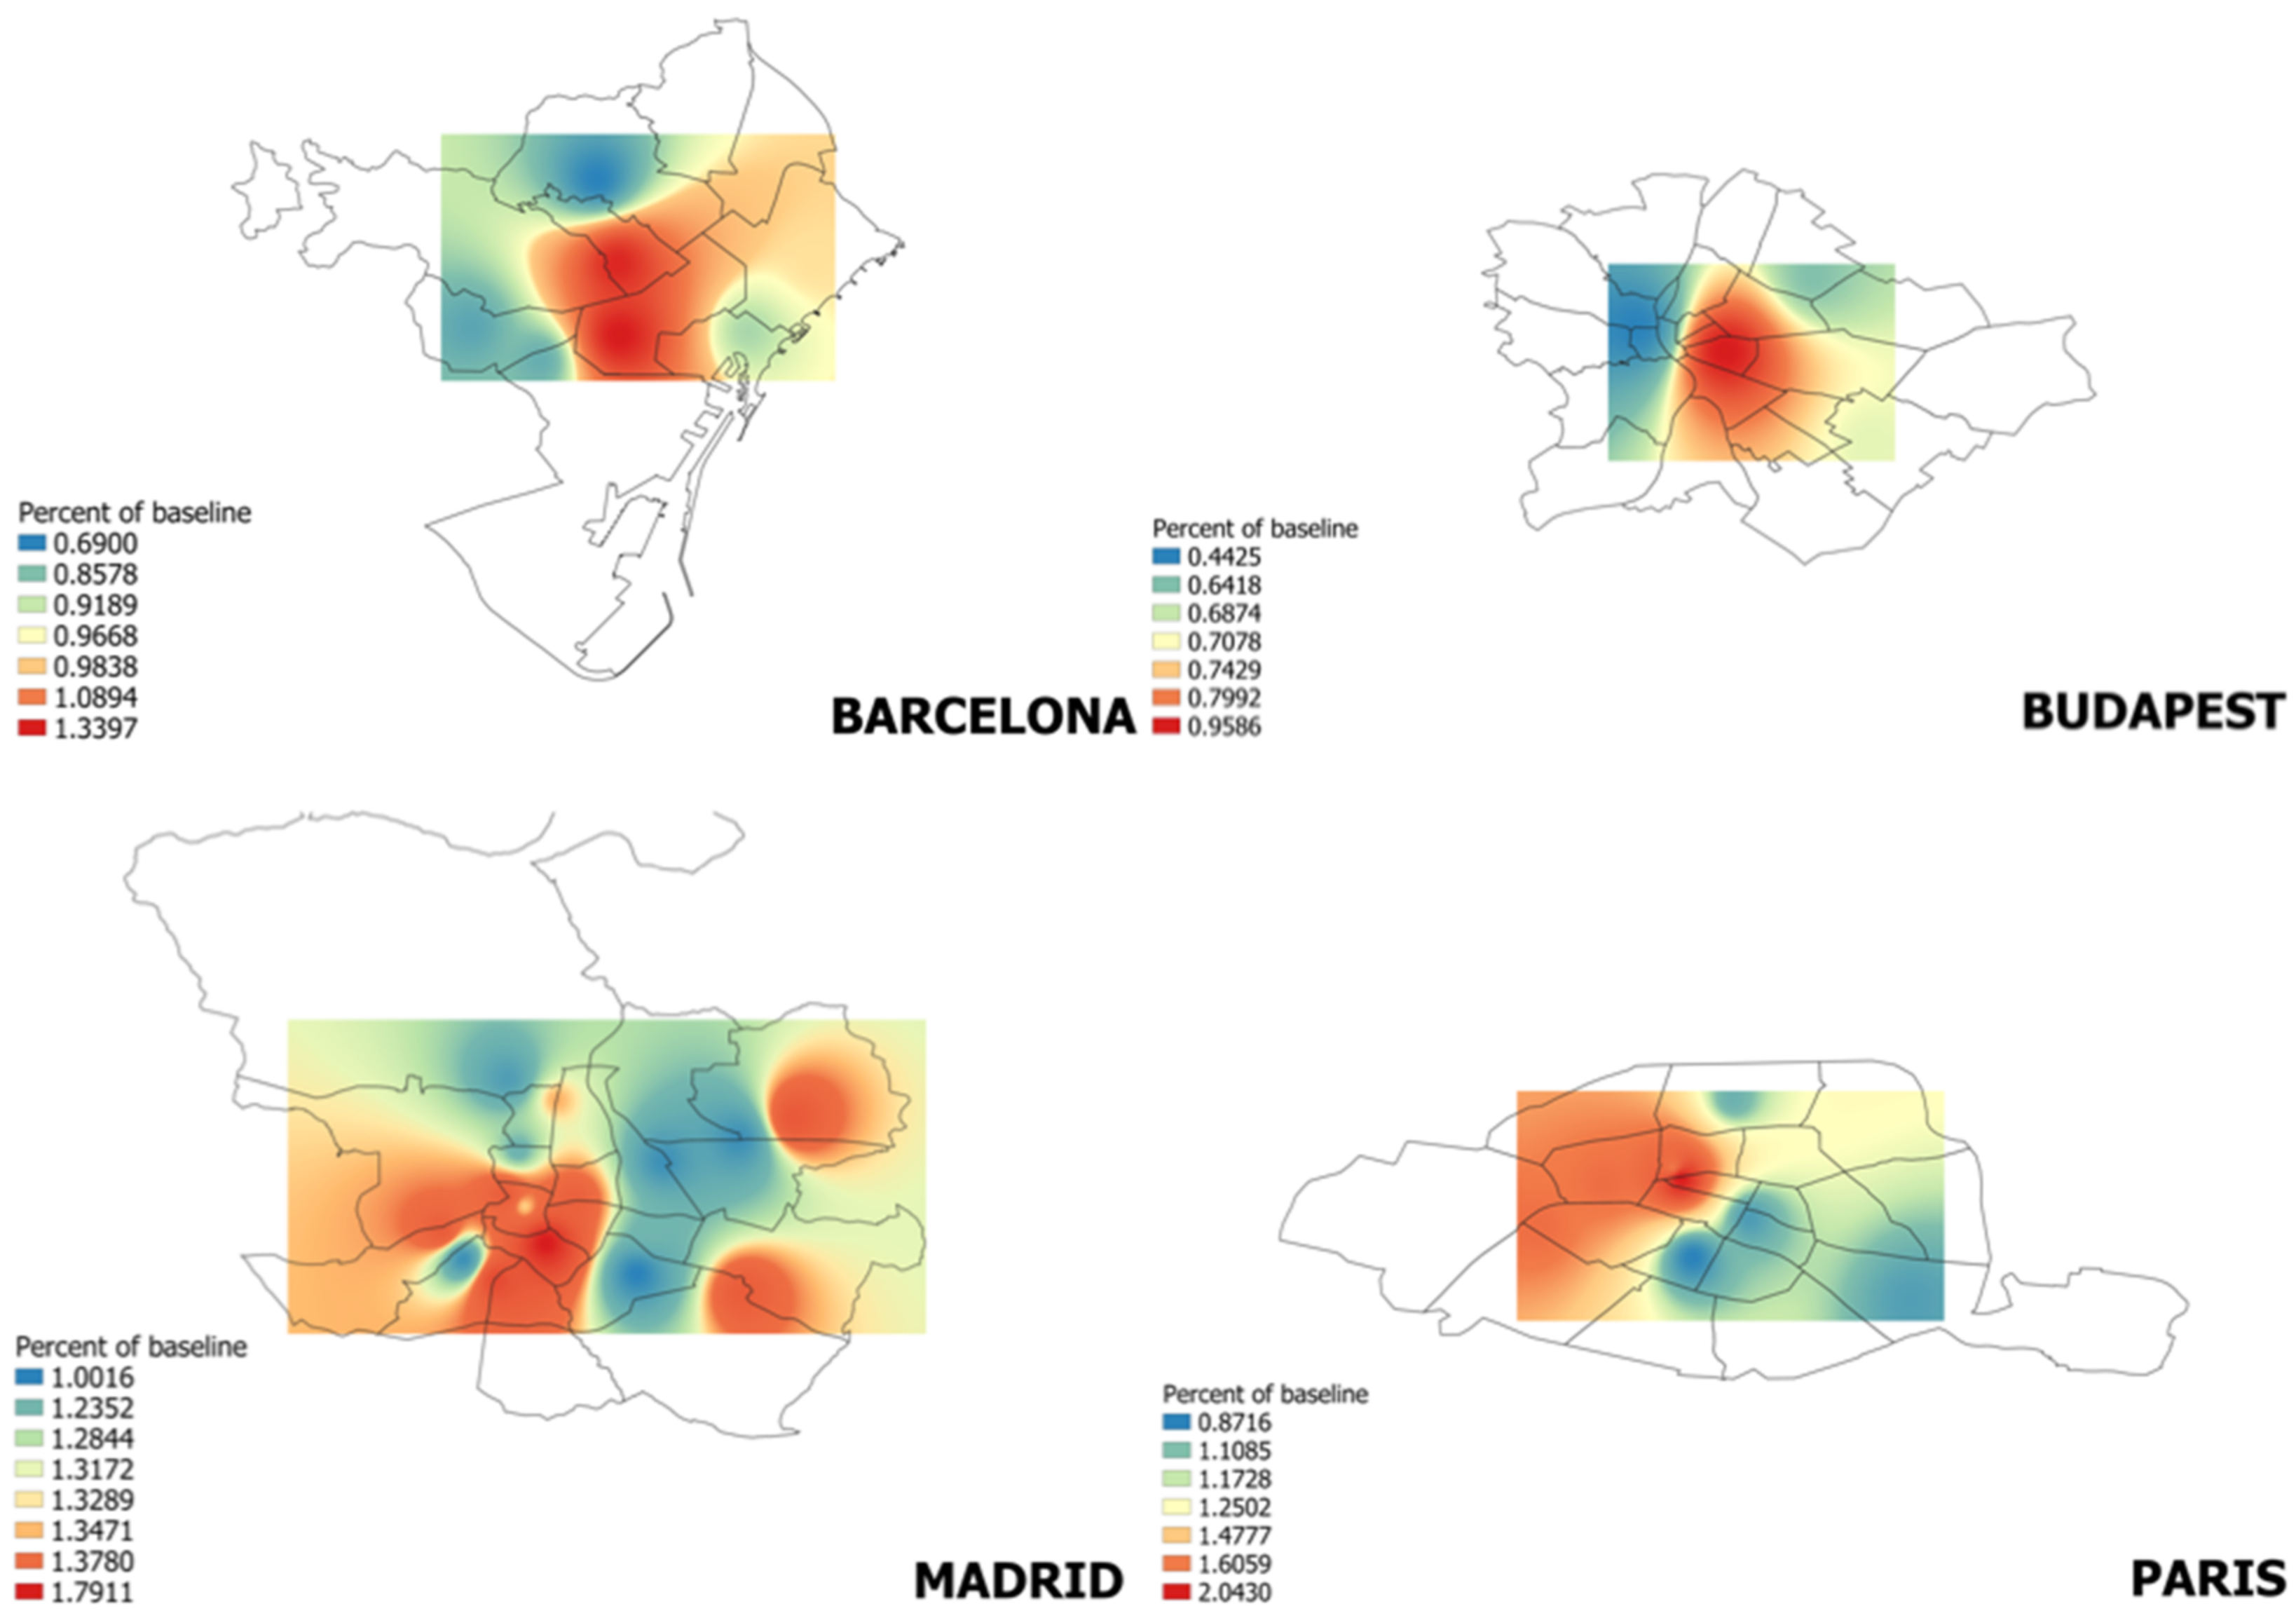
Comparing results achieved with the different approaches (based on exposure to NO2 and to traffic-related PM2.5), the distribution of percentages of reduction in premature mortality is generally similar for all the cities (Figure 7), except for Madrid, Porto and Thessaloniki, where the avoided premature mortality associated with reductions in traffic-derived PM2.5 concentrations would be significantly higher. In that sense, presenting results from the HIA of traffic-related PM2.5 could be more encouraging to impulse decisions from authorities on land-use management and traffic policies. Nonetheless, the generally higher spatial availability of NO2 concentrations provides an appropriate tool to investigate the variability within a city and to identify hotspots, where urgent measures should be taken, as well as those areas poorly monitored but highly populated. In our study, differences in the percent of baseline within a city range between 0.1 to 1.2% (see examples in Figure 8). It is here also important to briefly discuss how changes in NO2 concentrations would impact O3 behavior, due to the ever-changing interplay between both pollutants. Assuming a decrease of O3 linked to a decrease in NO2, this would lead to higher health benefits than described, as O3 has been well linked to severe lung damage in previous works [86].
Results were compared to the studies available in the literature. Reductions in premature mortality estimates were found to be generally in the same order of magnitude, although it should be noted that studies are relatively scarce, and most of them do not use source apportionment data based on actual observations as input data. To the authors’ knowledge, Isley et al. [44] is the only study grounded on an estimation of the traffic contribution to PM2.5 by a source apportionment method. According to these authors, the annual benefit resulting from a 100% reduction of road traffic emissions would be 20 (15–36) premature deaths, in the city of Suva (on the isle of Fiji, with a population of 100,000 inhabitants). In Europe, Malmqvist et al. [42] estimated that 29 premature deaths/100,000 inhabitants could be prevented annually by completely removing exhaust emissions in the city of Malmö (Sweden). Pérez et al. [87] calculated 66 prevented deaths under the assumption that 50% of the private car fleet would be based on electric vehicles in the city of Basel (170,000 inhabitants, Eurostat [64], resulting in 39 premature deaths avoided/100,000 inhabitants). Castro et al. [43] quantified the health benefits of implementing a clean air plan in the agglomeration of Lausanne-Morges (Switzerland), which would prevent 26 premature deaths annually. In Madrid, Izquierdo et al. [29] concluded that 88 (57–117) premature deaths could be associated with PM2.5 reductions (mainly, from traffic) from the implementation of the local air quality plan, a comparable result to that obtained in the present work. In contrast to the studies above, Tobollik et al. [88] found no health benefits related to air pollution, when applying two separate interventions (10% reduction of private vehicle kilometers and a share of 50% electric-powered private vehicle kilometers) in the city of Rotterdam, with only small benefits being related with noise reduction. It is relevant to highlight that, as expected, the health impacts estimated for the vehicular traffic source in urban environments were higher on average than reported in the literature for other sources [46] (e.g., shipping emissions, accounting for 5 premature deaths/100,000 inhabitants per year in Mediterranean coastal cities).
4. Summary and Conclusions
Traffic is the key source of air pollution in most European environments. It is a complex source, emitting a combination of primary and secondary pollutants, with air pollution impacts that depend on urban characteristics (density, % of green areas, etc.) and on societal uptake of the different mitigation measures available (from congestion charges to incentivizing active transport modes). As a result, reducing health impacts from exposure to traffic air pollutants is an especially challenging task. This work aimed to address traffic-related air pollution in urban areas, with a focus on urban indicators and estimating the health benefits of traffic mitigation strategies, for 12 urban environments across Europe.
The main conclusions extracted were:
- Practical initiatives to achieve sustainable city design, in terms of transport, include the creation of LEZ, fostering active transport modes, redistribution of public space, promotion of public transport, traffic policies/taxes, and technological improvement/roads management. These measures are known to be able to translate into a reduction of traffic-related air pollutants, which would in turn decrease associated premature mortality. The need for the different measures was proposed to be guided by key city indicators. In this study, the evaluation of urban indicators showed two main trends. On the one hand, cities with the most heterogeneous distribution of public transport stops, as an indicator of poor accessibility, are also those with the lowest proportion of km dedicated to cycleways and footways. This highlights the need in these cities for more sustainable mobility management. On the other hand, the percentage of green and outdoor leisure areas may influence the share of journeys by bicycle, pointing out that promoting the perception of green routes is relevant to enhancing the potential of active transport modes.
- The influence of city indicators on air quality parameters was elucidated for the selected cities. The traffic contribution to PM2.5 showed a moderate negative linear relationship with the mean percentage of green and outdoor leisure areas, while NO2 concentrations, available for a higher number of measurement sites, showed a significant linear relationship with the mean distance of each site to the primary roads of the city. This highlights that citizens’ exposure to air pollution is to a large degree dependent on urban planning decisions.
- Using the source-specific risk estimates, short-term exposure to PM2.5 traffic emissions accounted for 10–90 (CI: 7–130) premature deaths per 100,000 inhabitants per year. When the long-term risk ratio for bulk PM2.5 was used the results were very similar (10–85 premature deaths). Accordingly, premature mortality due to exposure to traffic-PM2.5 accounted for between 0.9% and 8.2% of the baseline mortality. These results were comparable to the literature [42,44].
- Long-term exposure to NO2 was estimated to account for 42–122 (CI: 20–170) premature deaths per year. These results correspond to percentages between 3% and 15% of the baseline mortality.
- The intervention scenarios proposed could result in up to a 1.7% reduction in premature mortality due to exposure to traffic-derived PM2.5, and up to a 1.0% due to exposure to NO2, as the mean for all the cities. The relatively low reductions estimated indicate that more ambitious abatement measures should be targeted. Some recent studies point out that combining these measures with optimistic fleet renewal and demand reductions is the only way to achieve relevant global emission reductions [89]. It is also worthy to mention the research revealing the importance of focusing efforts on heavy goods vehicles [90], as well as on the high contribution of secondary compounds to PM2.5 and on the need to identify major precursor reduction targets [91].
- While HIA results from traffic-derived PM2.5 are expected to be more accurately showing the effects of the reviewed intervention measures, the higher spatial availability of NO2 is useful to study the complexity of the urban scale air pollution.
- Analysis performed within this study evidenced that a sensitivity analysis is highly recommended when selecting risk ratios and air pollution descriptive variables as input for the HIA models. Efforts are needed to provide mortality risk estimates associated with specific aerosol sources and their related chemical components.
- Despite the limitations and uncertainties of this work, this study illustrates the importance of continued air pollution controls to reduce air pollution-related mortality.
- This work is based on open source databases. Open data should be promoted as an essential tool for comprehensive studies, aiming to raise environmental awareness in citizens and empower them to participate in urban governance, encouraging policymakers to constantly reevaluate city plans.
Supplementary Materials
The following supporting information can be downloaded at: https://www.mdpi.com/article/10.3390/atmos13040598/s1, Supporting Information SI1: Review of traffic emissions abatement measures; Figure S1: Methodology steps and the input data files required to run BenMAP-CE; Figure S2: Boxplot of the distribution of different indicators in the selected cities considered relevant from an air quality perspective; Figure S3: Correlogram of GDP (PPP) in the cities under study against selected city indicators. Correlation coefficients represent the Pearson’s correlation coefficients (r); Figure S4: PM2.5 source contributions reported in literature for the selected cities; Figure S5: Correlation matrix including selected city indicators and PM2.5 traffic contribution and PM2.5 concentrations in μgm−3; Figure S6: Linear regression between mean NO2 and PM2.5 traffic contributions in µgm−3 against mean distance to primary roads of the different measurement points; Table S1: Review of selected studies analyzing the effectiveness of different abatement measures, aimed to reduce the exposure to traffic emissions; Table S2: Review of traffic-related air pollution abatement measures which have proven to be successful in the selected European cities. Adapted from: http://fairmode.jrc.ec.europa.eu/measure-catalogue/.
Author Contributions
Authors’ individual contributions were: C.R.: Data curation, Formal analysis, Methodology, Writing—Original draft, Review and Editing; M.V.: Conceptualization, Methodology, Writing—Original draft, Review and Editing, Supervision; A.T.: Writing—Review & Editing. All authors have read and agreed to the published version of the manuscript.
Funding
This work was partially funded by the Spanish Ministry of Science, Innovation and Universities (Projects EIN2019-103405 and CEX2018-000794-S), by AGAUR (project 2017 SGR41) and by H2020 project RI-URBANS (H2020-LC-GD-2020-6, reference 101036245).
Institutional Review Board Statement
Not applicable.
Informed Consent Statement
Not applicable.
Data Availability Statement
Not applicable.
Acknowledgments
The authors gratefully acknowledge the fruitful technical discussions with N. Fann (US EPA, Office of Air Quality, Planning and Standards). The providers of health data and statistics are also acknowledged. This work was partially funded by the Spanish Ministry of Science, Innovation and Universities (Projects EIN2019-103405 and CEX2018-000794-S), by AGAUR (project 2017 SGR41) and by H2020 project RI-URBANS (H2020-LC-GD-2020-6, reference 101036245).
Conflicts of Interest
The authors declare no conflict of interest.
References
- Burnett, R.T.; Pope, C.A., III; Ezzati, M.; Olives, C.; Lim, S.S.; Mehta, S.; Cohen, A. An integrated risk function for estimating the Global Burden of Disease attributable to ambient fine particulate matter exposure. Environ. Health Perspect. 2014, 122, 397–403. [Google Scholar] [CrossRef] [PubMed]
- Mak, H.W.L.; Ng, D.C.Y. Spatial and Socio-Classification of Traffic Pollutant Emissions and Associated Mortality Rates in High-Density Hong Kong via Improved Data Analytic Approaches. Int. J. Environ. Res. Public Health 2021, 18, 6532. [Google Scholar] [CrossRef]
- Manisalidis, I.; Stavropoulou, E.; Stavropoulou, A.; Bezirtzoglou, E. Environmental and Health Impacts of Air Pollution: A Review. Front. Public Health 2020, 8, 20. [Google Scholar] [CrossRef] [PubMed] [Green Version]
- World Health Organization (WHO). Health Risks of Air Pollution in Europe—HRAPIE. Recommendations for Concentration-Response Functions for Cost-Benefit Analysis of Particulate Matter, Ozone and Nitrogen Dioxide. Copenhagen. 2013. Available online: https://apps.who.int/iris/handle/10665/153692 (accessed on 10 July 2021).
- Querol, X.; Alastuey, A.; Viana, M.; Moreno, T.; Reche, C.; Minguillón, M.C.; Ripoll, A.; Pandolfi, M.; Amato, F.; Karanasiou, A.; et al. Variability of carbonaceous aerosols in remote, rural, urban and industrial environments in Spain: Implications for air quality policy. Atmos. Chem. Phys. 2013, 13, 6185–6206. [Google Scholar] [CrossRef] [Green Version]
- Reche, C.; Querol, X.; Alastuey, A.; Viana, M.; Pey, J.; Moreno, T.; Rodríguez, S.; González, Y.; Fernández-Camacho, R.; de la Rosa, J.; et al. New considerations for PM, Black Carbon and particle number concentration for air quality monitoring across different European cities. Atmos. Chem. Phys. 2011, 11, 6207–6227. [Google Scholar] [CrossRef] [Green Version]
- Vanderstraeten, P.; Brasseur, O.; Forton, M.; Cheymol, A.; Squilbin, M. Particulate Matter and Nitrogen Dioxide in the Brussels Ambient Air. Geogr. Forum Environ. Prot. J. 2010, 9, 75–86. [Google Scholar]
- European Environment Agency (EEA). Air Quality in Europe—2019 Report. 2019. Available online: https://www.eea.europa.eu/publications/air-quality-in-europe-2019 (accessed on 20 November 2021).
- Invernizzi, G.; Ruprecht, A.; Mazza, R.; De Marco, C.; Močnik, G.; Sioutas, C.; Westerdahl, D. Measurement of black carbon concentration as an indicator of air quality benefits of traffic restriction policies within the ecopass zone in Milan, Italy. Atmos. Environ. 2011, 45, 3522–3527. [Google Scholar] [CrossRef]
- Panteliadis, P.; Strak, M.; Hoek, G.; Weijers, E. Implementation of a low emission zone and evaluation of effects on air quality by long-term monitoring. Atmos. Environ. 2014, 86, 113–119. [Google Scholar] [CrossRef]
- Qadir, R.M.; Abbaszade, G.; Schnelle-Kreis, J.; Chow, J.C.; Zimmermann, R. Concentrations and source contributions of particulate organic matter before and after implementation of a low emission zone in Munich, Germany. Environ. Pollut. 2013, 175, 158–167. [Google Scholar] [CrossRef]
- Titos, G.; Lyamani, H.; Drinovec, L.; Olmo, F.J.; Močnik, G.; Alados-Arboledas, L. Evaluation of the impact of transportation changes on air quality. Atmos. Environ. 2015, 114, 19–31. [Google Scholar] [CrossRef]
- Harrison, R.M.; Beddows, D.C. Efficacy of Recent Emissions Controls on Road Vehicles in Europe and Implications for Public Health. Sci. Rep. 2017, 7, 1152. [Google Scholar] [CrossRef] [PubMed] [Green Version]
- Krecl, P.; Johansson, C.; Targino, C.A.; Ström, J.; Burman, L. Trends in black carbon and size-resolved particle number concentrations and vehicle emission factors under real-world conditions. Atmos. Environ. 2017, 165, 155–168. [Google Scholar] [CrossRef]
- Viana, M.; Leeuw, F.; de Bartonova, A.; Castell, N.; Ozturk, E.; González Ortiz, A. Air quality mitigation in European cities: Status and challenges ahead. Environ. Int. 2020, 143, 105907. [Google Scholar] [CrossRef] [PubMed]
- Mak, H.; Lam, Y. Comparative Assessments and Insights of Data Openness of 50 Smart Cities in Air Quality Aspects. Sustain. Cities Soc. 2021, 69, 102868. [Google Scholar] [CrossRef]
- Sanzhapov, B.; Rashevskiy, N.; Sinitsyn, A. Analysis of Availability of Data Sets Necessary for Decision Making in Air Quality Assessment. IOP Conf. Ser. Mater. Sci. Eng. 2017, 262, 012187. [Google Scholar] [CrossRef]
- Stone, B.; Mednick, A.C.; Holloway, T.; Spak, S.N. Is compact growth good for air quality? J. Am. Plan. Assoc. 2007, 73, 404–418. [Google Scholar] [CrossRef]
- Borrego, C.; Martins, H.; Tchepel, O.; Salmim, L.; Monteiro, A.; Miranda, A.I. How urban structure can affect city sustainability from an air quality perspective. Environ. Modeling Softw. 2006, 21, 461–467. [Google Scholar] [CrossRef]
- McCarty, J.; Kaza, N. Urban form and air quality in the United States. Landsc. Urban Plan. 2015, 139, 168–179. [Google Scholar] [CrossRef]
- Badach, J.; Voordeckers, D.; Nyka, L.; van Acker, M. A framework for Air Quality Management Zones—Useful GIS-based tool for urban planning: Case studies in Antwerp and Gdańsk. Build. Environ. 2020, 174, 106743. [Google Scholar] [CrossRef]
- Tella, A.; Balogun, A.L. GIS-based air quality modelling: Spatial prediction of PM10 for Selangor State, Malaysia using machine learning algorithms. Environ. Sci. Pollut. Res. 2021, 1–17. [Google Scholar] [CrossRef]
- Gurjar, B.R.; Jain, A.; Sharma, A.; Agarwal, A.; Gupta, P.; Nagpure, A.S.; Lelieveld, J. Human health risks in megacities due to air pollution. Atmos. Environ. 2010, 44, 4606–4613. [Google Scholar] [CrossRef]
- Russell, A.G.; Brunekreef, B.A. Focus on particulate matter and health. Environ. Sci. Technol. 2009, 43, 4620–4625. [Google Scholar] [CrossRef] [PubMed] [Green Version]
- Fann, N.; Lamson, A.D.; Anenberg, S.C.; Wesson, K.; Risley, D.; Hubbell, B.J. Estimating the national public health burden associated with exposure to ambient PM2.5 and ozone. Risk Anal. 2011, 32, 81–95. [Google Scholar] [CrossRef] [PubMed]
- Boldo, E.; Linares, C.; Lumbreras, J.; Borge, R.; Narros, A.; García-Pérez, J.; Fernández-Navarro, F.; Pérez-Gómez, B.; Aragonés, N.; Ramis, R.; et al. Health impact assessment of a reduction in ambient PM2.5 levels in Spain. Environ. Int. 2011, 37, 342–348. [Google Scholar] [CrossRef]
- Cromar, K.R.; Gladson, L.A.; Perlmutt, L.D.; Ghazipura, M.; Ewart, G.W. American Thoracic Society and Marron Institute Report. Estimated excess morbidity and mortality caused by air pollution above American Thoracic Society-recommended standards, 2011–2013. Ann. Am. Thorac. Soc. 2016, 13, 1195–1201. [Google Scholar] [CrossRef]
- Hirabayashi, S.; Nowak, D.J. Comprehensive national database of tree effects on air quality and human health in the United States. Environ. Pollut. 2016, 215, 48–57. [Google Scholar] [CrossRef]
- Izquierdo, R.; Santos, S.G.; Dos Borge, R.; de la Paz, D.; Sarigiannis, D.; Gotti, A.; Boldo, E. Health impact assessment by the implementation of Madrid City air-quality plan in 2020. Environ. Res. 2020, 183, 109021. [Google Scholar] [CrossRef]
- Jhun, I.; Coull, B.A.; Schwartz, J.; Hubbell, B.; Koutrakis, P. The impact of weather changes on air quality and health in the United States in 1994–2012. Environ. Res. Lett. 2015, 10, 84009. [Google Scholar] [CrossRef] [Green Version]
- Keen, S.; Altieri, K. The health benefits of attaining and strengthening air quality standards in Cape Town. Clean Air J. 2016, 26, 22–27. [Google Scholar] [CrossRef]
- Nowak, D.J.; Hirabayashi, S.; Bodine, A.; Hoehn, R. Modeled PM2.5 removal by trees in ten U.S. cities and associated health effects. Environ. Pollut. 2013, 178, 395–402. [Google Scholar] [CrossRef]
- Nowak, D.J.; Hirabayashi, S.; Bodine, A.; Greenfield, E. Tree and forest effects on air quality and human health in the United States. Environ. Pollut. 2014, 193, 119–129. [Google Scholar] [CrossRef] [PubMed] [Green Version]
- Rao, M.; George, L.A.; Rosentiel, T.N.; Shandas, V.; Dinno, A. Assessing the relationship among urban trees, nitrogen dioxide, and respiratory health. Environ Pollut. 2014, 194, 96–104. [Google Scholar] [CrossRef] [PubMed]
- Stewart, D.R.; Saunders, E.; Perea, R.A.; Fitzgerald, R.; Campbell, D.E.; Stockwell, W. Linking Air Quality and Human Health Effects Models: An Application to the Los Angeles Air Basin. Environ. Health Insights 2017, 11, 1–13. [Google Scholar] [CrossRef] [PubMed] [Green Version]
- Thompson, T.M.; Saari, R.K.; Selin, N.E. Air quality resolution for health impact assessment: Influence of regional characteristics. Atmos. Chem. Phys. 2014, 14, 969–978. [Google Scholar] [CrossRef] [Green Version]
- Viana, M.; Fann, N.; Tobías, A.; Querol, X.; Rojas-Ruedas, D.; Plaza, A.; Aynos, F.; Conde, J.A.; Fernández, L.; Fernández, C. Environmental and Health Benefits from Designating the Marmara Sea and the Turkish Straits as an Emission Control Area (ECA). Environ. Sci. Technol. 2015, 49, 3304–3313. [Google Scholar] [CrossRef]
- Wang, H.; Zhu, Y.; Jang, C.; Lin, C.-H.; Wang, S.; Fu, J.S.; Gao, J.; Deng, S.; Xie, J.; Ding, D.; et al. Design and demonstration of a next-generation air quality attainment assessment system for PM2.5 and O3. J. Environ. Sci. 2015, 9, 178–188. [Google Scholar] [CrossRef]
- Zhang, Y.; Smith, S.J.; Bowden, J.H.; Adelman, Z.; West, J.J. Co-benefits of global, domestic, and sectoral greenhouse gas mitigation for US air quality and human health in 2050. Environ. Res. Lett. 2017, 12, 114033. [Google Scholar] [CrossRef]
- Sonawane, N.V.; Patil, R.S.; Sethi, V. Health benefit modelling and optimization of vehicular pollution control strategies. Atmos. Environ. 2012, 60, 193–201. [Google Scholar] [CrossRef]
- Wesson, K.; Fann, N.; Morris, M.; Fox, T.; Hubbell, B. A multi-pollutant, risk-based approach to air quality management: Case study for Detroit. Atmos. Pollut. Res. 2010, 1, 296–304. [Google Scholar] [CrossRef] [Green Version]
- Malmqvist, E.; Lisberg Jensen, E.; Westerberg, K.; Stroh, E.; Rittner, R.; Gustafsson, S.; Spanne, M.; Nilsson, H.; Oudin, A. Estimated health benefits of exhaust free transport in the city of Malmö, Southern Sweden. Environ. Int. 2018, 118, 78–85. [Google Scholar] [CrossRef]
- Castro, A.; Künzli, N.; Götschi, T. Health benefits of a reduction of PM10 and NO2 exposure after implementing a clean air plan in the Agglomeration Lausanne-Morges. Int. J. Hyg. Environ. Health 2017, 220, 829–839. [Google Scholar] [CrossRef] [PubMed]
- Isley, C.F.; Nelson, P.F.; Taylor, M.P.; Stelcer, E.; Atanacio, A.J.; Cohen, D.D.; Mani, F.S.; Maata, M. Reducing mortality risk by targeting specific air pollution sources: Suva, Fiji. Sci. Total Environ. 2018, 612, 450–461. [Google Scholar] [CrossRef] [PubMed]
- Ostro, B.; Tobias, A.; Querol, X.; Alastuey, A.; Amato, F.; Pey, J.; Perez, N.; Sunyer, J. The effects of particulate matter sources on daily mortality: A case-crossover study of Barcelona, Spain. Environ. Health Perspect. 2011, 119, 1781–1787. [Google Scholar] [CrossRef] [PubMed]
- Viana, M.; Rizza, V.; Tobías, A.; Carr, E.; Corbett, J.; Sofiev, M.; Karanasiou, A.; Buonanno, G.; Fann, N. Estimated health impacts from maritime transport in the Mediterranean region and benefits from the use of cleaner fuels. Environ. Int. 2020, 138, 105670. [Google Scholar] [CrossRef]
- Stockfelt, L.; Andersson, E.M.; Molnár, P.; Gidhagen, L.; Segersson, D.; Rosengren, A.; Barregard, L.; Sallsten, G. Long-term effects of total and source-specific particulate air pollution on indicent cardiovascular disease in Gotherburg, Sweden. Environ. Res. 2017, 158, 61–71. [Google Scholar] [CrossRef]
- Thurston, G.D.; Ito, K.; Lall, R. A Source Apportionment of U.S. Fine Particulate Matter Air Pollution. Atmos. Environ. 2011, 45, 3924–3936. [Google Scholar] [CrossRef] [Green Version]
- World Health Organization (WHO). Database on Source Apportionment Studies for Particulate Matter in the Air (PM10 and PM2.5). Source Apportionment. 2015. Available online: http://www.who.int/quantifying_ehimpacts/global/source_apport/en/ (accessed on 10 July 2021).
- Gong, W.; Beagley, S.R.; Cousineau, S.; Sassi, M.; Munoz-Alpizar, R.; Ménard, S.; Racine, J.; Zhang, J.; Chen, J.; Morrison, H.; et al. Assessing the impact of shipping emissions on air pollution in the Canadian Arctic and northern regions: Current and future modelled scenarios. Atmos. Chem. Phys. 2018, 18, 16653–16687. [Google Scholar] [CrossRef] [Green Version]
- Johansson, C.; Lövenheim, B.; Schantz, P.; Wahlgren, L.; Almström, P.; Markstedt, A.; Strömgren, M.; Forsberg, B.; Sommar, J.N. Impacts on air pollution and health by changing commuting from car to bicycle. Sci Total Environ. 2017, 584, 55–63. [Google Scholar] [CrossRef]
- Karl, M.; Jonson, J.E.; Uppstu, A.; Aulinger, A.; Prank, M.; Sofiev, M.; Jalkanen, J.-P.; Johansson, L.; Quante, M.; Matthias, V. Effects of ship emissions on air quality in the Baltic Sea region simulated with three different chemistry transport models. Atmos. Chem. Phys. 2019, 19, 7019–7053. [Google Scholar] [CrossRef] [Green Version]
- Sundvor, I.; Balaguer, N.C.; Viana, M.; Querol, X.; Reche, C.; Amato, F.; Guerreiro, C. Road traffic’s contribution to air quality in European cities. ETC/ACM Technical Paper. 2012. Available online: https://www.eionet.europa.eu/etcs/etc-atni/products/etc-atni-reports/etcacm_tp_2012_14_traffic_contribution_city_aq/@@download/file/ETCACM_TP_2012_14_traffic_contribution_city_aq.pdf (accessed on 20 December 2021).
- European Environment Agency (EEA). The European Air Qualiy Database. 2021. Available online: https://www.eea.europa.eu/data-and-maps/data/aqereporting-8 (accessed on 20 November 2021).
- Amato, F.; Favez, O.; Pandolfi, M.; Alastuey, A.; Querol, X.; Moukhtar, S.; Bruge, B.; Verlhac, S.; Orza, J.A.G.; Bonnaire, N.; et al. Traffic induced particle resuspension in Paris: Emission factors and source contributions. Atmos. Environ. 2016, 129, 114–124. [Google Scholar] [CrossRef]
- Perrone, M.G.; Vratolis, S.; Georgieva, E.; Torok, S.; Šega, K.; Veleva, B.; Osan, J.; Bešlić, I.; Kertesz, Z.; Pernigotti, D.; et al. Sources and geographic origin of particulate matter in urban areas of the Danube macroregion: The cases of Zagreb (Croatia), Budapest (Hungary) and Sofia (Bulgaria). Sci. Total Environ. 2018, 619–620, 1515–1529. [Google Scholar]
- Samek, L.; Stegowski, Z.; Furman, L.; Styszko, K.; Szramowiat, K.; Fiedor, J. Quantitative Assessment of PM2.5 Sources and Their Seasonal Variation in Krakow. Water Air Soil Pollut. 2017, 228, 290. [Google Scholar] [CrossRef] [PubMed] [Green Version]
- Salvador, P.; Artiñano, B.; Viana, M.; Querol, X.; Alastuey, A.; González-Fernández, I.; Alonso, R. Spatial and temporal variations in PM10 and PM2.5 across Madrid metropolitan area in 1999–2008. Procedia Environ. Sci. 2011, 4, 198–208. [Google Scholar] [CrossRef] [Green Version]
- AIRPARIF/LSCE. Source Apportionment of Airborne Particles in the Ile-de-France Region. Final Report by AIRPARIF and Laboratoire Des Sciences Du Climat Et De L’Environnement (LSCE); AIRPARIF/LSCE: Paris, France, 2012. [Google Scholar]
- Pio, C.; Alves, C.; Nunes, T.; Cerqueira, M.; Lucarelli, F.; Nava, S.; Calzolai, G.; Gianelle, V.; Colombi, C.; Amato, A.; et al. Source apportionment of PM2.5 and PM10 by Ionic and Mass Balance (IMB) in a traffic-influenced urban atmosphere, in Portugal. Atmos. Environ. 2020, 223, 117217. [Google Scholar]
- Saraga, D.E.; Tolis, E.I.; Maggos, T.; Vasilakos, C.; Bartzis, J.G. PM2.5 source apportionment for the port city of Thessaloniki, Greece. Sci. Total Environ. 2019, 650, 2337–2354. [Google Scholar] [CrossRef]
- Juda-Rezler, K.; Reizer, M.; Maciejewska, K.; Błaszczak, B.; Klejnowski, K. Characterization of atmospheric PM2.5 sources at a Central European urban background site. Sci. Total Environ. 2020, 713, 136729. [Google Scholar] [CrossRef]
- Richard, A.; Gianini, M.F.D.; Mohr, C.; Furger, M.; Bukowiecki, N.; Minguillón, M.C.; Lienemann, P.; Flechsig, U.; Appel, K.; DeCarlo, P.F.; et al. Source apportionment of size and time resolved trace elements and organic aerosols from an urban courtyard site in Switzerland. Atmos. Chem. Phys. 2011, 11, 8945–8963. [Google Scholar] [CrossRef] [Green Version]
- Eurostat. European Statistics. 2021. Available online: https://ec.europa.eu/eurostat/web/main/data/database (accessed on 20 November 2021).
- Rice, M.B.; Rifas-Shiman, S.L.; Oken, E.; Gillman, M.W.; Ljungman, P.L.; Litonjua, A.A.; Schwartz, J.; Coull, B.A.; Zanobetti, A.; Koutrakis, P.; et al. Exposure to traffic and early life respiratory infection: A cohort study. Pediatr. Pulmonol. 2015, 50, 252–259. [Google Scholar] [CrossRef]
- Atkinson, R.W.; Analitis, A.; Samoli, E.; Fuller, G.W.; Green, D.C.; Mudway, I.S.; Anderson, H.R.; Kelly, F.J. Short-term exposure to traffic-related air pollution and daily mortality in London, UK. J. Expo. Sci. Environ. Epidemiol. 2016, 26, 125–132. [Google Scholar] [CrossRef] [Green Version]
- Basagaña, X.; Jacquemin, B.; Karanasiou, A.; Ostro, B.; Querol, X.; Agis, D.; Alessandrini, E.; Alguacil, J.; Artiñano, B.; Catrambone, M.; et al. Short-term effects of particulate matter constituents on daily hospitalizations and mortality in five South-European cities: Results from the MED-PARTICLES project. Environ. Int. 2015, 75, 151–158. [Google Scholar] [CrossRef]
- Hoek, G.; Krishnan, R.M.; Beelen, R.; Peters, A.; Ostro, B.; Brunekreef, B.; Kaufman, J.D. Long-term air pollution exposure and cardio- respiratory mortality: A review. Environ. Health 2013, 12, 43. [Google Scholar] [CrossRef] [PubMed] [Green Version]
- Atkinson, R.W.; Butland, B.K.; Anderson, H.R.; Maynard, R.L. Long-term Concentrations of Nitrogen Dioxide and Mortality: A Meta-analysis of Cohort Studies. Epidemiology 2018, 29, 460–472. [Google Scholar] [CrossRef] [PubMed]
- Beelen, R.; Raaschou-Nielsen, O.; Stafoggia, M.; Andersen, Z.J.; Weinmayr, G.; Hoffmann, B.; Wolf, K.; Samoli, E.; Fischer, P.; Nieuwenhuijsen, M.; et al. Effects of long-term exposure to air pollution on natural-cause mortality: An analysis of 22 European cohorts within the multicentre ESCAPE project. Lancet 2014, 383, 785–795. [Google Scholar] [CrossRef]
- Cesaroni, G.; Badaloni, C.; Gariazzo, C.; Stafoggia, M.; Sozzi, R.; Davoli, M.; Forastiere, F. Long-term exposure to urban air pollution and mortality in a cohort of more than a million adults in Rome. Environ. Health Perspect. 2013, 121, 324–331. [Google Scholar] [CrossRef] [PubMed] [Green Version]
- Heo, J.; Schauer, J.J.; Yi, O.; Paek, D.; Kim, H.; Yi, S.M. Fine particle air pollution and mortality: Importance of specific sources and chemical species. Epidemiology 2014, 25, 379–388. [Google Scholar] [CrossRef]
- Ito, K.; Christensen, W.F.; Eatough, D.J.; Henry, R.C.; Kim, E.; Laden, F.; Lall, R.; Larson, T.V.; Neas, L.; Hopke, P.K.; et al. PM source apportionment and health effects: 2. An investigation of intermethod variability in associations between source-apportioned fine particle mass and daily mortality in Washington, DC. J. Expo. Sci. Environ. Epidemiol. 2006, 16, 300–310. [Google Scholar] [CrossRef] [Green Version]
- Laden, F.; Neas, L.M.; Dockery, D.W.; Schwartz, J. Association of fine particulate matter from different sources with daily mortality in six U.S. cities. Environ. Health Perspect. 2000, 108, 941–947. [Google Scholar] [CrossRef]
- Lall, R.; Ito, K.; Thurston, G.D. Distributed lag analyses of daily hospital admissions and source-apportioned fine particle air pollution. Environ. Health Perspect. 2011, 119, 455–460. [Google Scholar] [CrossRef]
- Mar, T.F.; Ito, K.; Koenig, J.Q.; Larson, T.V.; Eatough, D.J.; Henry, R.C.; Kim, E.; Laden, F.; Lall, R.; Neas, L.; et al. PM source apportionment and health effects. 3. Investigation of inter-method variations in associations between estimated source contributions of PM2.5 and daily mortality in Phoenix, AZ. J. Expo. Sci. Environ. Epidemiol. 2006, 16, 311–320. [Google Scholar]
- Sarnat, J.A.; Marmur, A.; Klein, M.; Kim, E.; Russell, A.G.; Sarnat, S.E.; Mulholland, J.A.; Hopke, P.K.; Tolbert, P.E. Fine particle sources and cardiorespiratory morbidity: An application of chemical mass balance and factor analytical source-apportionment methods. Environ. Health Perspect. 2008, 116, 459–466. [Google Scholar] [CrossRef]
- Schwartz, J.; Laden, F.; Zanobetti, A. The concentration-response relation between PM2.5 and daily deaths. Environ. Health Perspect. 2002, 110, 1025–1029. [Google Scholar] [CrossRef] [PubMed] [Green Version]
- Davidson, K.; Hallberg, A.; McCubbin, D.; Hubbell, B. Analysis of PM2.5 using the Environmental Benefits Mapping and Analysis Program (BenMAP). J. Toxicol. Environ. Health Part A 2007, 70, 332–346. [Google Scholar] [CrossRef] [PubMed]
- Ding, D.; Zhu, Y.; Jang, C.; Lin, C.J.; Wang, S.; Fu, J.; Gao, J.; Deng, S.; Xie, J.; Qiu, X. Evaluation of health benefit using BenMAP-CE with an integrated scheme of model and monitor data during Guangzhou Asian Games. J. Environ. Sci. 2016, 42, 9–18. [Google Scholar] [CrossRef] [PubMed]
- Ferrero, E.; Ferrero, E.; Ferrero, E.; Alessandrini, S.; Balanzino, A. Impact of the electric vehicles on air pollution from a highway. Appl. Energy 2016, 169, 450–459. [Google Scholar] [CrossRef]
- Santos, F.M.; Gómez-Losada, A.; Pires, J.C.M. Impact of the implementation of Lisbon low emission zone on air quality. J. Hazard. Mater. 2019, 365, 632–641. [Google Scholar] [CrossRef]
- Nieuwenhuijsen, M. Urban and transport planning, environmental exposures and health-new concepts, methods and tools to improve health in cities. Environ. Health 2016, 15 (Suppl. 1), 83. [Google Scholar] [CrossRef] [Green Version]
- Shen, L.; He, B.; Jiao, L.; Song, X.; Zhang, X. Research on the development of main policy instruments for improving building energy-efficiency. J. Clean. Prod. 2016, 112, 1789–1803. [Google Scholar] [CrossRef]
- Tan, Y.; Jiao, L.; Shuai, C.; Shen, L. A system dynamics model for simulating urban sustainability performance: A China case study. J. Clean. Prod. 2018, 199, 1107–1115. [Google Scholar] [CrossRef]
- Holm, S.M.; Balmes, J.R. Systematic Review of Ozone Effects on Human Lung Function, 2013 Through 2020. Chest 2022, 161, 190–201. [Google Scholar] [CrossRef]
- Pérez, L.; Trüeb, S.; Cowie, H.; Keuken, M.P.; Mudu, P.; Ragettli, M.S.; Sarigiannis, D.A.; Tobollik, M.; Tuomisto, J.I.; Vienneau, D.; et al. Tansport-related measure to mitigate climate change in Basel, Switzerland: A health-effectiveness comparison study. Environ. Int. 2015, 85, 111–119. [Google Scholar] [CrossRef]
- Tobollik, M.; Keuken, M.; Sabel, C.; Cowie, H.; Tuomisto, J.; Sarigiannis, D.; Künzli, N.; Pérez, L.; Mudu, P. Health impact assessment of transport policies in Rotterdam: Decrease of total traffic and increase of electric car use. Environ. Res. 2016, 146, 350–358. [Google Scholar] [CrossRef] [PubMed] [Green Version]
- Rodríguez-Rey, D.; Guevara, M.; Linares, M.P.; Casanovas, J.; Armengol, J.M.; Benavides, J.; Soret, A.; Jorba, O.; Tena, C.; Pérez García-Pando, C. To what extent the traffic restriction policies applied in Barcelona city can improve its air quality? Sci. Total Environ. 2021, 807 Pt 2, 150743. [Google Scholar] [CrossRef] [PubMed]
- Ziemska, M. Exhaust Emissions and Fuel Consumption Analysis on the Example of an Increasing Number of HGVs in the Port City. Sustainability 2021, 13, 7428. [Google Scholar] [CrossRef]
- Querol, X.; Massagué, J.; Alastuey, A.; Moreno, T.; Gangoiti, G.; Mantilla, E.; Duéguez, J.J.; Escudero, M.; Monfort, E.; Pérez García-Pando, C.; et al. Lessons from the COVID-19 air pollution decrease in Spain: Now what? Sci. Total Environ. 2021, 779, 146380. [Google Scholar] [CrossRef] [PubMed]
Figure 1.
Location of the selected cities, with a visual comparison of PM2.5 and PM2.5 traffic contribution (left), and location of NO2 monitoring stations, indicating concentration ranges (right).
Figure 1.
Location of the selected cities, with a visual comparison of PM2.5 and PM2.5 traffic contribution (left), and location of NO2 monitoring stations, indicating concentration ranges (right).

Figure 2.
Summary of the results of the review on studies assessing the effectiveness of different abatement measures against traffic emissions (as reported in Table S1).
Figure 2.
Summary of the results of the review on studies assessing the effectiveness of different abatement measures against traffic emissions (as reported in Table S1).

Figure 3.
Heatmap of the results of the hierarchical clustering performed for selected city indicators, data values have been transformed to a color scale.
Figure 3.
Heatmap of the results of the hierarchical clustering performed for selected city indicators, data values have been transformed to a color scale.

Figure 4.
Linear regression between the percentage of green and outdoor leisure areas and the percentage of journeys to work by cycling in 8 of the selected cities.
Figure 4.
Linear regression between the percentage of green and outdoor leisure areas and the percentage of journeys to work by cycling in 8 of the selected cities.

Figure 5.
Estimated premature mortality/year per 100,000 population due to exposure to traffic-related PM2.5 (baseline scenario) in the study cities, using two different risk estimates (as reported by Ostro et al. [45] and Hoek et al. [68]), and applying three different intervention scenarios (5, 22 and 50% reduction in concentrations). It is shown in comparison with the baseline/control scenario (100% reduction). The line within the box plots shows the median concentrations, while the box bottom and top represent the 25th and 75th percentiles, respectively. The whiskers represent the lower (2.5th percentile) and the upper (97.5th percentile) bounds. Note on the different x scales.

Figure 6.
Estimated premature mortality/year per 100,000 population due to exposure to NO2 concentrations (baseline scenario) in the study cities, using risk estimate by Atkinson et al. [69], and applying three different intervention scenarios (4, 9 and 22% reduction in concentrations). It is shown in comparison with the baseline/control scenario (100% reduction). The line within the box plots shows the median concentrations, while the box bottom and top represent the 25th and 75th percentiles, respectively. The whiskers represent the lower (2.5th percentile) and the upper (97.5th percentile) bounds. Note on the different x scales.

Figure 7.
Probability density functions of percent of avoided mortality. Plots compared results based on both selected approaches, exposure to traffic-derived PM2.5 concentrations and NO2 concentrations, according to the different selected risk ratios (as reported by Atkinson et al. [69], Hoek et al., [68] and Ostro et al. [45]).

Figure 8.
Spatial distribution of percentages of avoided premature mortality within selected cities due to exposure to NO2 concentrations.
Figure 8.
Spatial distribution of percentages of avoided premature mortality within selected cities due to exposure to NO2 concentrations.

Table 2.
Short-term and long-term epidemiological studies selected for the calculation of the health impact functions used in this work.
Table 2.
Short-term and long-term epidemiological studies selected for the calculation of the health impact functions used in this work.
| Study | Scale | Parameter | Health Outcome | Age Group | RR (95%) | IQR (µgm−3) |
|---|---|---|---|---|---|---|
| Ostro et al. [45] | Short-term | Traffic contribution to PM2.5 | Mortality, all-cause | 0–99 | 1.037 (1.007–1.067) | 5.2 |
| Hoek et al. [68] | Long-term | PM2.5 | Mortality, all-cause | 0–99 | 1.062 (1.040–1.083) | 10 |
| Atkinson et al. [69] | Long-term | NO2 | Mortality, all-cause | 0–99 | 1.020 (1.010–1.030) | 10 |
Publisher’s Note: MDPI stays neutral with regard to jurisdictional claims in published maps and institutional affiliations. |
© 2022 by the authors. Licensee MDPI, Basel, Switzerland. This article is an open access article distributed under the terms and conditions of the Creative Commons Attribution (CC BY) license (https://creativecommons.org/licenses/by/4.0/).
Share and Cite
MDPI and ACS Style
Reche, C.; Tobias, A.; Viana, M. Vehicular Traffic in Urban Areas: Health Burden and Influence of Sustainable Urban Planning and Mobility. Atmosphere 2022, 13, 598. https://doi.org/10.3390/atmos13040598
AMA Style
Reche C, Tobias A, Viana M. Vehicular Traffic in Urban Areas: Health Burden and Influence of Sustainable Urban Planning and Mobility. Atmosphere. 2022; 13(4):598. https://doi.org/10.3390/atmos13040598
Chicago/Turabian StyleReche, Cristina, Aurelio Tobias, and Mar Viana. 2022. "Vehicular Traffic in Urban Areas: Health Burden and Influence of Sustainable Urban Planning and Mobility" Atmosphere 13, no. 4: 598. https://doi.org/10.3390/atmos13040598
Note that from the first issue of 2016, this journal uses article numbers instead of page numbers. See further details here.