
Yearly Variations of Equivalent Black Carbon Concentrations Observed in Krakow, Poland


Faculty of Physics and Applied Computer Science, AGH University of Science and Technology, 30 Mickiewicza Ave, 30-059 Krakow, Poland
*
Author to whom correspondence should be addressed.
Atmosphere 2022, 13(4), 539; https://doi.org/10.3390/atmos13040539
Submission received: 25 February 2022
/
Revised: 25 March 2022
/
Accepted: 27 March 2022
/
Published: 29 March 2022
(This article belongs to the Special Issue Feature Papers in Aerosol Research)
Abstract
:The evaluation of the equivalent black carbon (eBC) concentration is very important, especially in environmental sciences. Light absorbing carbon (LAC), also presented as equivalent black carbon (eBC), is generated from the partial combustion of fossil fuels and biomass. The scientific interest in eBC is large because its contribution to the PM2.5 fraction is high, especially in urban areas. This study presents yearly variations in eBC concentrations observed in Krakow, Poland. The transmissions of light at different wavelengths were measured by a multi-wavelength absorption black carbon instrument (MABI). Absorption coefficients and concentrations of eBC were calculated. Samples of the PM2.5 fraction were collected from 1 February 2020 to 27 March 2021 every third day in Krakow, Poland. The concentrations of eBC from fossil fuel combustion and biomass burning were in the range of 0.82–11.64 and 0.007–0.84 , respectively. At the same time, PM2.5 concentrations varied from 3.14 to 55.24 . The eBC contribution was a significant part of PM2.5 mass and we observed a seasonal variation in eBC concentrations during the year, with the peak in winter (5.3 ± 1.8 µg m−3). The contribution of BC from biomass burning to PM2.5 mass was in the range of 4%–5% with the highest value for winter. The eBC concentration during workdays was 21% higher than during weekend days.
1. Introduction
The main contributors to particulate matter (PM) consist of carbon (organic carbon (OC), elemental carbon (EC) or black carbon (eBC)), ammonium sulfate and nitrate (secondary inorganic aerosols (SIA)), other ions, and chemical elements, including heavy metals and other organic and inorganic components. All these components influence the properties of PM.
The largest contributor to air pollution and global change is the emission of carbonaceous particles, which are produced during the combustion of biomass and fossil fuel [1]. Black carbon (eBC) is the fraction of the carbonaceous aerosol produced during incomplete fossil fuel combustion [1,2,3]. Moreover, eBC is characterized by the strong absorption of all wavelengths of solar radiation [1,4,5]. Based on the fact that light absorption particles can warm the atmosphere, scientists consider BC as the second most critical reason for global warming in terms of direct impact [6,7]. Consequently, eBC not only impacts the general climate but also causes indirect effects—for instance, it reduces local visibility and is responsible for the appearance of brown hazes in a city [5,8]. According to the “Report to Congress on Black Carbon”, most of the global eBC emissions came from Asia, Latin America and Africa while major sources were from open biomass burning, residential buildings and transportation [5]. Although eBC has a strong harmful impact on the environment, the lifetime of eBC in the atmosphere is several days. A reduction in eBC can be achieved by strategies targeting lower eBC emissions connected with the identified sources of eBC, global air pollution management, and policy-making [2,5]. Since research on black carbon is constantly being improved, there is some inconsistency in the terminology. Bond and Bergstrom (2006) indicated that scientists use different names for “Black Carbon”, for instance, “soot”, “light absorbing carbon”, “elemental carbon”, “refractory carbon” and “graphitic carbon” [1,4]. These nomenclatures are connected with composition, optical properties, particle morphology and measurement techniques.
Over the years, different measurement techniques and instruments were used to describe and determine the eBC mass. These techniques are usually based on light absorption or thermal measurements. The instruments which are commonly used range from the aethalometer to Multi-Angle Absorption Photometry (MAAP) or photoacoustic instruments. The instruments, as well as techniques and recommended terminology, are widely discussed in review papers by Petzold, A. et al., Bond, T.C., Bergstrom, R., and Lack, D. et al. [1,4,9,10].
Consequently, eBC analysis is especially important for the PM2.5 fraction. The EU report presented eBC concentrations of PM10 and ultrafine fractions for some European cities [3]. There are a limited number of papers presenting the results of eBC concentrations in Poland [11].
The aim of this study is to present yearly variations of eBC concentrations in fine fractions of PM in Krakow, Poland, together with demonstrating the method for its determination. The results of light absorption coefficients and BC mass concentrations were obtained for different wavelengths in the presented work. The calculation is based on the Lambert–Beer law:
where respectively, is the absorption coefficient of the aerosol particles, and are the unexposed intensity and the exposed transmission intensity, is the length of the sampled air column [12].
This is one of the first such studies in Poland. The information about eBC concentrations plays a crucial role in evaluating its impact on air quality in the city.
2. Sampling and Method
2.1. Sampling Location
The sampling campaign was conducted in the research station located at the AGH University of Science and Technology in Krakow (50°04′00.5″ N, 19°54′46.8″ E). This station is equivalent to the urban background station. Next to the sampling place, there are housing estates and a two-lane dual carriageway. The sampling place is about 2 km from the city center.
2.2. Sampling
Sampling was performed between 1 February 2020 and 27 March 2021 for 24 h every three days (start and stop at 8 a.m.—110 samples in total). Some of the sampling days were omitted due to a temporary suspension of the research. PM2.5 samples were collected on Teflon filters (GE’s Whatman, PTFE 46.2 mm, 2.0 µm), by the use of a low-volume (2.3 ) sampler (Sequential 47/50-CD with Peltier cooler, Sven Leckel GmbH, Berlin, Germany). The concentration of the PM2.5 fraction was determined. The PM2.5 mass of the filters was measured before and after sampling. The filters were stored at 20 ± 1 °C and a humidity of 50 ± 5% for 24 h before weighing.
2.3. Multi-Wavelength Absorption Black Carbon Instrument
The Teflon filters were analyzed for black carbon by MABI. Multi-wavelength Absorption Black carbon Instrument (MABI) measures light transmission at seven different wavelengths: 405 nm (UV), 465 nm, 525 nm, 639 nm, and infrared 870 nm, 940 nm, and 1050 nm. MABI was developed by the Australian Nuclear Science and Technology Organisation (www.ansto.gov.au- accessed on 1 February 2021). This instrument consists of the optical assembly and electronic case. The instrument optics include, among others, the multi-wavelength light source (7 LEDs), sampler holder, and photo-detector. In the instrument, the opaque glass is used to scatter the scattered light back through the filter to the detector [13]. The calibration is performed automatically two times before measurements, checked after every five samples measured and saved by the MABI software application.
The transmission of samples before and after sampling was measured by MABI. The transmission of unexposed filters was measured at each wavelength from the filter substrate—the obtained data is called I0. The measurements were repeated on the same filter after sampling (exposed filters) to have the transmission at each wavelength from filter substrate and collection particles—this data is called I. Based on these values (I0 and I), the exposed filter area and sampled air volume, the light absorption coefficients babs were determined at each wavelength with the following equation:
where and are the light transmission through an unexposed filter and an exposed filter. Parameter is the collection area of the exposed filter and is the volume of sampled air on the filter .
The black carbon (BC) mass concentration was obtained using a mass absorption coefficient at each wavelength from:
The MABI manual presents tests, results, and mass absorption coefficients for different types of filters. Following the study presented by Atanacio et al., David D. Cohen, Taha et al. [12,13,14], Equation (3) was presented below and the value of the mass absorption coefficient for λ = 639 nm was assumed as , which was recommended for 47 mm Teflon filters by ANSTO. Furthermore, eBC concentrations were calculated from the formula 3 for λ = 639 nm. The authors assumed a scattering correction (C) and loading correction (R) based on the deep discussion presented in [13]. Value 6.0 m2 g−1 was evaluated taking into account the scattering effect and loading effect. In our study, values of the loading effect (R = 0.57) were similar to that given by Cohen [13]. The mass absorption coefficient for each wavelength was estimated using the following calculation formulas, where :
Figure 1 shows ln(Io/I) plot for λ = 405 nm versus ln(Io/I) for λ = 639 nm. The gradient obtained for the wavelength 405 nm versus ln(Io/I) for λ = 639 nm was used to determine the mass absorption coefficient by Equation (4). The value of the mass absorption coefficient for λ = 639 nm was taken from the report written by Cohen and it was equal to 6.0 m2 g−1 [13]. Repeating the plots of Figure 1 for all wavelengths between 405 nm and 1050 nm, mass absorption coefficients for each wavelength were determined and were in the range 4.4 to 8 m2 g−1. The uncertainty of epsilon was 1%. BCbb concentrations were calculated by subtracting the BC concentration of 1050 nm from the BC concentration for 405 nm.
3. Results and Discussion
3.1. Mass Absorption Coefficients (ε) and Absorption Coefficients (babs)
The raw data obtained by MABI were calculated according to the methodology described above and were transformed mass absorption coefficient (ε), equivalent black carbon (eBC) mass concentrations. The mass absorption coefficient for wavelength is presented as:
where a, are constants and is the absorption angstrom exponent.
Figure 2 shows the mass absorption coefficient values for each wavelength. The fitted coefficients were a = 285 and α = 0.6. The correlation was very strong with power dependence and the coefficient of least squares R2 > 0.99. The shape of the fit curve was as expected, and the mass absorption coefficient values were within the range of 4.4–8 which is consistent with the recommendations [14]. An analysis of 8 years of aerosol data at Mascot in Sydney yielded a value of ε = 7 ± 3 m2 g–1, which agrees well with the experimentally determined value for the black carbon samples [12].
In Figure 3, the light absorption coefficients (babs) fluctuated during the whole sampling time. The light absorption coefficient had higher values for February, March, November, December and January than for the June–July periods. This suggests that during the cold season there were increased emissions of eBC, for instance, from coal combustion in a residential area. The shape of the curve and values for light absorption coefficients (babs) can be compared, and it is similar to the value babs given by research from Greece, 2017 [2].
3.2. The E-Black Carbon Concentrations (eBC) and the Black Carbon Related to Biomass Burning (BCbb)
The red curve in Figure 4 is the equivalent black carbon estimate from MABI using 639 nm data. These data include, among others, smoke components, diesel, fossil fuels, etc. The values were obtained by subtracting the BC in µg m−3 (1050 nm) data from BC in µg m−3 (450 nm) data; the green curve represents mainly BCbb from biomass burning. The transmission of particulate matter in the range of wavelengths from 405–1050 nm strongly depends on a range of different particle diameters. Solid, spherical particles with a diameter of 100 nm to 300 nm are formed at high temperatures, such as in fossil fuels combustion. However, particles formed at a lower temperature, such as in biomass burning, can be larger and non-spherical. The carbon particles generated by low temperature absorb at ultraviolet, whereas high temperature absorbs more in the infrared [13]. Michalik conducted studies on scanning electron microscopes with EDX particles collected in Krakow [15,16]. He presented that particles also have a small size (the range of nanometers) and spherical nature when they originate from fossil fuels combustion, whereas larger particles (in the range of micrometers) originate from biomass burning. Considering the number of the particles, submicron particles strongly dominated with a high content of ultrafine particles (nanoparticles). Tar ball-type particles were relatively common in the studied samples in Krakow, while soot was the dominant component. Soot was present as small as well as bigger agglomerates [15,16]. The eBC and BCbb (biomass burning) concentrations were in the range of 0.82–11.64 and 0.007–0.84 , respectively. At the same time, PM2.5 concentrations varied from 3.14 to 55.24 . This means that eBC, on average, accounts for 19%–24% of PM2.5. However, the values of BC from biomass burning were similar to values obtained by Christian et al. in Calaca, where mean values were 0.67 μg m−3 for the 2019 winter [17,18]. It can be seen in Figure 4 and Figure 5, that the values of BC increased during March (2020, 2021), November, December (2020) and February (2021), but in May, June and July they were lower, and this was the effect of emissions from fossil fuel combustion. Moreover, windless weather and low temperature are responsible for the lack of air movement and the accumulation of pollution in one place, which should follow the concentration of PM2.5 and eBC in the city. Interestingly, the low values of concentration of eBC for February 2020 were confirmed in a low concentration PM2.5
The exposed filter from 25 February 2021 (25-02-2021 in Figure 4) was the blackest, which is visually evident when compared with all exposed filters, and this is a confirmation of the highest eBC values for that day.
Figure 6 presents the seasonal concentration, where the seasons consist of: spring—March, April, May (2020); summer—June, July, August (2020); autumn—September, October, November (2020); winter—December (2020), January, February (2021). The mean values of eBC concentration are the highest for winter and the lowest for summer. Furthermore, eBC presented a high concentration in winter (5.3 ± 1.8 µg m−3) to be compared with 2.2 ± 0.5 µg m−3 in summer. The PM2.5 concentration was equal to 28 ± 0.2 µg m−3 and 13 ± 0.2 µg m−3 for winter and summer, respectively. The values—concentrations of BCbb—show seasonal variations with the highest value in winter (0.4 ± 0.3 µgm−3) and the lowest in summer (0.2 ± 0.1 µg m−3). In winter, biomass burning can be used for heating purposes. The study was performed by Tobler et al. for the same site, however, the PM1 fraction was determined at a much higher average value of BC concentration for 2018/2019 for traffic and biomass burning together with coal combustion, and was equal to 6 µg m−3 and 7.5 µg m−3, respectively [19]. The values of eBC and BCbb obtained in the present study are close to the values measured for Zabrze in 2019 (southern Poland—located near Krakow) by Ziola et al., 2021, and were equal to 4.70 ± 3.13 µg m−3 and 1.75 ± 1.26 µg m−3 for the heating and non-heating season, respectively [11]. Manohar et al. obtained eBC for 2019/2020 for the PM2.5 fraction at a Liverpool site with values in the range of 0.2–6 µg m−3 [20]. Kebe et al. measured an eBC concentration value equal to 3.6 ± 0.5 µg m−3 for the PM2.5 fraction for 2018/2019 at Dakar in Senegal [21].
Based on Figure 7, it can be seen that the concentration of eBC was higher for workdays than weekends by around 21%. It can be in connection with more intense traffic during workdays than on weekends.
Figure 8 presents the daily concentrations of PM2.5 and eBC during 14 months. Especially during the cold period (November, December, January, February, March). However, the concentration of PM2.5 had lower values in May, June, and July (also in Figure 5). In this season, the values of eBC were in the range of 2.2–3.7 µg m−3, whereas during winter it was in the range of 2.5–11.6 µg m−3. The variability in eBC concentrations was higher during winter than in summer.
Table 1 also shows that eBC concentrations followed those of PM2.5. In winter, the values of PM2.5 and eBC were picked in comparison to other seasons, and the values in summer were the lowest.
In Table 1, the eBC represents the values of concentration (μg m−3) which were obtained for λ = 639 nm; the BCbb—the values were obtained for λ = 405–1050 nm. The annual period of mean sampling was from March 2020 to February 2021, and the full period was from February 2020 to March 2021. The presented results show that BCbb has higher values in winter than summer and autumn, which was connected to increased emissions from biomass burning in the cold period. The values for eBC, which were obtained in this study, were similar to the result from the previous study presented by Cruz et al., which was carried out during one year in 2018, and by Reche et al. in 2009 [22,23,24].
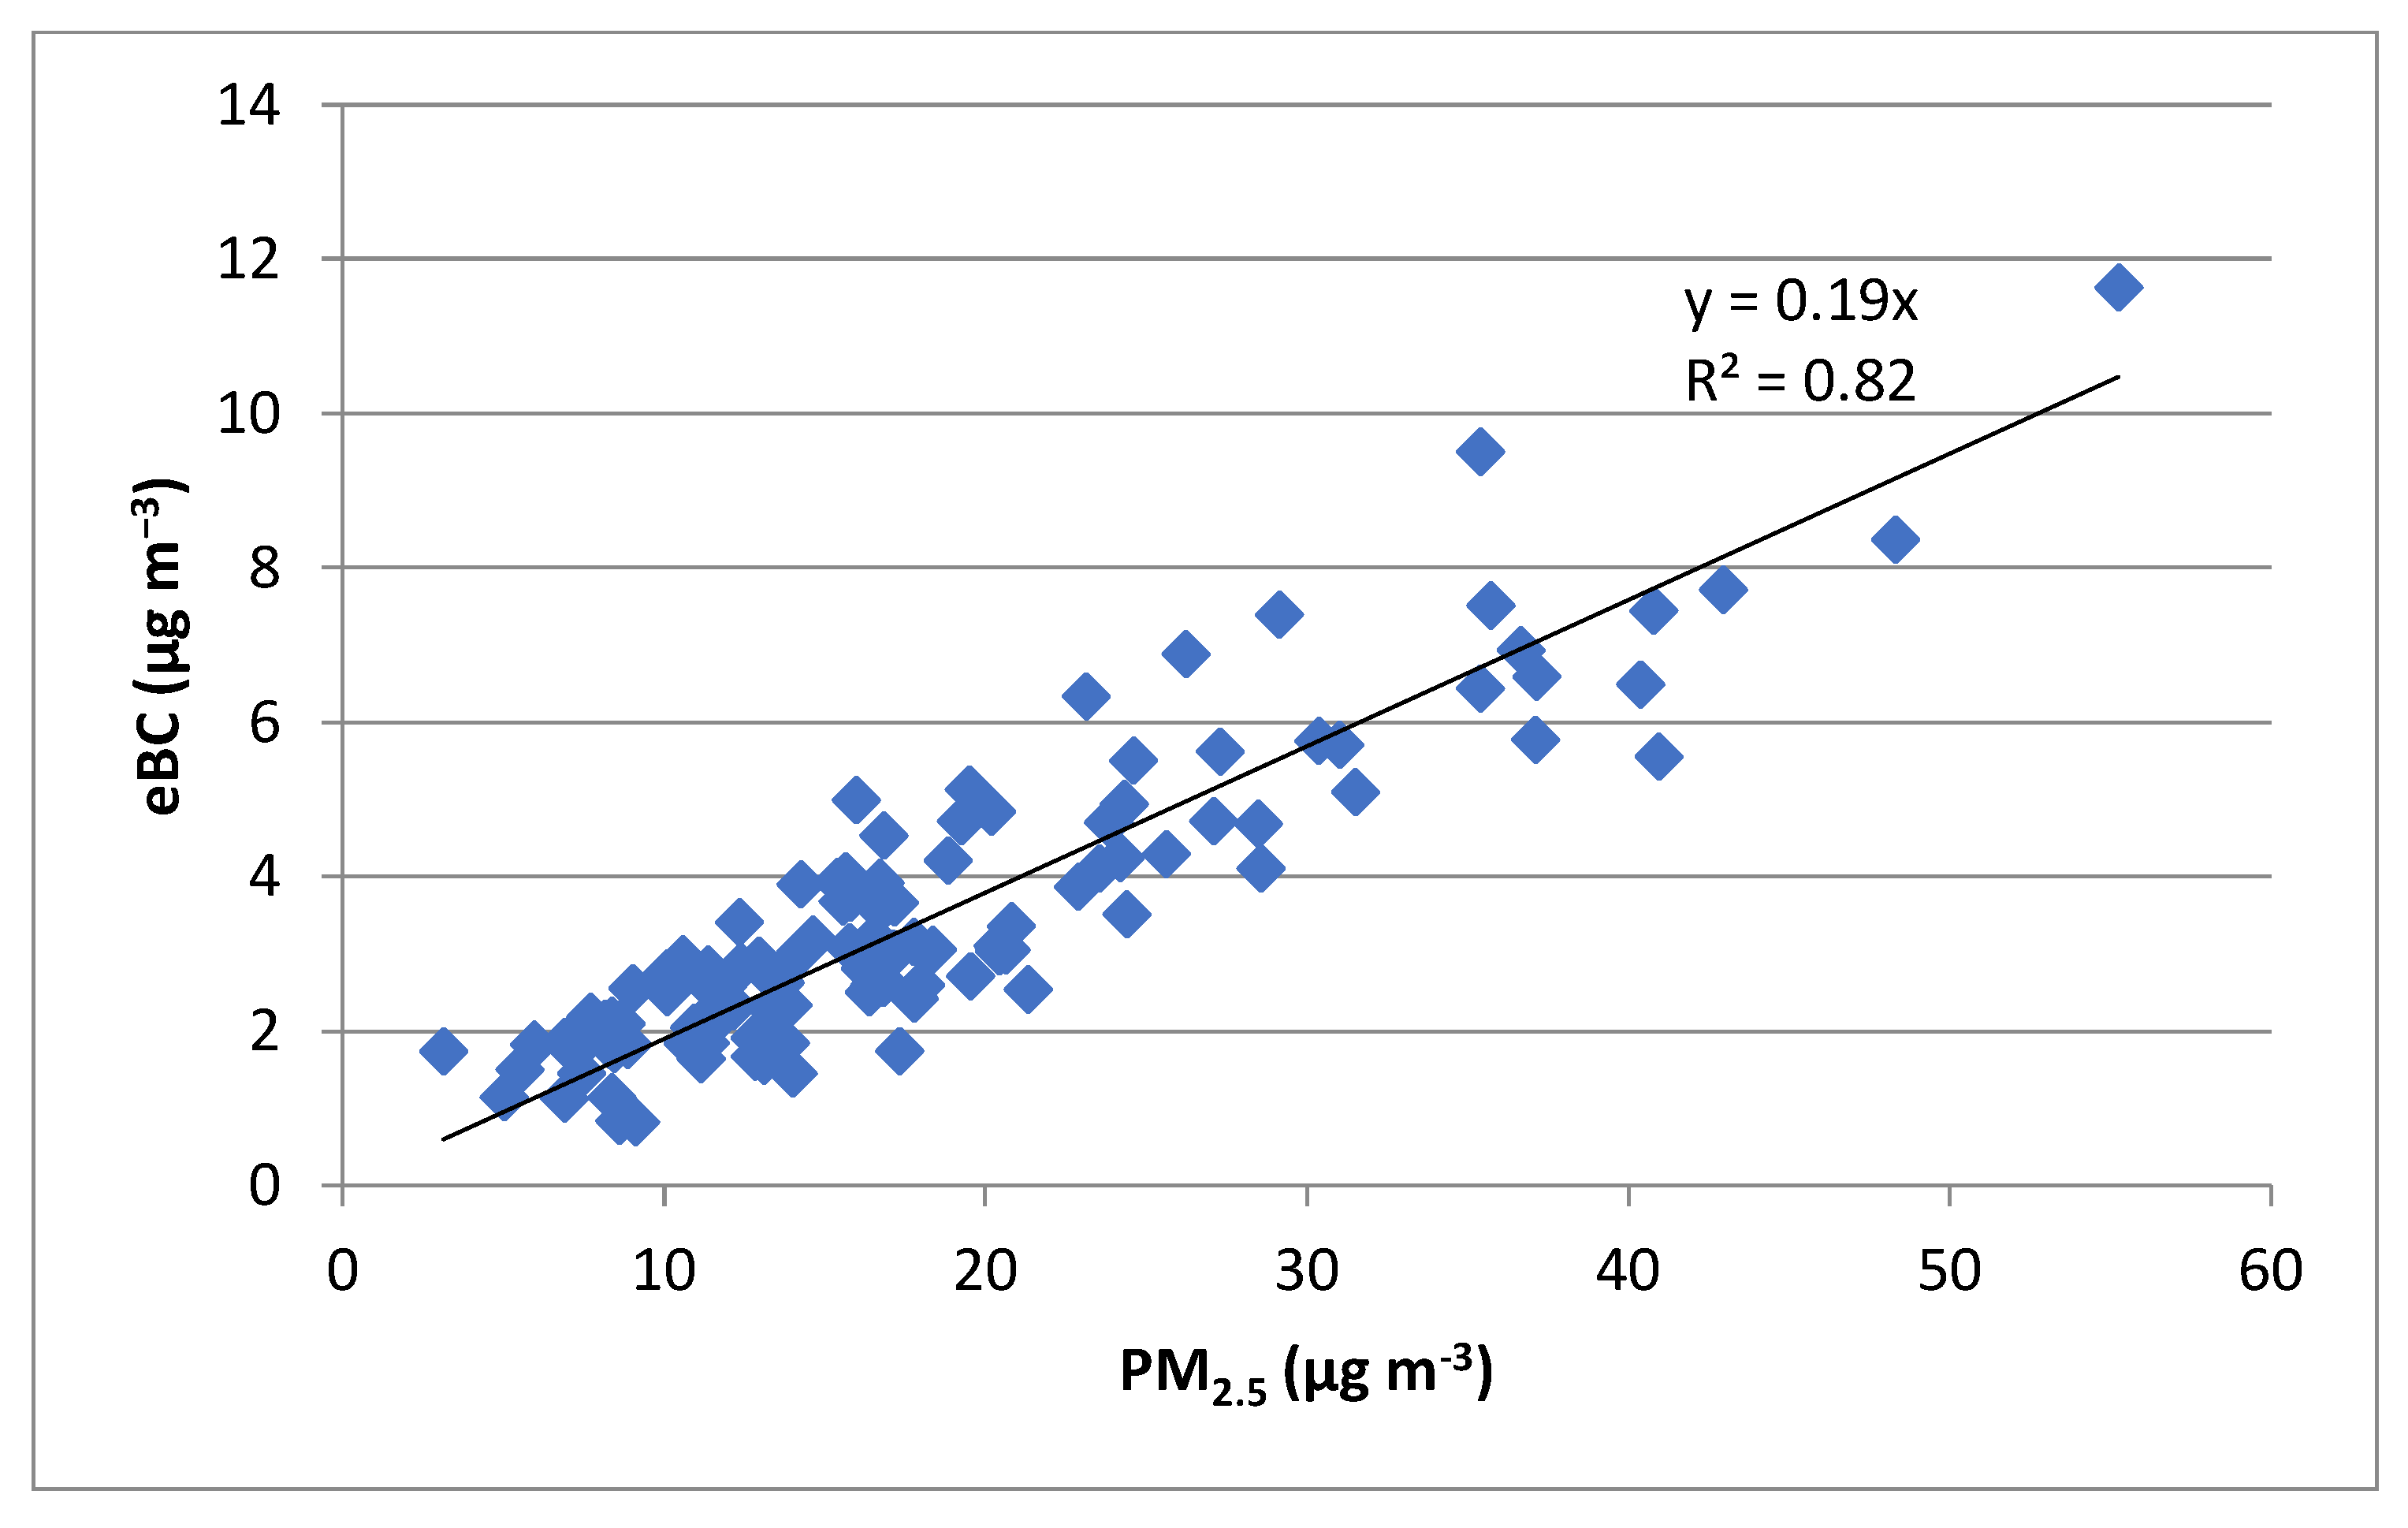
Moreover, reported in this study, the eBC concentration for 639 nm was similar to that given by Atanacio et al., 2020. The analysis, which is presented in Figure 9, shows the relationship between eBC versus PM2.5, which was confirmed by a correlation. Based on this graph, it can be concluded that about 19% of PM2.5 mass belongs to eBC. Similar events were also observed in other studies, where the ratio BC/PM2.5 was equal to 21% and 13% in Liverpool and Newcastle, respectively [17,25].
4. Conclusions
To develop a strategy for lowering the concentration of black carbon in air particulate matter, it is crucial to determine its sources firstly. The optical absorption method allows for assessing concentrations of equivalent black carbon together with the contribution of different sources to eBC. The present study describes seasonal variations of eBC concentrations together with the methodology for the determination of eBC concentrations in the PM2.5 fraction. What is more, we present the result with an extensive analysis of the annual period. Our work proves that fossil fuel contribution to PM2.5 mass is higher in winter than in warm seasons. Furthermore, eBC concentrations were equal to 5.3 ± 1.8 µg m−3 and 2.2 ± 0.5 µg m−3 in winter and summer, respectively. The contribution of fossil fuel is higher than biomass burning during the whole sampling period. The annual contribution of eBC to PM2.5 mass was equal to 21%. Moreover, the variability of the concentrations of eBC and biomass burning were lower during May, June and July than in the cold period. Our study presents results from the year 2020/2021, just after introducing the ban on using coal and wood for heating purposes in Krakow, in September 2019. Future research in which equivalent black carbon will be measured for PM2.5 fraction for the year 2018/2019 for the same site will be very useful.
Author Contributions
Conceptualization, L.S.; data curation, A.R.; formal analysis, A.R.; funding acquisition, L.S.; methodology, A.R.; writing—original draft, A.R.; writing—review and editing, L.S. All authors have read and agreed to the published version of the manuscript.
Funding
This research received no external funding.
Institutional Review Board Statement
Not applicable.
Informed Consent Statement
Not applicable.
Data Availability Statement
The datasets generated during and/or analysed during the current study are available from the corresponding author on reasonable request.
Acknowledgments
The International Atomic Energy Agency, project number RER/7/012 partially financed this work together with the subsidy of the Ministry of Science and Higher Education, grant number 16.16.220.842. This research project was supported/partly supported by the program “Excellence initiative—research university” for the University of Science and Technology.
Conflicts of Interest
The authors declare no conflict of interest.
References
- Petzold, A.; Ogren, J.A.; Fiebig, M.; Laj, P.; Li, S.M.; Baltensperger, U.; Holzer-Popp, T.; Kinne, S.; Pappalardo, G.; Sugimoto, N.; et al. Recommendations for reporting black carbon measurements. Atmos. Chem. Phys. 2013, 13, 8365–8379. [Google Scholar] [CrossRef] [Green Version]
- Diapouli, E.; Kalogridis, A.C.; Markantonaki, C.; Vratolis, S.; Fetfatzis, P.; Colombi, C.; Eleftheriadis, K. Annual variability of black carbon concentrations originating from biomass and fossil fuel combustion for the suburban aerosol in Athens, Greece. Atmosphere 2017, 8, 234. [Google Scholar] [CrossRef] [Green Version]
- European Environment Agency. Status of Black Carbon Monitoring in Ambient Air in Europe; Publications Office of the European Union: Luxemburg, 2013. [Google Scholar]
- Bond, T.C.; Bergstrom, R.W. Light Absorption by Carbonaceous Particles: An Investigative Review. Aerosol Sci. Technol. 2006, 40, 27–67. [Google Scholar] [CrossRef]
- U.S. EPA (U.S. Environmental Protection Agency). Report to Congress on Black Carbon; Department of the Interior, Environment, and Related Agencies Appropriations Act; U.S. Environmental Protection Agency: Washington, DC, USA, 2012.
- Jacobson, M.Z. Strong radiative heating due to the mixing state of black carbon in atmospheric aerosols. Nature 2001, 409, 695–697. [Google Scholar] [CrossRef] [PubMed]
- Liu, Q.; Ma, T.; Olson, M.R.; Liu, Y.; Zhang, T.; Wu, Y.; Schauer, J.J. Temporal variations of black carbon during haze and non-haze days in Beijing. Sci. Rep. 2016, 6, 33331. [Google Scholar] [CrossRef] [PubMed]
- Horvath, H. Atmospheric light absorption—A review. Atmos. Environ. Part A Gen. Top. 1993, 27, 293–317. [Google Scholar] [CrossRef]
- Lack, D.; Moosmuller, H.; McMeeking, G.; Chakrabarty, R.; Baumgardner, D. Characterizing elemental, equivalent black, and refractory black carbon aerosol particles: A review of techniques, their limitations and uncertainties. Anal. Bioanal. Chem. 2013, 406, 99–122. [Google Scholar] [CrossRef] [PubMed] [Green Version]
- Petzold, A.; Schönlinner, M. Multi-angle absorption photometry—A new method for the measurement of aerosol light absorption and atmospheric black carbon. J. Aerosol Sci. 2004, 35, 421–441. [Google Scholar] [CrossRef]
- Zioła, N.; Błaszczak, B.; Klejnowski, K. Temporal Variability of Equivalent Black Carbon Components in Atmospheric Air in Southern Poland. Atmosphere 2021, 12, 119. [Google Scholar] [CrossRef]
- Taha, G.; Box, G.P.; Cohen, D.D.; Stelcer, E. Black carbon measurement using laser integrating plate method. Aerosol Sci. Technol. 2007, 41, 266–276. [Google Scholar] [CrossRef] [Green Version]
- Cohen, D.D. Summary of Light Absorbing Carbon and Visibility Measurements and Terms; ANSTO External Report ER-790; Australian Nuclear Science and Technology Organisation: Sydney, Australia, 2020; ISBN 1 921268 32 8. [Google Scholar]
- Atanacio, A.J.; Cohen, D.D.; Button, D.; Paneras, N.; Garton, D. Multi-wavelength Absorption Black Carbon Instrument (MABI) Manual. Available online: https://www.ansto.gov.au/media/2716/download (accessed on 8 February 2020).
- Michalik, M.; Brzezanski, M.; Wilczyńska-Michalik, W.; Fisior, K.; Klimas, B.; Samek, L.; Pietras, B. Characterisation of solid particles emitted from diesel and petrol engines as a contribution to the determination of the origin of carbonaceous particles in urban aerosol. In IOP Conference Series: Materials Science and Engineering; IOP Publishing: Bristol, UK, 2016; Volume 148, p. 12079. [Google Scholar] [CrossRef] [Green Version]
- Wilczyńska-Michalik, W.; Rózańska, A.; Bulanda, M.; Chmielarczyk, A.; Pietras, B.; Michalik, M. Physicochemical and microbiological characteristics of urban aerosols in Krakow (Poland) and their potential health impact. Environ. Geochem. Health 2021, 43, 4601–4626. [Google Scholar] [CrossRef] [PubMed]
- Duc, H.N.; Shingles, K.; White, S.; Salter, D.; Chang, L.-C.; Gunashanhar, G.; Riley, M.; Trieu, T.; Dutt, U.; Merched, A.; et al. Spatial-Temporal Pattern of Black Carbon (BC) Emission from Biomass Burning and Anthropogenic Sources in New South Wales and the Greater Metropolitan Region of Sydney, Australia. Atmosphere 2020, 11, 570. [Google Scholar] [CrossRef]
- Tuso, C.A.T.; Magtaas, R.A.H.; Punzalan, J.M.; Yee, J.R.; Bautista, A.T.; Pabroa, P.C.B. Air particulate matter, black carbon, and elemental concentrations and source apportionment in Calaca, Batangas. Philipp. J. Sci. 2020, 149, 117–127. [Google Scholar]
- Tobler, A.K.; Skiba, A.; Canonaco, F.; Močnik, G.; Rai, P.; Chen, G.; Bartyzel, J.; Zimnoch, M.; Styszko, K.; Nęcki, J.; et al. Characterization of non-refractory (NR) PM1 and source apportionment of organic aerosol in Kraków, Poland. Atmos. Chem. Phys. 2021, 21, 14893–14906. [Google Scholar] [CrossRef]
- Manohar, M.; Atanacio, A.; Button, D.; Cohen, D. MABI—A multi-wavelength absorption black carbon instrument for the measurement of fine light absorbing carbon particles. Atmos. Pollut. Res. 2021, 12, 133–140. [Google Scholar] [CrossRef]
- Kebe, M.; Traore, A.; Manousakas, M.-I.; Vasilatou, V.; Ndao, A.; Wague, A.; Eleftheriadis, K. Source Apportionment and Assessment of Air Quality Index of PM2.5-10 and PM2.5 in at Two Different Sites in Urban Background Area in Senegal. Atmosphere 2021, 12, 182. [Google Scholar] [CrossRef]
- Cruz, M.T.; Cruz, M.T.; Bañaga, P.A.; Betito, G.; Braun, R.A.; Stahl, C.; Aghdam, M.A.; Obiminda Cambaliza, M.; Dadashazar, H.; Hilario, M.R.; et al. Size-resolved composition and morphology of particulate matter during the southwest monsoon in Metro Manila, Philippines. Atmos. Chem. Phys. 2019, 19, 10675–10696. [Google Scholar] [CrossRef] [Green Version]
- Reche, C.; Querol, X.; Alastuey, A.; Viana, M.; Pey, J.; Moreno, T.; Rodriguez, S.; González, Y.; Fernández-Camacho, R.; de la Rosa, J.; et al. New considerations for PM, Black Carbon and particle number concentration for air quality monitoring across different European cities. Atmos. Chem. Phys. 2011, 11, 6207–6227. [Google Scholar] [CrossRef] [Green Version]
- Stahl, C.; Cruz, M.T.; Bañaga, P.A.; Betito, G.; Braun, R.A.; Aghdam, M.A.; Cambaliza, M.O.; Lorenzo, G.R.; MacDonald, A.B.; Pabroa, P.C.; et al. An annual time series of weekly size-resolved aerosol properties in the megacity of Metro Manila, Philippines. Sci. Data 2020, 7, 128. [Google Scholar] [CrossRef] [PubMed]
- Cohen, D.D.; Taha, G.; Stelcer, E.; Garton, D.; Box, G. The Measurement and Sources of Fine Particle Elemental Carbon at Several Key Sites in NSW over the Past Eight Years. In Proceedings of the 15th International Clean Air Conference, Sydney, Autralia, 27–30 November 2000; pp. 485–490. [Google Scholar]
Figure 1.
The plot of ln(I0/I) for λ = 405 nm versus ln(I0/I) for λ = 639 nm, where , and for the sampling from the Krakow site.
Figure 1.
The plot of ln(I0/I) for λ = 405 nm versus ln(I0/I) for λ = 639 nm, where , and for the sampling from the Krakow site.
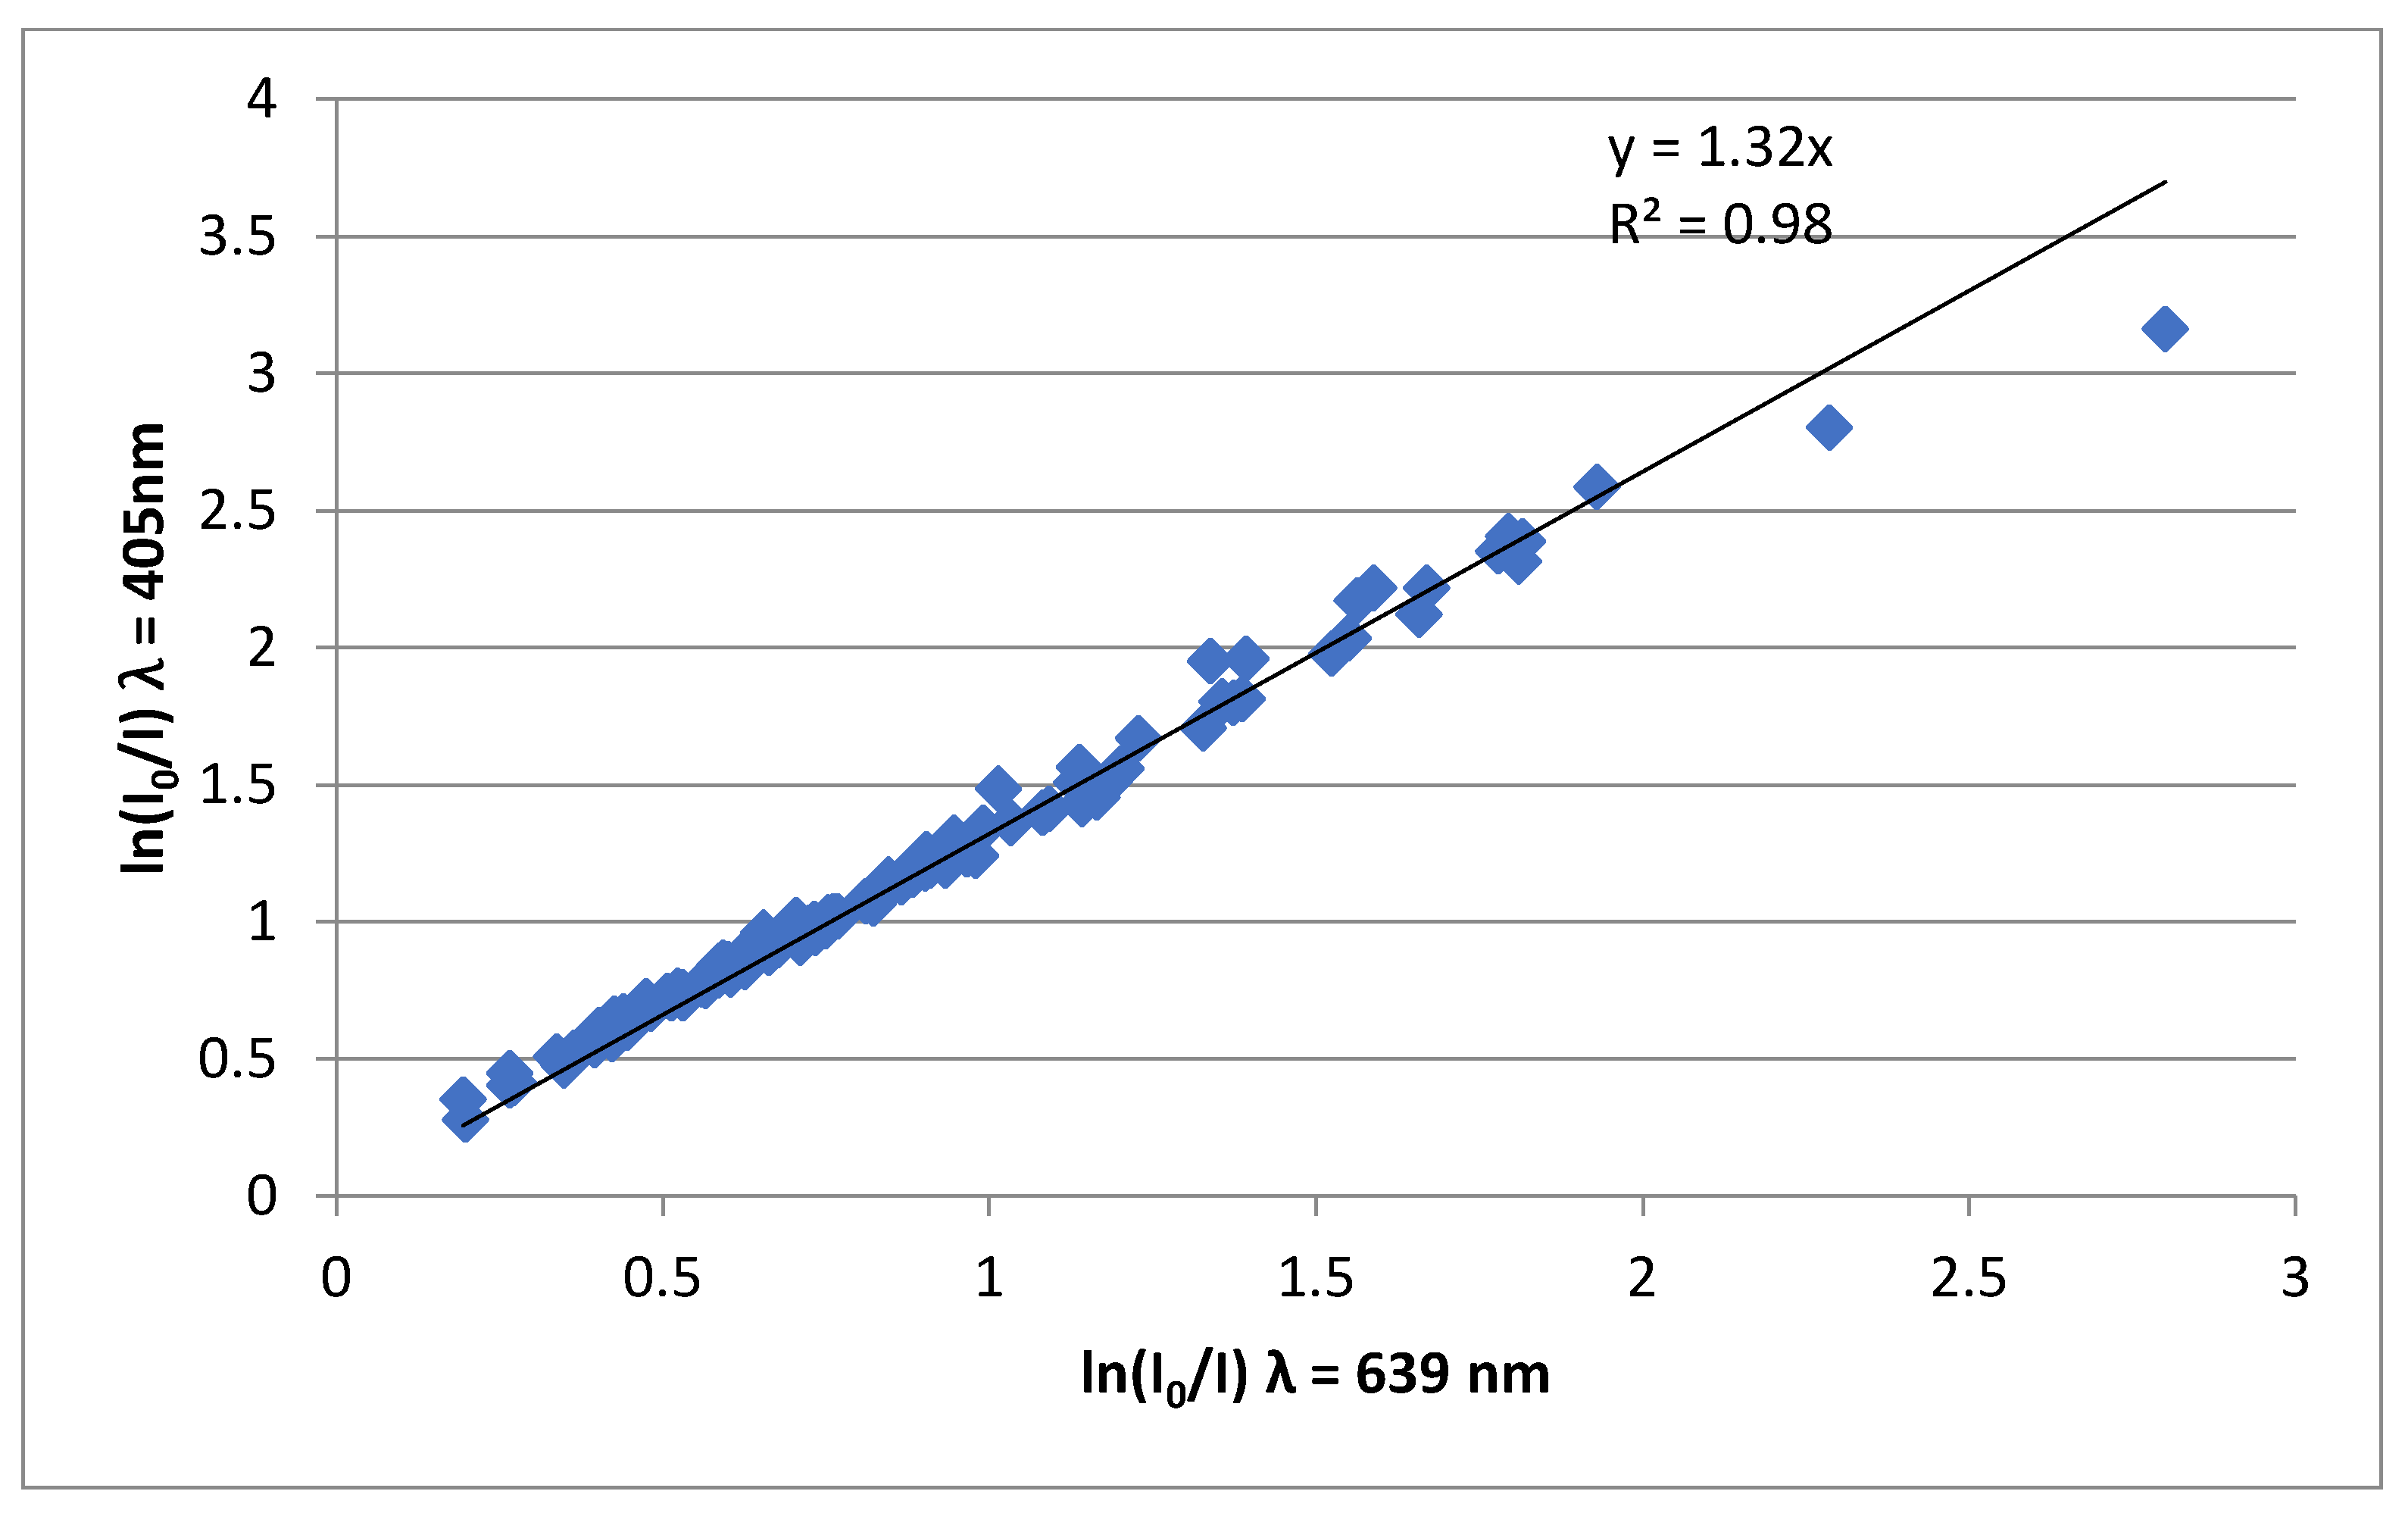
Figure 2.
The mass absorption coefficient (ε) versus wavelength (λ) obtained for sampling from the Krakow site.
Figure 2.
The mass absorption coefficient (ε) versus wavelength (λ) obtained for sampling from the Krakow site.
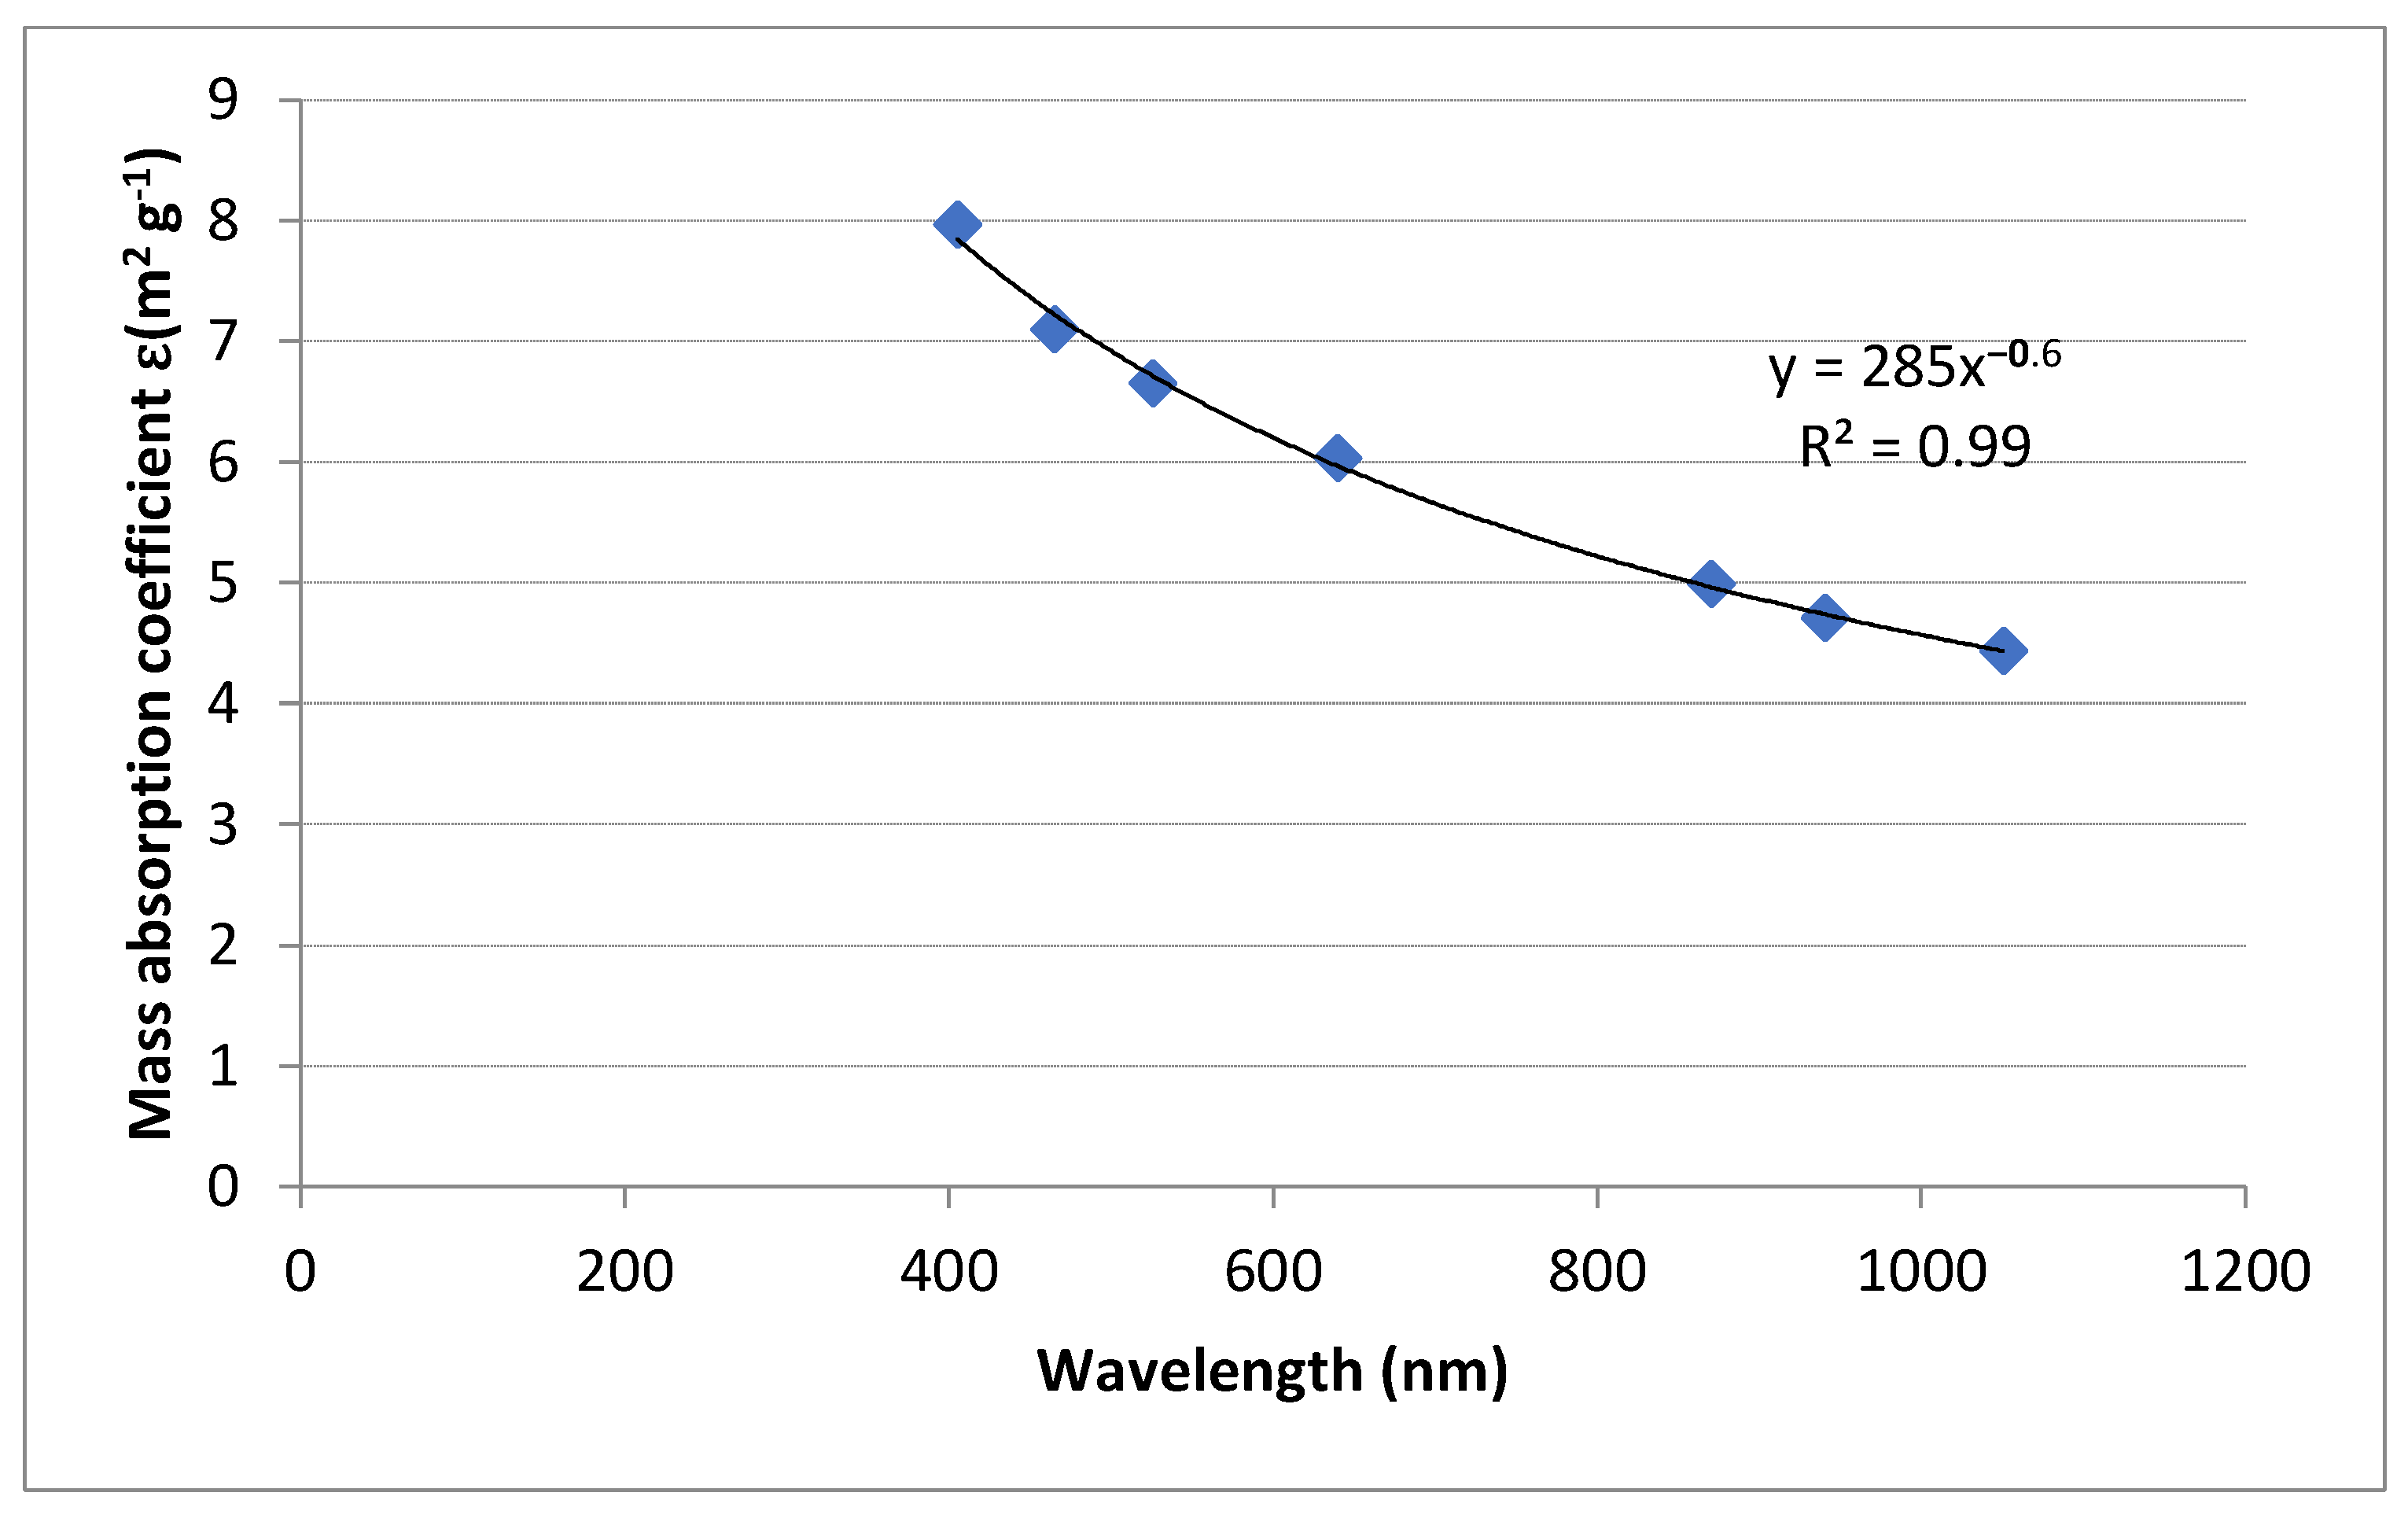
Figure 3.
The light absorption coefficients (babs) at seven wavelengths (nm) for sampling from Krakow during February 2020–March 2021 in 10−6 m−1.
Figure 3.
The light absorption coefficients (babs) at seven wavelengths (nm) for sampling from Krakow during February 2020–March 2021 in 10−6 m−1.
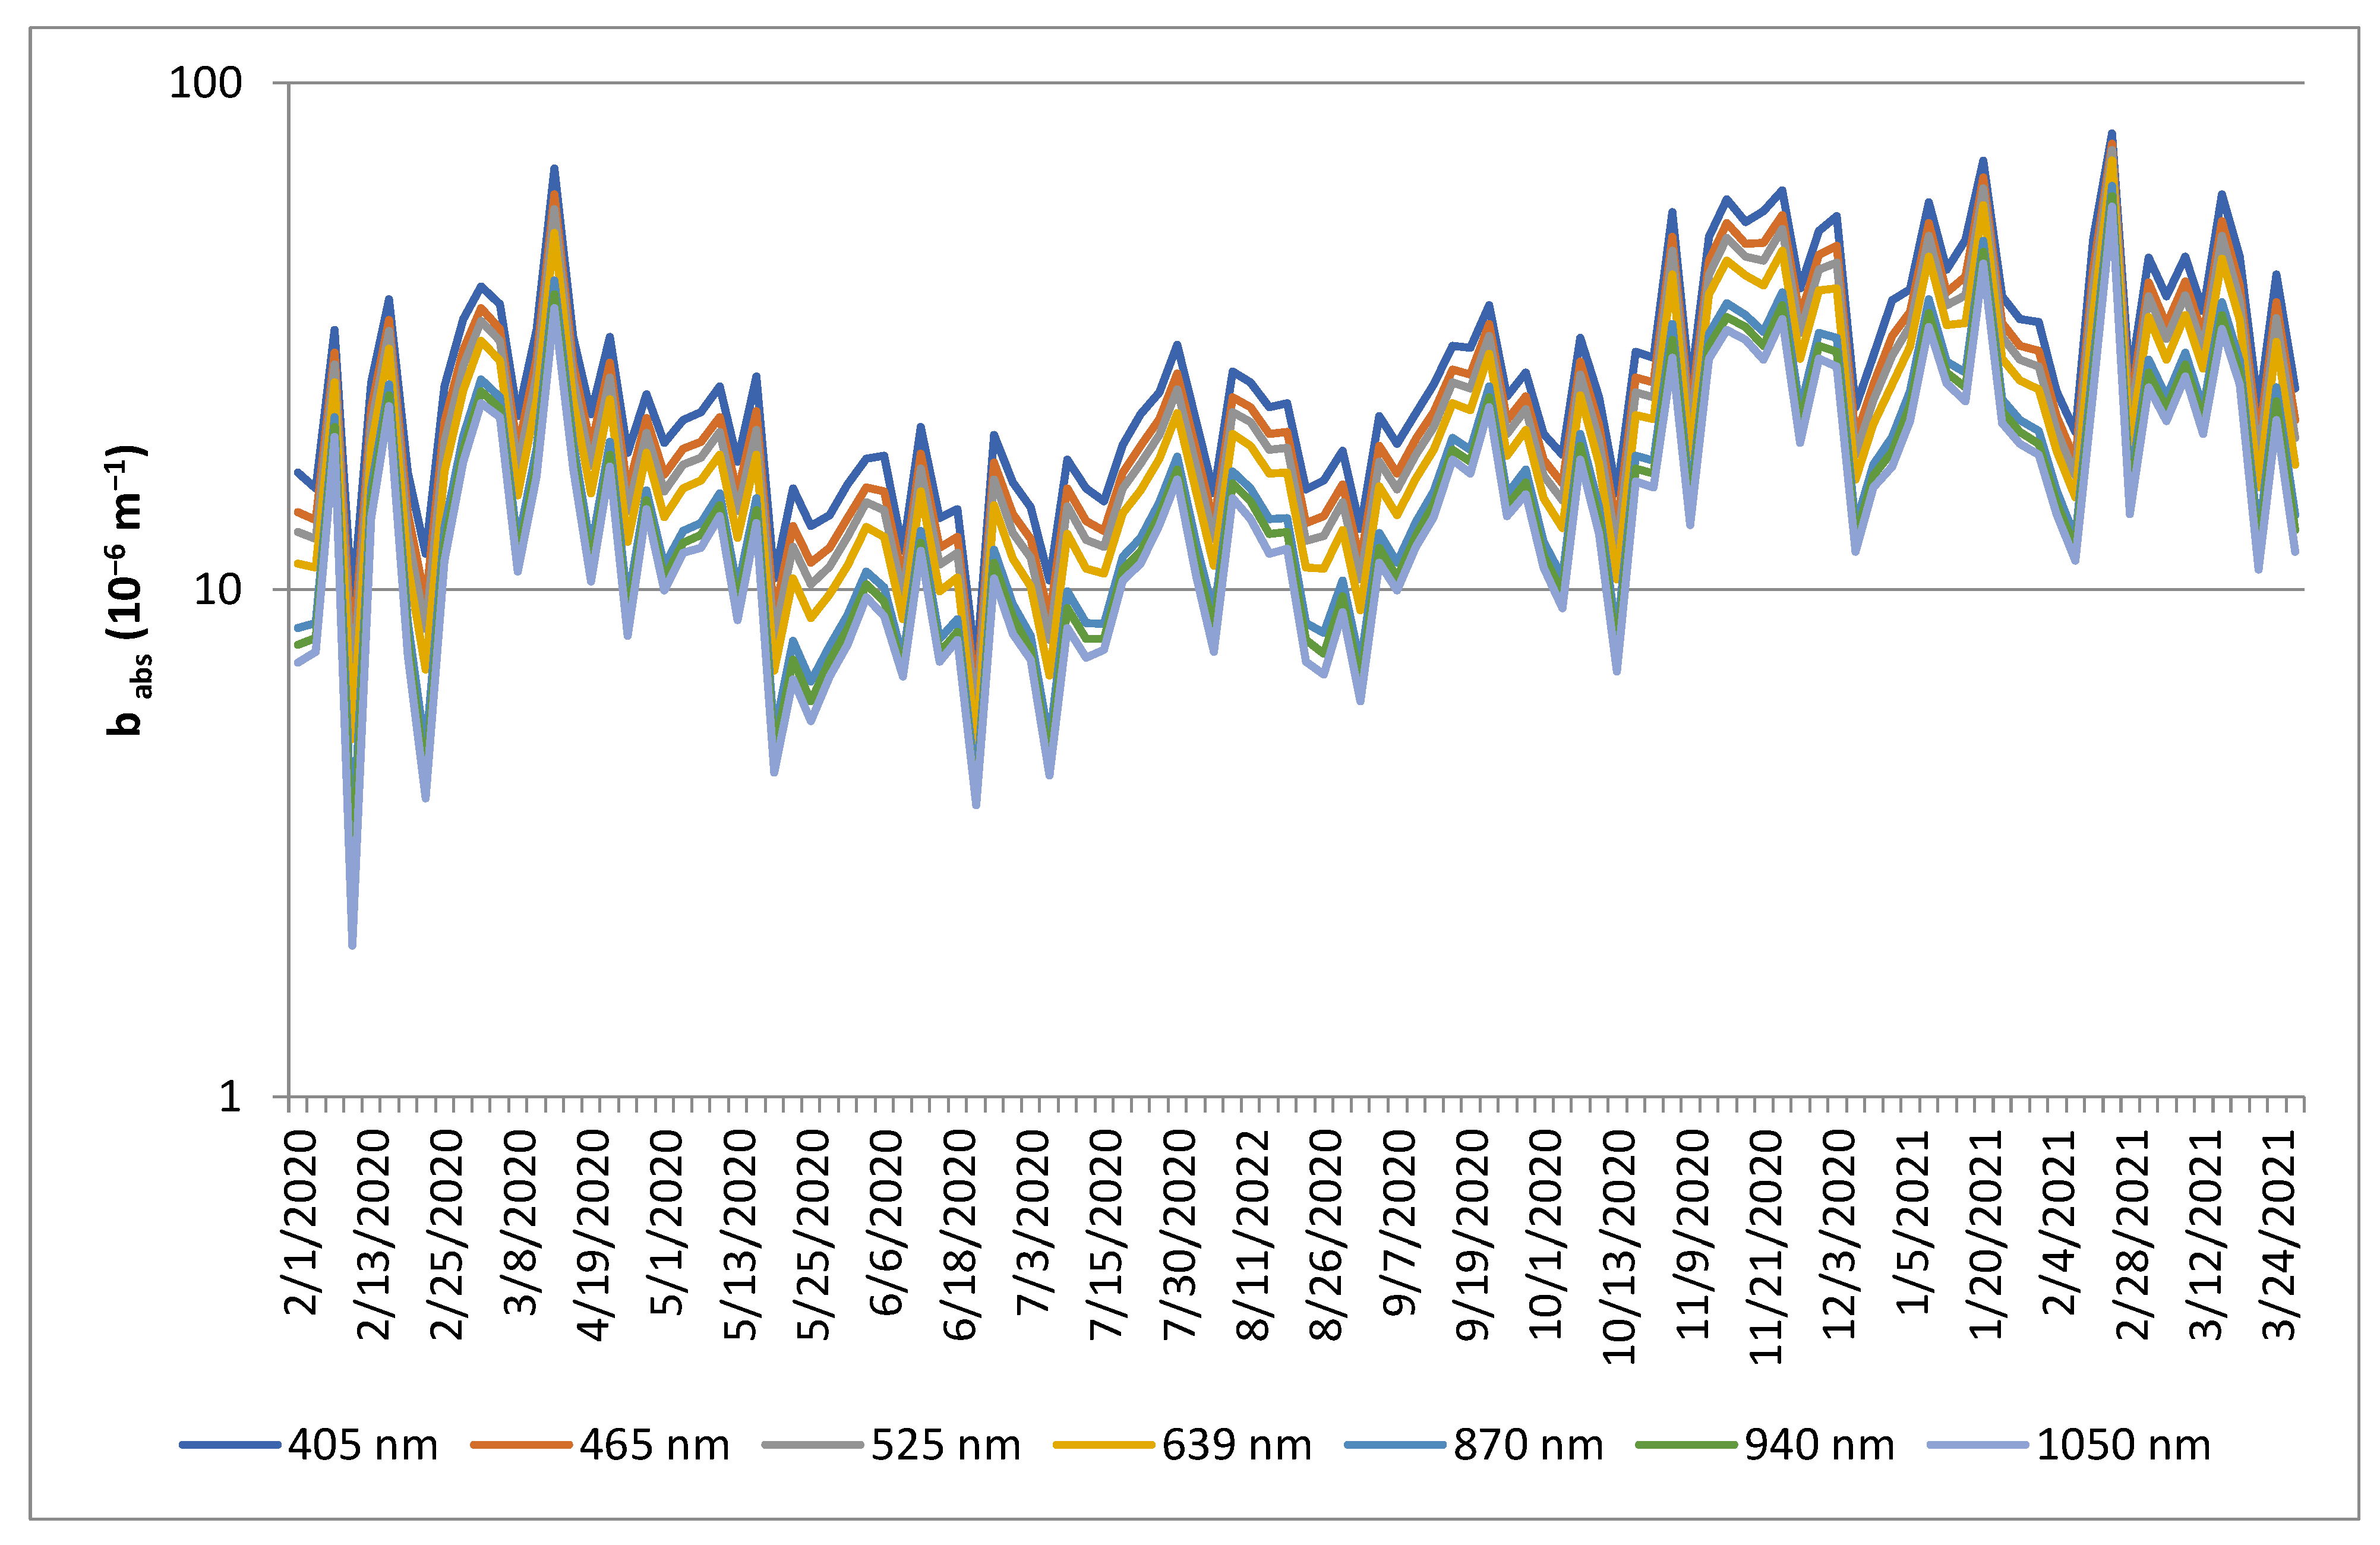
Figure 4.
Comparison of daily concentrations between eBC and BCbb in μg m−3 and temperature in °C for sampling from Krakow during February 2020–March 2021. The values of temperature were taken from the webpage: http://meteo.fis.agh.edu.pl/ (accessed on 8 December 2021)–“created by author”.
Figure 4.
Comparison of daily concentrations between eBC and BCbb in μg m−3 and temperature in °C for sampling from Krakow during February 2020–March 2021. The values of temperature were taken from the webpage: http://meteo.fis.agh.edu.pl/ (accessed on 8 December 2021)–“created by author”.

Figure 5.
Mean monthly concentrations of eBC and BCbb together with PM2.5 in μg m−3 for sampling from Krakow during 2020–2021.
Figure 5.
Mean monthly concentrations of eBC and BCbb together with PM2.5 in μg m−3 for sampling from Krakow during 2020–2021.
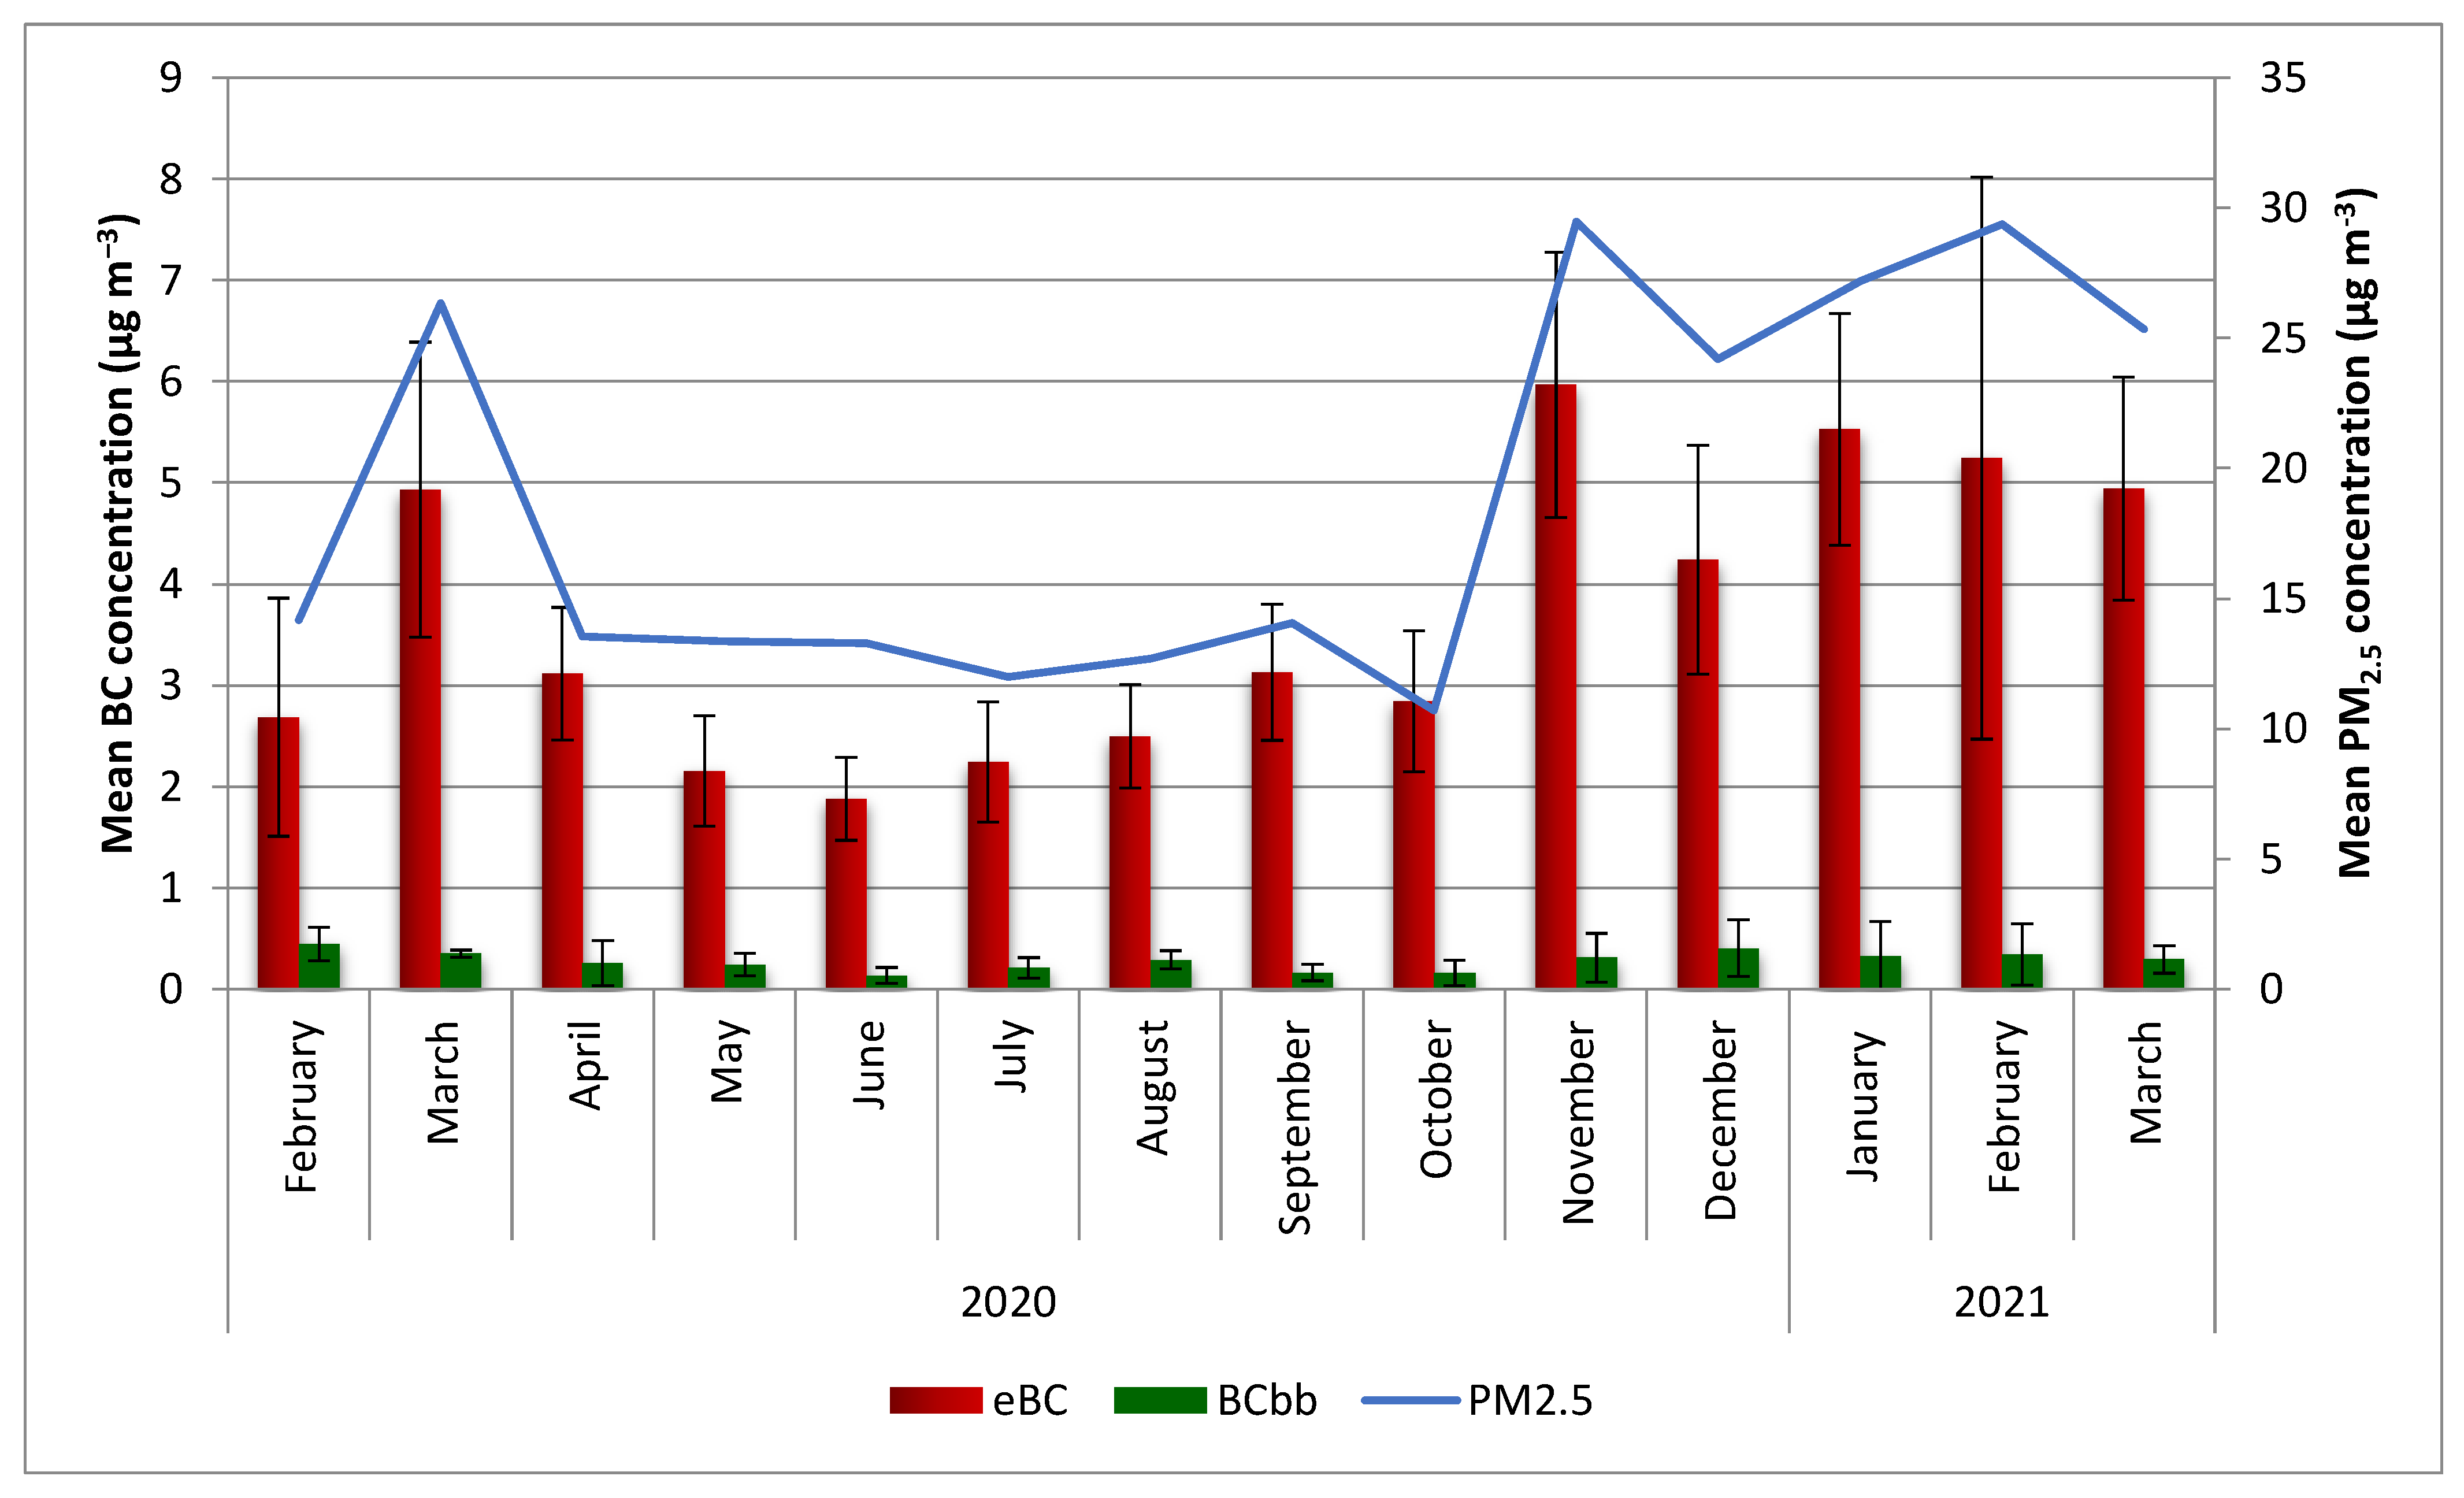
Figure 6.
Seasonal concentrations of eBC and BCbb in μg m−3.
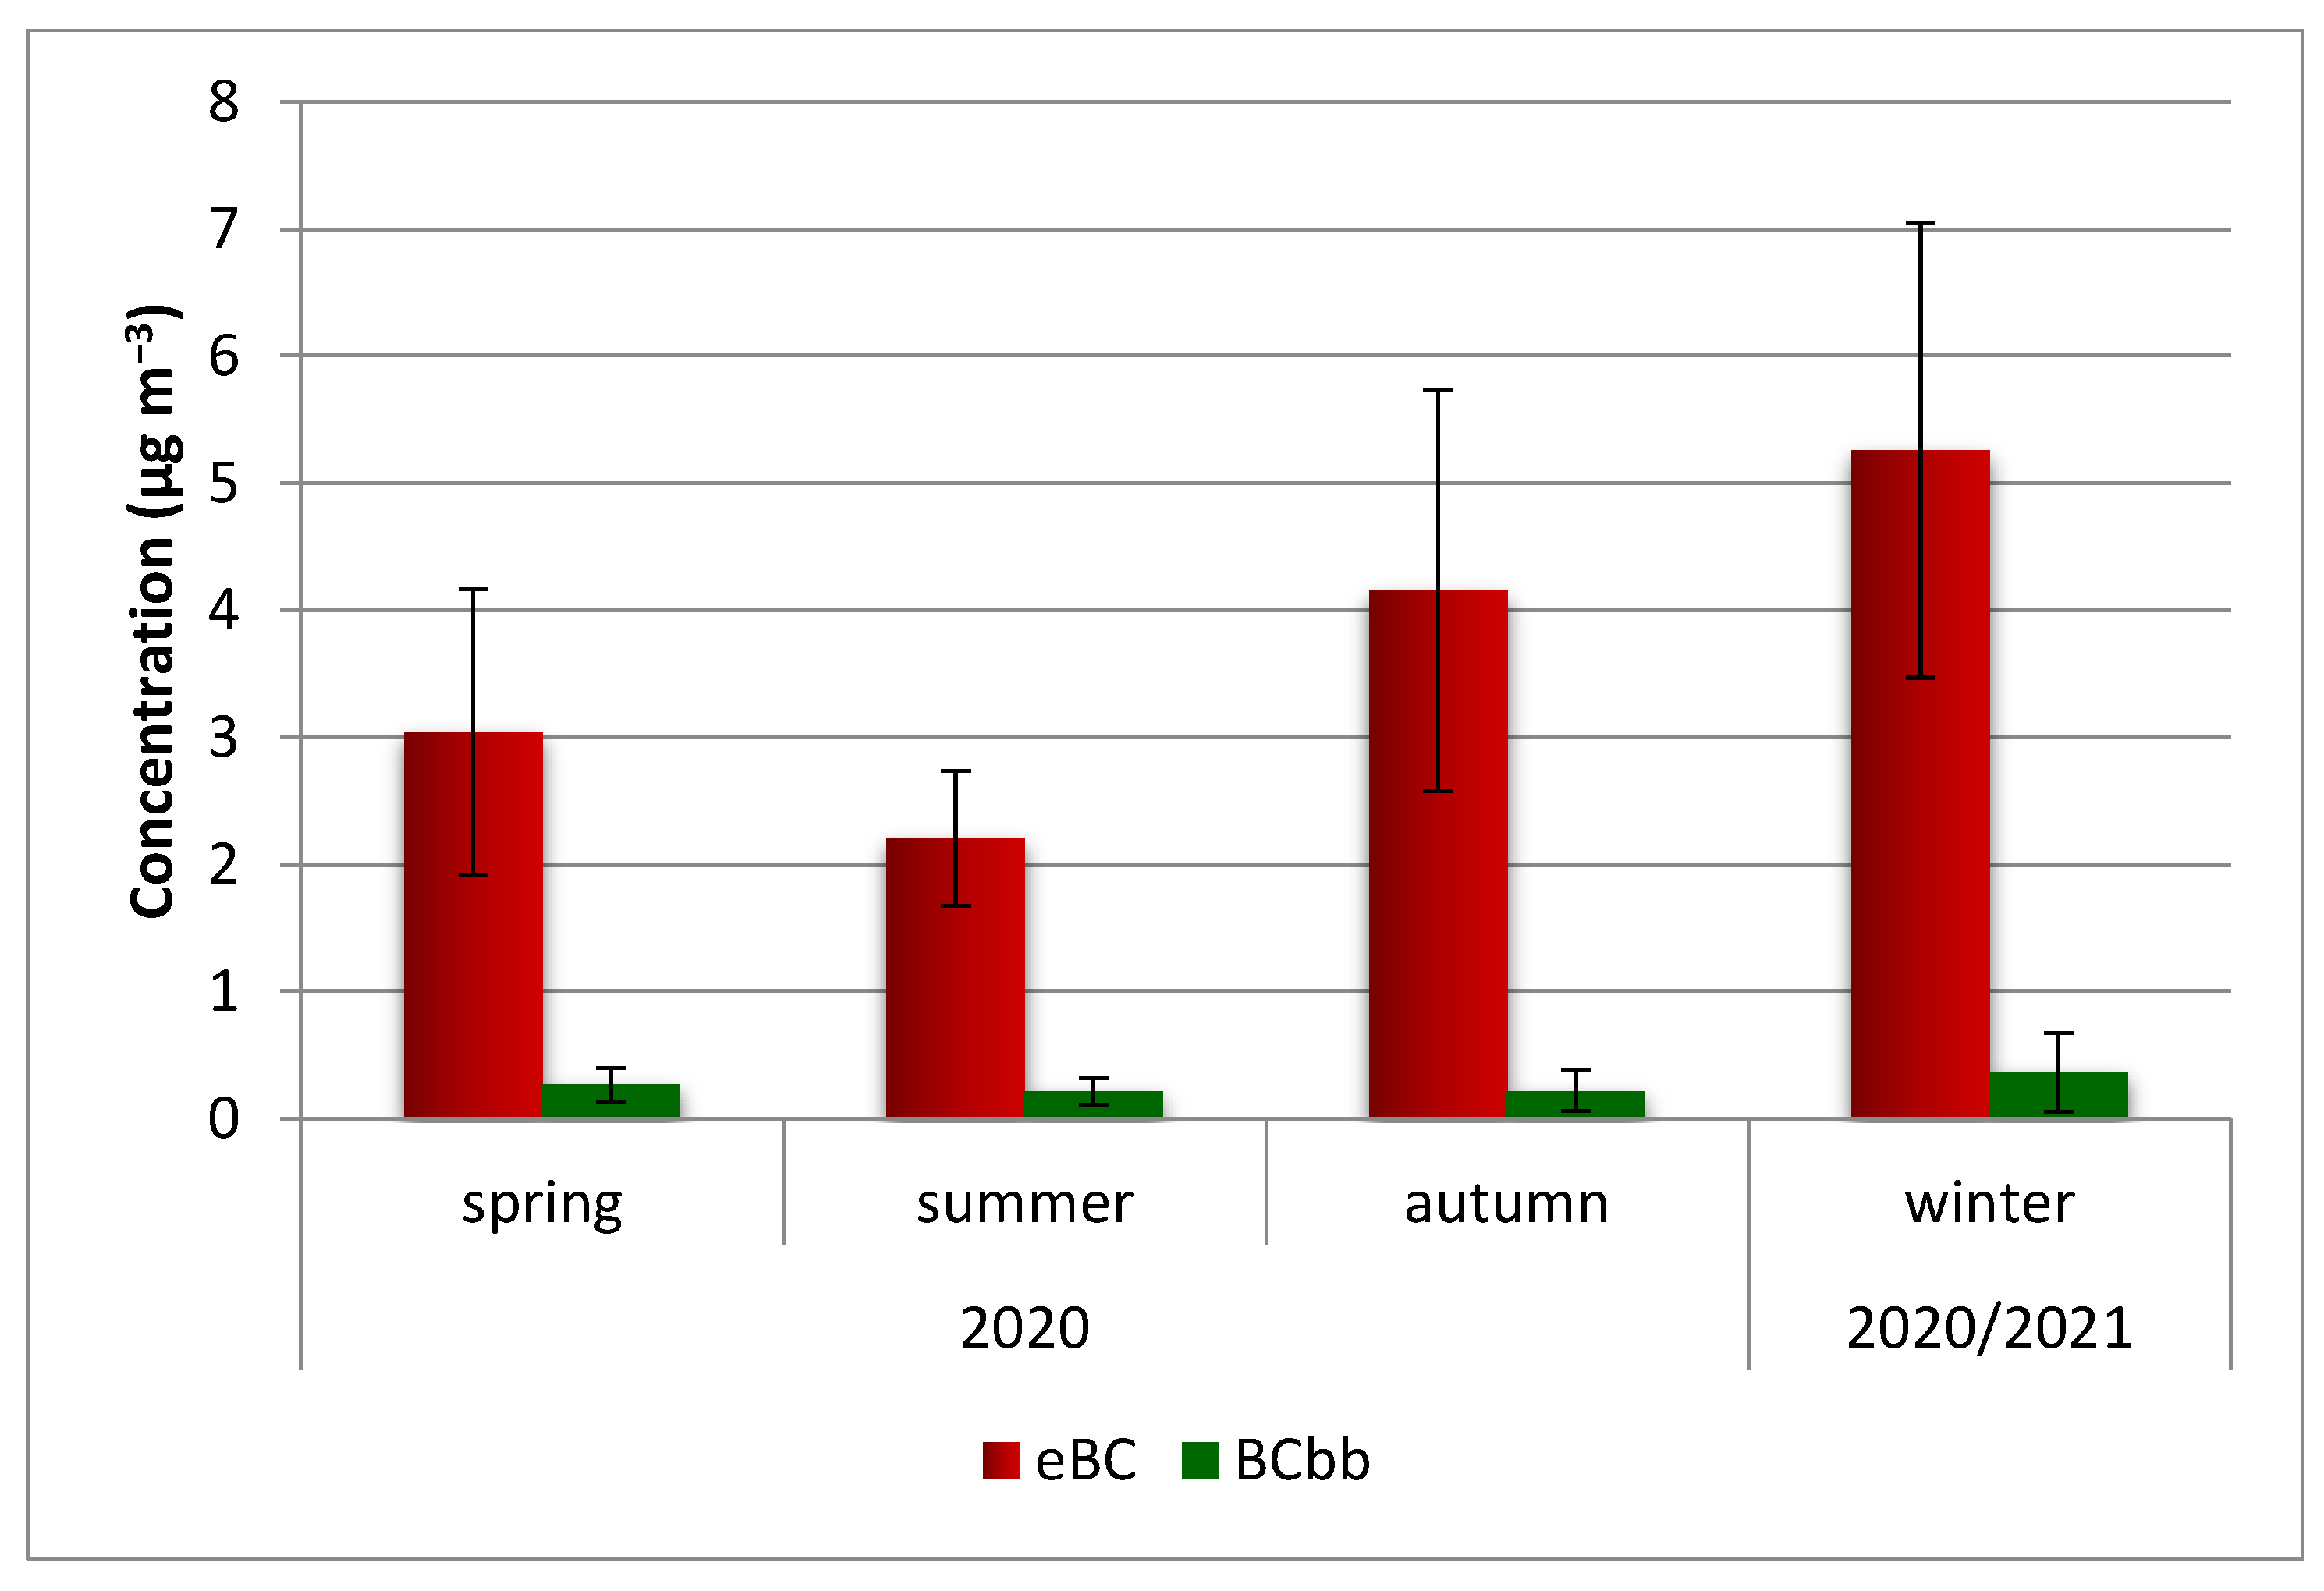
Figure 7.
Mean concentrations of eBC and BCbb for weekend and workdays.
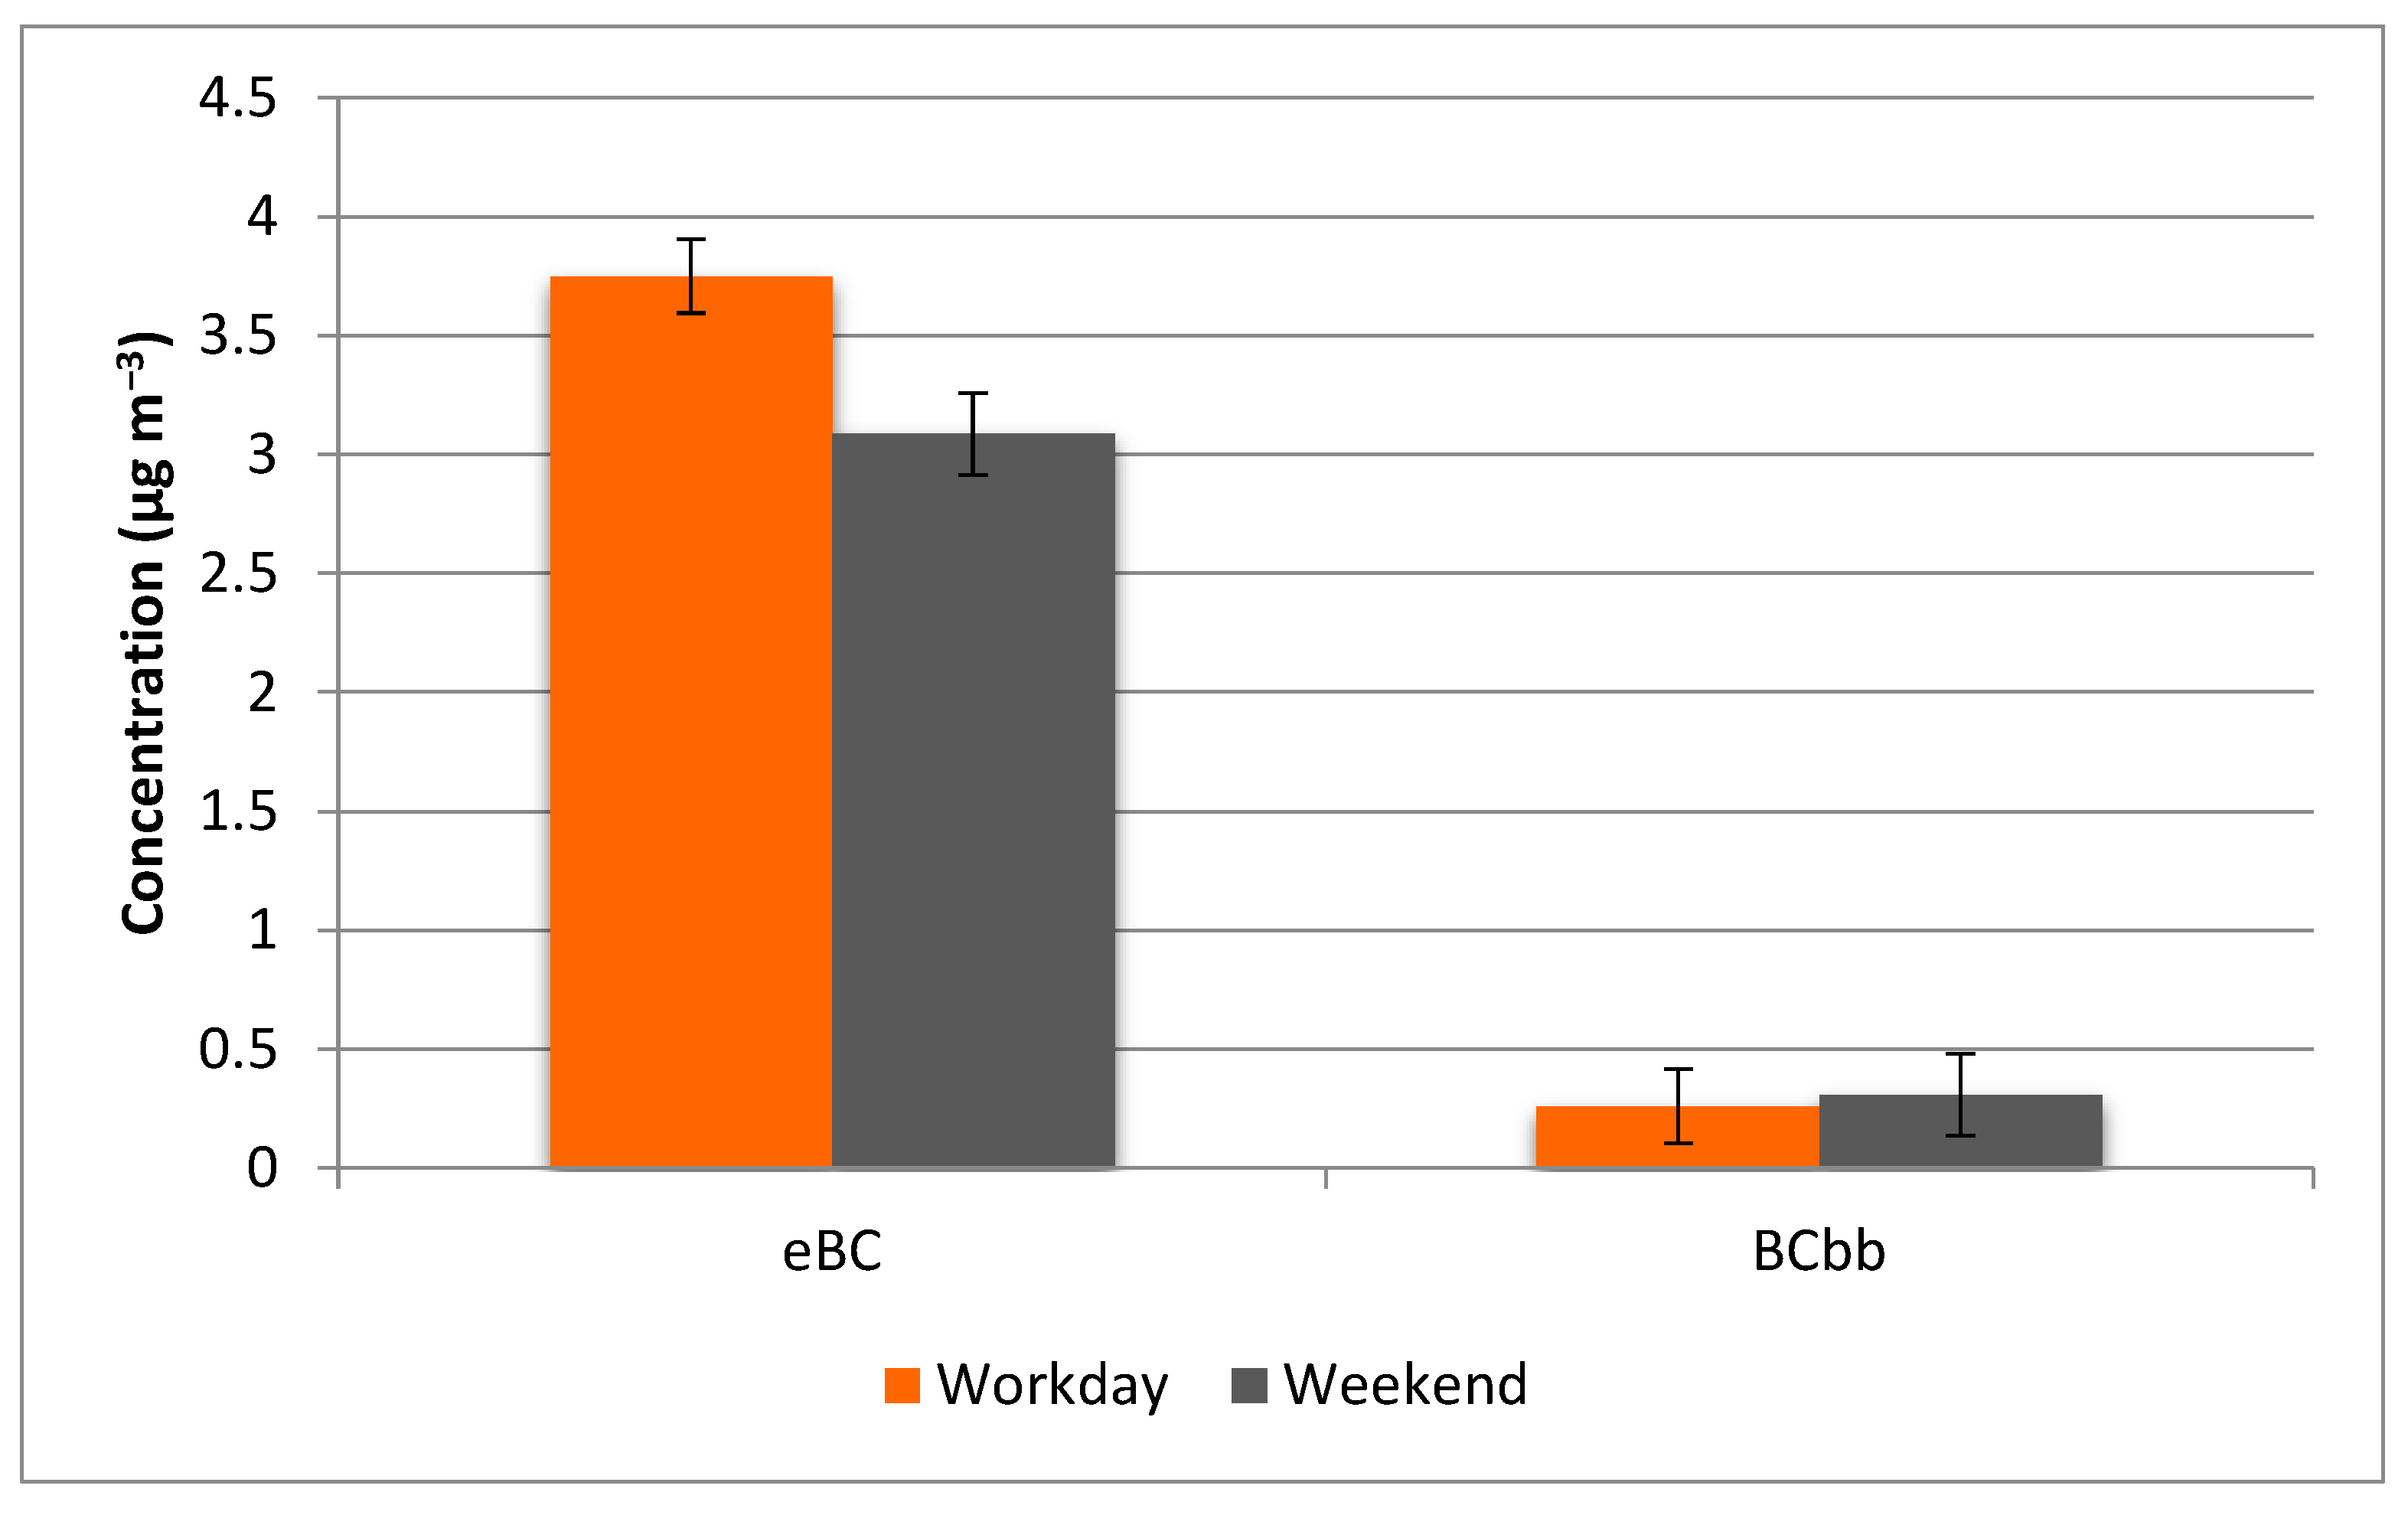
Figure 8.
Daily concentrations of PM2.5 and eBC μg m−3.
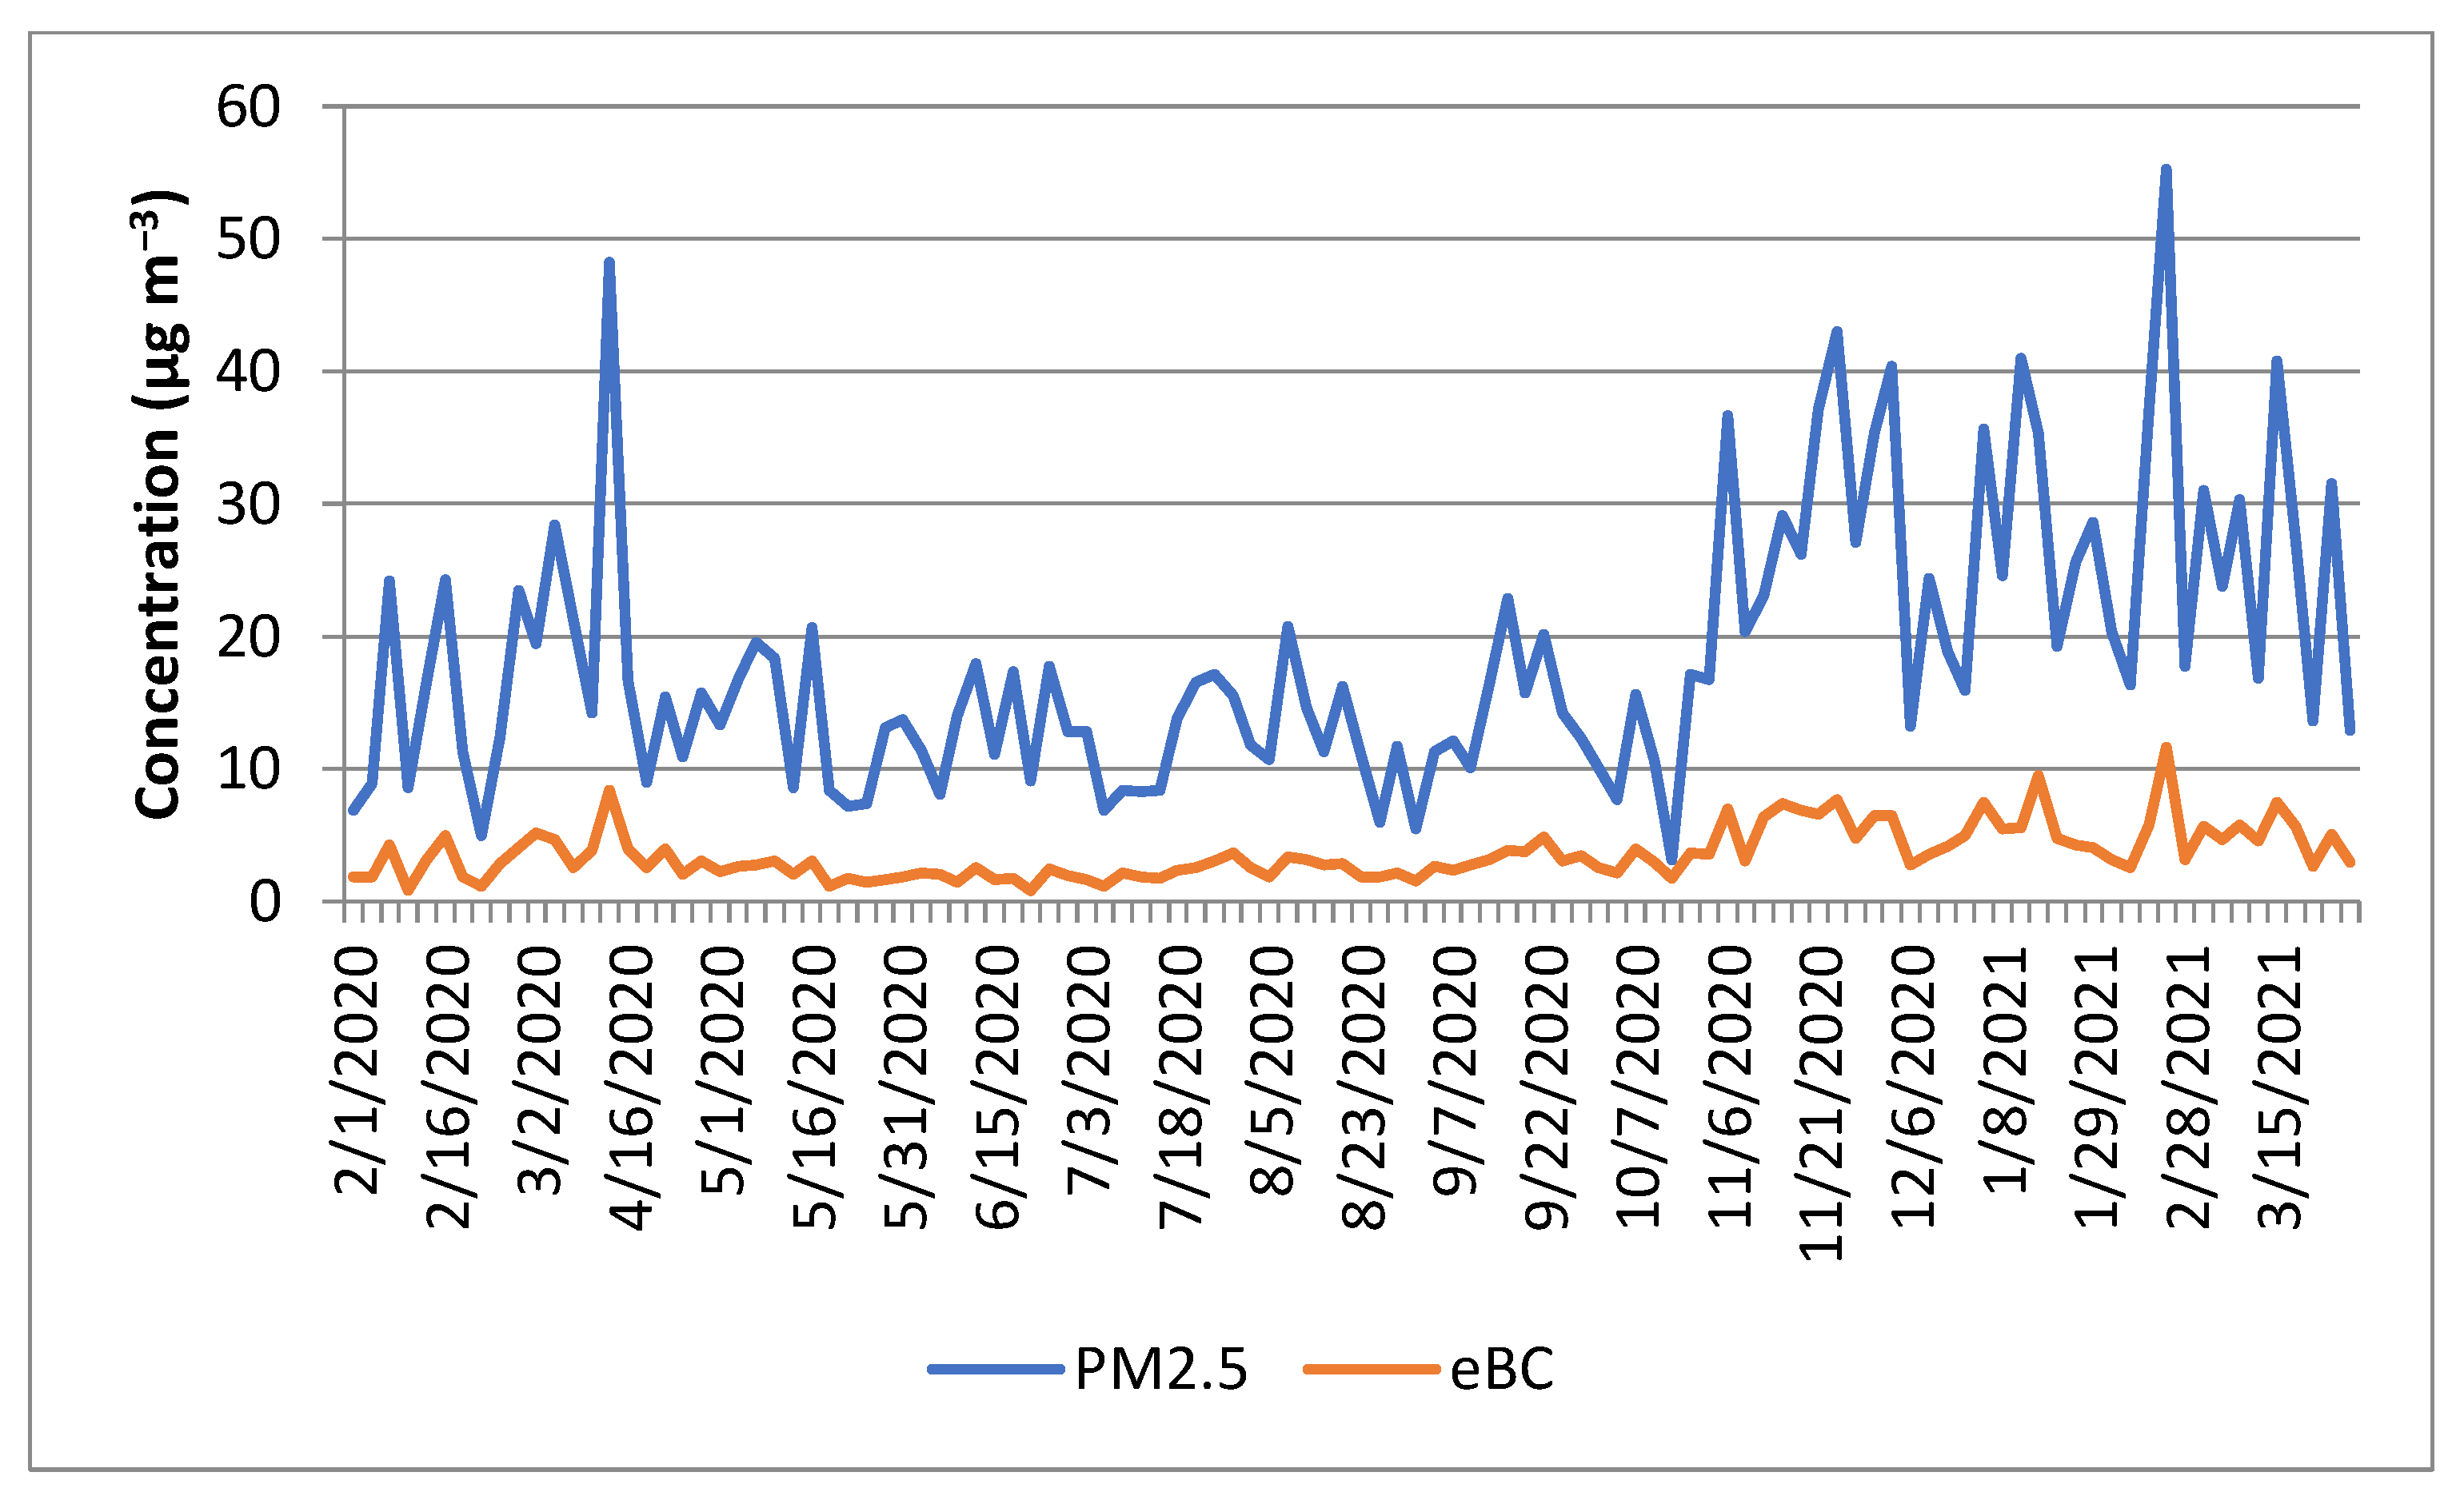
Figure 9.
Regression of concentration eBC versus PM2.5 for the full period.

Table 1.
Mean concentrations of PM2.5, equivalent black carbon, black carbon related to biomass (BCBB) in μg m−3 with standard deviation, and relative contribution of eBC to PM2.5 in % for the season, year and full sampling period.
Table 1.
Mean concentrations of PM2.5, equivalent black carbon, black carbon related to biomass (BCBB) in μg m−3 with standard deviation, and relative contribution of eBC to PM2.5 in % for the season, year and full sampling period.
| Period | PM2.5 (μg m−3) | eBC (μg m−3) | BCbb (μg m−3) | eBC/PM2.5 (%) |
|---|---|---|---|---|
| Spring | 16.5 ± 0.2 | 3.0 ± 1.1 | 0.3 ± 0.1 | 20 ± 8 |
| Summer | 12.6 ± 0.1 | 2.2 ± 0.5 | 0.2 ± 0.1 | 19± 5 |
| Autumn | 19.2 ± 0.7 | 4.2 ± 1.6 | 0.22 ± 0.16 | 24 ± 9 |
| Winter | 27.6 ± 0.2 | 5.3 ± 1.8 | 0.4 ± 0.3 | 21 ± 8 |
| Annual | 18.2 ± 0.6 | 3.5 ± 1.5 | 0.25 ± 0.15 | 21 ± 10 |
| Full period | 18.4 ± 0.6 | 3.6 ± 1.5 | 0.3 ± 0.2 | 21 ± 10 |
Publisher’s Note: MDPI stays neutral with regard to jurisdictional claims in published maps and institutional affiliations. |
© 2022 by the authors. Licensee MDPI, Basel, Switzerland. This article is an open access article distributed under the terms and conditions of the Creative Commons Attribution (CC BY) license (https://creativecommons.org/licenses/by/4.0/).
Share and Cite
MDPI and ACS Style
Ryś, A.; Samek, L. Yearly Variations of Equivalent Black Carbon Concentrations Observed in Krakow, Poland. Atmosphere 2022, 13, 539. https://doi.org/10.3390/atmos13040539
AMA Style
Ryś A, Samek L. Yearly Variations of Equivalent Black Carbon Concentrations Observed in Krakow, Poland. Atmosphere. 2022; 13(4):539. https://doi.org/10.3390/atmos13040539
Chicago/Turabian StyleRyś, Anna, and Lucyna Samek. 2022. "Yearly Variations of Equivalent Black Carbon Concentrations Observed in Krakow, Poland" Atmosphere 13, no. 4: 539. https://doi.org/10.3390/atmos13040539
Note that from the first issue of 2016, this journal uses article numbers instead of page numbers. See further details here.