Article

Temporal and Spatial Patterns of Biomass Burning Fire Counts and Carbon Emissions in the Beijing–Tianjin–Hebei (BTH) Region during 2003–2020 Based on GFED4

1
Department of Environmental Engineering, School of Energy and Environmental Engineering, Hebei University of Engineering, Handan 056038, China
2
Hebei Key Laboratory of Air Pollution Cause and Impact, Handan 056038, China
3
Postdoctoral Research Station of Xi’an Chan-Ba Ecological District (CBE) Management Committee, Xi’an 710024, China
4
Office of the Cyberspace Affairs, Tianjin University of Technology and Education, Tianjin 300222, China
*
Author to whom correspondence should be addressed.
Atmosphere 2022, 13(3), 459; https://doi.org/10.3390/atmos13030459
Submission received: 30 January 2022 / Revised: 27 February 2022 / Accepted: 7 March 2022 / Published: 11 March 2022
(This article belongs to the Special Issue Atmospheric Pollution of Agriculture-Dominated Cities)

Abstract

:
Biomass burning (BB) plays an important role in the formation of heavy pollution events during harvest seasons in the Beijing–Tianjin–Hebei (BTH) region by releasing trace gases and particulate matter into the atmosphere. A better understanding of spatial-temporal variations of BB in BTH is required to assess its impacts on air quality, especially on heavy haze pollution. The fourth version of the Global Fire Emissions Database (GFED4)’s fire counts and carbon emissions data were used in this research, which shows the varying number of fire counts in China from 2003 to 2020 demonstrated a fluctuating but generally rising trend, with a peak in 2013. Most fire counts were concentrated in three key periods: March (11%), June–July (33%), and October (9.68%). The increase in fire counts will inevitably lead to the growth of carbon emissions. The four major vegetation types of the fires were agriculture (58.1%), followed by grassland (35.5%), and forest (4.1%), with the fewest in peat. In addition, a separate study for the year 2020 found that the fire counts and carbon emissions were different for this year, with the overall average trend in the study time. For example, the monthly peak fire counts changed from June to March. The cumulative emissions of carbon, CO, CO2, CH4, dry matter, and particulate matter from BB in BTH reached 201 Gg, 39 Gg, 670 Gg, 2 Gg, 417 Gg, and 3 Gg in 2020, respectively.

1. Introduction

Biomass burning (BB), such as wildfire, agricultural open-burning, residential biofuel burning, forest fire, grass burning, and peatland fire [1], is an important source of atmospheric particulate matter and trace gases [2,3,4,5]. It has an important impact on regional and even global air quality, the chemical composition of particulate matter, climate system, and human health [6,7]. Gaseous pollutants, such as CO, CO2, CH4, NOx, and NMOC (nonmethane hydrocarbons) released by BB, as well as particulate matter, such as BC (black carbon) and OC (organic carbon), affect local, regional, and global air quality, climate forcing, and carbon-nitrogen cycle, and promote the formation of ozone and acid rain environmental problems [8,9,10].
China is one of the greatest sources of BB emissions, predominantly due to anthropogenic burning, such as post-harvest agricultural open biomass burning (OBB) [11]. The main form of BB in China is crop straw burning. With the continuous increase in comprehensive agricultural production levels, China’s total straw output is increasing to become the world’s largest straw-producing country. According to the data published in the bulletin of the second national survey of pollution (sources: http://www.mee.gov.cn/xxgk2018/xxgk/xxgk01/202006/t20200610_783547.html (accessed on 26 December 2021)), the national straw production in 2017 was 8.05×10⁸ t, a total increase of 76.05% and an average annual increase of 2.06% compared with 1980. In recent years, researchers, the government, and the public have gradually become aware of the impact of BB on air quality and carried out relevant research using ground monitoring, satellite remote sensing, atmospheric chemistry, and air quality numerical simulation. The study by Ke and coworkers [12] revealed the annual and monthly changes of OBB from 2013 to 2017 in China using the MODIS fire counts and found the fire counts mainly concentrated in three key periods (March–April, June, and October–November). Wang and coworkers [13] also found most fire counts concentrated in March–April (37%) and October–November (46%) in Northeast China (NEC). Their result showed the largest proportion of all fires were in cropland (90.8%), followed by forest (5.3%) and grassland (3.1%). The quantitative study by Shi and coworkers [14] on aerosol emitted from open biomass burning in the NEC region based on the POLDER/PARASOL satellite aerosol dataset found a 16% decline in 565 nm AOD during the 72 h BB transport process. The average AOD in spring is 0.63, which is higher than autumn’s value of 0.52, indicating that biomass burning is more intensive in spring. Lü and coworkers [15] estimated the fire-induced carbon emissions and specific trace gases from forest fires in China from 1950 to 2000, and the emissions show substantial interannual and decadal variations before 1980 but have remained relatively low and stable since 1980 because of the application of fire suppression. Shi and coworkers [16] developed a high-resolution (1 km ×1 km), multi-year (2001–2017), and monthly emission inventory associated with OBB in NEC using the burned area product (MCD64A1), satellite and observational biomass data, vegetation index-derived spatiotemporal variable burning efficiency, and emission factors. Taking CO2 as an example, crop residue burning was observed to be the largest contributor of CO2 overall, accounting for 68% of total CO2 emissions, followed by forest (30%) and grassland (2%) fires.
The Beijing–Tianjin–Hebei (BTH) region is an important political, economic and cultural center of China and an important driving force for China’s social and economic development. In recent years, resource and environmental problems in BTH have become increasingly prominent, which has seriously restricted the process of economic development and urbanization. At present, with the strong regulations by the government and relevant departments, the comprehensive utilization of straw in BTH has achieved some results, but there is still open biomass burning in some areas. Relevant reports show that hundreds of thousands of tons of particulate matter are discharged into the atmosphere due to BB in BTH and surrounding areas every year. The average daily PM2.5 concentration increases by 60.6 µg/m3 on average and up to 127 µg/m3 at most, which greatly impacts air pollution. The straw production of BTH provinces (cities) accounts for 0.2%, 0.5%, and 7.1% of the total straw resources in China, respectively. The straw production of Hebei province is dominant in BTH. The results showed that corn and wheat straw were mainly used in the three provinces (cities) of BTH. Among them, corn straw accounted for 79.9%, 58.8%, and 57.0% of the total straw in BTH, respectively, and wheat straw accounted for 19.4%, 23.4%, and 34.3%, respectively. Based on the BB fire counts and carbon emissions data collected by GFED4 in the BTH region from 2003 to 2020, this study considered multiple time and regional scales to investigate the trends and effects of BB fire counts and carbon emissions in the BTH region. The results can provide a scientific basis for prevention and control policies in the BTH region and surrounding areas.

2. Materials and Methods

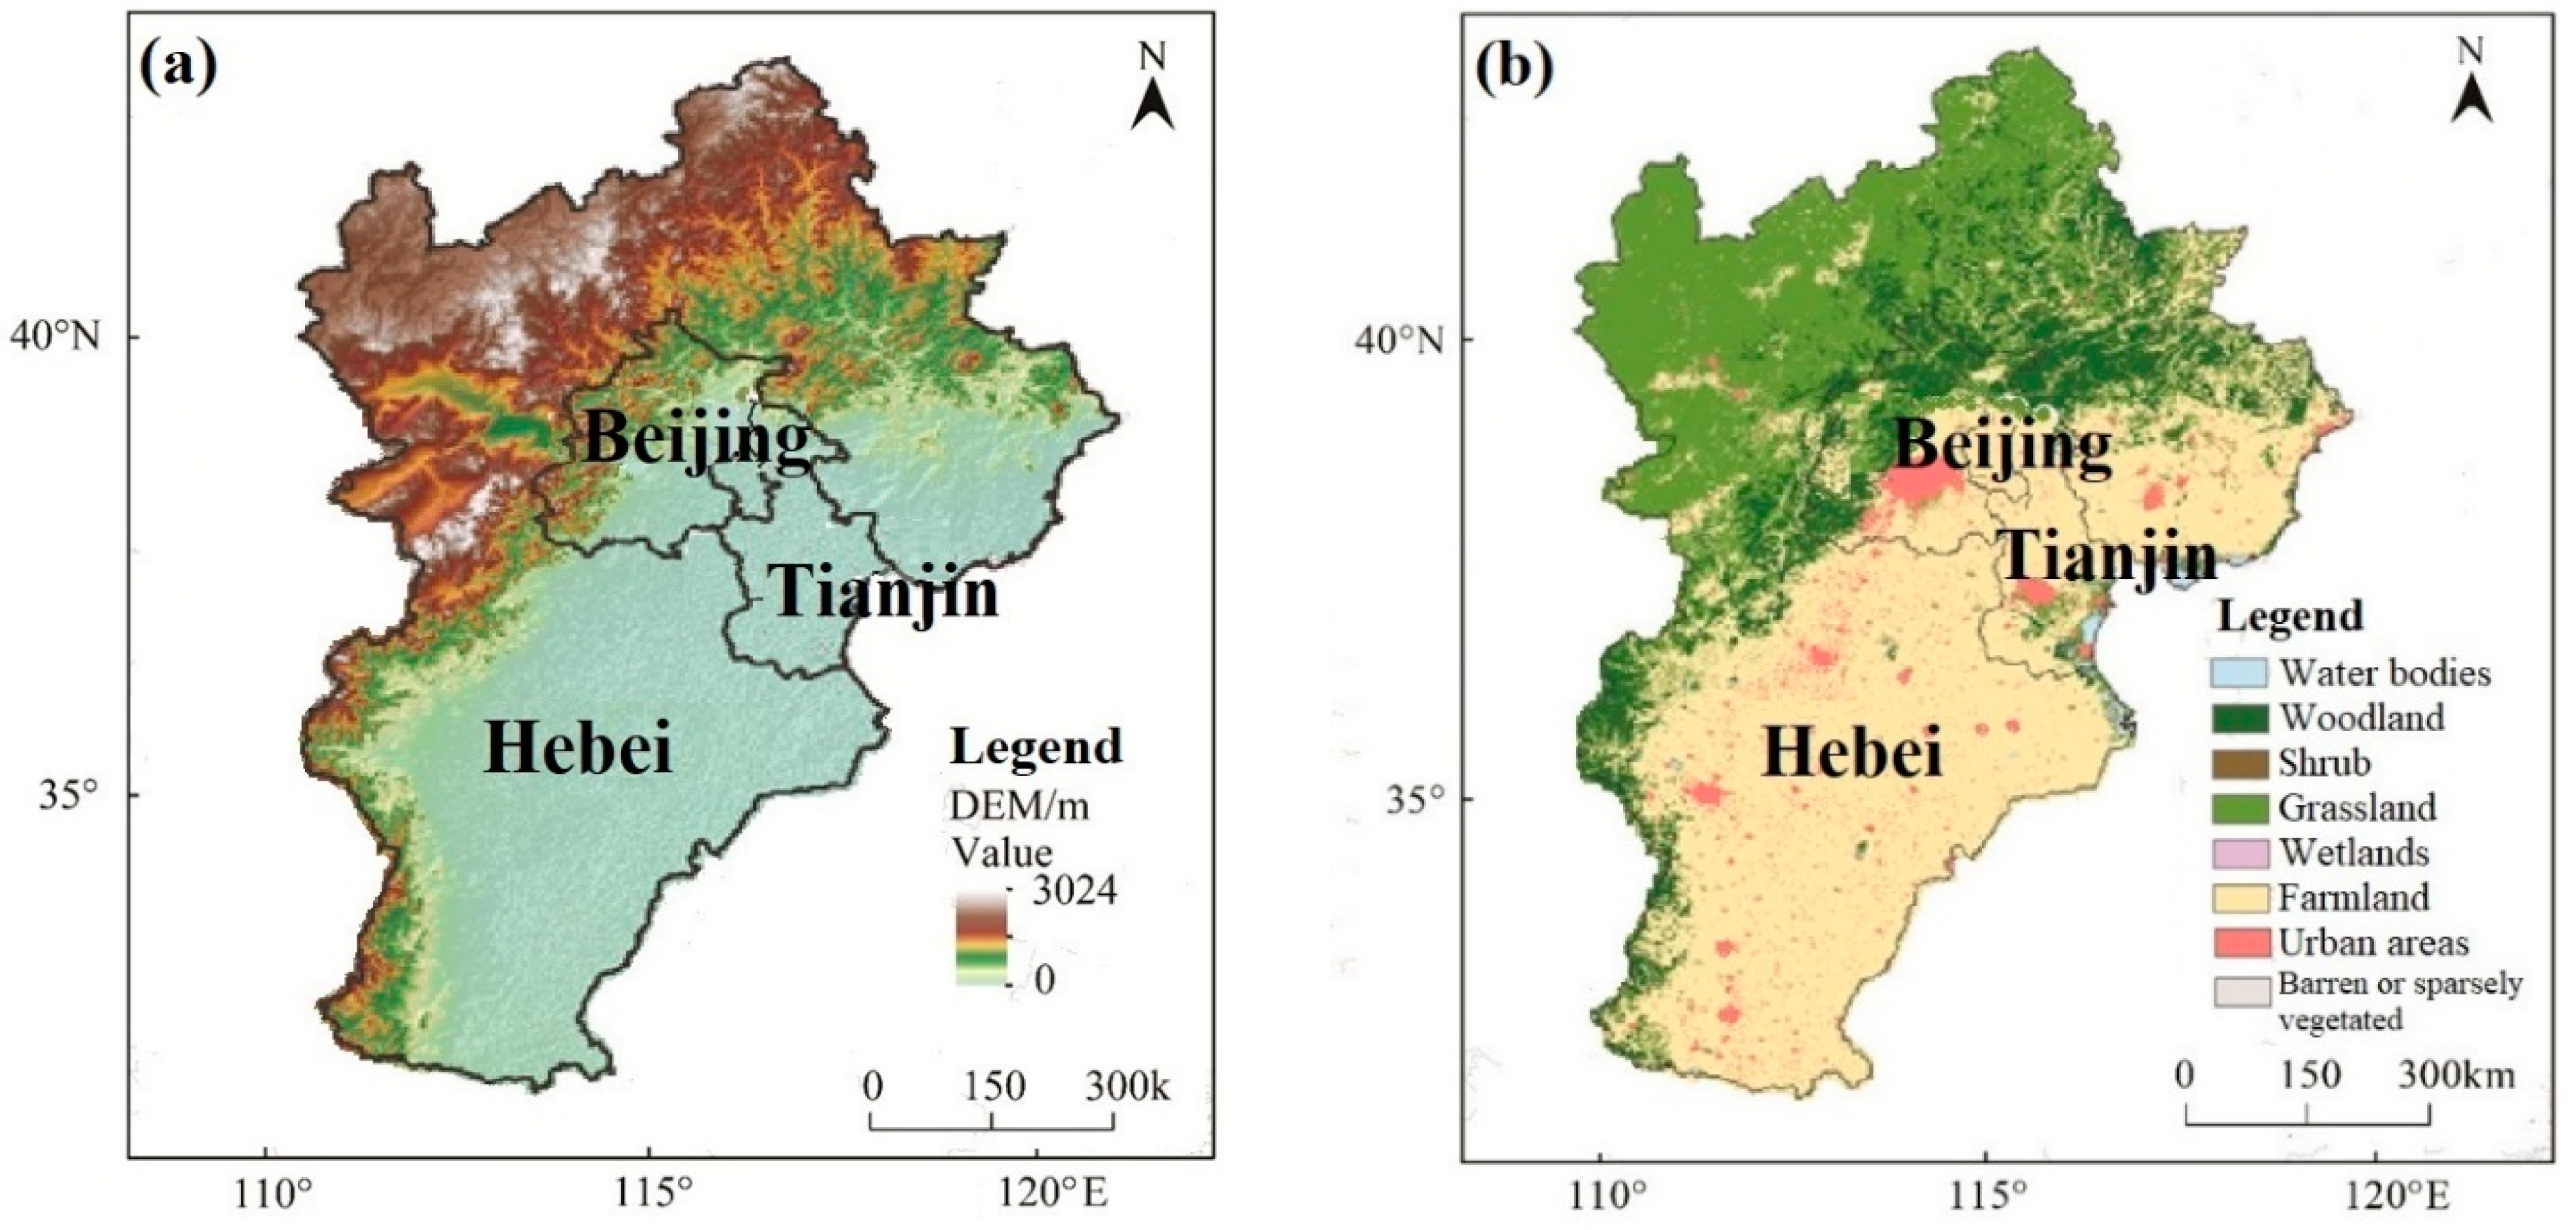
2.1. Research Regions

The BTH region is located in northern China (Figure 1a), which is one of the most economically developed, populated, and polluted regions in the country. The region is surrounded by the Bohai Sea in the east, the Taihang Mountains in the west, Yanshan Mountains in the north, and the North China Plain in the south. The terrain is high in the northwest and low in the southeast, inclined from northwest to southeast. The rich geomorphic types include plateaus, mountains, hills, plains, grasslands, and coastal geomorphic types. The region has a temperate continental monsoon climate, with hot and rainy summers and cold, dry winters when temperature inversion occurs, while the spring and autumn seasons are short, windy, and rainless. The climate is affected by the structure of the Yanshan–Taihang Mountains, which are characterized by terrain that gradually decreases from northwest to southeast and act as a barrier to the dominant wind direction in the region. The frequent occurrence of calm winds and inversion weather is not conducive to the diffusion of atmospheric pollutants. The BTH region serves as the core area of the Bohai Rim Economic Circle and is characterized by high energy consumption, high pollution emissions, and complex air pollution.

2.2. GFED4 Data Set

The fourth version of the Global Fire Emissions Database (GFED4) [17] was analyzed in this study, which was downloaded from http://www.globalfiredata.org/index.html (accessed on 26 December 2021). GFED4 provides monthly burned area, emissions such as fire carbon (C) and dry matter (DM), and the contribution of different fire types to these emissions in order to calculate trace gas and aerosol emissions using emission factors [18,19]. The burned area data set provides global, monthly burned area at 0.25° spatial resolution from mid-1995 through December 2016 and higher temporal resolution daily burned area for a subset of the time series extending back to August 2000. Note that GFED4 was primarily derived from the now-obsolete Collection 5.1 MODIS MCD64A1 burned area product, which was superseded by the Collection 6 MCD64A1 product in early 2017 [19,20].

2.3. Land Use and Land Cover

The International Geosphere-Biosphere Project (IGBP) classification scheme of MCD12Q1 data at a spatial resolution of 500 m (https://lpdaac.usgs.gov/products/mcd12q1v006/ (accessed on 18 January 2022)) was selected to assist in obtaining the underlying surface type of the vegetation sources. Figure 1b covered the research area and was mosaiced and reprojected using HEG tools. The major land use reclassification vegetation types were reclassified as forests (evergreen needleleaf forest, evergreen broadleaf forest, deciduous needleleaf forest, deciduous broadleaf forest, mixed forest), savannas (woody savannas and savannas), shrublands (closed shrublands and open shrublands), croplands (croplands and cropland-natural vegetation mosaic), water bodies (snow and ice), wetlands, urban areas, and barren or sparsely vegetated in this study.

2.4. Digital Elevation Model

The digital elevation model (DEM) data set from the Shuttle Radar Topography Mission (SRTM) was used to analyze the impact of elevation on dust aerosols and may be downloaded from https://srtm.csi.cgiar.org/srtmdata/, accessed on 26 December 2021, then preprocessed with ArcGIS.

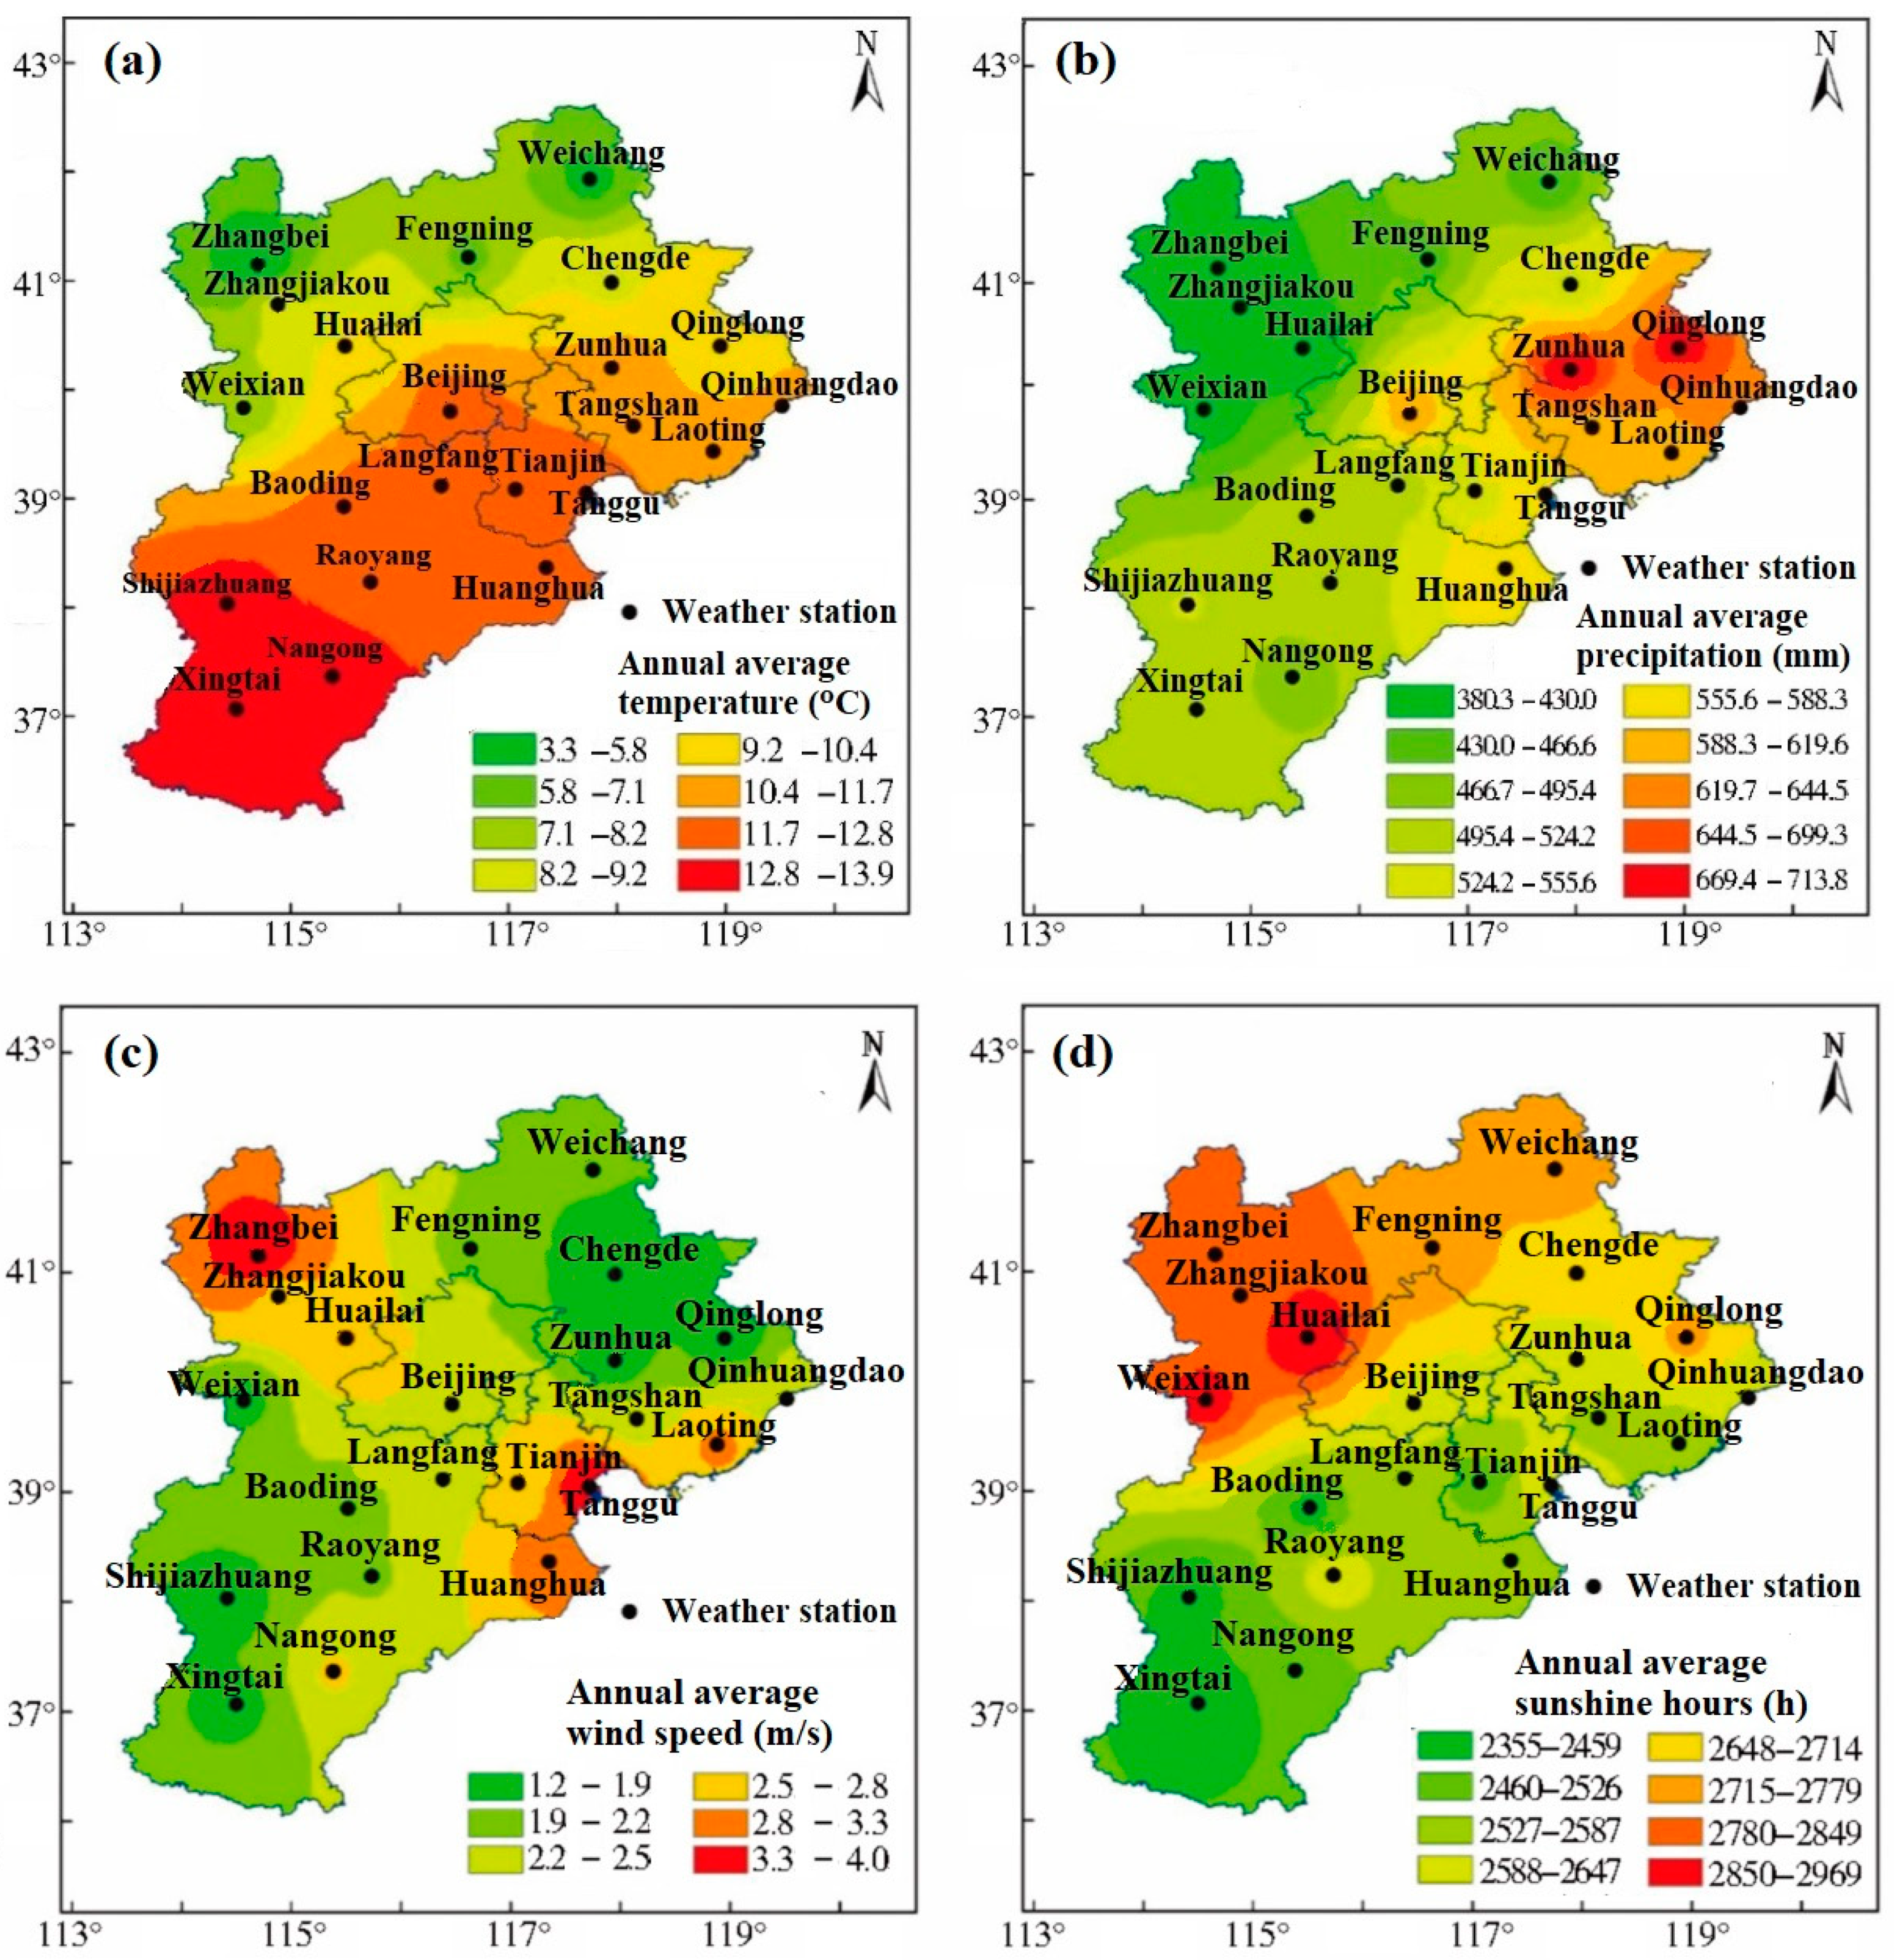
2.5. Meteorological Data

In order to analyze the change of environmental parameters and influence factors, we obtained the key meteorological data (temperature, precipitation, wind speed, wind direction, and sunlight between 2003 and 2020) collected by 22 meteorological stations in the BTH region from the China Meteorological Data Service Center (http://data.cma.cn (accessed on 26 December 2021), as shown in Figure 2.

3. Results

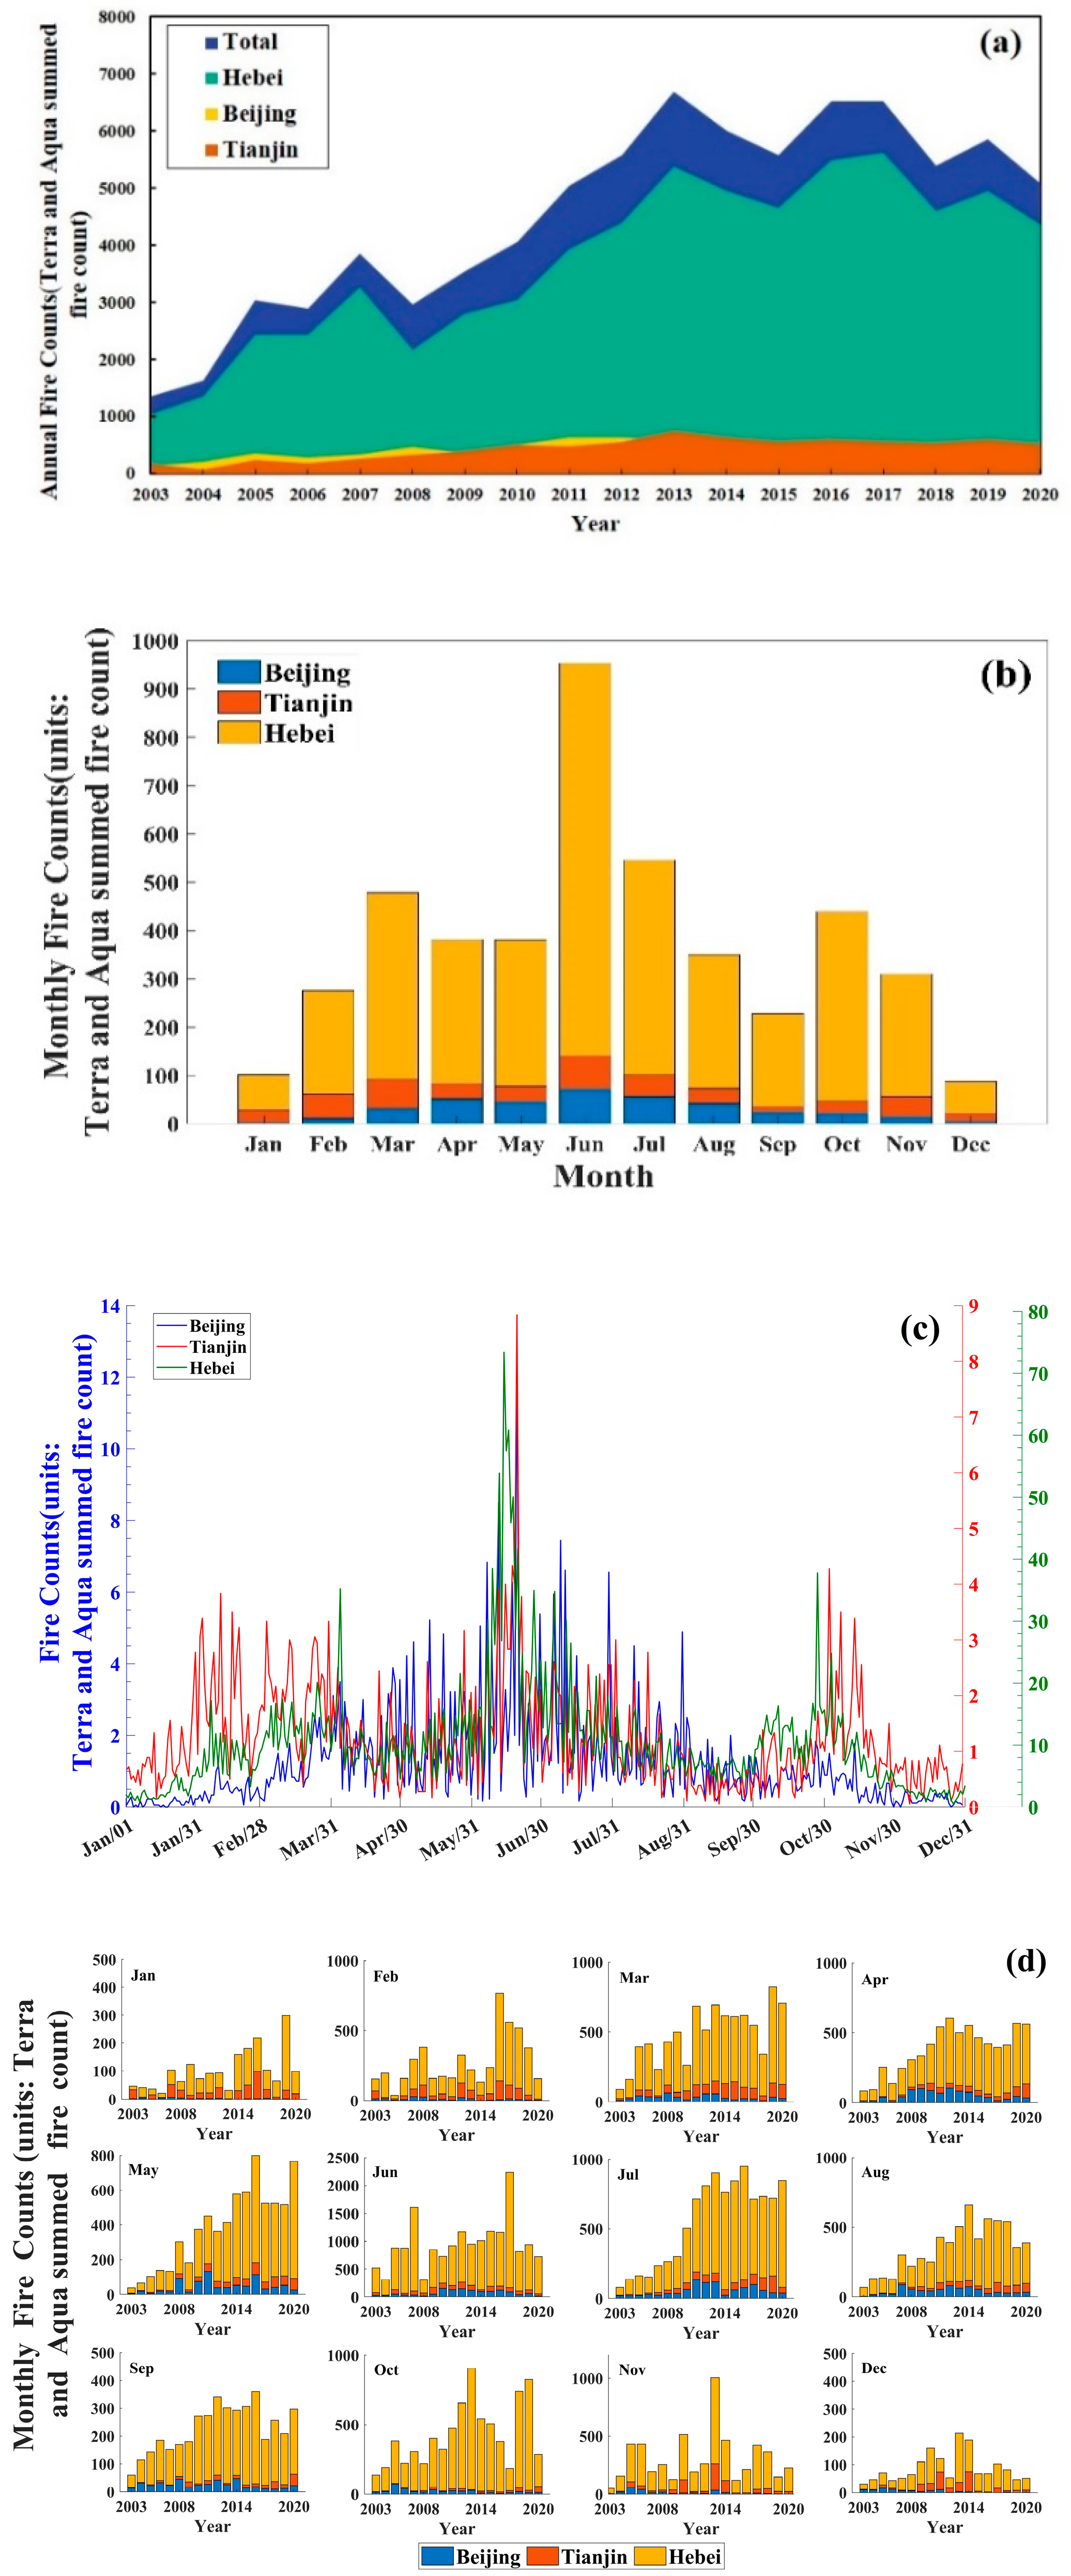
3.1. Temporal and Spatial Patterns of BB Fire Counts in BTH

The number of BTH fire counts from 2003 to 2020 showed a fluctuating upward trend, which can be divided into two periods, as shown in Figure 3a. The first period is a continuous fast-rising stage from 2003 to 2013, peaking in 2013 with the large amount of 6700 BB fire counts. In 2003 and 2004, the low amount of BB fire counts was less than 2000 and then continued to increase. There was only one downward trend, which occurred in 2008, with 2976 BB fire counts. In this year, due to holding the 2008 Olympic Games, the surrounding urban environment was well controlled. The total number of fire counts in the first period was 40,682, accounting for 49.79% of the total fire counts. The second period is the fluctuating decline period, and the time range is 2014–2020 (50.21%), which maintains a high amount of BB fire counts above 5000 and a rise and fall between 5088 and 6519 by 1–2 years. The average number of BB fire counts in the second period (5851) is 1.58 times that in the first period (3698). Overall, it can be seen that from 2003 to 2020, the number of BB fire counts generally showed an increasing trend; the annual data of BB fire counts can be seen in Table 1.
The monthly BB fire counts time series for each region is shown in Figure 3b. The BB fire counts mostly appeared in March (accounting for 11%), June–July (33%), and October (9.68%). The minimum BB fire counts were distributed in December (2%) and January (2%). The winter season remained at a low level, with no significant change. Climate, terrain, weather, and other factors affect the amount of BB fire counts, which responded differently at different times and seasons. From 2003 to 2020, the fewest monthly BB fire counts were in January 2006, with only 21 BB fire counts. In contrast, June had the largest monthly BB fire counts each year, and 2017 is the most prominent, with 2237 BB fire counts, which is almost more than a full year of data in 2003 and 2004. The BB fire counts increased steadily from January to March, and the BB fire counts in April and May were relatively stable. The growth rate increased rapidly from May to June. At this time, the temperature increased, the thunderstorm season increased, and the winter wheat harvest season arrived. The number of fire counts decreased significantly from June to September, then increased again in October, and decreased again in November and December. At this time, winter starts, the weather becomes cold, and the number of fire counts decreases significantly. Figure 3c shows the changing trend of the daily average from 2003 to 2020. There are three peaks in March, June, and October, which is consistent with the conclusion of the monthly analysis.
Moreover, at the subregion scale in BTH, the total number of BB fire counts in Hebei is the largest, with far more than the other two cities in BTH, as shown in Figure 3d. It shows that farmers’ awareness of banning burning should be improved, and relevant departments should strengthen supervision on BB. Among them, Beijing and Hebei had the annual lowest fire counts in 2003, while Tianjin had the annual lowest in 2004. Furthermore, the three regions have different years with the annual highest fire counts, which occurred in 2012, 2013, and 2017 separately with 639 (9%), 747 (9%), and 5616 (8%) in Beijing, Tianjin, and Hebei. In addition, the monthly growth trend of BB fire counts in Beijing and Hebei is generally the same trend, high in June, low in December and January, while the monthly peak period of BB fire counts in Tianjin is in March and June. The monthly highest fire counts in Beijing, Tianjin, and Hebei occurred in June 2010, November 2013, and June 2017, with 153, 229, and 2069, respectively.
We also analyzed the data of burned area in the same period, which began in 2003 and ended in 2016, because GFED4 did not process later years, so the information is not available. The burned area product is a digital map, at full resolution, of the extent of surfaces burned during a period of time and includes the burned area itself and information about the temporal pattern of the fire activity. Based on the annual burned area data from 2003 to 2016, as shown in Figure 4a, we know that the total burned area of BTH from 2003 to 2016 was 32,284.73 km2, of which the annual largest burned area in 2016 was 4583.46 km2, accounting for 14.20% of the total burned area, and the annual smallest burned area in 2003 was 534.47 km2, accounting for 1.66% of the total burned area. From 2003 to 2005, the burned area continued to increase. The burned area decreased for the first time in 2008, increased steadily from 2008 to 2011, decreased for the second time in 2012, rebounded in 2013, decreased in 2014, and increased steadily from 2014 to 2016 to the maximum. The annual data of burned areas can be seen in Table 1. Based on the monthly burned area data, as shown in Figure 4b, we know that the burned area in January was the monthly lowest, with a burned area of 174 km2, accounting for 0.63% of the total burned area for the whole period. The burned area in June was the monthly highest, with a burned area of 8517 km2, accounting for 30.74% of the total monthly burned area. The burned area in June 2007 was the largest, 1165 km2, accounting for 55.24% of the total annual burned area in 2007. For the season, the burned area had the same trend as BB fire counts, which was low in winter and high in summer. The burned area was 5021 km2 in spring, accounting for 18.12% of the total burned area, 15,478 km2 (55.87%) in summer, 6360 km2 (22.96%), and 846 km2 (3.03%) in winter. For the BTH subregional analysis, the annual largest burned area in Beijing was in 2011, with a burned area of 524.4 km2, accounting for 13.16% of the total burned area. The annual smallest burned area in Beijing was in 2003, with a burned area of 40.65 km2, accounting for 1.03% of the total burned area. The largest annual burned area in Tianjin was in 2016, with a burned area of 622.68 km2, accounting for 14.21% of the total burned area in Tianjin from 2003 to 2016, and the annual smallest burned area in Tianjin was in 2004, accounting for 1.59% of the total burned area. The largest burned area in Hebei was 3550.8 km2, accounting for 14.83% of the total burned area. The annual smallest burned area in Hebei was in 2003, with a burned area of 400.19 km2, accounting for 1.67% of the total burned area. According to the data, it can be seen that the burned area of Hebei far exceeds that of Beijing and Tianjin, and is even greater than the sum of the burned areas of Beijing and Tianjin. Hebei has the largest burned area, followed by Tianjin and Beijing. The annual data of burned areas can be seen in Table 1.

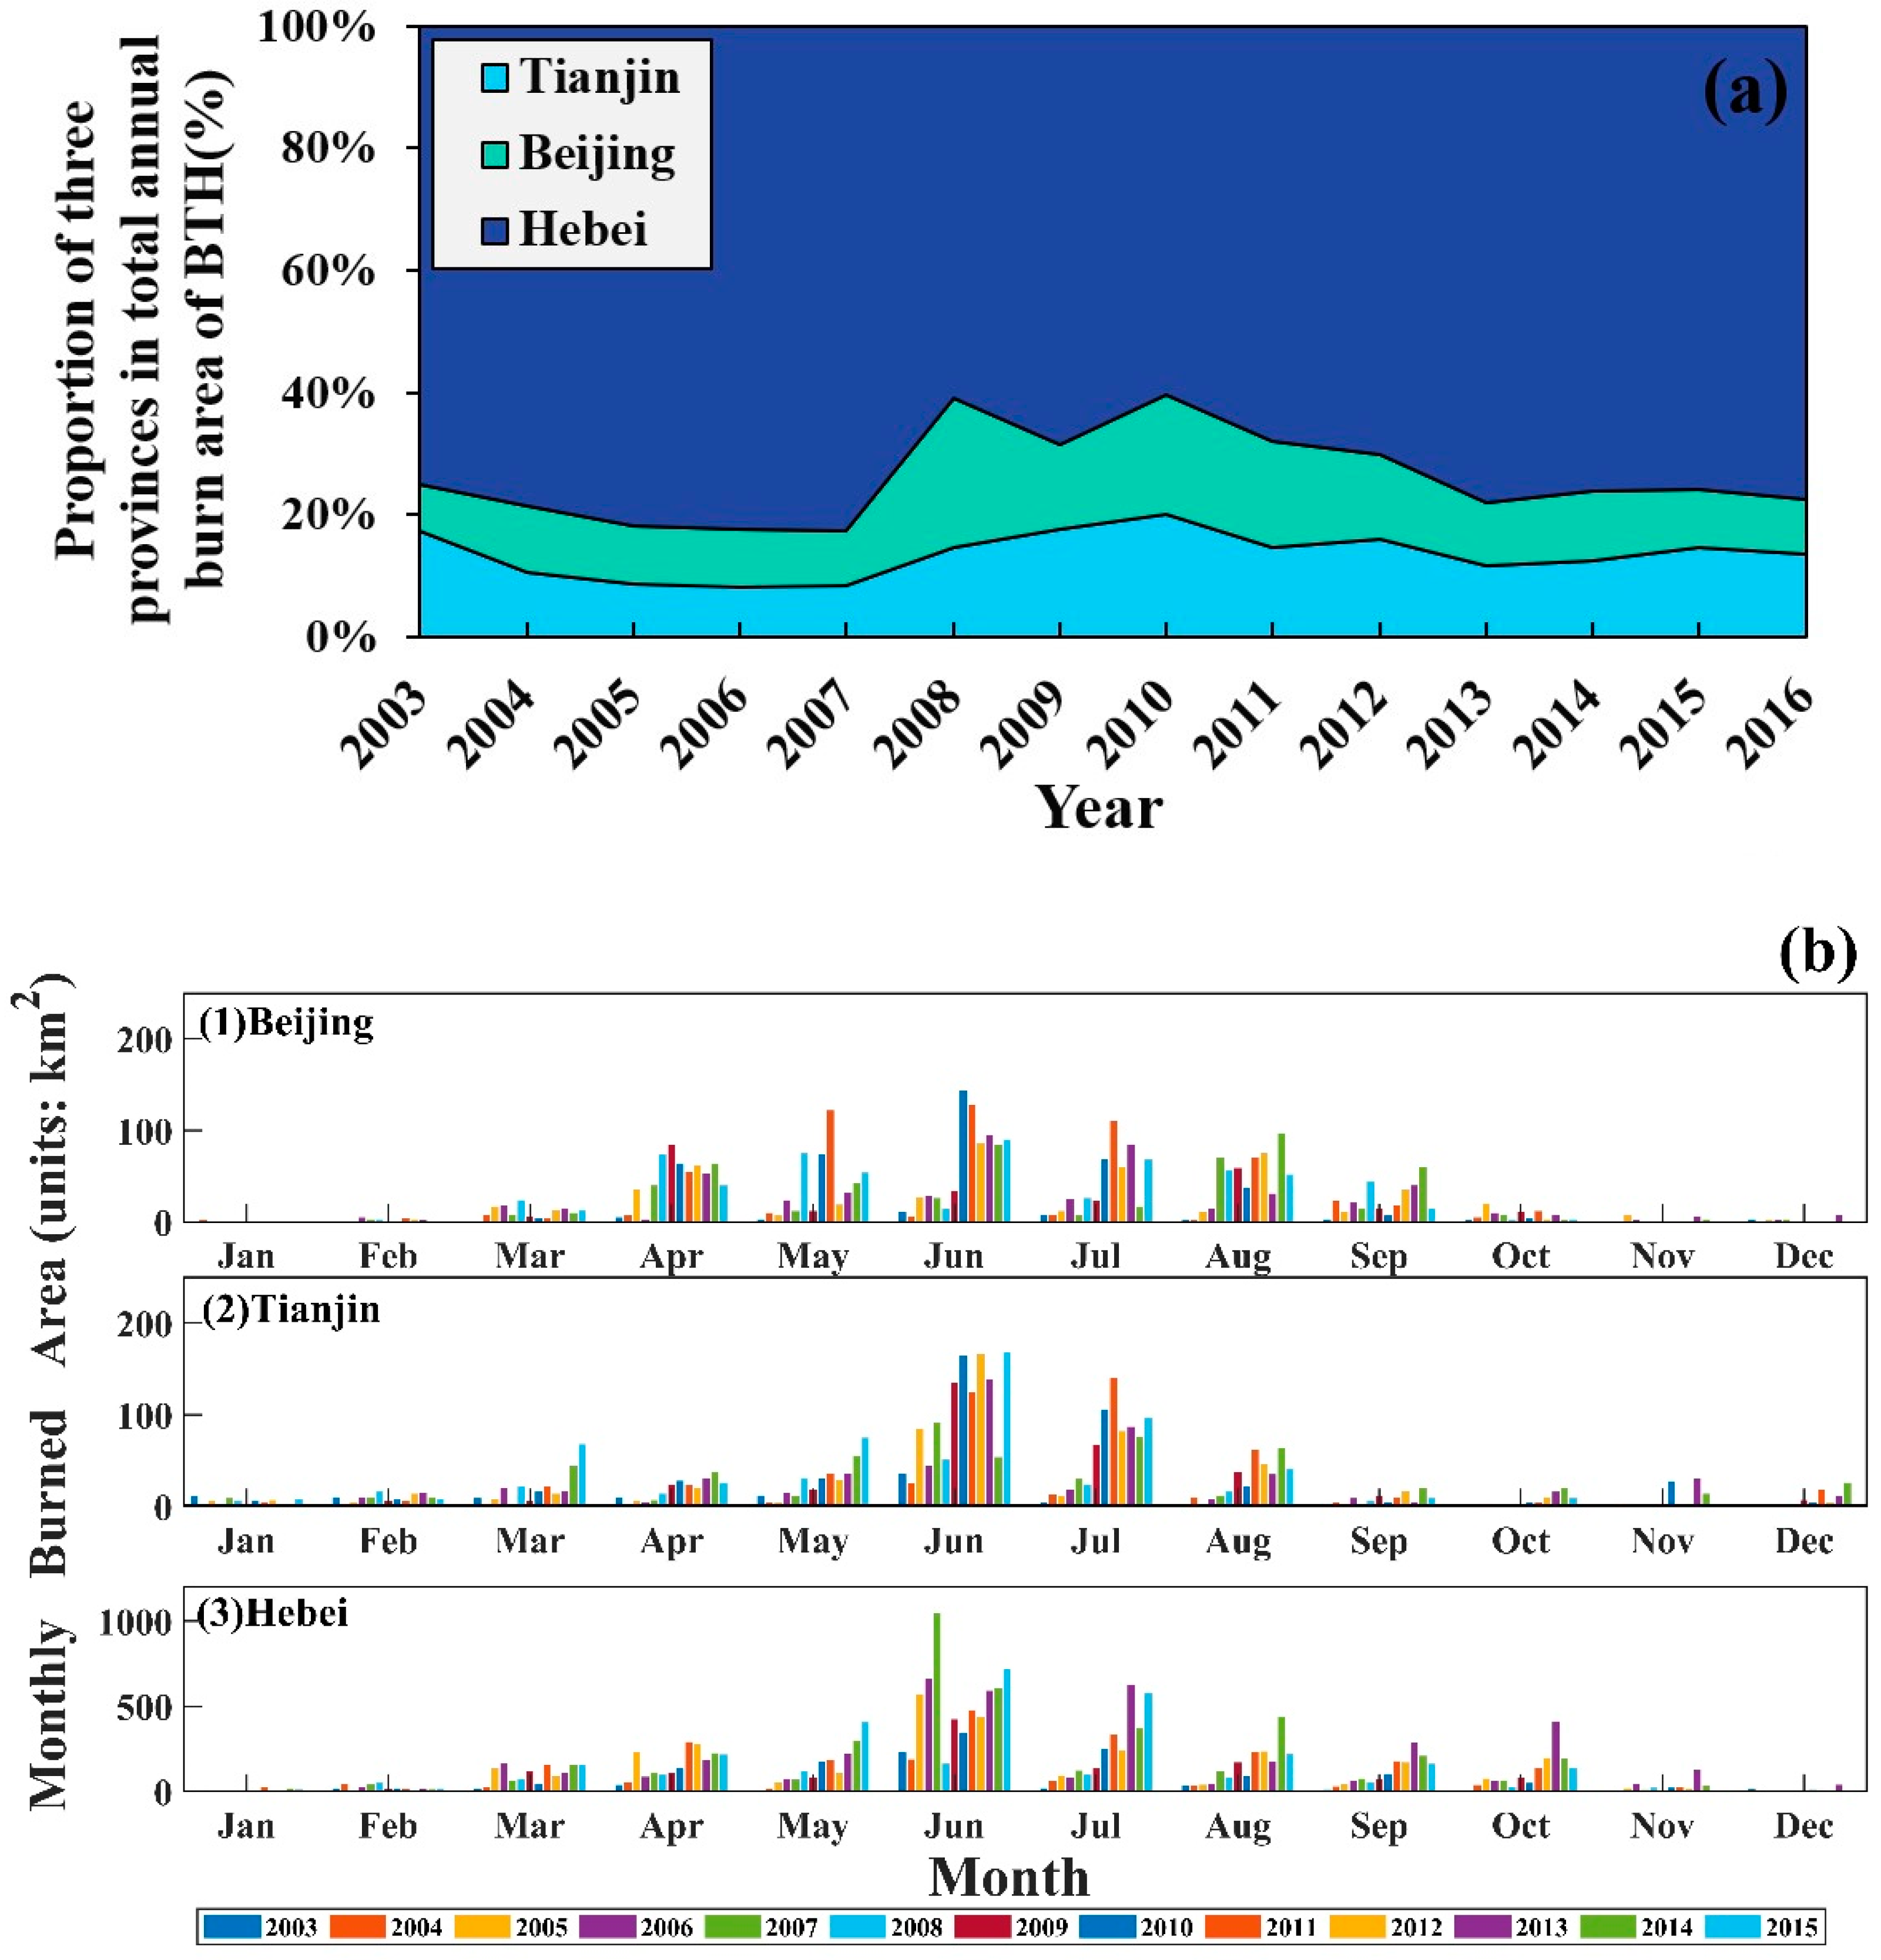
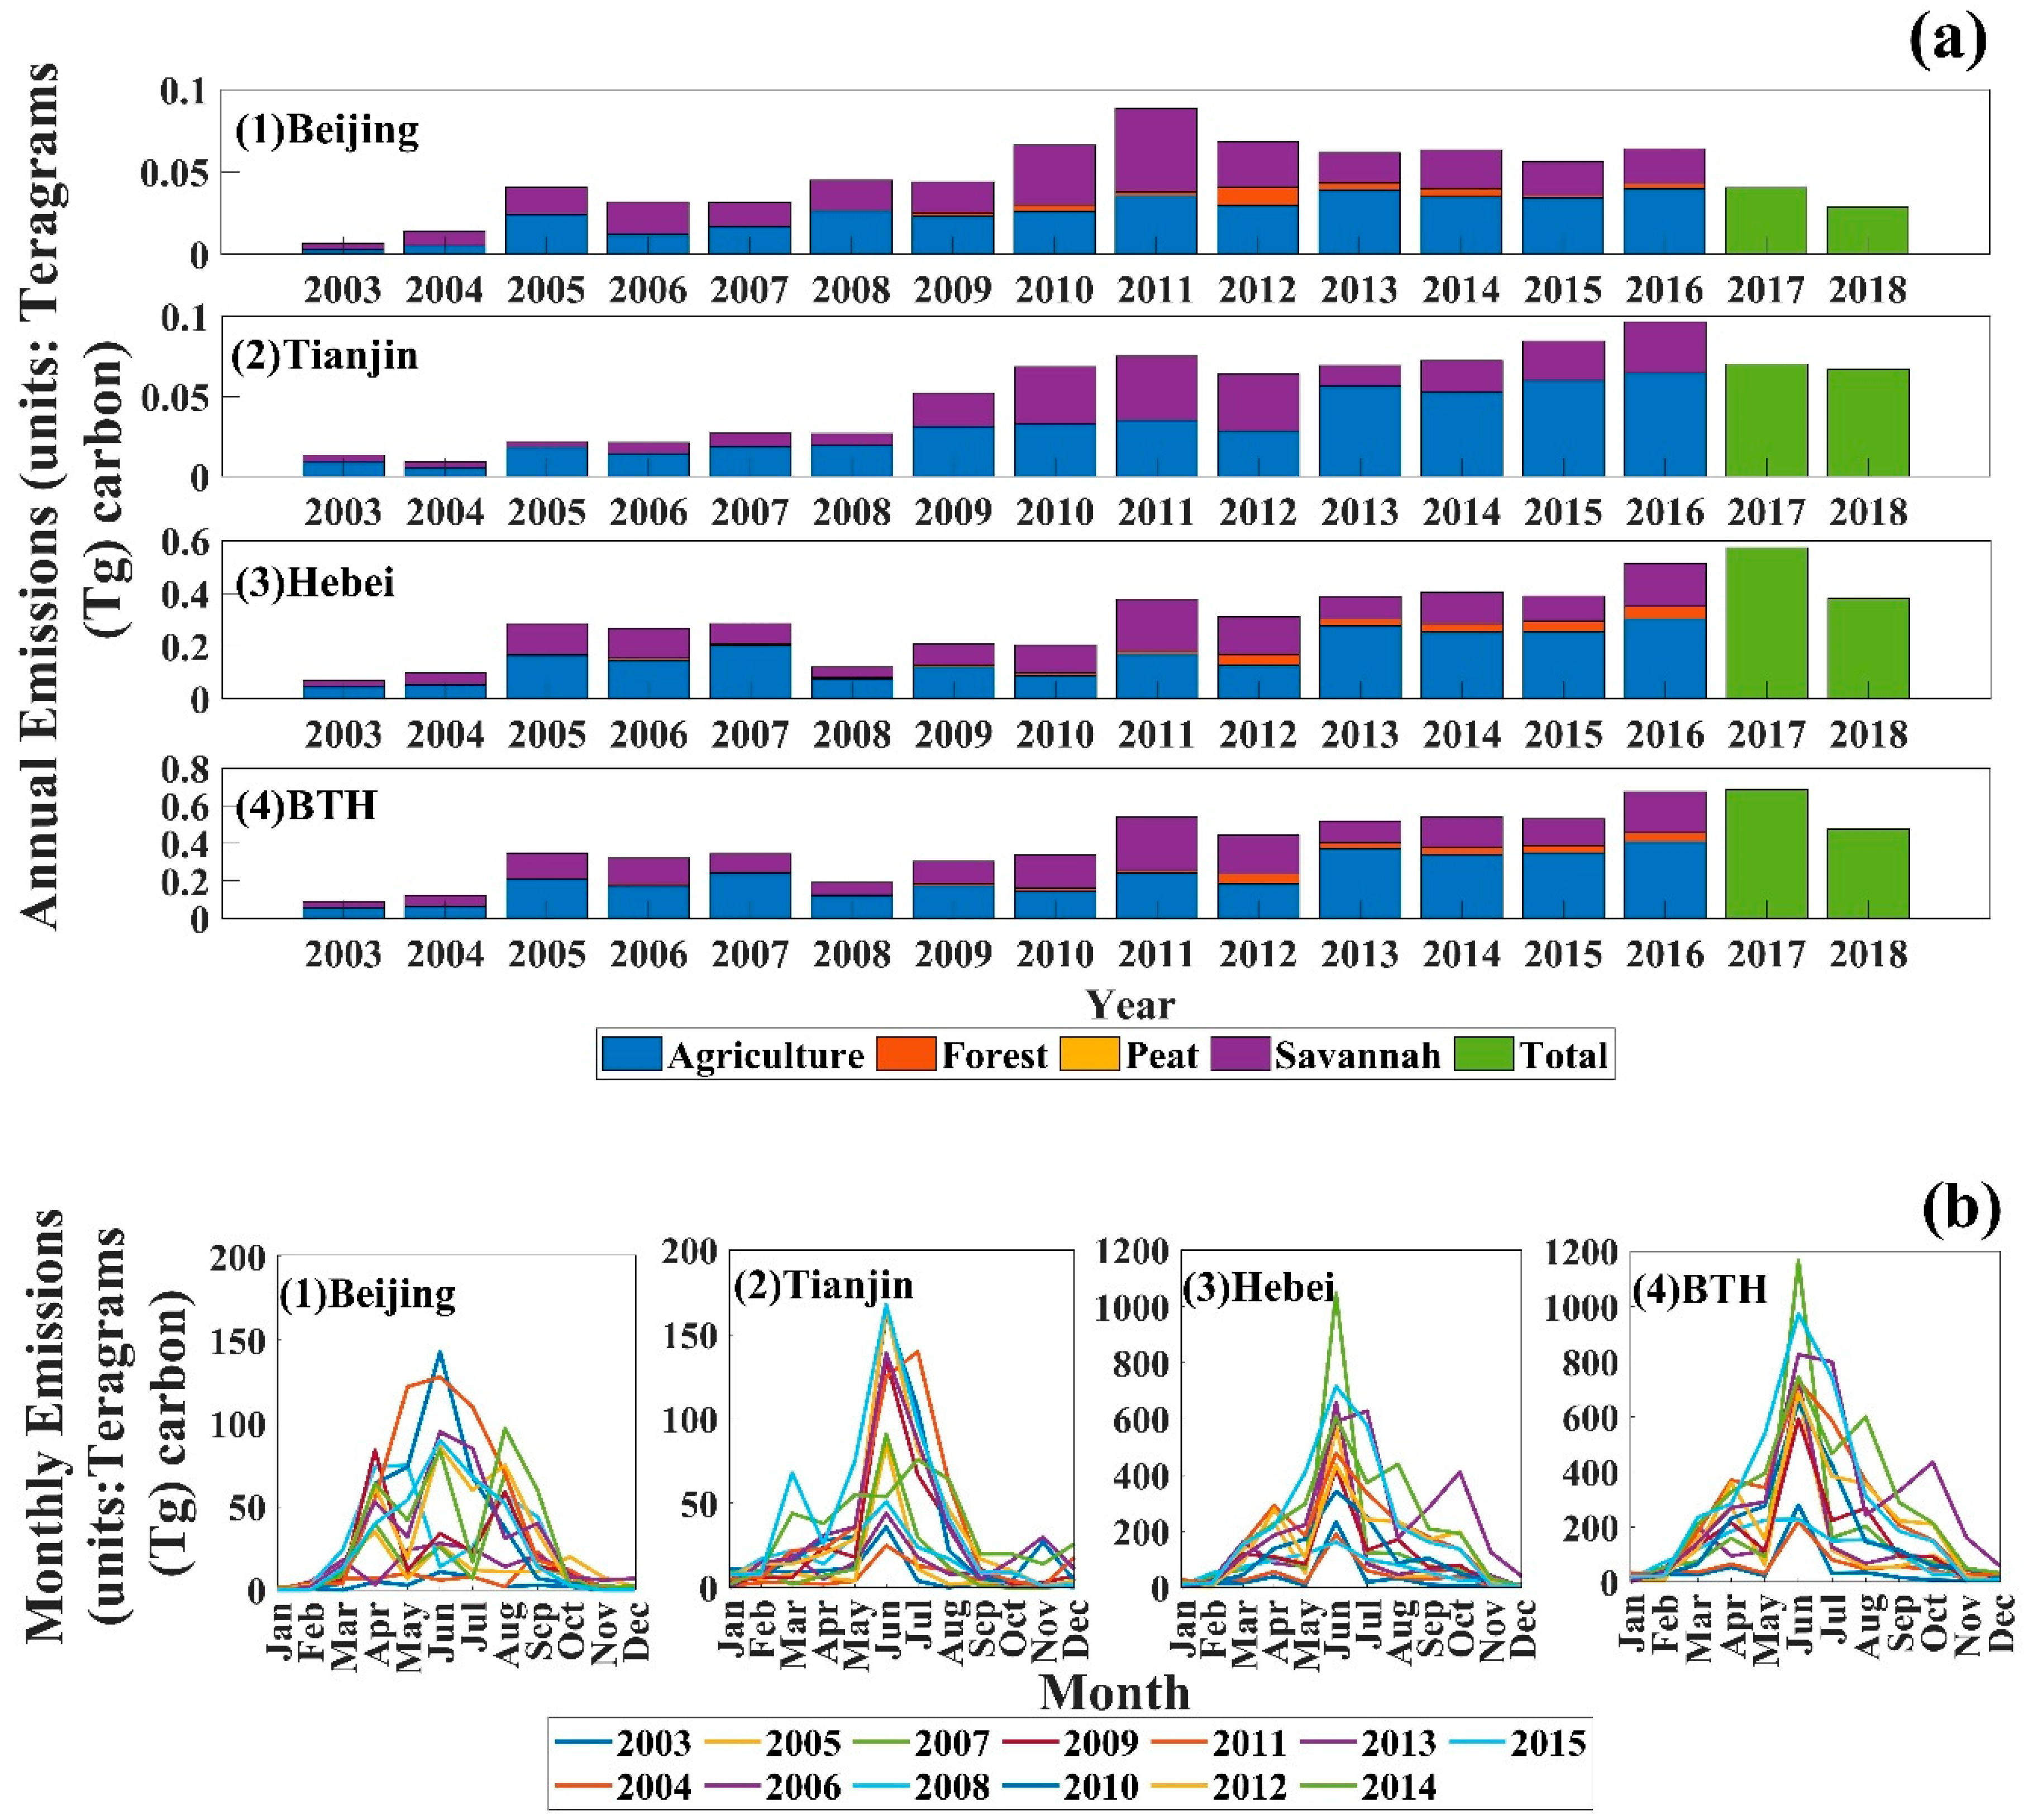
3.2. Temporal and Spatial Patterns of BB Carbon Emissions in BTH

Figure 5 shows the annual and monthly changes of BB carbon emissions from GFED4 in BTH from 2003–2018, with the highest in 2016 (0.6748 Tg, accounting for 10.43% of the total emissions) and the lowest in 2003 (0.089 Tg). We can divide the emissions into three periods, which are shown in Figure 5a-(4). The first period from 2003 to 2011 is the rising period, in which the emissions decreased due to the Olympic Games in 2008, the second period from 2012 to 2016 is the stable period, and the period from 2017 to 2018 is the declining period. In addition to the exceptionally high number of BB carbon emissions in October 2013, the BB carbon emissions were mainly concentrated in June, followed by a slightly higher number of BB carbon emissions in March and August. The monthly highest emissions were in June 2007, with emissions of 0.168 Tg, accounting for 3.6% of the total emissions. It can be clearly seen that BB carbon emissions in January, February, November, and December were all at low peaks, while the emissions in June were the monthly highest, which also shows that there are obvious seasonal changes in BB carbon emissions (Figure 5b). BB carbon emissions in winter were lower, with an emission value of 0.168 Tg, accounting for 3.6% of the total emissions, and the emissions in summer were high, with an emission value of 2.2382 Tg, accounting for 48.3% of the total emissions. The volatility is basically in line with the timing of agriculture. Winter wheat (planted in mid-October, harvested at the end of May) and summer maize (planted in mid-June, harvested at the end of September) are the two most important crops in the zone. Among them, the peak of the fires in June resulted from the harvest of winter wheat. To increase the soil fertility for the next cultivation, the wheat residue is burned after harvest. The biomass burning in October–November may be attributed to the maturity of the corn and subsequent burning of corn stalks, but it was not as concentrated as in June and lower than June in the total area of combustion.
According to the analysis of three subregions in BTH, the total value of BB carbon emissions is 4.6321Tg, Beijing, Tianjin, and Hebei are 0.6178 Tg (accounting for 13.34%), 0.604 Tg (13.03%), and 3.4103 Tg (73.62%), respectively. It is inferred that the BB carbon emission is the highest in Hebei province and the lowest in Tianjin. The annual data can be seen in Table 1. Among them, only Beijing reached the maximum carbon emission in 2011, and both Tianjin and Hebei reached the maximum emission in 2016. For the analysis of forests, Tianjin’s carbon emissions from forests were not significant. Overall, Tianjin had roughly the same trend in carbon emissions as Hebei. The changing trend of Beijing was roughly the same as that of the other two provinces in 2011, and it entered a period of volatility after 2011. It is proved once again that the data of the three regions are consistent with the total region, with the highest emissions in June and fewer emissions in winter.
In addition to the analysis of the inter-annual variation of BB carbon emissions at specific periods and in specific regions, this paper also counted the four major vegetation types of fires and calculated the corresponding contribution ratios, as shown in Figure 5a. Four major vegetation types of fires demonstrated the largest proportion in agriculture (58.1%), then in grassland (35.5%), and forest (4.1%), with the fewest in peatland, which was attributed to the larger proportion of agriculture and grassland to the entire vegetation coverage. For agriculture, 2016 was the year with the largest annual emissions, with emissions of 0.4076 Tg, and 2003 was the year with the annual lowest emissions, with emissions of 0.0566 Tg. There was a significant increase from 2003 to 2005, the first decline in 2006 and a rebound in 2007. Due to the 2008 Beijing Olympic Games, there was a significant decrease for the first time and a rebound in 2009. From 2012 to 2013, there was the largest increase in the whole analysis period. From 2014 to 2016, it was stable with small fluctuations. From the perspective of grassland, the annual emission in 2003 was the lowest, 0.0332 Tg, and the annual emission in 2011 was the highest, 0.2868 Tg. Emissions increased steadily from 2003 to 2005, decreased significantly in 2008, increased steadily from 2008 to 2011, and reached the maximum in 2011. For the forest, we can see that the emission of forest land is the least, and it is 0 in most years in Beijing and Tianjin. There was a significant decrease for the first time and a rebound in 2009, which only exceeded 0.05 Tg in 2012, and 2012 is the year with the annual highest emission (0.0523 Tg).
For an improved understanding of the quantitative relationship of annual variation among fire counts and BB carbon emissions, the linear regression was analyzed for four zones, as shown in Figure 6. The results revealed a positive correlation between the fire counts and carbon emissions, whether in a subregion or the total area of BTH. The correlation coefficients of Beijing, Tianjin, Hebei, and BTH are 0.79, 0.81, 0.84, and 0.89, respectively. Of course, it can be understood that higher carbon emissions are affected by more fire counts. In addition, the increase in emissions is related to the hot weather in the current month, the frequent occurrence of forest fires, and the emission of pollutants from straw burning.

3.3. BB Fire Counts and Carbon Emissions in 2020 in BTH

Through the introduction in the previous sections, we have a general understanding of the overall trend of fire counts and carbon emissions in BTH. Now we focus on analyzing the situation in BTH in 2020 during the COVID-19 outbreak.
First, the time and space analysis of fire counts in 2020 was carried out. The monthly maximum fire counts in BTH were in July 2020, with 847, accounting for 16.65% of the total fire counts in 2020. It exceeded 700 in March, May, June, and July, which is closely related to crop harvesting and burning straw and the climate of high temperature and rain in the summer. The month with the lowest fire counts was December. The number of fire counts was 52, accounting for 1.02% of the total number of fire counts in the whole year. This is because the temperature is low in winter, the weather is cold, it is not easy to cause fire, the land is wet and cold in winter, and the straw is not easy to burn. By region, Tianjin is quite different from the general trend. The fire counts in Tianjin were the highest in March and April but lower in June and July. It shows that the fire counts in Tianjin are closely related to crop planting and straw burning. Beijing was controlled well in June, increased suddenly in July, and decreased from August to December. The fire counts trend of Beijing in June 2020 is different from the overall trend from 2003 to 2020. The overall trend is the peak of fire counts in June, which also shows that with progress over time, the problem of fire count concentration in June has begun to improve. Hebei is the region with the highest fire counts emissions in BTH, of which March, May, June, and July have the peak fire counts in a year. In the highest month, Tianjin fire counts do not exceed 100, Beijing does not exceed 40, while the highest value of Hebei fire counts is as high as 700. For space, most of the fire counts in BTH are in the south and east of Hebei and the east of Tianjin. The fire counts in Beijing are sparse, and most of them are in the North China Plain and Taihang Mountains, as shown in Figure 7.
According to the C emissions of BTH, the emissions of CO2 were the highest, with the monthly average accounting for 8.3% of the cumulative CO2, the emissions of particulate matter were the lowest, and its monthly average also accounted for 8.3% of the cumulative emissions. Among them, the cumulative emissions of C were 201 (Gg), the cumulative emissions of CO were 39 Gg, the cumulative emissions of CO2 were 670 Gg, the cumulative emissions of CH4 were 2 Gg, the cumulative emissions of dry matter were 417 Gg, and the cumulative emissions of particulate matter were 3 Gg. The six substances are roughly proportional from the broken line diagram. The emissions of particulate matter were relatively stable, and the other five emissions were the highest in March. It showed a downward trend from March to May and a small peak in June. This is roughly the same as fire counts emissions in 2020. Combined with the start of 2020 in BTH, COVID-19 began to increase its emissions.
From a subregional perspective, in 2020, the fire counts in Beijing rose steadily from February to April, as shown in Figure 8a. In terms of CO2 emissions, March was still the highest peak, and the emissions were proportional. The emissions of CO2 were the highest, and the emissions of particulate matter were the lowest. June was the inflection point of the decline of fire counts, and its C emissions also fell to a low point. In September, C emissions ushered in an upward period again, which is connected with agricultural straw burning.
From a sub-regional point of view, Tianjin’s fire counts have a certain correlation with carbon emissions (Figure 8b). March was the highest for fire counts, and its C emissions also reached the highest value, of which CO2 emissions were still high, and particulate emissions were the lowest. There are two inflection points in Tianjin. At the same time, the number of fire counts decreased in June, while C emissions are still increasing, and the fire counts increased in August, but C emissions are decreasing.
In 2020, the C emissions in Hebei were roughly the same as that in BTH Figure 8c. March had the highest value of CO2 emissions, which decreased from March to May. In June, straw burning increased again due to hot weather, elevated temperature, and mature crops. In 2020, there was no significant correlation between fire counts and C emissions after March. The fire counts coincided with the C emissions and peaked in March. Hebei sits on the North China Plain, with flat terrain and hot summers, causing fires to flare up in June and July. In addition, comparing the three regions, the fire counts of Beijing and Tianjin showed a downward trend in June, while the fire counts of Hebei were still rising in June. For carbon emissions, the three provinces reached the highest value in March, in which CO2 emissions accounted for the highest value of total carbon emissions, and particulate matter accounted for the lowest value of total carbon emissions.

4. Conclusions

By using GFED4 data, this research attempted to explore the spatial and temporal distribution of biomass burning in the study area from 2003 to 2020, the corresponding proportion of different vegetation types, and the causes of inter-annual changes in BTH. Hence, we can draw the following conclusions:
Based on the analysis of fires counts in BTH from 2003 to 2020, the number of fire counts in 2013 was the highest, and fire counts in 2003 were the lowest. In terms of months, due to the cold winter in the north, December and January had the lowest fire counts. The temperature increased in June, and the number of fire counts reached the maximum during the high incidence period of thunderstorm season. In terms of sub-regions, Hebei had the highest fire counts, Tianjin had the second highest, and Beijing had the least. Combining the characteristics of burned areas in BTH, the burned area in 2016 was the largest, accounting for 14.20% of the total burned area, and the burned area in 2003 was the smallest, accounting for 1.66% of the total burned area. The burned area is the lowest in January and the highest in June. In January, due to the winter in BTH, temperatures are low, the forests, grasslands, and agricultural lands are covered with ice and snow, which makes it not easy to cause fire, and the winter is cold. Farmers hardly burn straw in a large area in this season. In June, it is hot and rainy. There is not only a lot of straw burning, but heavy rain often brings lightning and fire.
According to the carbon emissions characteristics of BTH, the total annual emissions from 2003 to 2018 were 6.4679Tg, with the lowest emissions in 2003 and the highest emissions in 2011. According to the analysis of months and seasons, the most carbon emissions are in June and the least in January. Our results indicate that this is mainly due to the influence of seasons. March also shows a small peak of carbon emissions, which is closely related to factory emissions and agricultural straw burning in BTH.
Through a separate study for the year 2020, we found that because BTH is located in the North China Plain and the terrain is flat, it is easy to cause fire count aggregation, and its fire count peak areas are concentrated in the North China Plain and Taihang Mountains. Due to the influence of 2020 and the factors of factories in BTH, the carbon emissions still reached the highest value in March, and the highest fire counts were in the summer in July. The cumulative amount of fire counts in 2020 was 5088, and the cumulative emissions of carbon, CO, CO2, CH4, dry matter, and particulate matter from biomass burning in BTH reached 201 Gg, 39 Gg, 670 Gg, 2 Gg, 417 Gg, and 3 Gg in 2020, respectively.
The methodology and results from this research provide a useful reference for policy-makers to better understand the characteristics and variations of biomass burning in BTH and lay the groundwork for simulating and predicting the impact of biomass burning on air quality in the next work. Accordingly, more effective measures to monitor and control biomass burning in these areas can be posed and carried out to enhance local air quality and protect human health.

Author Contributions

The study was completed with cooperation among all authors: R.X. conceived and designed the research topic. Y.Z. and P.W. processed data and wrote the manuscript. Z.X. and L.W. collaborated in discussing the manuscript and providing editorial advice. All authors have read and agreed to the published version of the manuscript.

Funding

This research is financially supported by the Shaanxi postdoctoral research project (No. 2018BSHQYXMZZ10).

Institutional Review Board Statement

Not applicable.

Informed Consent Statement

Not applicable.

Data Availability Statement

Not applicable.

Acknowledgments

We want to express the appreciation for the useful Global Fire Emissions Database (GFED) dataset available for us, which freely available at http://www.globalfiredata.org (accessed on 26 December 2021).

Conflicts of Interest

The authors declare no conflict of interest.

References

  1. Chen, J.; Li, C.; Ristovski, Z.; Milic, A.; Gu, Y.; Islam, M.S.; Wang, S.; Hao, J.; Zhang, H.; He, C.; et al. A review of biomass burning: Emissions and impacts on air quality, health and climate in China. Sci. Total Environ. 2017, 579, 1000–1034. [Google Scholar] [CrossRef] [PubMed] [Green Version]
  2. Koppmann, R.; Von Czapiewski, K.; Reid, J.S. A review of biomass burning emissions, part I: Gaseous emissions of carbon monoxide, methane, volatile organic compounds, and nitrogen containing compounds. Atmos. Chem. Phys. Discuss 2005, 5, 10455–10516. [Google Scholar]
  3. Reid, J.S.; Eck, T.F.; Christopher, S.A.; Koppmann, R.; Dubovik, O.; Eleuterio, D.P.; Holben, B.N.; Reid, E.A.; Zhang, J. A review of biomass burning emissions part III: Intensive optical properties of biomass burning particles. Atmos. Chem. Phys. 2005, 5, 827–849. [Google Scholar] [CrossRef] [Green Version]
  4. Reid, J.S.; Koppmann, R.; Eck, T.F.; Eleuterio, D.P. A review of biomass burning emissions part II: Intensive physical properties of biomass burning particles. Atmos. Chem. Phys. 2005, 5, 799–825. [Google Scholar] [CrossRef] [Green Version]
  5. Van Leeuwen, T.T.; van der Werf, G.R. Spatial and temporal variability in the ratio of trace gases emitted from biomass burning. Atmos. Chem. Phys. 2011, 11, 3611–3629. Available online: https://acp.copernicus.org/articles/11/3611/2011/ (accessed on 26 December 2021). [CrossRef] [Green Version]
  6. Chuvieco, E.; Pettinari, M.L.; Koutsias, N.; Forkel, M.; Hantson, S.; Turco, M. Human and climate drivers of global biomass burning variability. Sci. Total Environ. 2021, 779, 146361. [Google Scholar] [CrossRef] [PubMed]
  7. Lu, C.W.; Fu, J.; Liu, X.F.; Chen, W.W.; Hao, J.L.; Li, X.L.; Pant, O.P. Air pollution and meteorological conditions significantly contribute to the worsening of allergic conjunctivitis: A regional 20-city, 5-year study in Northeast China. Light Sci. Appl. 2021, 10, 190. [Google Scholar] [CrossRef] [PubMed]
  8. Li, W.; Ge, P.; Chen, M.; Tang, J.; Cao, M.; Cui, Y.; Hu, K.; Nie, D. Tracers from Biomass Burning Emissions and Identification of Biomass Burning. Atmosphere 2021, 12, 1401. [Google Scholar] [CrossRef]
  9. Xu, R.; Tang, G.; Wang, Y.; Tie, X. Analysis of a long-term measurement of air pollutants (2007–2011) in North China Plain (NCP); Impact of emission reduction during the Beijing Olympic Games. Chemosphere 2016, 159, 647–658. [Google Scholar] [CrossRef] [PubMed]
  10. Xu, R.; Tie, X.; Li, G.; Zhao, S.; Cao, J.; Feng, T.; Long, X. Effect of biomass burning on black carbon (BC) in South Asia and Tibetan Plateau: The analysis of WRF-Chem modeling. Sci. Total Environ. 2018, 645, 901–912. [Google Scholar] [CrossRef] [PubMed]
  11. Zhao, H.; Zhang, X.; Zhang, S.; Chen, W.; Tong, D.Q.; Xiu, A. Effects of Agricultural Biomass Burning on Regional Haze in China: A Review. Atmosphere 2017, 8, 88. [Google Scholar] [CrossRef] [Green Version]
  12. Ke, H.; Gong, S.; He, J.; Zhou, C.; Zhang, L.; Zhou, Y. Spatial and temporal distribution of open bio-mass burning in China from 2013 to 2017. Atmos. Environ. 2019, 210, 156–165. [Google Scholar] [CrossRef]
  13. Wang, L.; Jin, X.; Wang, Q.; Mao, H.; Liu, Q.; Weng, G.; Wang, Y. Spatial and temporal variability of open biomass burning in Northeast China from 2003 to 2017. Atmos. Ocean. Sci. Lett. 2020, 13, 240–247. [Google Scholar] [CrossRef] [Green Version]
  14. Shi, S.; Ma, Y.; Bao, F.; Mumtaz, F. A Satellite Data Based Detailed Study of the Aerosol Emitted from Open Biomass Burning in Northeast China. Atmosphere 2021, 12, 1700. [Google Scholar] [CrossRef]
  15. Lü, A.; Tian, H.; Liu, M.; Liu, J.; Melillo, J.M. Spatial and temporal patterns of carbon emissions from forest fires in China from 1950 to 2000. J. Geophys. Res. Atmos. 2006, 111, D05313. [Google Scholar] [CrossRef] [Green Version]
  16. Shi, Y.; Gong, S.; Zang, S.; Zhao, Y.; Wang, W.; Lv, Z.; Matsunaga, T.; Yamaguchi, Y.; Bai, Y. High-resolution and multi-year estimation of emissions from open biomass burning in Northeast China during 2001–2017. J. Clean. Prod. 2021, 310, 127496. [Google Scholar] [CrossRef]
  17. Giglio, L.; Randerson, J.T.; Van Der Werf, G.R. Analysis of daily, monthly, and annual burned area using the fourth-generation global fire emissions database (GFED4). J. Geophys. Res. Biogeosci. 2013, 118, 317–328. [Google Scholar] [CrossRef] [Green Version]
  18. Randerson, J.T.; Chen, Y.; Van Der Werf, G.R.; Rogers, B.M.; Morton, D.C. Global burned area and biomass burning emissions from small fires. J. Geophys. Res. Biogeosci. 2012, 117, G04012. [Google Scholar] [CrossRef]
  19. Van Der Werf, G.R.; Randerson, J.T.; Giglio, L.; Van Leeuwen, T.T.; Chen, Y.; Rogers, B.M.; Mu, M.; Van Marle, M.J.; Morton, D.C.; Collatz, G.J.; et al. Global fire emissions estimates during 1997–2016. Earth Syst. Sci. Data 2017, 9, 697–720. [Google Scholar] [CrossRef] [Green Version]
  20. Andreae, M.O.; Merlet, P. Emission of trace gases and aerosols from biomass burning. Glob. Biogeochem. Cycles 2001, 15, 955–966. [Google Scholar] [CrossRef] [Green Version]
Figure 1. Map of the general situation (a) and land cover and land use (b) of the study area.
Atmosphere 13 00459 g001
Figure 2. The spatial distribution of climatic variables (temperature (a), precipitation (b), wind speed (c) and sunlight (d)) over the Beijing–Tianjin–Hebei region between 2003 and 2020.
Atmosphere 13 00459 g002
Figure 3. The annual (a), monthly (b,d), and daily (c) variation of fire counts from GFED4 in different provinces and BTH from 2003 to 2020. BTH represents the provinces of Beijing, Tianjin, and Hebei, respectively.
Atmosphere 13 00459 g003
Figure 4. The annual (a) and monthly (b) variation in GFED4 burned area in different provinces from 2003–2016.
Atmosphere 13 00459 g004
Figure 5. (a) The annual variation of BB carbon emission from GFED4 in BTH from 2003–2018; (b) monthly BB carbon emission from GFED4 in BTH from 2003–2015. In addition, the annual data for 2017–2018 are a preliminary estimate.
Atmosphere 13 00459 g005
Figure 6. Linear relationship between fire counts and carbon emissions from 2003–2018.
Atmosphere 13 00459 g006
Figure 7. Monthly fire counts topographic map of BTH in 2020.
Atmosphere 13 00459 g007
Figure 8. Estimate of monthly carbon, carbon monoxide, carbon dioxide, methane, dry matter, and particulate matter emissions caused by fires in BTH.
Atmosphere 13 00459 g008
Table 1. A dataset of fire counts, carbon emissions, and burning area from 2003 to 2020 in different provinces in BTH.
ItemsFire Count (Units: Terra and Aqua Summed Fire Count)Emission (Units: Teragrams (Tg) Carbon)Burned Area (Units: km2)
YearBJTJHBBTHBJTJHBBTHBJTJHBBTH
2003135170104913540.00660.01350.06970.089840.6593.63400.19534.47
200420575136216420.01400.00920.09990.123172.0169.46518.99660.46
2005363237243630360.04060.02190.28520.3477149.95135.021274.531559.50
2006283185242828960.03180.02120.26730.3203150.87133.291316.961601.12
2007337254326538560.03150.02690.28590.3443193.50176.061740.822110.38
2008472338216629760.04500.02680.12020.1920320.40192.99794.961308.35
2009348391279535340.04390.05210.20740.3034244.75317.681226.981789.41
2010509509303840560.06620.06840.20490.3395403.39419.361247.442070.19
2011637479392850440.08860.07520.37720.5410524.40451.332074.433050.16
2012639552439755880.06830.06390.31260.4448356.02410.271796.472562.76
2013585747536867000.06150.06940.38760.5185373.22423.212799.723596.15
2014423627495960090.06330.07230.40360.5392381.28424.302571.513377.09
2015364555465355720.05630.08450.38940.5302333.35511.762636.123481.23
2016441597547965170.06420.09670.51390.6748409.98622.683550.804583.46
2017341562561665190.04030.07020.57360.6841
2018250542460653980.02850.06700.37970.4752
201930460449455853
202021652343495088
Publisher’s Note: MDPI stays neutral with regard to jurisdictional claims in published maps and institutional affiliations.

