
Spatiotemporal Rainfall Variability and Drought Assessment during Past Five Decades in South Korea Using SPI and SPEI

 ,
,  ,
,  and
and
Abstract
:1. Introduction
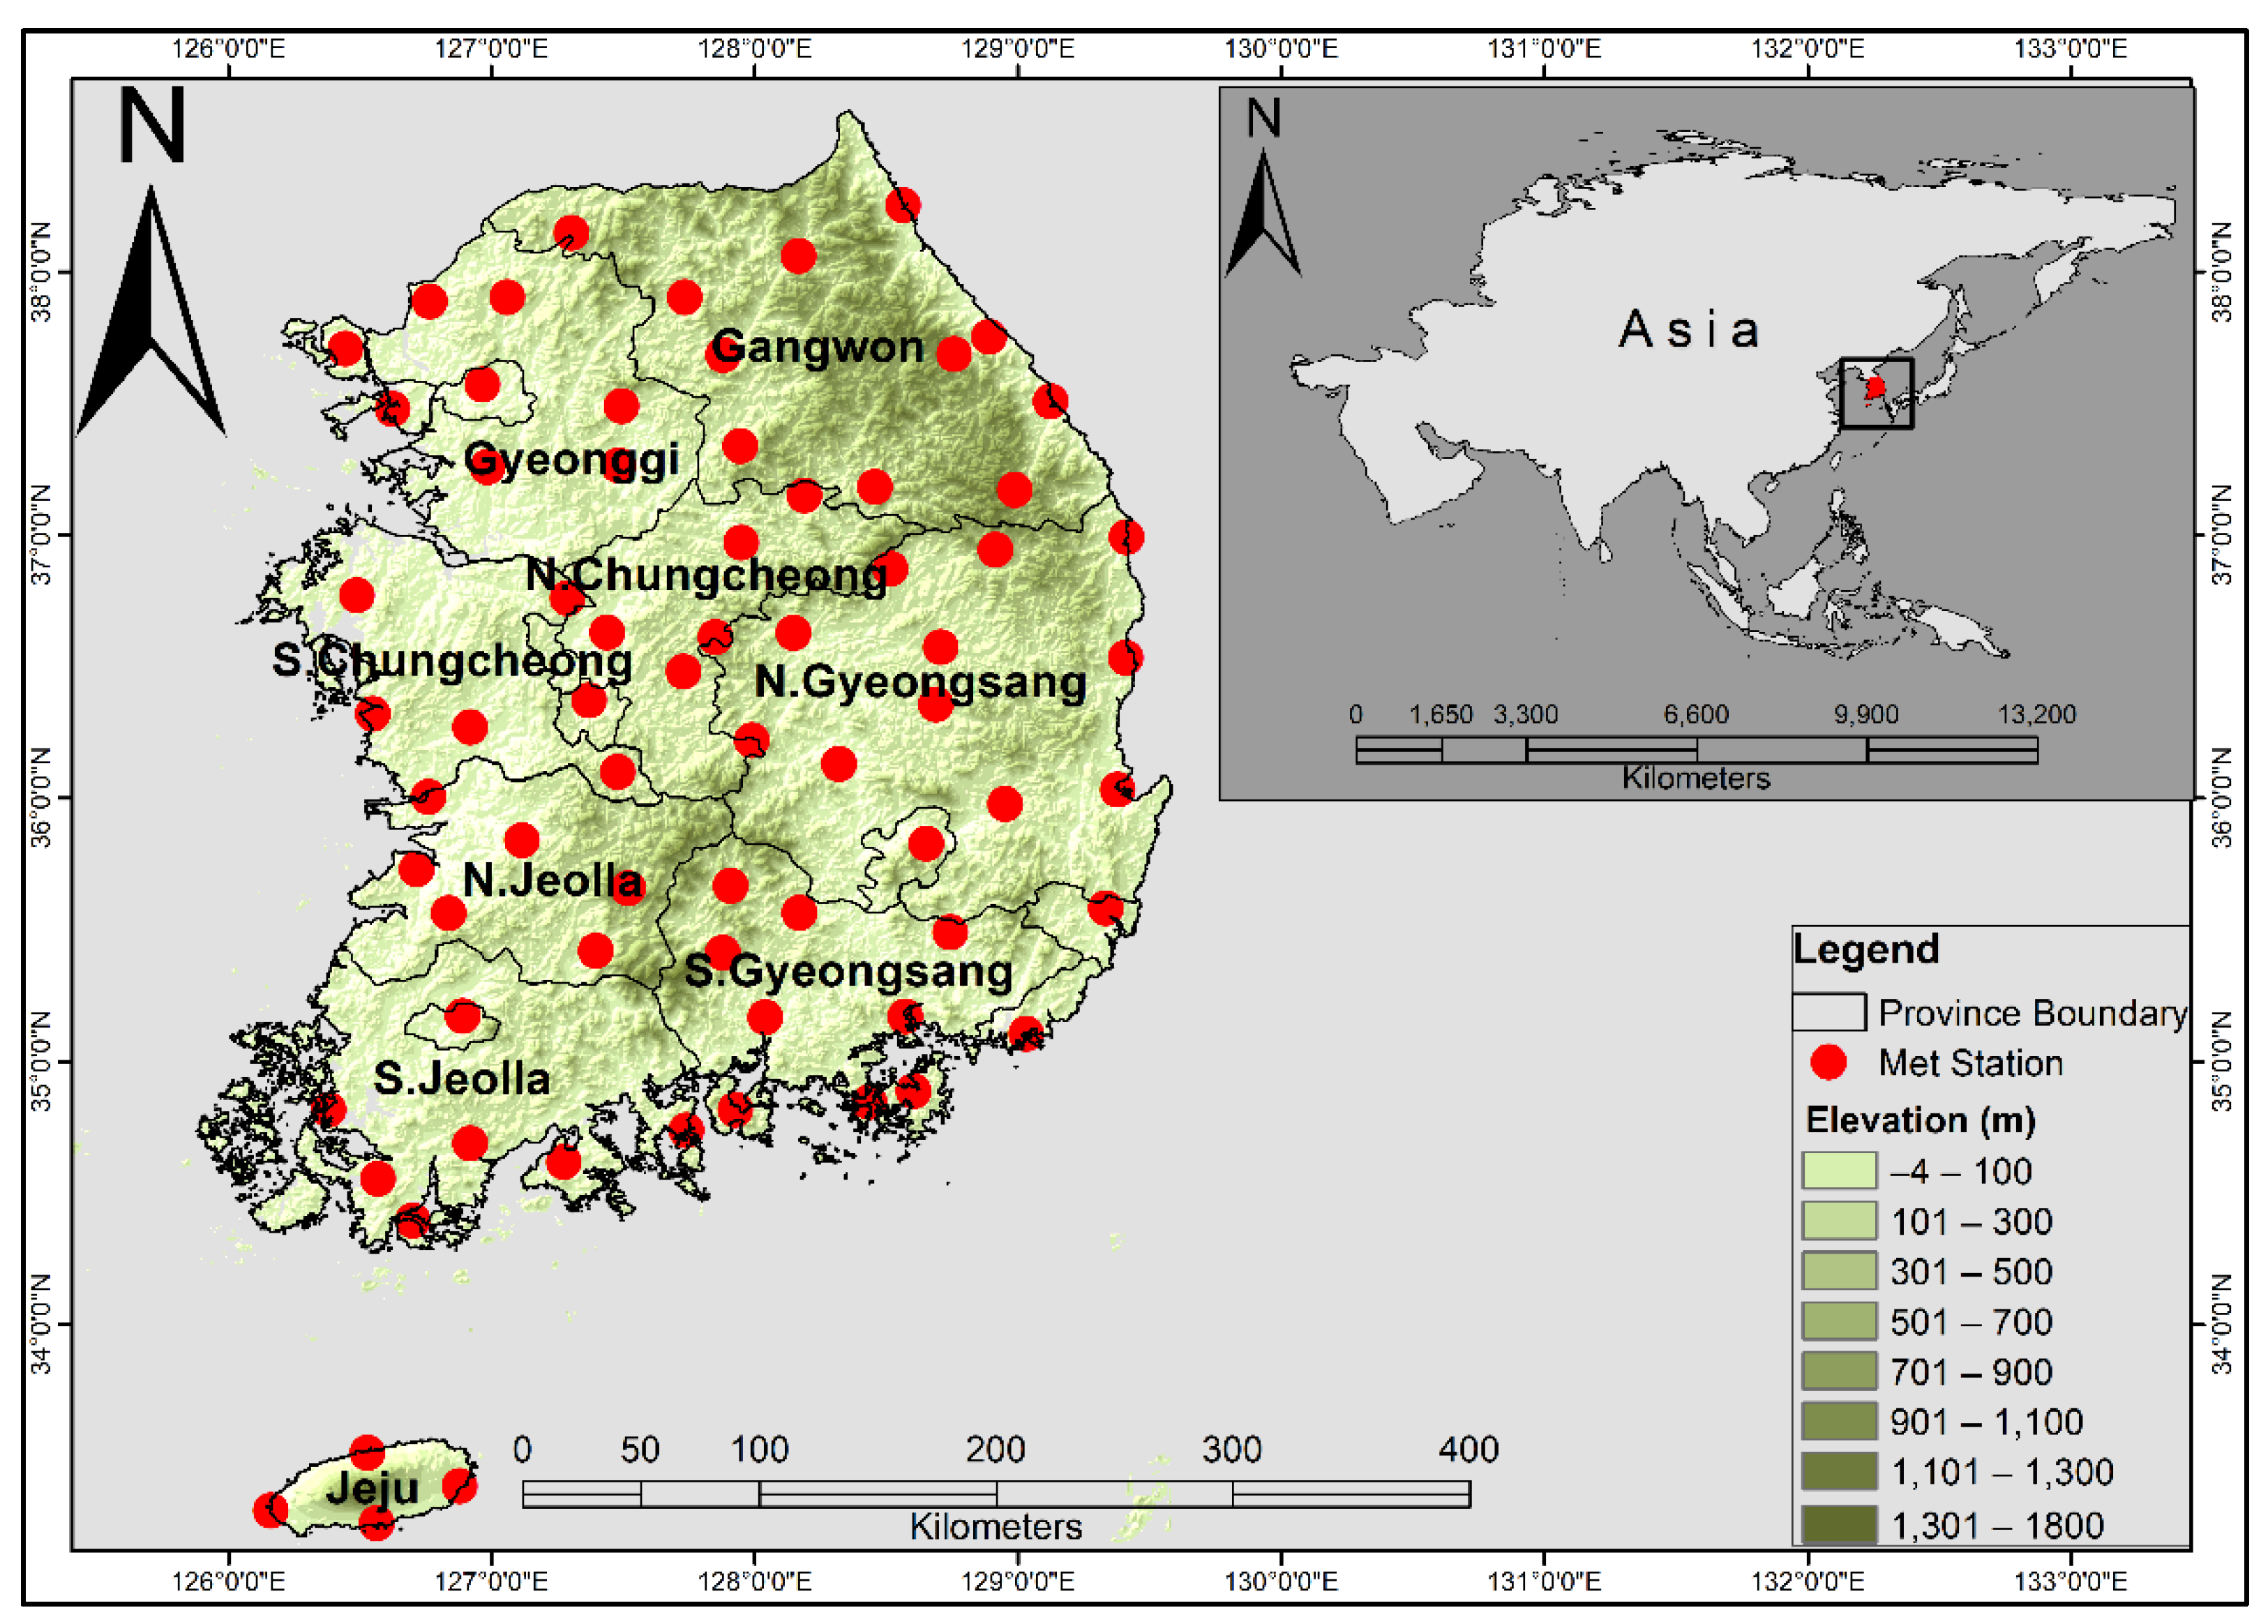
2. Study Area and Data
Data Collection
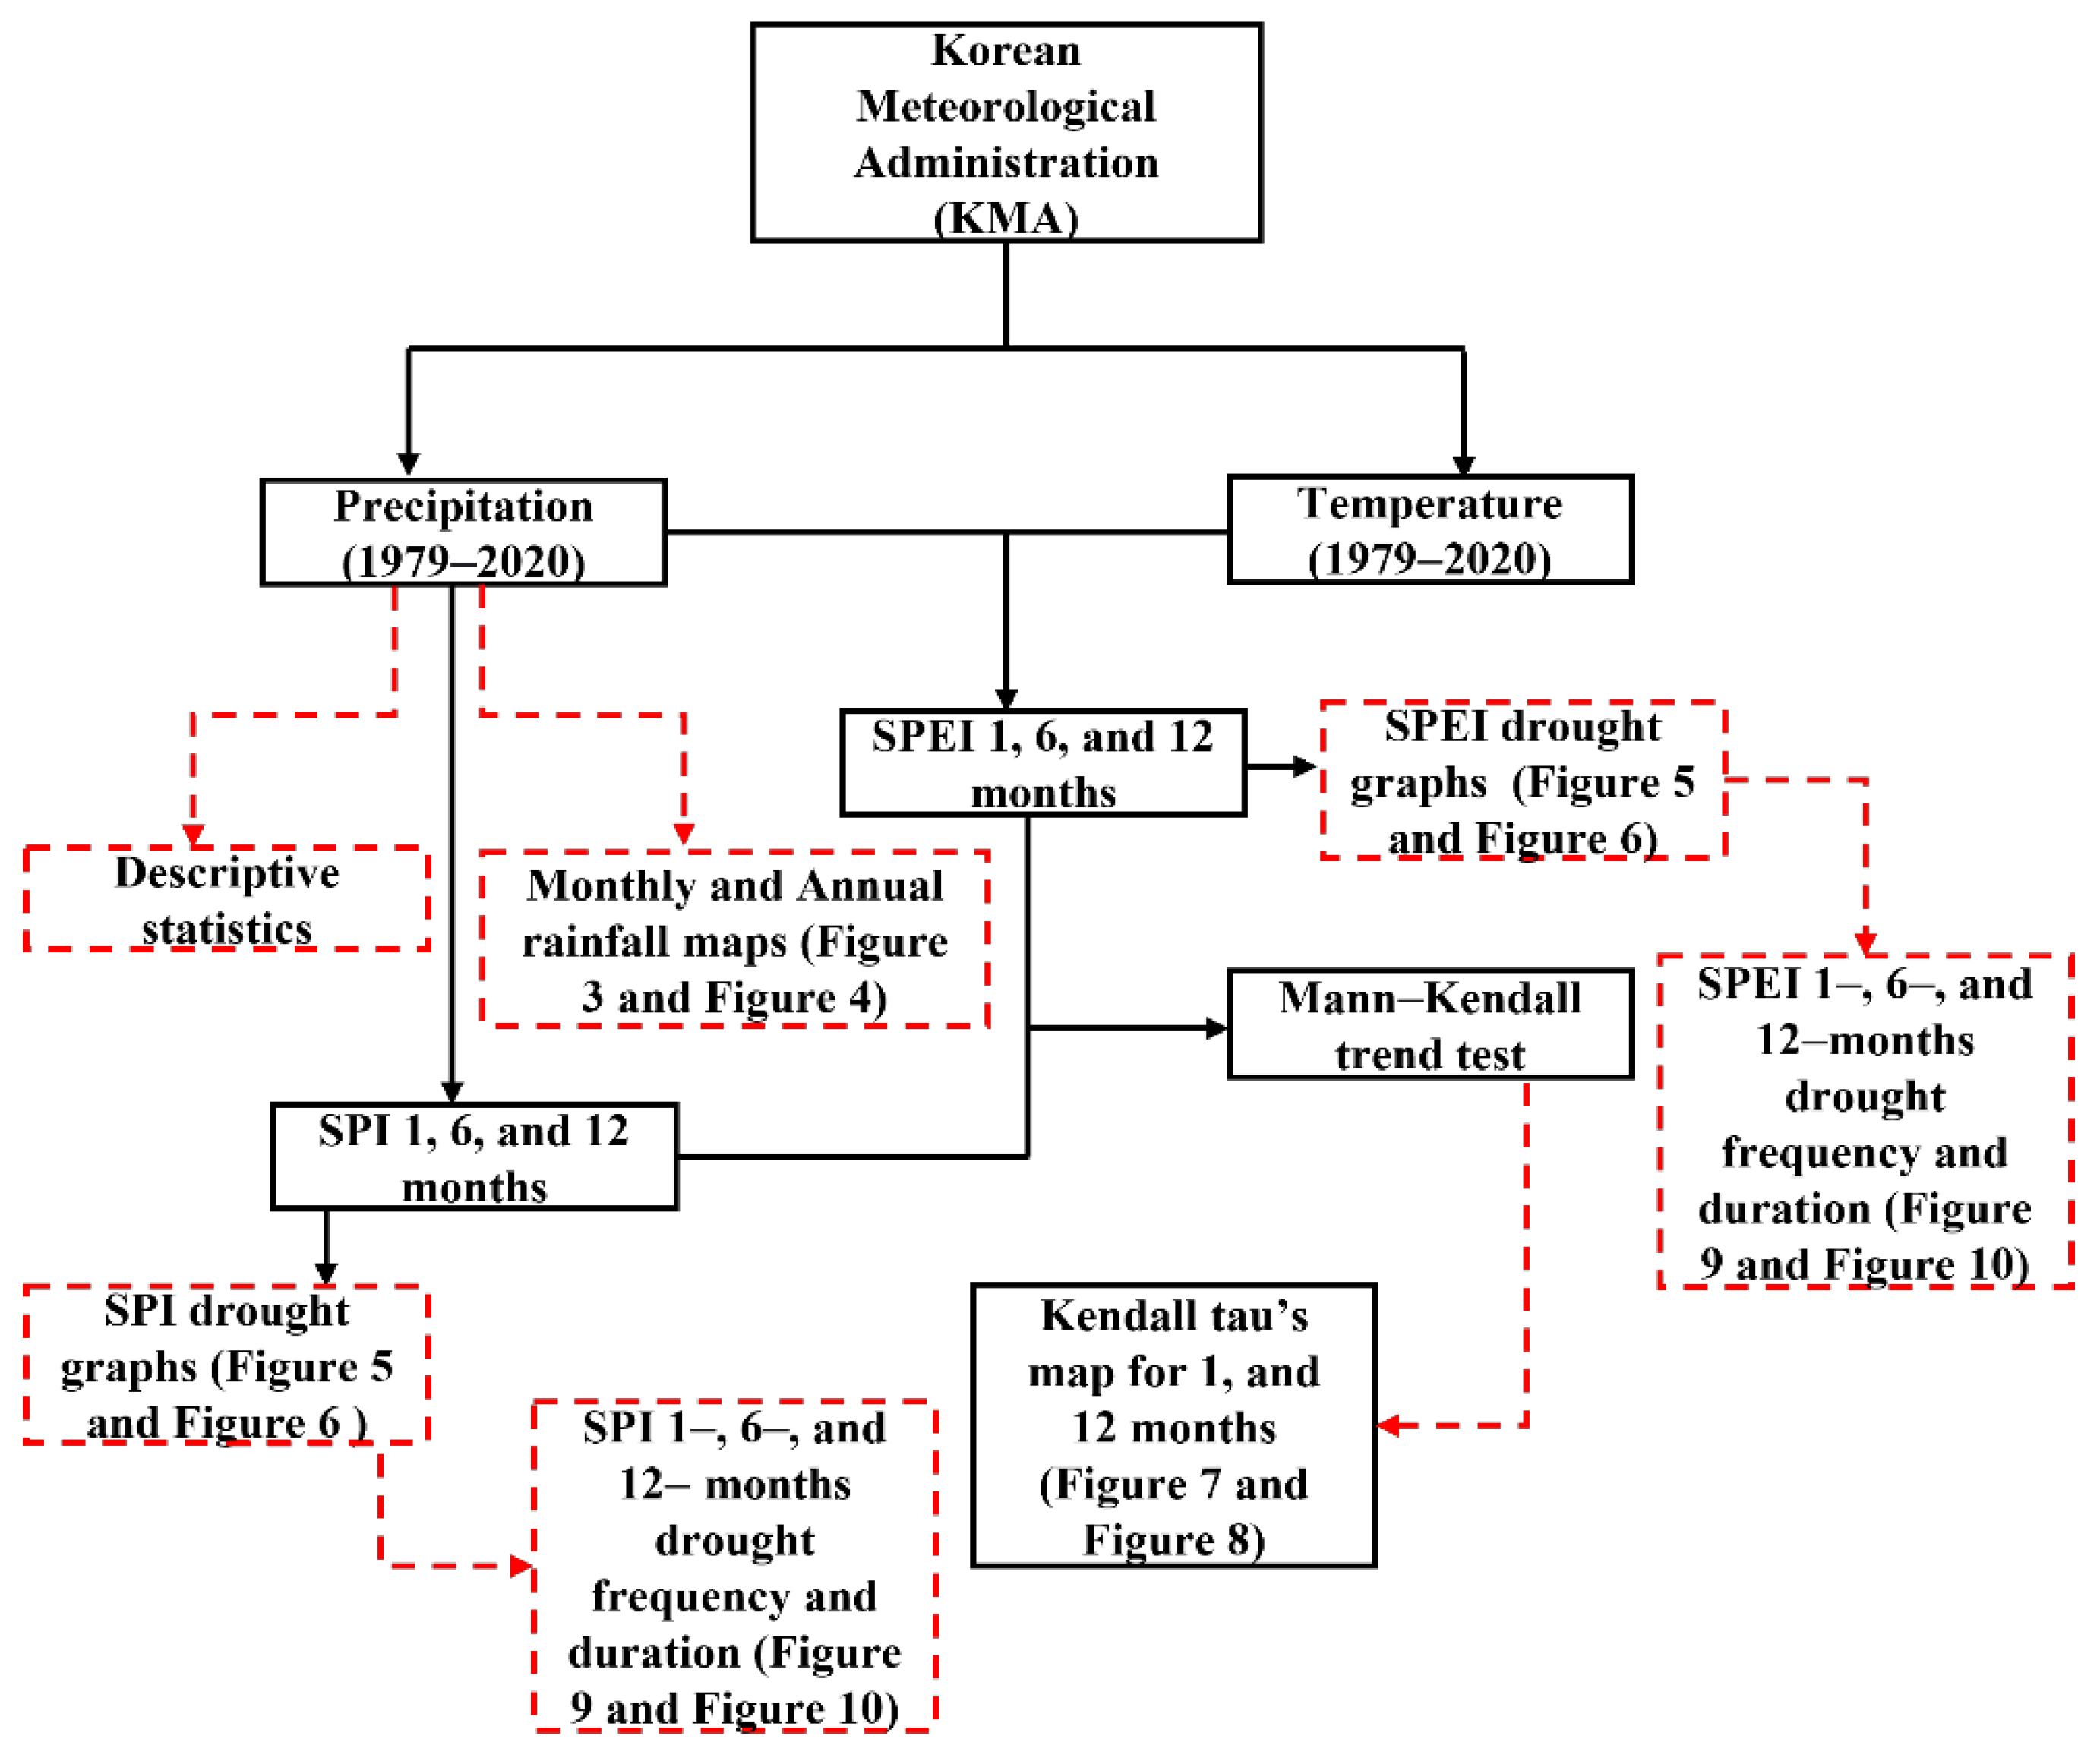
3. Methods
3.1. Standardized Precipitation Index (SPI)
3.2. Standardized Precipitation Evapotranspiration Index (SPEI)
3.3. Mann-Kendall (MK)Trend Test
4. Results
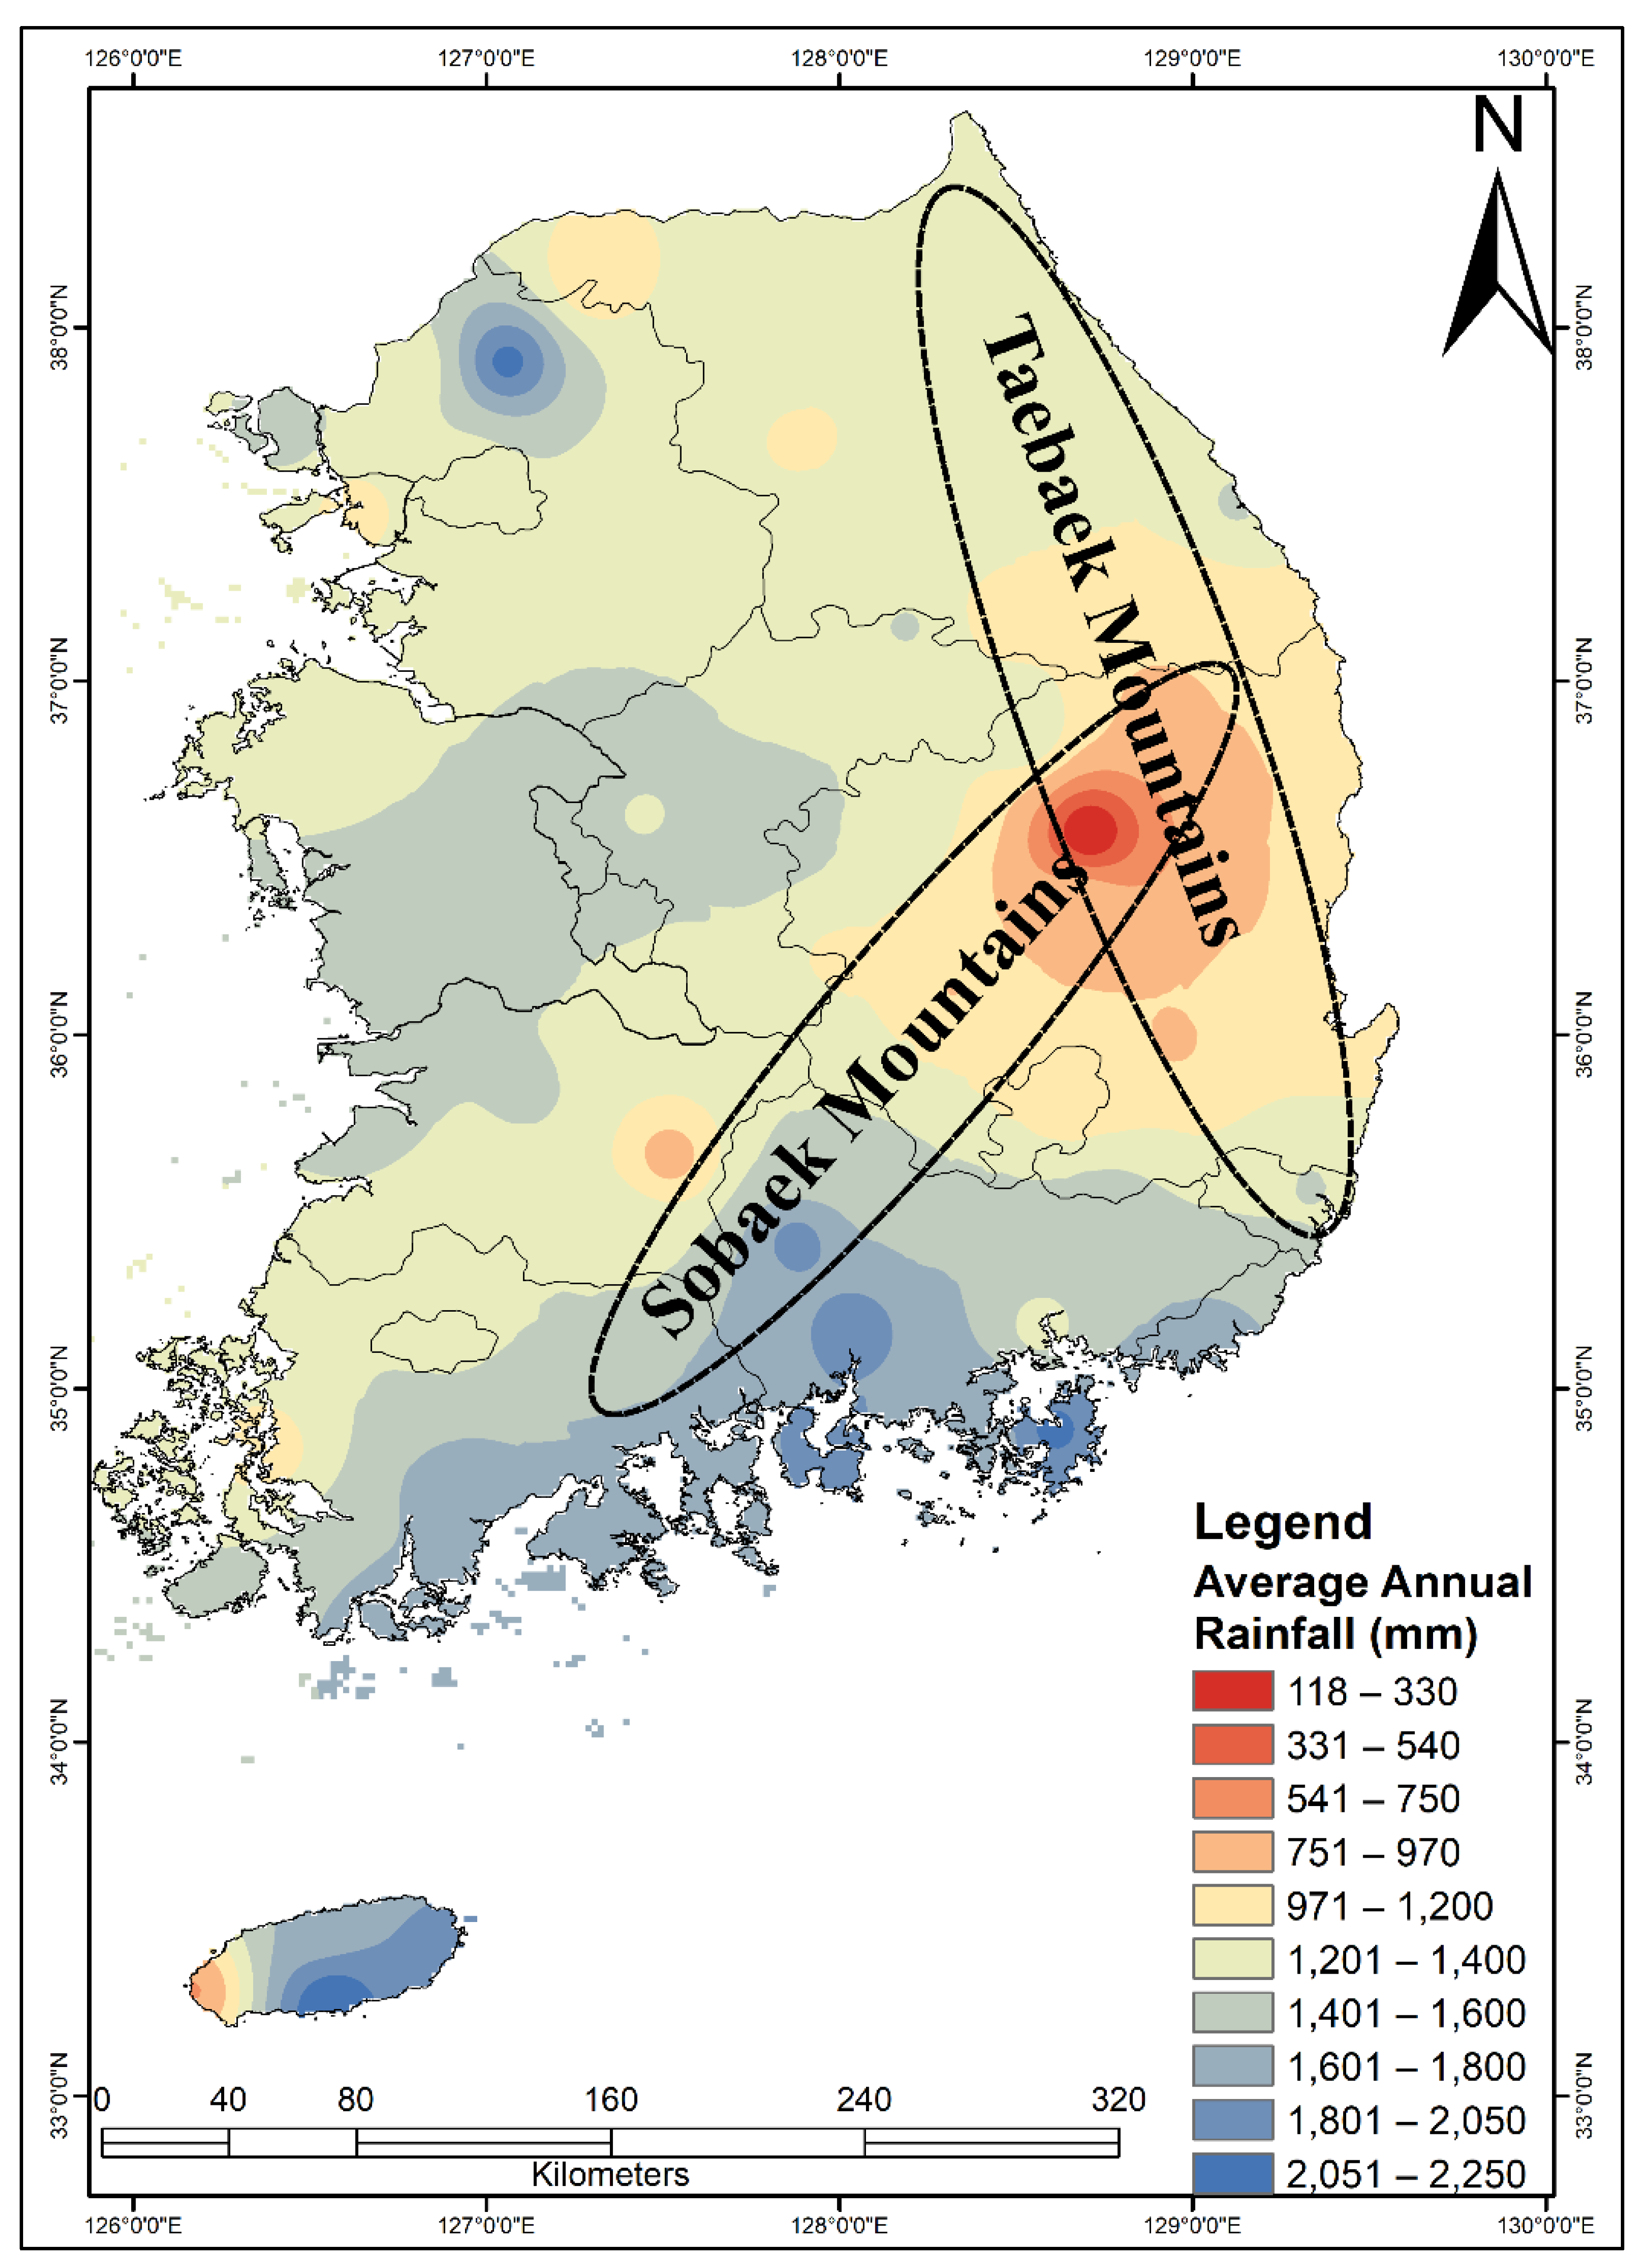
4.1. Spatiotemporal Rainfall Variability
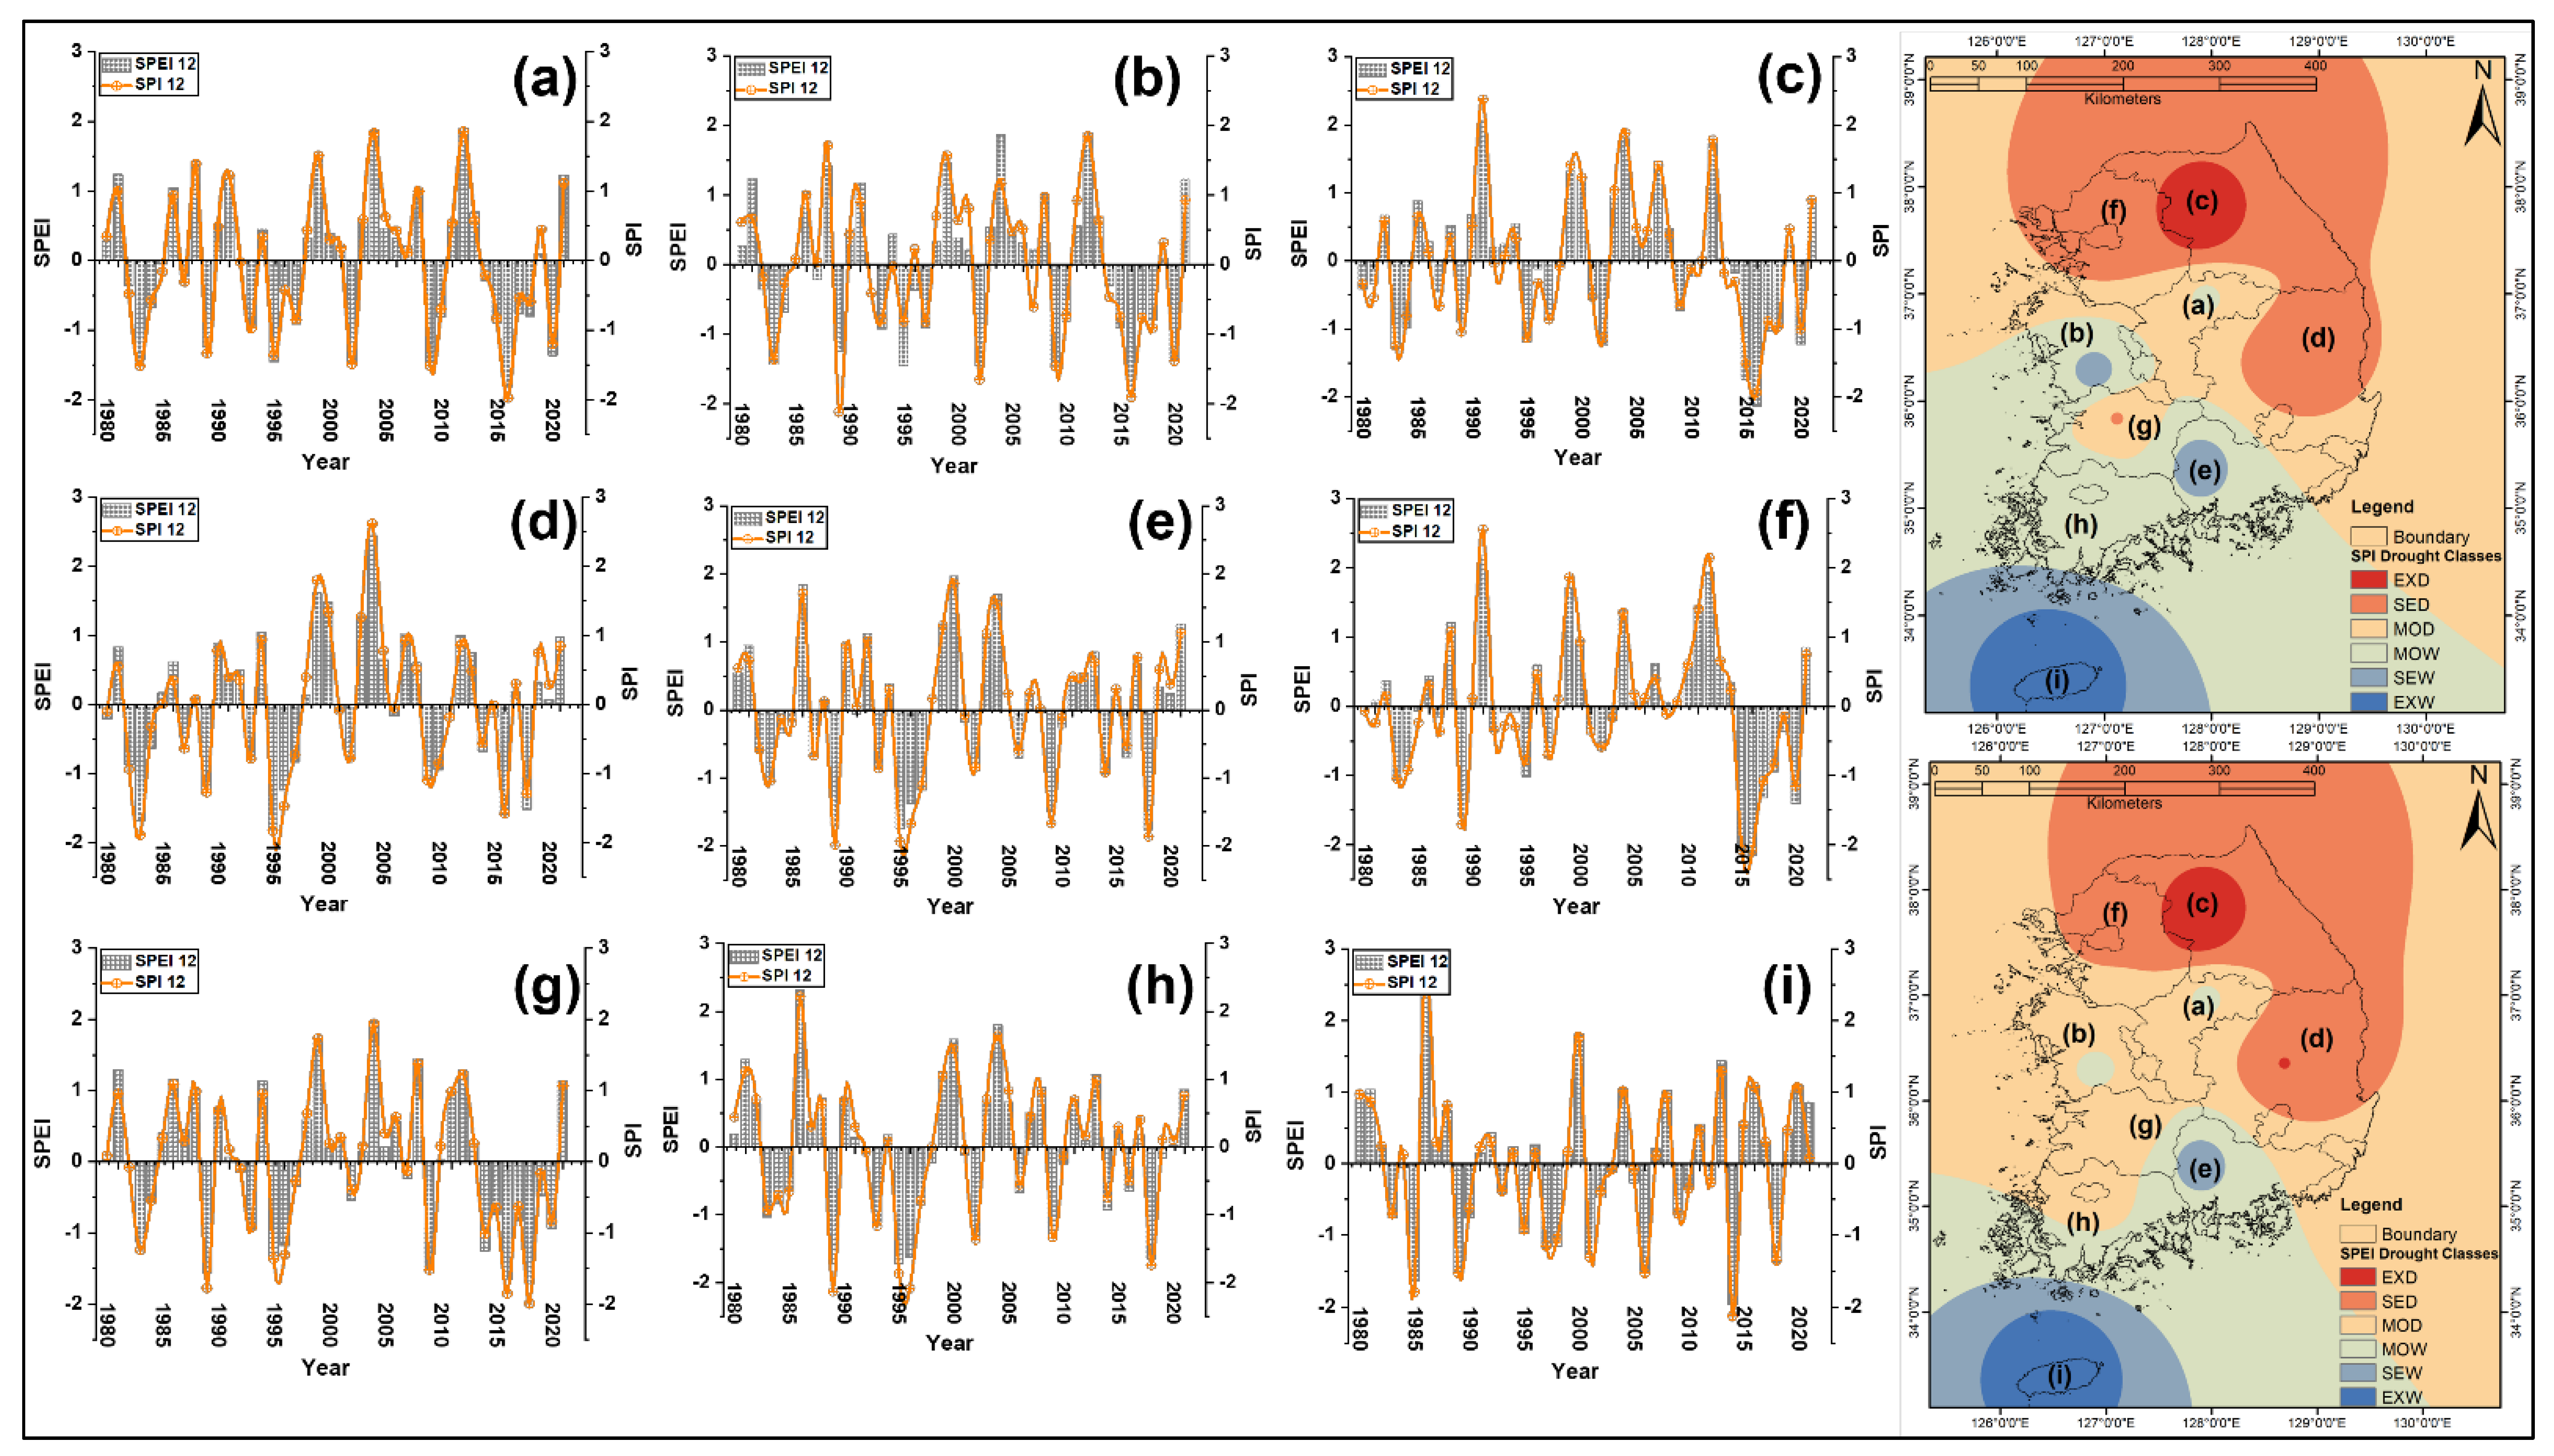
4.2. 12-Month SPI and SPEI
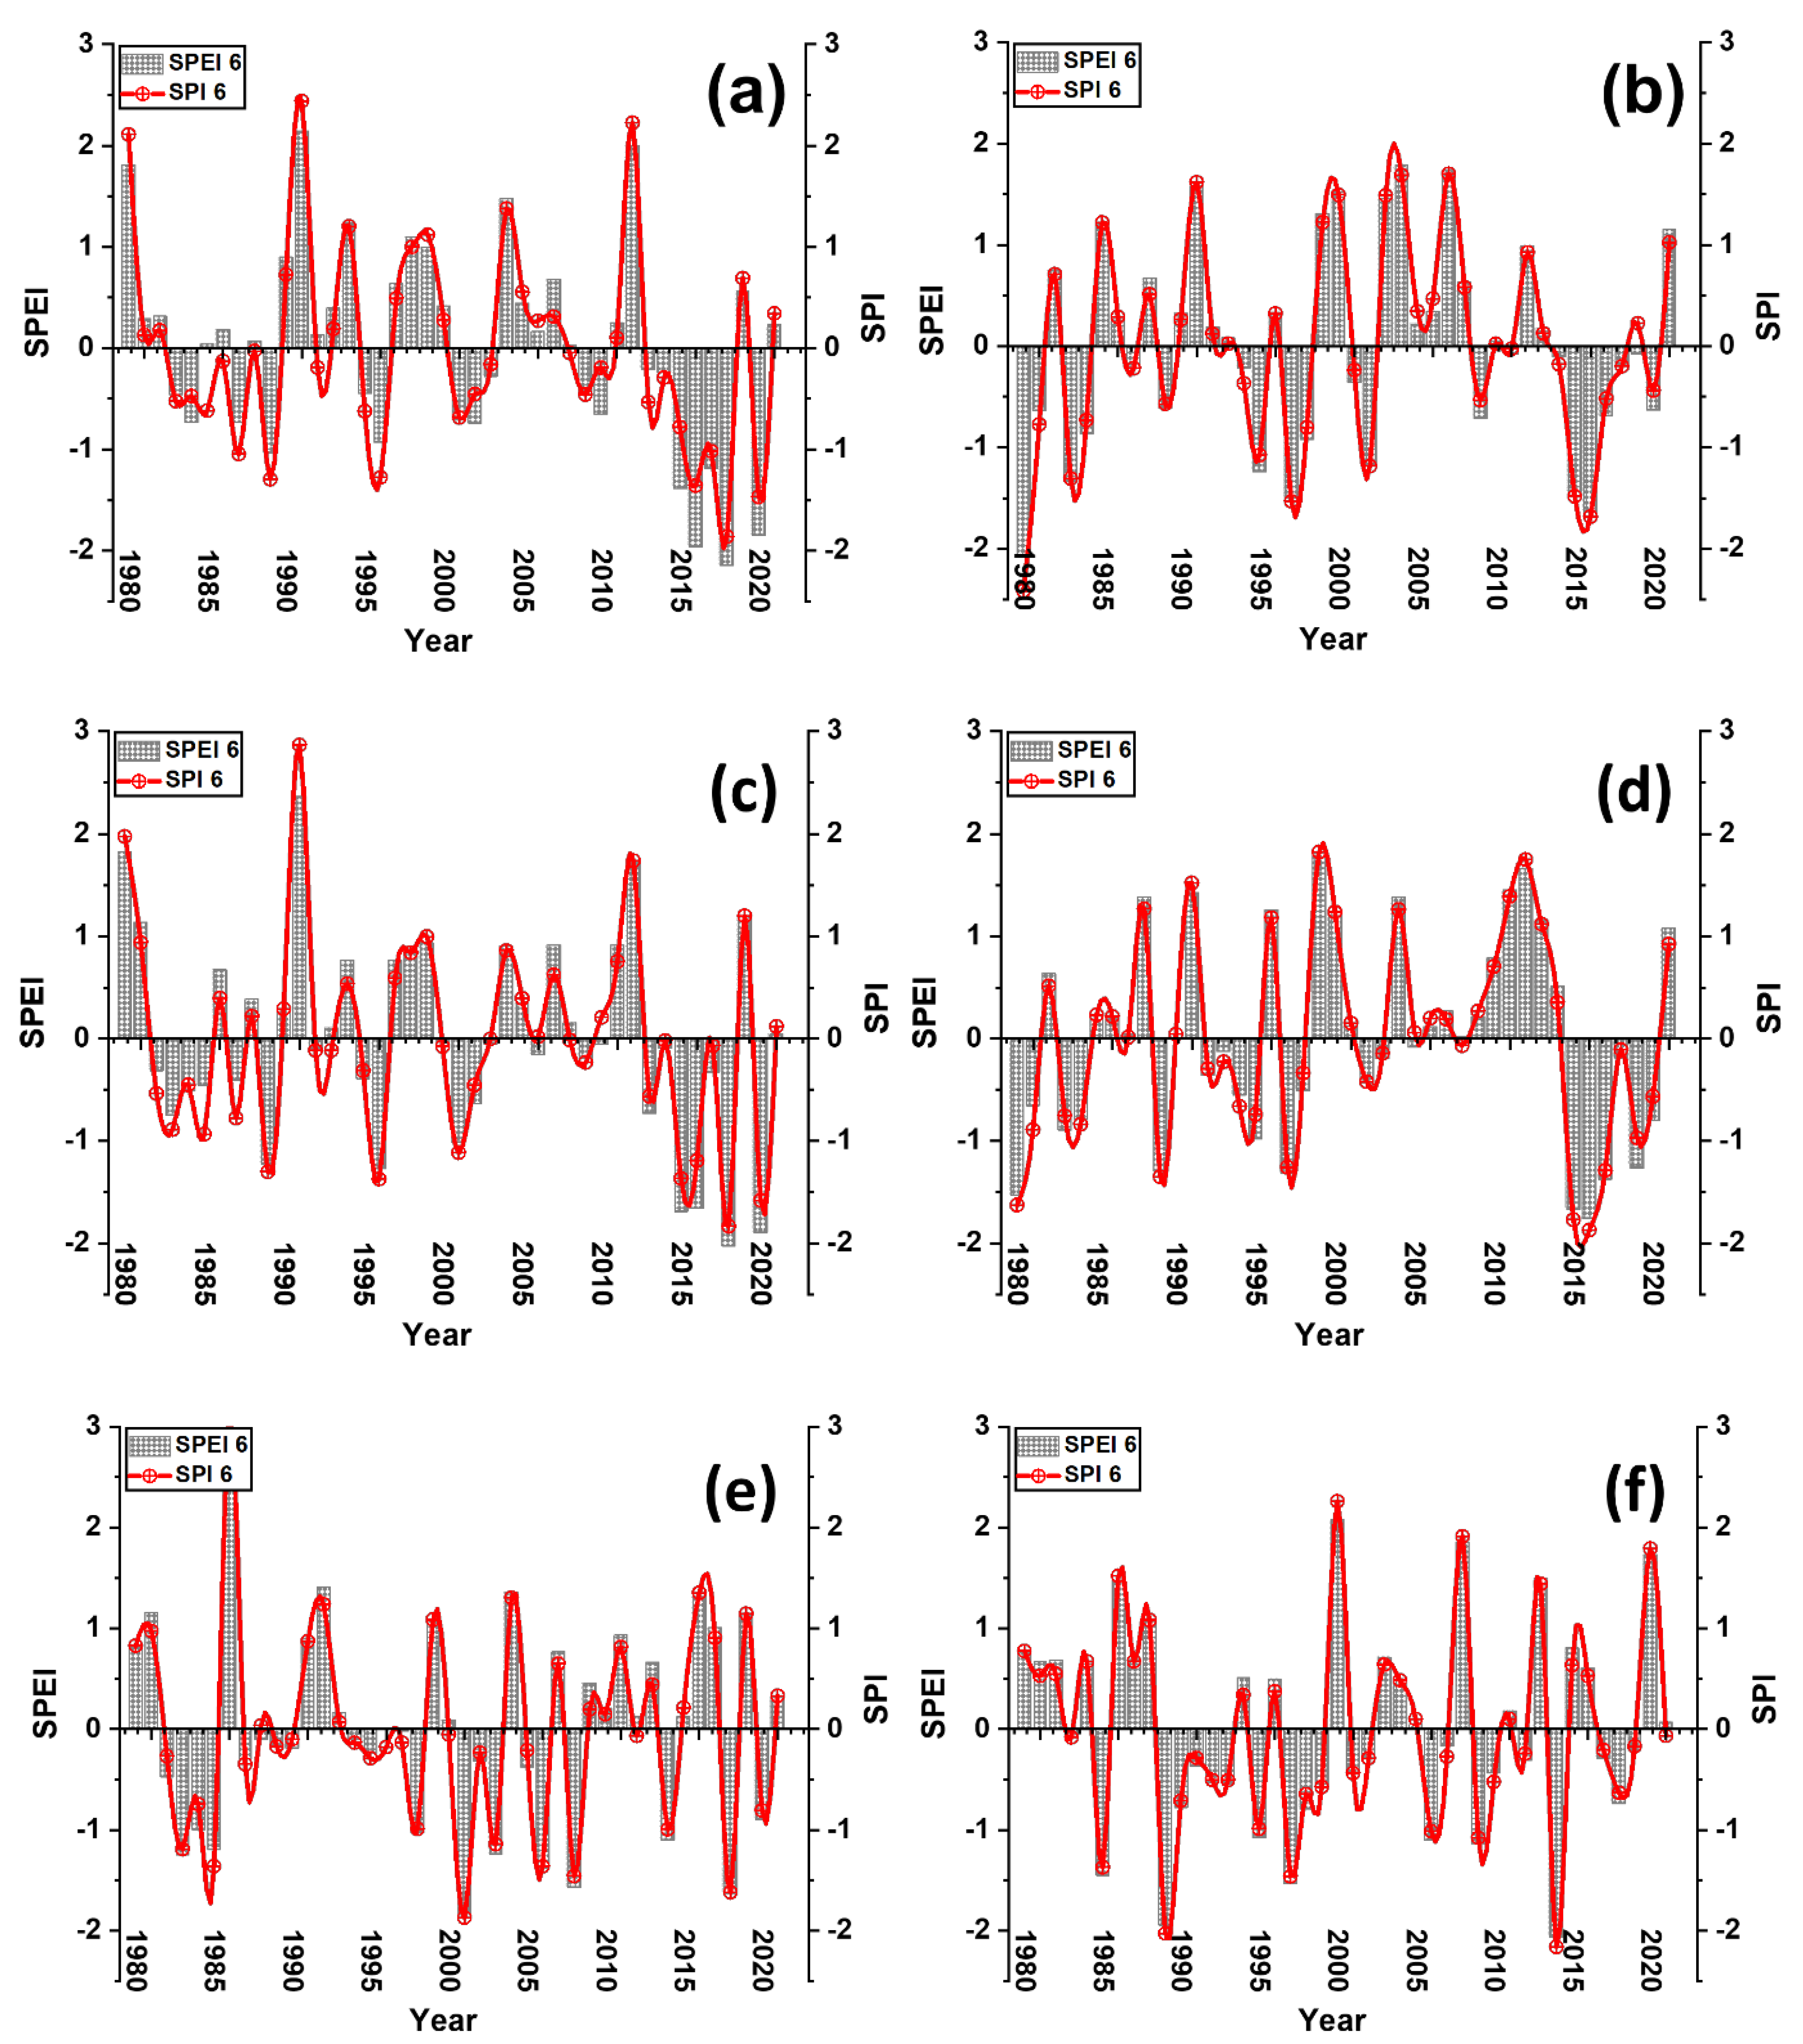
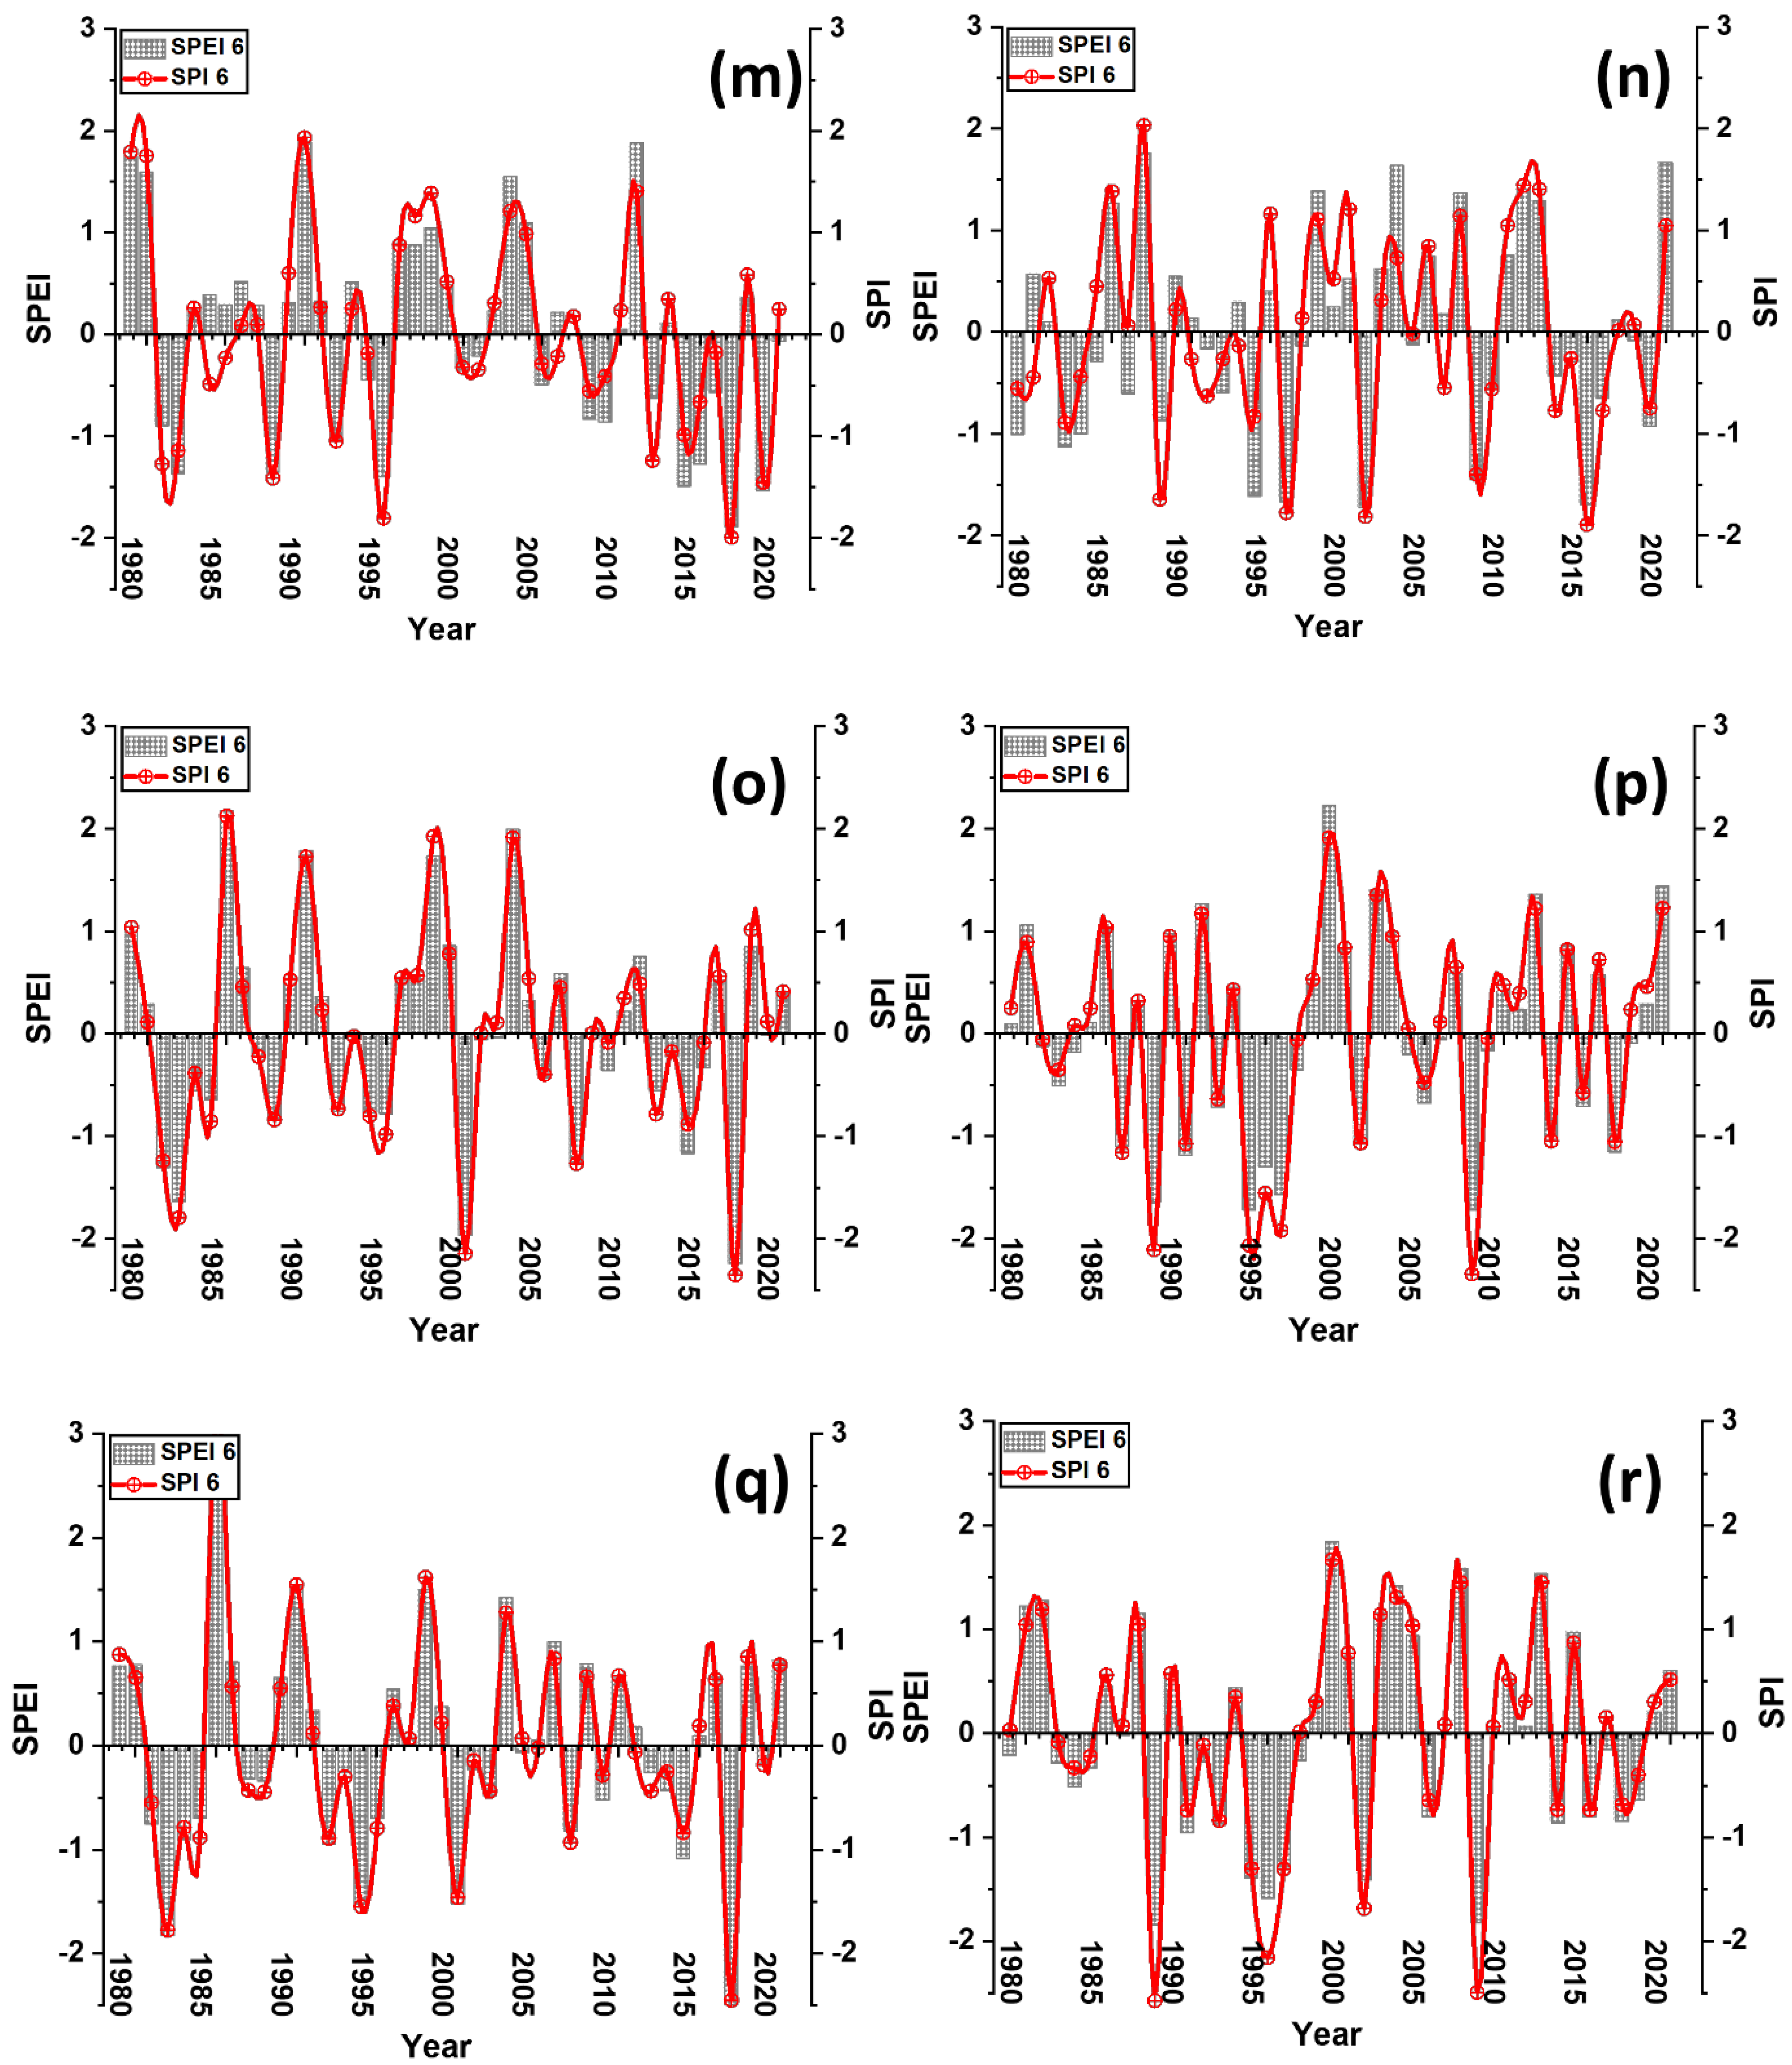
4.3. 6-Month SPI and SPEI
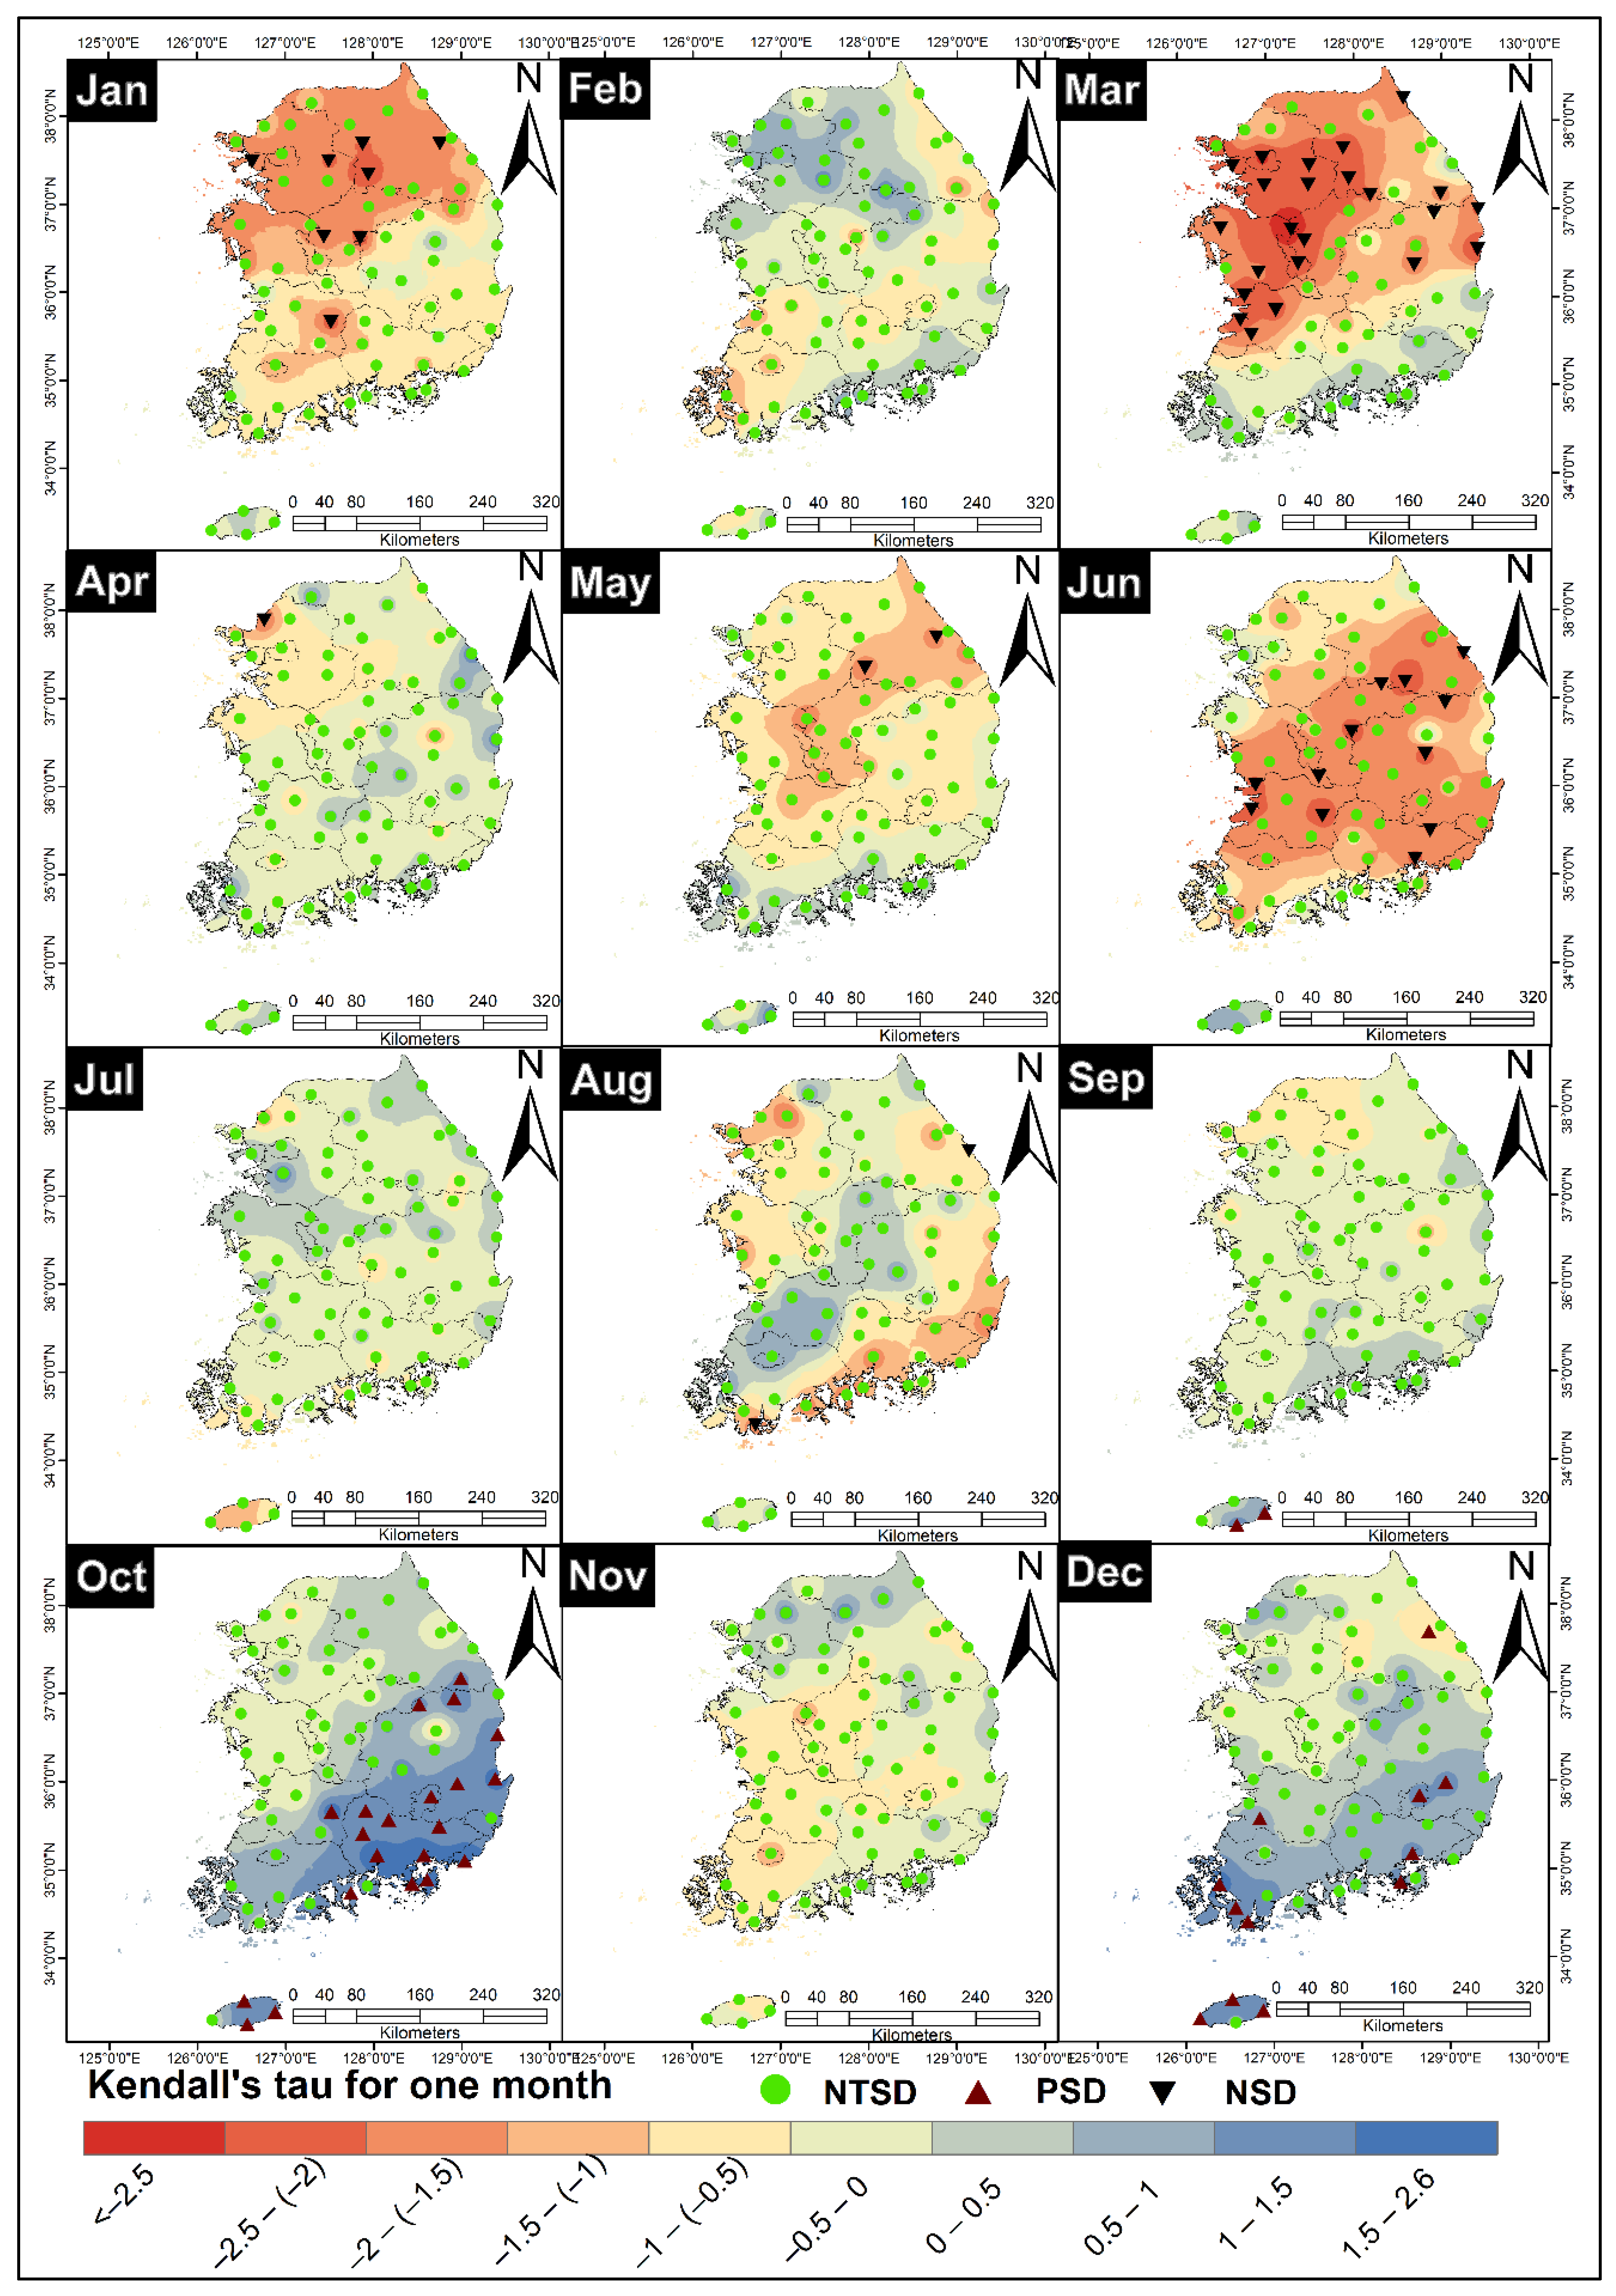
4.4. Mann-Kendall Trend Test
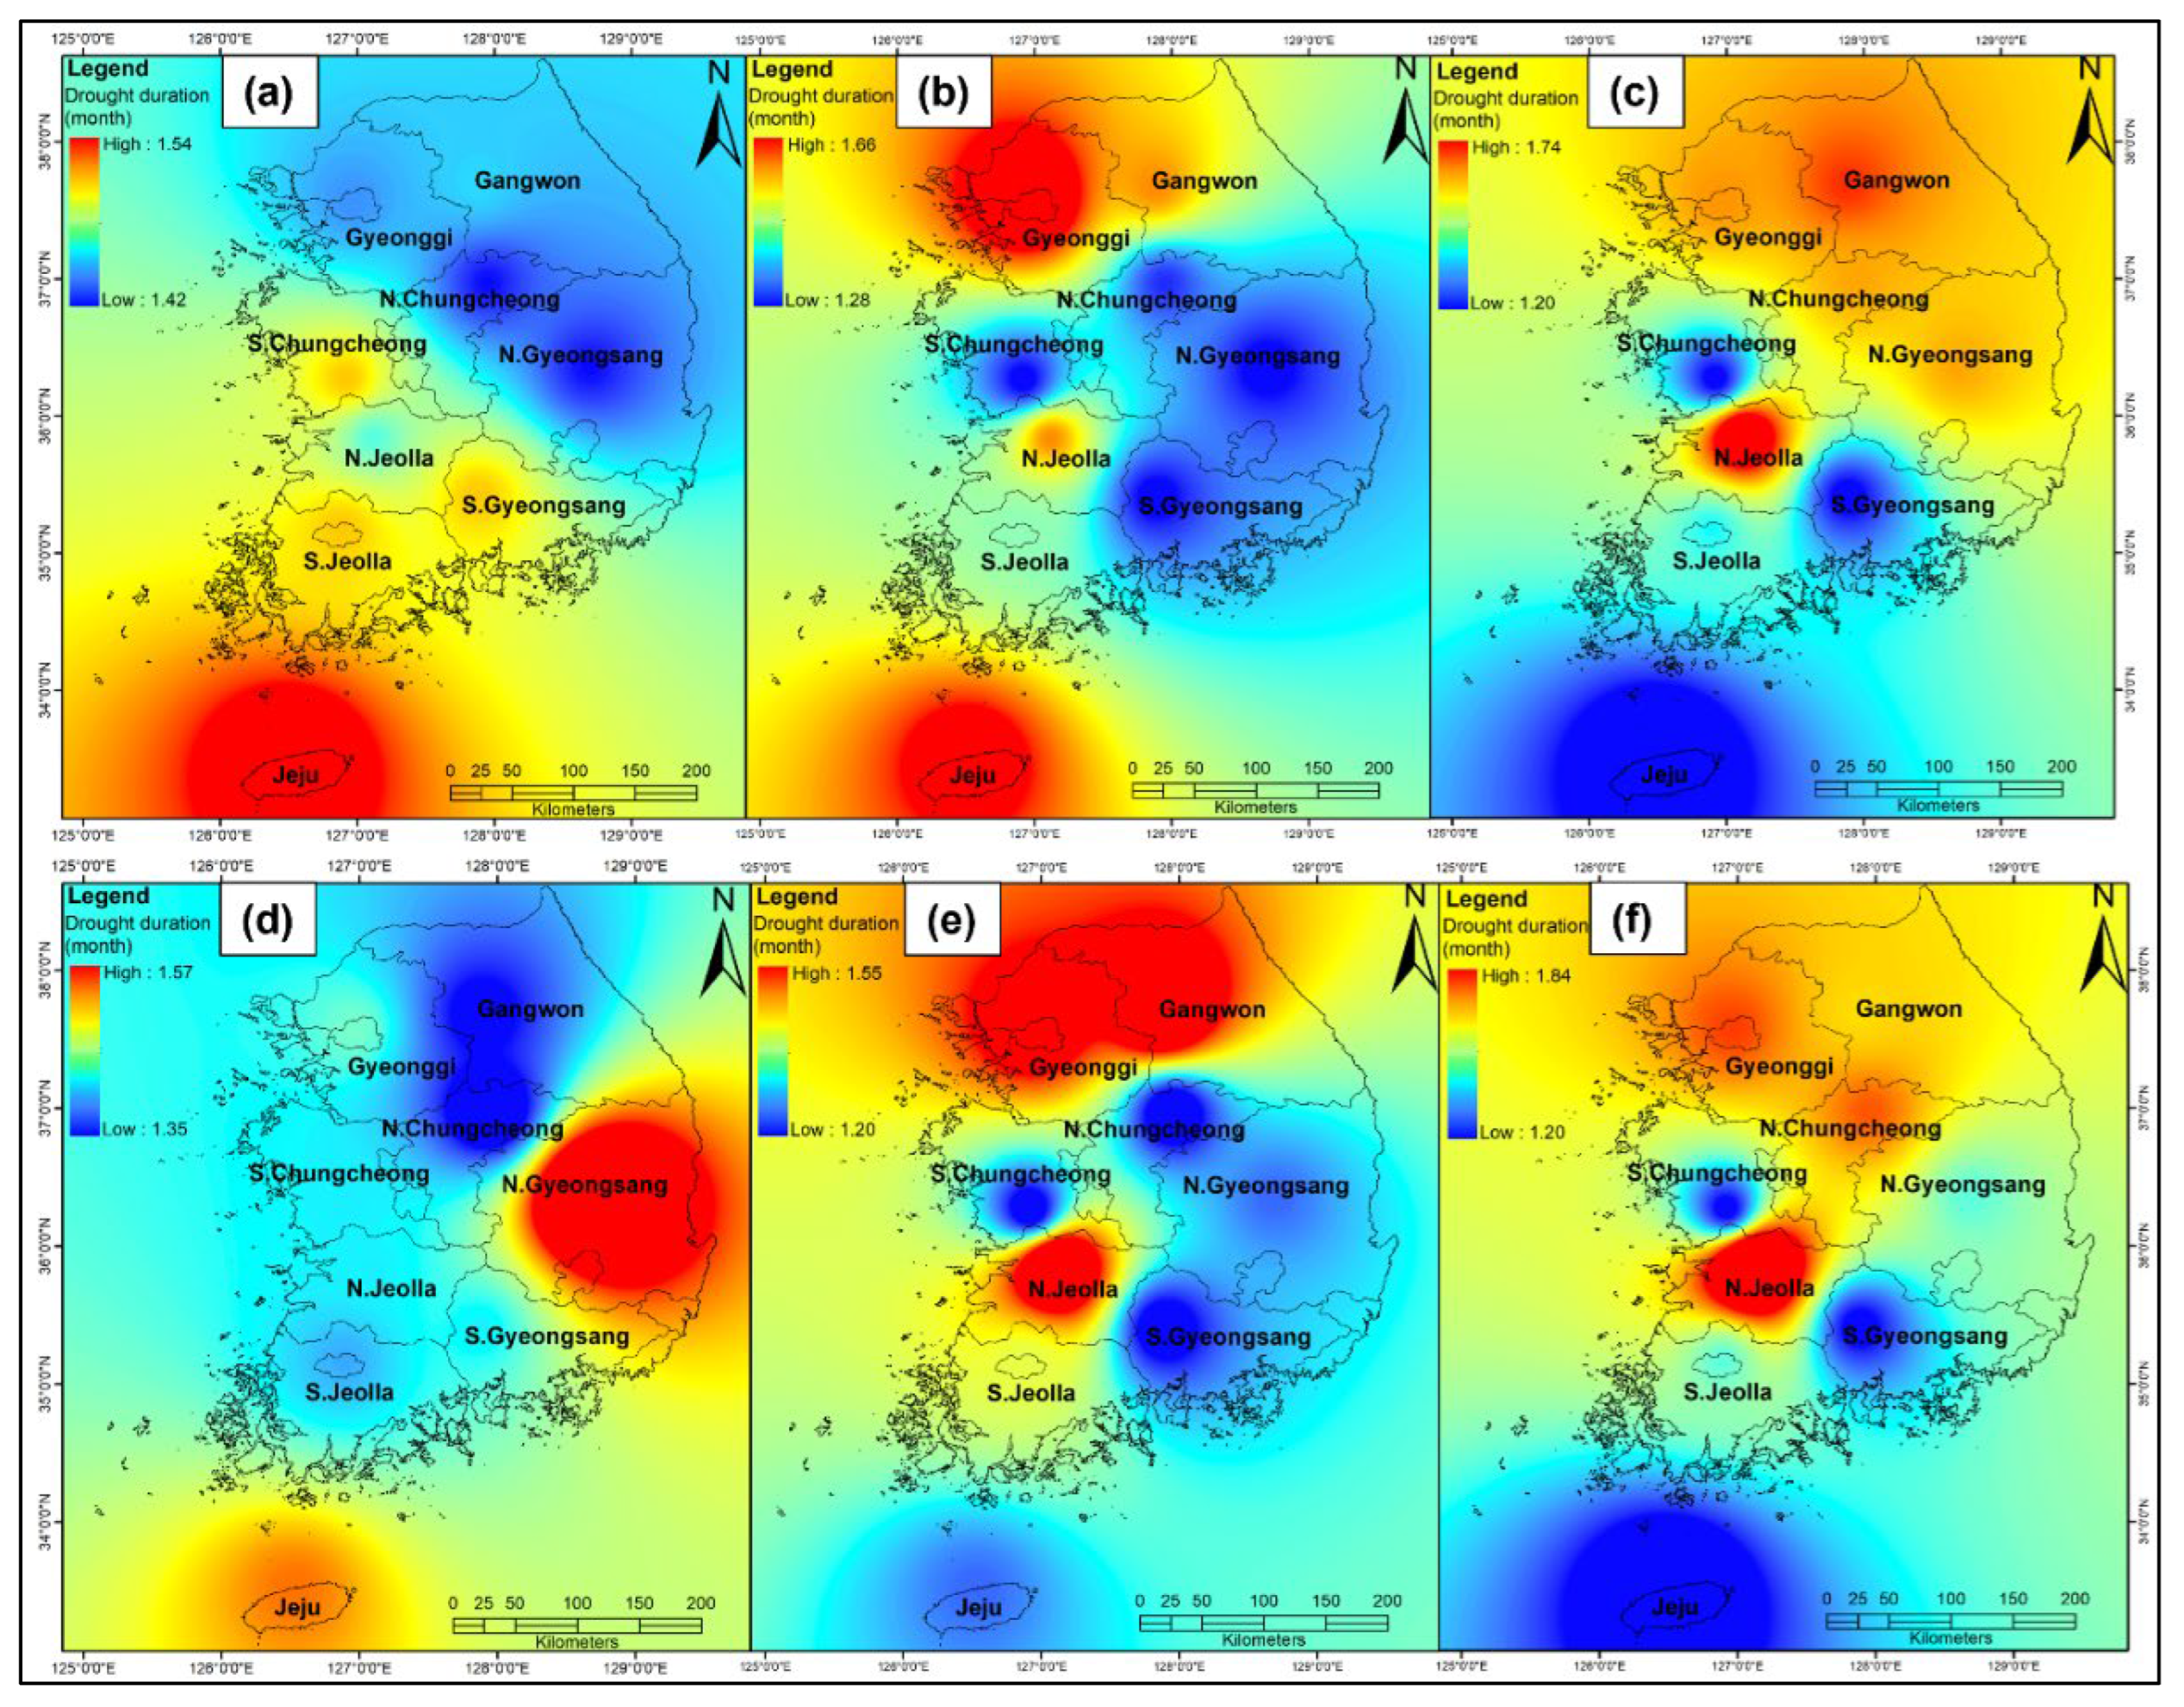
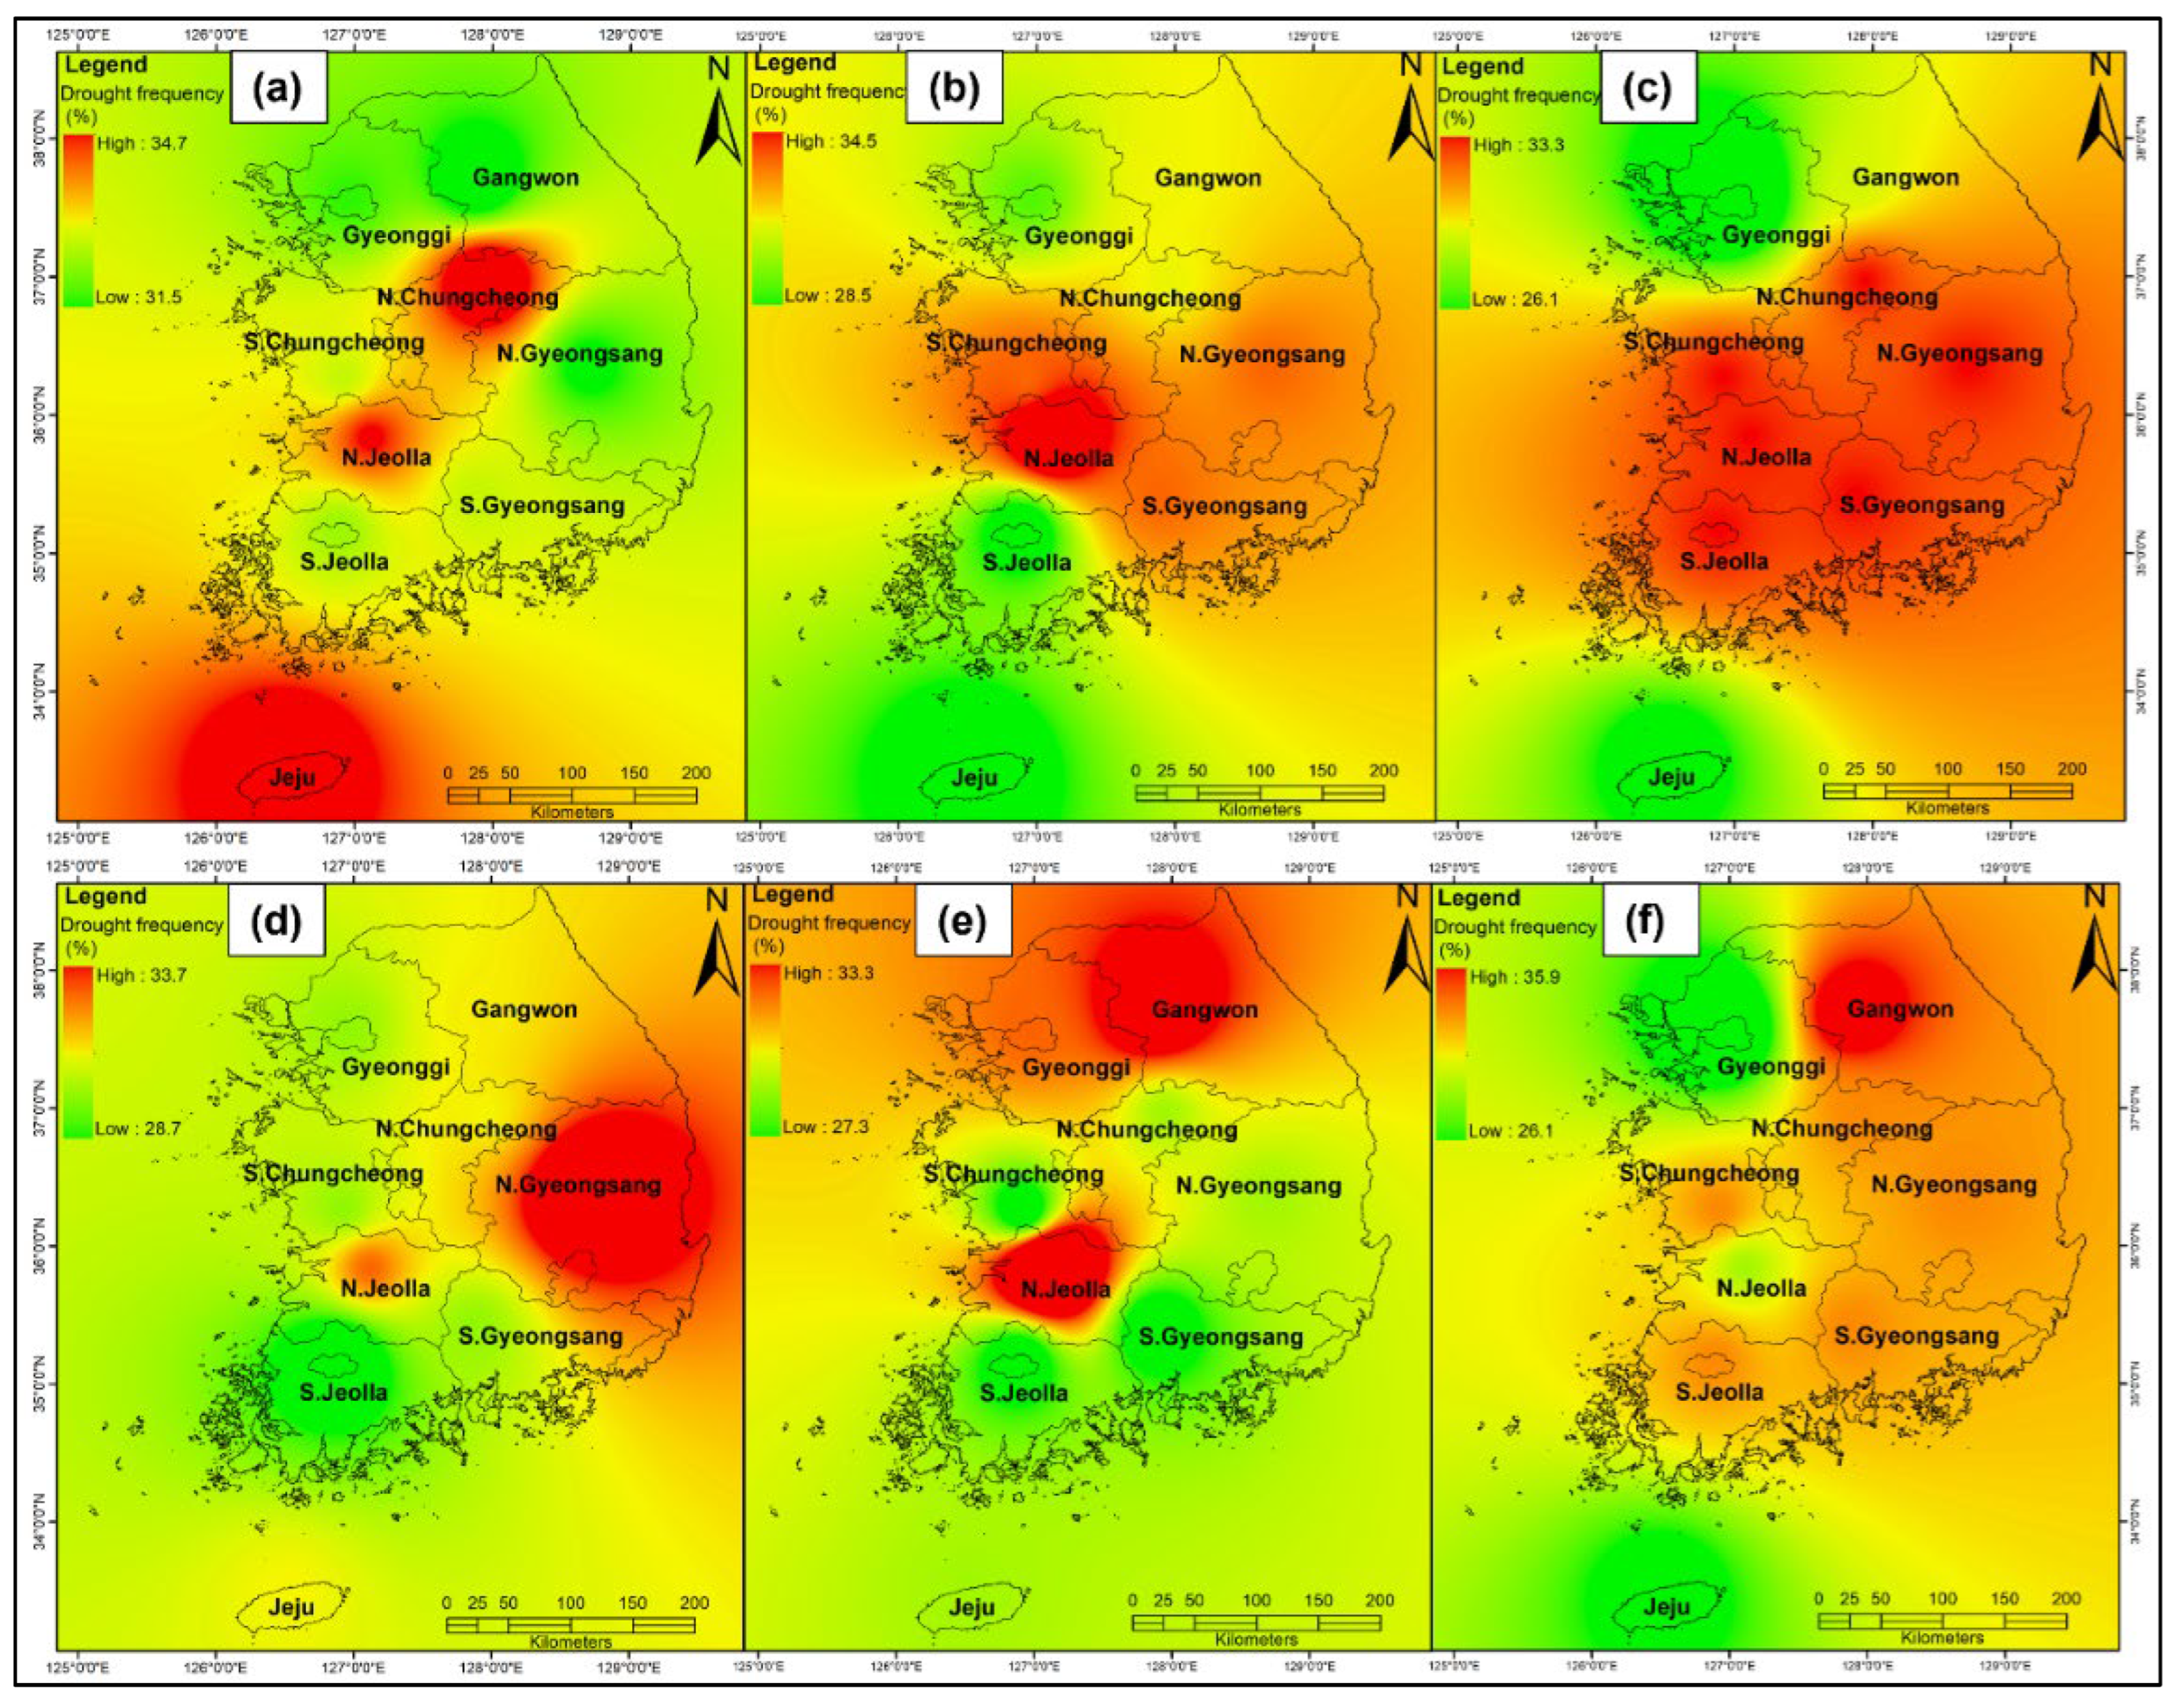
4.5. Spatial Distribution of Drought Characteristics
5. Discussion
6. Conclusions
Author Contributions
Funding
Institutional Review Board Statement
Informed Consent Statement
Data Availability Statement
Acknowledgments
Conflicts of Interest
References
- Bonaccorso, B.; Bordi, I.; Cancelliere, A.; Rossi, G.; Sutera, A. Spatial Variability of Drought: An Analysis of the SPI in Sicily. Water Resour. Manag. 2003, 17, 273–296. [Google Scholar] [CrossRef]
- Poonia, V.; Goyal, M.K.; Jha, S.; Dubey, S. Terrestrial ecosystem response to flash droughts over India. J. Hydrol. 2022, 605, 127402. [Google Scholar] [CrossRef]
- Rahman, G.; Rahman, A.-U.; Ullah, S.; Dawood, M.; Moazzam, M.F.U.; Lee, B.G. Spatio-temporal characteristics of meteorological drought in Khyber Pakhtunkhwa, Pakistan. PLoS ONE 2021, 16, e0249718. [Google Scholar] [CrossRef] [PubMed]
- Khan, A.A.; Zhao, Y.; Rahman, G.; Rafiq, M.; Moazzam, M.F.U. Spatial and Temporal Analysis of Rainfall and Drought Condition in Southwest Xinjiang in Northwest China, Using Various Climate Indices. Earth Syst. Environ. 2021, 5, 201–216. [Google Scholar] [CrossRef]
- Yang, Y.; Gan, T.Y.; Tan, X. Spatiotemporal changes of drought characteristics and their dynamic drivers in Canada. Atmos. Res. 2020, 232, 104695. [Google Scholar] [CrossRef]
- Rafiq, M.; Li, Y.C.; Cheng, Y.; Rahman, G.; Ullah, I.; Ali, A. Spatial and temporal fluctuation of rainfall and drought in Balochistan province, Pakistan. Arab. J. Geosci. 2022, 15, 214. [Google Scholar] [CrossRef]
- Dai, A. Increasing drought under global warming in observations and models. Nat. Clim. Chang. 2013, 3, 52–58. [Google Scholar] [CrossRef]
- Sönmez, F.K.; Koemuescue, A.U.; Erkan, A.; Turgu, E. An analysis of spatial and temporal dimension of drought vulnerability in Turkey using the standardized precipitation index. Nat. Hazards 2005, 35, 243–264. [Google Scholar] [CrossRef]
- Ashraf, M.; Routray, J.K. Spatio-temporal characteristics of precipitation and drought in Balochistan Province, Pakistan. Nat. Hazards 2015, 77, 229–254. [Google Scholar] [CrossRef]
- Khadr, M. Temporal and spatial analysis of meteorological drought characteristics in the upper Blue Nile river region. Hydrol. Res. 2016, 48, 265–276. [Google Scholar] [CrossRef]
- Rahman, G.; Dawood, M. Spatial and temporal variation of rainfall and drought in Khyber Pakhtunkhwa Province of Pakistan during 1971–2015. Arab. J. Geosci. 2018, 11, 46. [Google Scholar] [CrossRef]
- Zarch, M.A.A.; Malekinezhad, H.; Mobin, M.H.; Dastorani, M.T.; Kousari, M.R. Drought monitoring by reconnaissance drought index (RDI) in Iran. Water Resour. Manag. 2011, 25, 3485–3504. [Google Scholar] [CrossRef] [Green Version]
- Hosseini, T.S.M.; Hosseini, S.A.; Ghermezcheshmeh, B.; Sharafati, A. Drought hazard depending on elevation and precipitation in Lorestan, Iran. Theor. Appl. Climatol. 2020, 142, 1369–1377. [Google Scholar] [CrossRef]
- Ullah, I.; Ma, X.; Yin, J.; Asfaw, T.G.; Azam, K.; Syed, S.; Liu, M.; Arshad, M.; Shahzaman, M. Evaluating the meteorological drought characteristics over Pakistan using in situ observations and reanalysis products. Int. J. Climatol. 2021, 41, 4437–4459. [Google Scholar] [CrossRef]
- Ullah, I.; Ma, X.; Yin, J.; Saleem, F.; Syed, S.; Omer, A.; Habtemicheal, B.A. Influence of large-scale circulation and interannual modes of climate variability on seasonal drought characteristics over Pakistan. Res. Sq. 2021, in press. [Google Scholar] [CrossRef]
- Mishra, A.; Singh, V.; Desai, V. Drought characterization: A probabilistic approach. Stoch. Environ. Res. Risk Assess. 2009, 23, 41–55. [Google Scholar] [CrossRef]
- Ahmed, K.; Shahid, S.; Nawaz, N. Impacts of climate variability and change on seasonal drought characteristics of Pakistan. Atmos. Res. 2018, 214, 364–374. [Google Scholar] [CrossRef]
- Uwimbabazi, J.; Jing, Y.; Iyakaremye, V.; Ullah, I.; Ayugi, B. Observed Changes in Meteorological Drought Events during 1981–2020 over Rwanda, East Africa. Sustainability 2022, 14, 1519. [Google Scholar] [CrossRef]
- Chung, Y.-S.; Yoon, M.-B.; Kim, H.-S. On Climate Variations and Changes Observed in South Korea. Clim. Chang. 2004, 66, 151–161. [Google Scholar] [CrossRef]
- Hertel, T.W.; de Lima, C.Z. Climate impacts on agriculture: Searching for keys under the streetlight. Food Policy 2020, 95, 101954. [Google Scholar] [CrossRef]
- Kim, J.-S.; Jain, S. Precipitation trends over the Korean peninsula: Typhoon-induced changes and a typology for characterizing climate-related risk. Environ. Res. Lett. 2011, 6, 034033. [Google Scholar] [CrossRef]
- Azam, M.; Kim, H.S.; Maeng, S.J. Development of flood alert application in Mushim stream watershed Korea. Int. J. Disaster Risk Reduct. 2017, 21, 11–26. [Google Scholar] [CrossRef] [Green Version]
- Hong, I.; Lee, J.-H.; Cho, H.-S. National drought management framework for drought preparedness in Korea (lessons from the 2014–2015 drought). Water Policy 2016, 18, 89–106. [Google Scholar] [CrossRef]
- Wu, Z.; Xu, H.; Li, Y.; Wen, L.; Li, J.; Lu, G.; Li, X. Climate and drought risk regionalisation in China based on probabilistic aridity and drought index. Sci. Total Environ. 2018, 612, 513–521. [Google Scholar] [CrossRef]
- Uddin, M.J.; Hu, J.; Islam, A.R.M.T.; Eibek, K.U.; Nasrin, Z.M. A comprehensive statistical assessment of drought indices to monitor drought status in Bangladesh. Arab. J. Geosci. 2020, 13, 323. [Google Scholar] [CrossRef]
- Azam, M.; Maeng, S.J.; Kim, H.S.; Lee, S.W.; Lee, J.E. Spatial and temporal trend analysis of precipitation and drought in South Korea. Water 2018, 10, 765. [Google Scholar] [CrossRef] [Green Version]
- Jang, D. Assessment of meteorological drought indices in Korea using RCP 8.5 scenario. Water 2018, 10, 283. [Google Scholar] [CrossRef] [Green Version]
- Kwon, M.; Kwon, H.-H.; Han, D. Spatio-temporal drought patterns of multiple drought indices based on precipitation and soil moisture: A case study in South Korea. Int. J. Climatol. 2019, 39, 4669–4687. [Google Scholar] [CrossRef]
- Sung, J.H.; Park, J.; Jeon, J.-J.; Seo, S.B. Assessment of inter-model variability in meteorological drought characteristics using CMIP5 GCMs over South Korea. KSCE J. Civ. Eng. 2020, 24, 2824–2834. [Google Scholar] [CrossRef]
- Gopalakrishnan, C. Water and disasters: A review and analysis of policy aspects. Int. J. Water Resour. Dev. 2013, 29, 250–271. [Google Scholar] [CrossRef]
- Ghozat, A.; Sharafati, A.; Hosseini, S.A. Satellite-based monitoring of meteorological drought over different regions of Iran: Application of the CHIRPS precipitation product. Environ. Sci. Pollut. Res. 2022, 1–18. [Google Scholar] [CrossRef]
- Kousari, M.R.; Dastorani, M.T.; Niazi, Y.; Soheili, E.; Hayatzadeh, M.; Chezgi, J. Trend Detection of Drought in Arid and Semi-Arid Regions of Iran Based on Implementation of Reconnaissance Drought Index (RDI) and Application of Non-Parametrical Statistical Method. Water Resour. Manag. 2014, 28, 1857–1872. [Google Scholar] [CrossRef]
- Yaseen, Z.M.; Ali, M.; Sharafati, A.; Al-Ansari, N.; Shahid, S. Forecasting standardized precipitation index using data intelligence models: Regional investigation of Bangladesh. Sci. Rep. 2021, 11, 3435. [Google Scholar] [CrossRef]
- IPCC. Climate Change 2007: The Physical Science Basis; Solomon, S., Ed.; Contribution of Working Group I to the Fourth Assessment Report of the Intergovernmental Panel on Climate Change; Cambridge University Press: Cambridge, UK, 2007. [Google Scholar]
- Rahman, G.; Rahman, A.U.; Anwar, M.M.; Dawood, M.; Miandad, M. Spatio-temporal analysis of climatic variability, trend detection, and drought assessment in Khyber Pakhtunkhwa, Pakistan. Arab. J. Geosci. 2021, 15, 81. [Google Scholar] [CrossRef]
- Malik, A.; Rai, P.; Heddam, S.; Kisi, O.; Sharafati, A.; Salih, S.Q.; Al-Ansari, N.; Yaseen, Z.M. Pan Evaporation Estimation in Uttarakhand and Uttar Pradesh States, India: Validity of an Integrative Data Intelligence Model. Atmosphere 2020, 11, 553. [Google Scholar] [CrossRef]
- McKee, T.B.; Doesken, N.J.; Kleist, J. The relationship of drought frequency and duration to time scales. In Proceedings of the 8th Conference on Applied Climatology, Anaheim, CA, USA, 17–22 January 1993. [Google Scholar]
- Vicente-Serrano, S.M.; Beguería, S.; López-Moreno, J.I. A multiscalar drought index sensitive to global warming: The standardized precipitation evapotranspiration index. J. Clim. 2010, 23, 1696–1718. [Google Scholar] [CrossRef] [Green Version]
- Palmer, W.C. Meteorological Drought; U.S. Department of Commerce, Weather Bureau: Washington, DC, USA, 1965; Volume 30. [Google Scholar]
- Tsakiris, G. Meteorological Drought Assessment; Paper Prepared for the Needs of the European Research Program MEDROPLAN; European Union: Zaragoza, Spain, 2004. [Google Scholar]
- Palmer, W.C. Keeping Track of Crop Moisture Conditions, Nationwide: The New Crop Moisture Index. Weatherwise 1968, 21, 156–161. [Google Scholar] [CrossRef]
- Song, Y.H.; Chung, E.S.; Shahid, S. Spatiotemporal differences and uncertainties in projections of precipitation and temperature in South Korea from CMIP6 and CMIP5 general circulation models. Int. J. Climatol. 2021, 41, 5899–5919. [Google Scholar] [CrossRef]
- Jung, H.C.; Kang, D.-H.; Kim, E.; Getirana, A.; Yoon, Y.; Kumar, S. Towards a soil moisture drought monitoring system for South Korea. J. Hydrol. 2020, 589, 125176. [Google Scholar] [CrossRef]
- Jung, I.-W.; Bae, D.-H.; Kim, G. Recent trends of mean and extreme precipitation in Korea. Int. J. Climatol. 2011, 31, 359–370. [Google Scholar] [CrossRef]
- Park, S.; Im, J.; Park, S.; Rhee, J. Drought monitoring using high resolution soil moisture through multi-sensor satellite data fusion over the Korean peninsula. Agric. For. Meteorol. 2017, 237, 257–269. [Google Scholar] [CrossRef]
- Azam, M.; Park, H.K.; Maeng, S.J.; Kim, H.S. Regionalization of Drought across South Korea Using Multivariate Methods. Water 2018, 10, 24. [Google Scholar] [CrossRef] [Green Version]
- Sung, J.H.; Chung, E.-S.; Kim, Y.; Lee, B.-R. Meteorological hazard assessment based on trends and abrupt changes in rainfall characteristics on the Korean peninsula. Theor. Appl. Climatol. 2017, 127, 305–326. [Google Scholar] [CrossRef]
- Tan, C.; Yang, J.; Li, M. Temporal-Spatial Variation of Drought Indicated by SPI and SPEI in Ningxia Hui Autonomous Region, China. Atmosphere 2015, 6, 1399–1421. [Google Scholar] [CrossRef] [Green Version]
- Ullah, I.; Ma, X.; Yin, J.; Saleem, F.; Syed, S.; Omer AHabtemicheal, B.A.; Liu, M.; Arshad, M. Observed changes in seasonal drought characteristics and their possible potential drivers over Pakistan. Int. J. Climatol. 2021, in press. [Google Scholar] [CrossRef]
- Maeng, S.J.; Azam, M.; Kim, H.S.; Hwang, J.H. Analysis of changes in spatio-temporal patterns of drought across South Korea. Water 2017, 9, 679. [Google Scholar] [CrossRef] [Green Version]
- Li, W.; Duan, L.; Wang, W.; Wu, Y.; Liu, T.; Quan, Q.; Chen, X.; Yin, H.; Zhou, Q. Spatiotemporal characteristics of drought in a semi-arid grassland over the past 56 years based on the Standardized Precipitation Index. Meteorol. Atmos. Phys. 2021, 133, 41–54. [Google Scholar] [CrossRef]
- Kim, C.J.; Park, M.J.; Lee, J.H. Analysis of climate change impacts on the spatial and frequency patterns of drought using a potential drought hazard mapping approach. Int. J. Climatol. 2014, 34, 61–80. [Google Scholar] [CrossRef]
- Lee, J.H.; Kim, C.J. A multimodel assessment of the climate change effect on the drought severity-duration-frequency relationship. Hydrol. Process. 2013, 27, 2800–2813. [Google Scholar] [CrossRef]
- Hargreaves, G.H.; Samani, Z.A. Estimating potential evapotranspiration. J. Irrig. Drain. Div. 1982, 108, 225–230. [Google Scholar] [CrossRef]
- Li, Y.; Wang, Z.; Zhang, Y.; Li, X.; Huang, W. Drought variability at various timescales over Yunnan Province, China: 1961–2015. Theor. Appl. Climatol. 2019, 138, 743–757. [Google Scholar] [CrossRef]
- Liu, Z.; Wang, Y.; Shao, M.; Jia, X.; Li, X. Spatiotemporal analysis of multiscalar drought characteristics across the Loess Plateau of China. J. Hydrol. 2016, 534, 281–299. [Google Scholar] [CrossRef]
- Khan, F.K. Pakistan Geography Economy and People, 4th ed.; Oxford University Press: Karachi, Pakistan, 2015. [Google Scholar]
- Elvidge, A.D.; Renfrew, I.A. The causes of foehn warming in the lee of mountains. Bull. Am. Meteorol. Soc. 2016, 97, 455–466. [Google Scholar] [CrossRef] [Green Version]
- Means, T. The Windward Versus Leeward Side of a Mountain. 2020. Available online: https://www.thoughtco.com/leeward-and-windward-sides-of-mountain-3444015 (accessed on 15 January 2022).
- National Geographic Information Institute. The National Atlas of Korea; NGII: Suwon, Korea, 2020. [Google Scholar]
- Kim, D.W.; Byun, H.R.; Choi, K.S.; Oh, S.B. A Spatiotemporal Analysis of Historical Droughts in Korea. J. Appl. Meteorol. Climatol. 2011, 50, 1895–1912. [Google Scholar] [CrossRef]
- Won, J.; Kim, S. Future drought analysis using SPI and EDDI to consider climate change in South Korea. Water Supply 2020, 20, 3266–3280. [Google Scholar] [CrossRef]
- Kim, B.S.; Sung, J.H.; Kang, H.S.; Cho, C.H. Assessment of Drought Severity over South Korea using Standardized Precipitation Evapo-transpiration Index (SPEI). J. Korea Water Resour. Assoc. 2012, 45, 887–900. [Google Scholar] [CrossRef] [Green Version]
- Lee, S.; Lee, S.J.; Jang, K.; Chun, J.-H. Drought Monitoring Based on Vegetation Type and Reanalysis Data in Korea. Atmosphere 2021, 12, 170. [Google Scholar] [CrossRef]
- Bae, H.; Ji, H.; Lim, Y.J.; Ryu, Y.; Kim, M.H.; Kim, B.J. Characteristics of drought propagation in South Korea: Relationship between meteorological, agricultural, and hydrological droughts. Nat. Hazards 2019, 99, 1–16. [Google Scholar] [CrossRef] [Green Version]
- Zhang, L.; Zhou, T. Drought over East Asia: A review. J. Clim. 2015, 28, 3375–3399. [Google Scholar] [CrossRef]
- Choi, K.S.; Kang, S.D.; Kim, H.D. Spatiotemporal variability of April rainfall in Korea by western Pacific teleconnection pattern. Int. J. Climatol. 2013, 33, 1168–1177. [Google Scholar] [CrossRef]
- Kim, S.; Park, C.; Kim, M. The regime shift of the northern hemispheric circulation responsible for the spring drought in Korea. Asia-Pac. J. Atmos. Sci. 2005, 41, 571–585. [Google Scholar]
- Byun, H. On the atmospheric circulation caused the drought in Korea. J. Korean Meteor. Soc. 1996, 32, 454–469. [Google Scholar]
- Choi, K.S.; Oh, S.B.; Byun, H.R.; Kripalani, R.; Kim, D.-W. Possible linkage between East Asian summer drought and North Pacific oscillation. Theor. Appl. Climatol. 2011, 103, 81–93. [Google Scholar] [CrossRef]
- Park, C.K.; Schubert, S.D. On the Nature of the 1994 East Asian Summer Drought. J. Clim. 1997, 10, 1056–1070. [Google Scholar] [CrossRef]
- Bae, S.; Lee, S.H.; Yoo, S.H.; Kim, T. Analysis of Drought Intensity and Trends Using the Modified SPEI in South Korea from 1981 to 2010. Water 2018, 10, 327. [Google Scholar] [CrossRef] [Green Version]
- Golden Gate Weather Services. El Niño and La Niña Years and Intensities. 2021. Available online: https://ggweather.com/enso/oni.htm (accessed on 17 May 2021).


| Data Type | Source |
|---|---|
| Precipitation, temperature | Korean Meteorological administration (KMA) |
| Digital elevation model (DEM) | Shuttle Radar Topographic Mission (SRTM) |
| Administrative boundary | Nature Earth |
| ID | Name | Lat | Long | Alt (m) | ID | Name | Lat | Long | Alt (m) |
|---|---|---|---|---|---|---|---|---|---|
| 90 | Sokcho | 38.25 | 128.56 | 17.53 | 189 | Seogwipo | 33.24 | 126.56 | 51.86 |
| 95 | Cheorwon | 38.14 | 127.3 | 155.48 | 192 | Pearl | 35.16 | 128.04 | 29.35 |
| 98 | Dongducheon | 37.9 | 127.06 | 115.62 | 201 | Enhance | 37.7 | 126.44 | 47.84 |
| 99 | Paju | 37.88 | 126.76 | 30.59 | 202 | Yangpyeong | 37.48 | 127.49 | 47.26 |
| 100 | Daegwallyeong | 37.68 | 128.75 | 772.43 | 203 | Icheon | 37.26 | 127.48 | 80.09 |
| 101 | Chun Cheon | 37.9 | 127.73 | 75.82 | 211 | inje | 38.05 | 128.16 | 201.78 |
| 105 | Gangneung | 37.75 | 128.89 | 27.12 | 212 | Hongcheon | 37.68 | 127.88 | 140.2 |
| 106 | Donghae | 37.5 | 129.12 | 40.46 | 216 | Taebaek | 37.17 | 128.98 | 714.45 |
| 108 | Seoul | 37.57 | 126.96 | 85.67 | 221 | Jecheon | 37.15 | 128.19 | 264.62 |
| 112 | Incheon | 37.47 | 126.62 | 68.99 | 226 | Boeun | 36.48 | 127.73 | 171.31 |
| 114 | Wonju | 37.33 | 127.94 | 150.11 | 232 | Cheonan | 36.76 | 127.29 | 84.78 |
| 119 | Suwon | 37.25 | 126.98 | 39.81 | 235 | Boryeong | 36.32 | 126.55 | 9.98 |
| 121 | Yeongwol | 37.18 | 128.45 | 240.54 | 236 | Buyeo | 36.27 | 126.92 | 13.42 |
| 127 | Chungju | 36.97 | 127.95 | 114.85 | 238 | Geumsan | 36.1 | 127.48 | 172.69 |
| 129 | Seosan | 36.77 | 126.49 | 25.25 | 243 | Buan | 35.72 | 126.71 | 12.2 |
| 130 | Uljin | 36.99 | 129.41 | 48.98 | 244 | Imsil | 36.61 | 127.85 | 247.04 |
| 131 | Cheongju | 36.63 | 127.44 | 58.7 | 245 | Jeongeup | 35.56 | 126.83 | 68.7 |
| 133 | Daejong | 36.37 | 127.37 | 70.22 | 247 | Namwon | 35.42 | 127.39 | 133.49 |
| 135 | Chupungryung | 36.22 | 127.99 | 244.98 | 248 | Longevity | 35.65 | 127.52 | 406.87 |
| 136 | Andong | 36.57 | 128.7 | 141.26 | 260 | Jangheung | 34.68 | 126.91 | 43.99 |
| 138 | Pohang | 36.03 | 129.38 | 3.94 | 261 | Haenam | 34.55 | 126.56 | 16.36 |
| 140 | Gunsan | 36.005 | 126.76 | 27.85 | 262 | Goheung | 34.61 | 127.27 | 53.12 |
| 143 | Daegu | 35.82 | 128.65 | 53.4 | 271 | Baecon | 36.94 | 128.91 | 324.67 |
| 146 | Jeonju | 35.84 | 127.11 | 60.44 | 272 | Lord | 36.87 | 128.51 | 211.32 |
| 152 | Ulsan | 35.58 | 129.33 | 81.14 | 273 | Mungyeong | 36.62 | 128.14 | 173.01 |
| 155 | Changwon | 35.17 | 128.57 | 34.97 | 277 | Yeongdeok | 36.53 | 129.4 | 40.71 |
| 156 | Gwangju | 35.17 | 126.89 | 70.28 | 278 | Uiseong | 36.35 | 128.68 | 81.44 |
| 159 | Busan | 35.1 | 129.03 | 69.56 | 279 | Gumi | 36.13 | 128.32 | 49.17 |
| 162 | Tongyeong | 34.84 | 128.43 | 31.24 | 281 | Yeongcheon | 35.97 | 128.95 | 96.12 |
| 165 | Mokpo | 34.81 | 126.38 | 44.7 | 284 | Geochang | 35.66 | 127.9 | 228.45 |
| 168 | Yeosu | 34.73 | 127.74 | 65.93 | 285 | Hapcheon | 35.56 | 128.16 | 26.72 |
| 170 | Wando | 34.39 | 126.7 | 35.37 | 288 | Miryang | 35.49 | 128.74 | 8.31 |
| 184 | Jeju | 33.51 | 126.52 | 20.97 | 289 | Sancheong | 35.41 | 127.87 | 138.22 |
| 185 | Gosan | 33.29 | 126.16 | 71.39 | 294 | Geoje | 34.88 | 128.6 | 44.83 |
| 188 | Seongsan | 33.38 | 126.88 | 20.34 | 295 | Namhae | 34.81 | 127.92 | 45.71 |
| ID | Min | Max | Mean | STD | S | K | ID | Min | Max | Mean | STD | S | K |
|---|---|---|---|---|---|---|---|---|---|---|---|---|---|
| 90 | 928 | 2086 | 1389.92 | 277.84 | 0.67 | −0.18 | 189 | 1087 | 3244 | 1965.35 | 454.00 | 0.52 | 0.47 |
| 95 | 684 | 2193 | 1365.89 | 313.93 | 0.35 | 0.12 | 192 | 767 | 2193 | 1534.37 | 382.50 | −0.25 | −0.77 |
| 98 | 742 | 2311 | 1446.95 | 373.87 | 0.42 | −0.02 | 201 | 605 | 2365 | 1300.19 | 347.56 | 0.90 | 1.61 |
| 99 | 643 | 2063 | 1295.74 | 358.31 | 0.20 | −0.18 | 202 | 759 | 2255 | 1374.67 | 345.74 | 0.50 | 0.18 |
| 100 | 982 | 2998 | 1684.53 | 496.69 | 0.79 | −0.10 | 203 | 792 | 2313 | 1335.18 | 323.16 | 0.71 | 0.83 |
| 101 | 677 | 2069 | 1328.48 | 310.37 | 0.32 | −0.02 | 211 | 667 | 1779 | 1185.65 | 296.00 | 0.13 | −0.73 |
| 105 | 922 | 2095 | 1436.99 | 308.97 | 0.40 | −0.81 | 212 | 704 | 2375 | 1332.46 | 346.90 | 0.79 | 0.99 |
| 106 | 755 | 1967 | 1264.20 | 325.47 | 0.35 | −0.95 | 216 | 850 | 1973 | 1309.85 | 307.20 | 0.37 | −0.96 |
| 108 | 761 | 2356 | 1399.48 | 377.23 | 0.71 | 0.41 | 221 | 803 | 2231 | 1367.56 | 341.41 | 0.35 | −0.18 |
| 112 | 652 | 2010 | 1195.40 | 287.92 | 0.80 | 0.50 | 226 | 765 | 2085 | 1317.08 | 327.75 | 0.53 | −0.25 |
| 114 | 772 | 2188 | 1311.83 | 309.35 | 0.46 | 0.69 | 232 | 712 | 1846 | 1230.59 | 280.74 | 0.14 | −0.68 |
| 119 | 751 | 2044 | 1305.16 | 278.95 | 0.50 | 0.33 | 235 | 725 | 1898 | 1227.72 | 279.38 | −0.11 | −0.47 |
| 121 | 676 | 2086 | 1205.11 | 310.28 | 0.63 | 0.80 | 236 | 753 | 2138 | 1345.63 | 323.25 | 0.39 | −0.21 |
| 127 | 732 | 2073 | 1213.19 | 298.27 | 0.60 | 0.33 | 238 | 750 | 1827 | 1292.86 | 284.72 | −0.07 | −0.66 |
| 129 | 686 | 2142 | 1259.01 | 313.18 | 0.53 | 0.09 | 243 | 706 | 2074 | 1251.90 | 288.93 | 0.47 | 0.33 |
| 130 | 623 | 1790 | 1138.62 | 291.41 | 0.34 | −0.80 | 244 | 684 | 1974 | 1362.88 | 317.22 | −0.15 | −0.51 |
| 131 | 757 | 1806 | 1241.66 | 267.21 | −0.05 | −0.85 | 245 | 768 | 1917 | 1315.76 | 284.15 | 0.10 | −0.60 |
| 133 | 823 | 2070 | 1358.78 | 316.05 | 0.22 | −0.73 | 247 | 565 | 2050 | 1363.65 | 347.93 | −0.17 | −0.36 |
| 135 | 762 | 1835 | 1189.14 | 253.42 | 0.20 | −0.39 | 248 | 743 | 2208 | 1480.66 | 355.39 | −0.03 | −0.35 |
| 136 | 115 | 1579 | 1025.60 | 260.54 | −0.82 | 2.31 | 260 | 830 | 2357 | 1498.68 | 352.08 | −0.09 | −0.48 |
| 138 | 600 | 2098 | 1160.11 | 315.86 | 0.85 | 0.96 | 261 | 725 | 2108 | 1320.55 | 302.71 | 0.12 | −0.23 |
| 140 | 729 | 1769 | 1239.51 | 288.74 | 0.13 | −0.92 | 262 | 818 | 2485 | 1491.28 | 350.64 | 0.21 | 0.22 |
| 143 | 568 | 1750 | 1075.55 | 245.22 | 0.08 | 0.07 | 271 | 589 | 1736 | 1178.90 | 260.89 | 0.21 | −0.06 |
| 146 | 707 | 1860 | 1301.35 | 278.33 | −0.16 | −0.61 | 272 | 668 | 2019 | 1290.27 | 294.30 | 0.23 | −0.14 |
| 152 | 671 | 2059 | 1286.35 | 320.21 | 0.36 | −0.29 | 273 | 744 | 1963 | 1268.31 | 289.22 | 0.23 | −0.42 |
| 155 | 814 | 2897 | 1515.87 | 419.42 | 0.66 | 1.68 | 277 | 558 | 1841 | 1078.89 | 263.70 | 0.57 | 0.28 |
| 156 | 764 | 2027 | 1388.14 | 338.21 | 0.10 | −0.45 | 278 | 505 | 1697 | 1004.71 | 251.50 | 0.46 | 0.20 |
| 159 | 902 | 2397 | 1555.55 | 397.20 | 0.43 | −0.70 | 279 | 650 | 1750 | 1085.49 | 269.28 | 0.22 | −0.52 |
| 162 | 793 | 2555 | 1501.14 | 368.23 | 0.53 | 0.30 | 281 | 561 | 1724 | 1058.60 | 238.61 | 0.30 | −0.01 |
| 165 | 613 | 1737 | 1175.11 | 275.01 | −0.11 | −0.53 | 284 | 616 | 1958 | 1306.24 | 344.83 | −0.04 | −0.76 |
| 168 | 863 | 2451 | 1468.08 | 332.82 | 0.61 | 0.59 | 285 | 628 | 1863 | 1312.49 | 338.31 | −0.35 | −0.71 |
| 170 | 841 | 2646 | 1543.40 | 376.98 | 0.36 | 0.44 | 288 | 558 | 1880 | 1242.42 | 311.15 | −0.19 | −0.58 |
| 184 | 773 | 2526 | 1503.36 | 415.52 | 0.42 | 0.05 | 289 | 757 | 2493 | 1572.71 | 418.75 | −0.15 | −0.57 |
| 185 | 697 | 1875 | 1165.71 | 270.05 | 0.36 | −0.14 | 294 | 1136 | 3397 | 1893.91 | 525.68 | 0.81 | 0.28 |
| 188 | 1255 | 3194 | 1999.48 | 404.08 | 0.38 | 0.50 | 295 | 1081 | 2844 | 1885.39 | 444.52 | 0.05 | −0.52 |
Publisher’s Note: MDPI stays neutral with regard to jurisdictional claims in published maps and institutional affiliations. |
© 2022 by the authors. Licensee MDPI, Basel, Switzerland. This article is an open access article distributed under the terms and conditions of the Creative Commons Attribution (CC BY) license (https://creativecommons.org/licenses/by/4.0/).
Share and Cite
Moazzam, M.F.U.; Rahman, G.; Munawar, S.; Farid, N.; Lee, B.G. Spatiotemporal Rainfall Variability and Drought Assessment during Past Five Decades in South Korea Using SPI and SPEI. Atmosphere 2022, 13, 292. https://doi.org/10.3390/atmos13020292
Moazzam MFU, Rahman G, Munawar S, Farid N, Lee BG. Spatiotemporal Rainfall Variability and Drought Assessment during Past Five Decades in South Korea Using SPI and SPEI. Atmosphere. 2022; 13(2):292. https://doi.org/10.3390/atmos13020292
Chicago/Turabian StyleMoazzam, Muhammad Farhan Ul, Ghani Rahman, Saira Munawar, Nasir Farid, and Byung Gul Lee. 2022. "Spatiotemporal Rainfall Variability and Drought Assessment during Past Five Decades in South Korea Using SPI and SPEI" Atmosphere 13, no. 2: 292. https://doi.org/10.3390/atmos13020292