Article

PM2.5-Related Health Risk during Chinese Spring Festival in Taizhou, Zhejiang: The Health Impacts of COVID-19 Lockdown

1
Key Laboratory of Poyang Lake Environment and Resource Utilization, Ministry of Education, School of Resources and Environment, Nanchang University, Nanchang 330031, China
2
School of Civil and Architectural Engineering, Nanchang Institute of Technology, Nanchang 330099, China
3
Xinjiang Rao River Hydrological and Water Resources Monitoring Center, Shangrao 334001, China
*
Author to whom correspondence should be addressed.
Atmosphere 2022, 13(12), 2099; https://doi.org/10.3390/atmos13122099
Submission received: 9 November 2022 / Revised: 5 December 2022 / Accepted: 12 December 2022 / Published: 14 December 2022
(This article belongs to the Special Issue Control and Purification of Particulate Matter)

Abstract

:
Exposure to high concentrations of fine particles (PM2.5) with toxic metals can have significant health effects, especially during the Chinese spring festival (CSF), due to the large amount of fireworks’ emissions. Few studies have focused on the potential health impact of PM2.5 pollution in small cities in China during the 2020 CSF, which coincided with the COVID-19 outbreak that posed a huge challenge to the environment and obvious health issues to countries around the world. We examined the characteristics of PM2.5, including carbonaceous matter and elements, for three intervals during the 2020 CSF in Taizhou, identified the sources and evaluated the health risks, and compared them with those of 2018. The results showed that PM2.5 increased by 13.20% during the 2020 CSF compared to those in the 2018 CSF, while carbonaceous matter (CM) and elements decreased by 39.41% and 53.84%, respectively. The synergistic effects of emissions, chemistry, and transport may lead to increased PM2.5 pollution, while the lockdown measures contributed to the decrease in CM and elements during the 2020 CSF. Fe, Mn, and Cu were the most abundant elements in PM2.5 in both years, and As and Cr(VI) should be of concern as their concentrations in both years exceeded the NAAQS guideline values. Industry, combustion, and mineral/road dust sources were identified by PCA in both years, with a 5.87% reduction in the contribution from industry in 2020 compared to 2018. The noncarcinogenic risk posed by As, Co, Mn, and Ti in 2018 and As and Mn in 2020 was significant. The carcinogenic risk posed by As, Cr(VI), and Pb exceeded the accepted precautionary limit (1 × 10⁻⁶) in both years. Mn was the dominant contributor to the total noncarcinogenic risks, while Cr(VI) showed the largest excessive cancer risks posed by metals in PM2.5, implying its associated source, industry, was the greatest risk to people in Taizhou after exposure to PM2.5. Despite the increase in PM2.5 mass concentration, the health impacts were reduced by the lockdown policy implemented in Taizhou during the 2020 CSF compared to 2018. Our study highlights the urgent need to consider the mitigation of emissions in Taizhou and regional joint management efforts based on health protection objectives despite the rough source apportionment by PCA.

1. Introduction

The public health risks associated with exposure to fine particles (fine PM with a 50% cut-off aerodynamic diameter of 2.5 µm (PM2.5)) and air pollution have attracted increasing attention from the public, governments, and health organizations around the world [1]. PM2.5 is considered to be a major contributor to haze, causing not only reduced visibility but also health hazards [2,3]. Recent studies have shown that PM2.5 reduces life expectancy because of health effects on morbidity and mortality [4], particularly for lung cancer [5] and cardiovascular disease [6]. The population-weighted average of PM2.5 annual concentrations in China during 2013 was 61 μg/m3 [7], not reaching the WHO interim target level 1 (35 μg/m3). Therefore, the health effects caused by PM2.5 exposure have become an urgent issue in China.
Because of its large specific surface area, PM2.5 has been found to have the ability to attach various pollutants, including heavy metals and organic compounds, potentially increasing its mutagenic and carcinogenic risks [8]. Accumulated evidence suggests that transition metals in PM2.5 are strongly associated with oxidative DNA damage, although their mass is low compared to other components [9]. In order to assess the toxicity of metals associated with PM2.5, many studies have been conducted on the concentrations and spatial and temporal variabilities of different metals embedded in PM2.5, relying on long-term monitoring activities or short-term sampling events [3,10,11,12]. Traffic, residential energy use, industry, power plants, dust, and waste combustion are the main sources of PM2.5 [13,14,15]. Fireworks burning is also considered to be a significant source of air pollution, as fireworks are used to celebrate festivals and events around the world [3]. The particles and gases emitted from fireworks deteriorate air quality and increase the risk to human health [16,17,18,19,20,21,22].
A novel coronavirus (COVID-19) was reported in Wuhan in December 2019, which quickly expanded across China since the outbreak was coincident with the human migration of the Chinese spring festival (CSF) [23]. A national lockdown measure was imposed, reducing transportation, economic, and social activities; social distancing measures were also tightened by other countries [24,25,26]. This provided an opportunity to evaluate the sources of PM2.5 and potential health impacts during the CSF.
Many studies have reported significant improvements in air quality during city lockdowns (CLDs) [27,28,29,30]. In contrast, haze pollution still occurs because of unfavorable meteorological conditions [31,32,33] and long-range transport [34,35]. Currently, a large number of studies have been conducted in major cities where fireworks are banned, and few studies have focused on PM2.5 pollution and the resulting potential health impacts in small cities in China with a “limited fireworks” policy using systematic observations from both conventional and COVID-19 outbreak years. Since PM2.5 and its associated metals vary in concentrations across geographic regions, the diversity of findings requires field consideration in small cities rather than the direct adoption of relevant management strategies derived from the major city studies described above.
We aimed to assess the changes in ambient PM2.5 and the health risks of PM2.5-bound metals during the implementation of the lockdown measures in Taizhou, a small city in China in Zhejiang province, after the COVID-19 outbreak in 2020. We collected samples before and after the lockdown during the 2020 CSF and compared them with those from the same period in 2018. The differences in the sources of carbonaceous matter and heavy metals in PM2.5 between 2018 and 2020 were identified. Based on the concentrations of heavy metals in PM2.5, the health risks of human exposure to heavy metals in PM2.5 through inhalation were evaluated. We hope this study will enable the recommendation of targeted environmental policies in Taizhou.

2. Materials and Methods

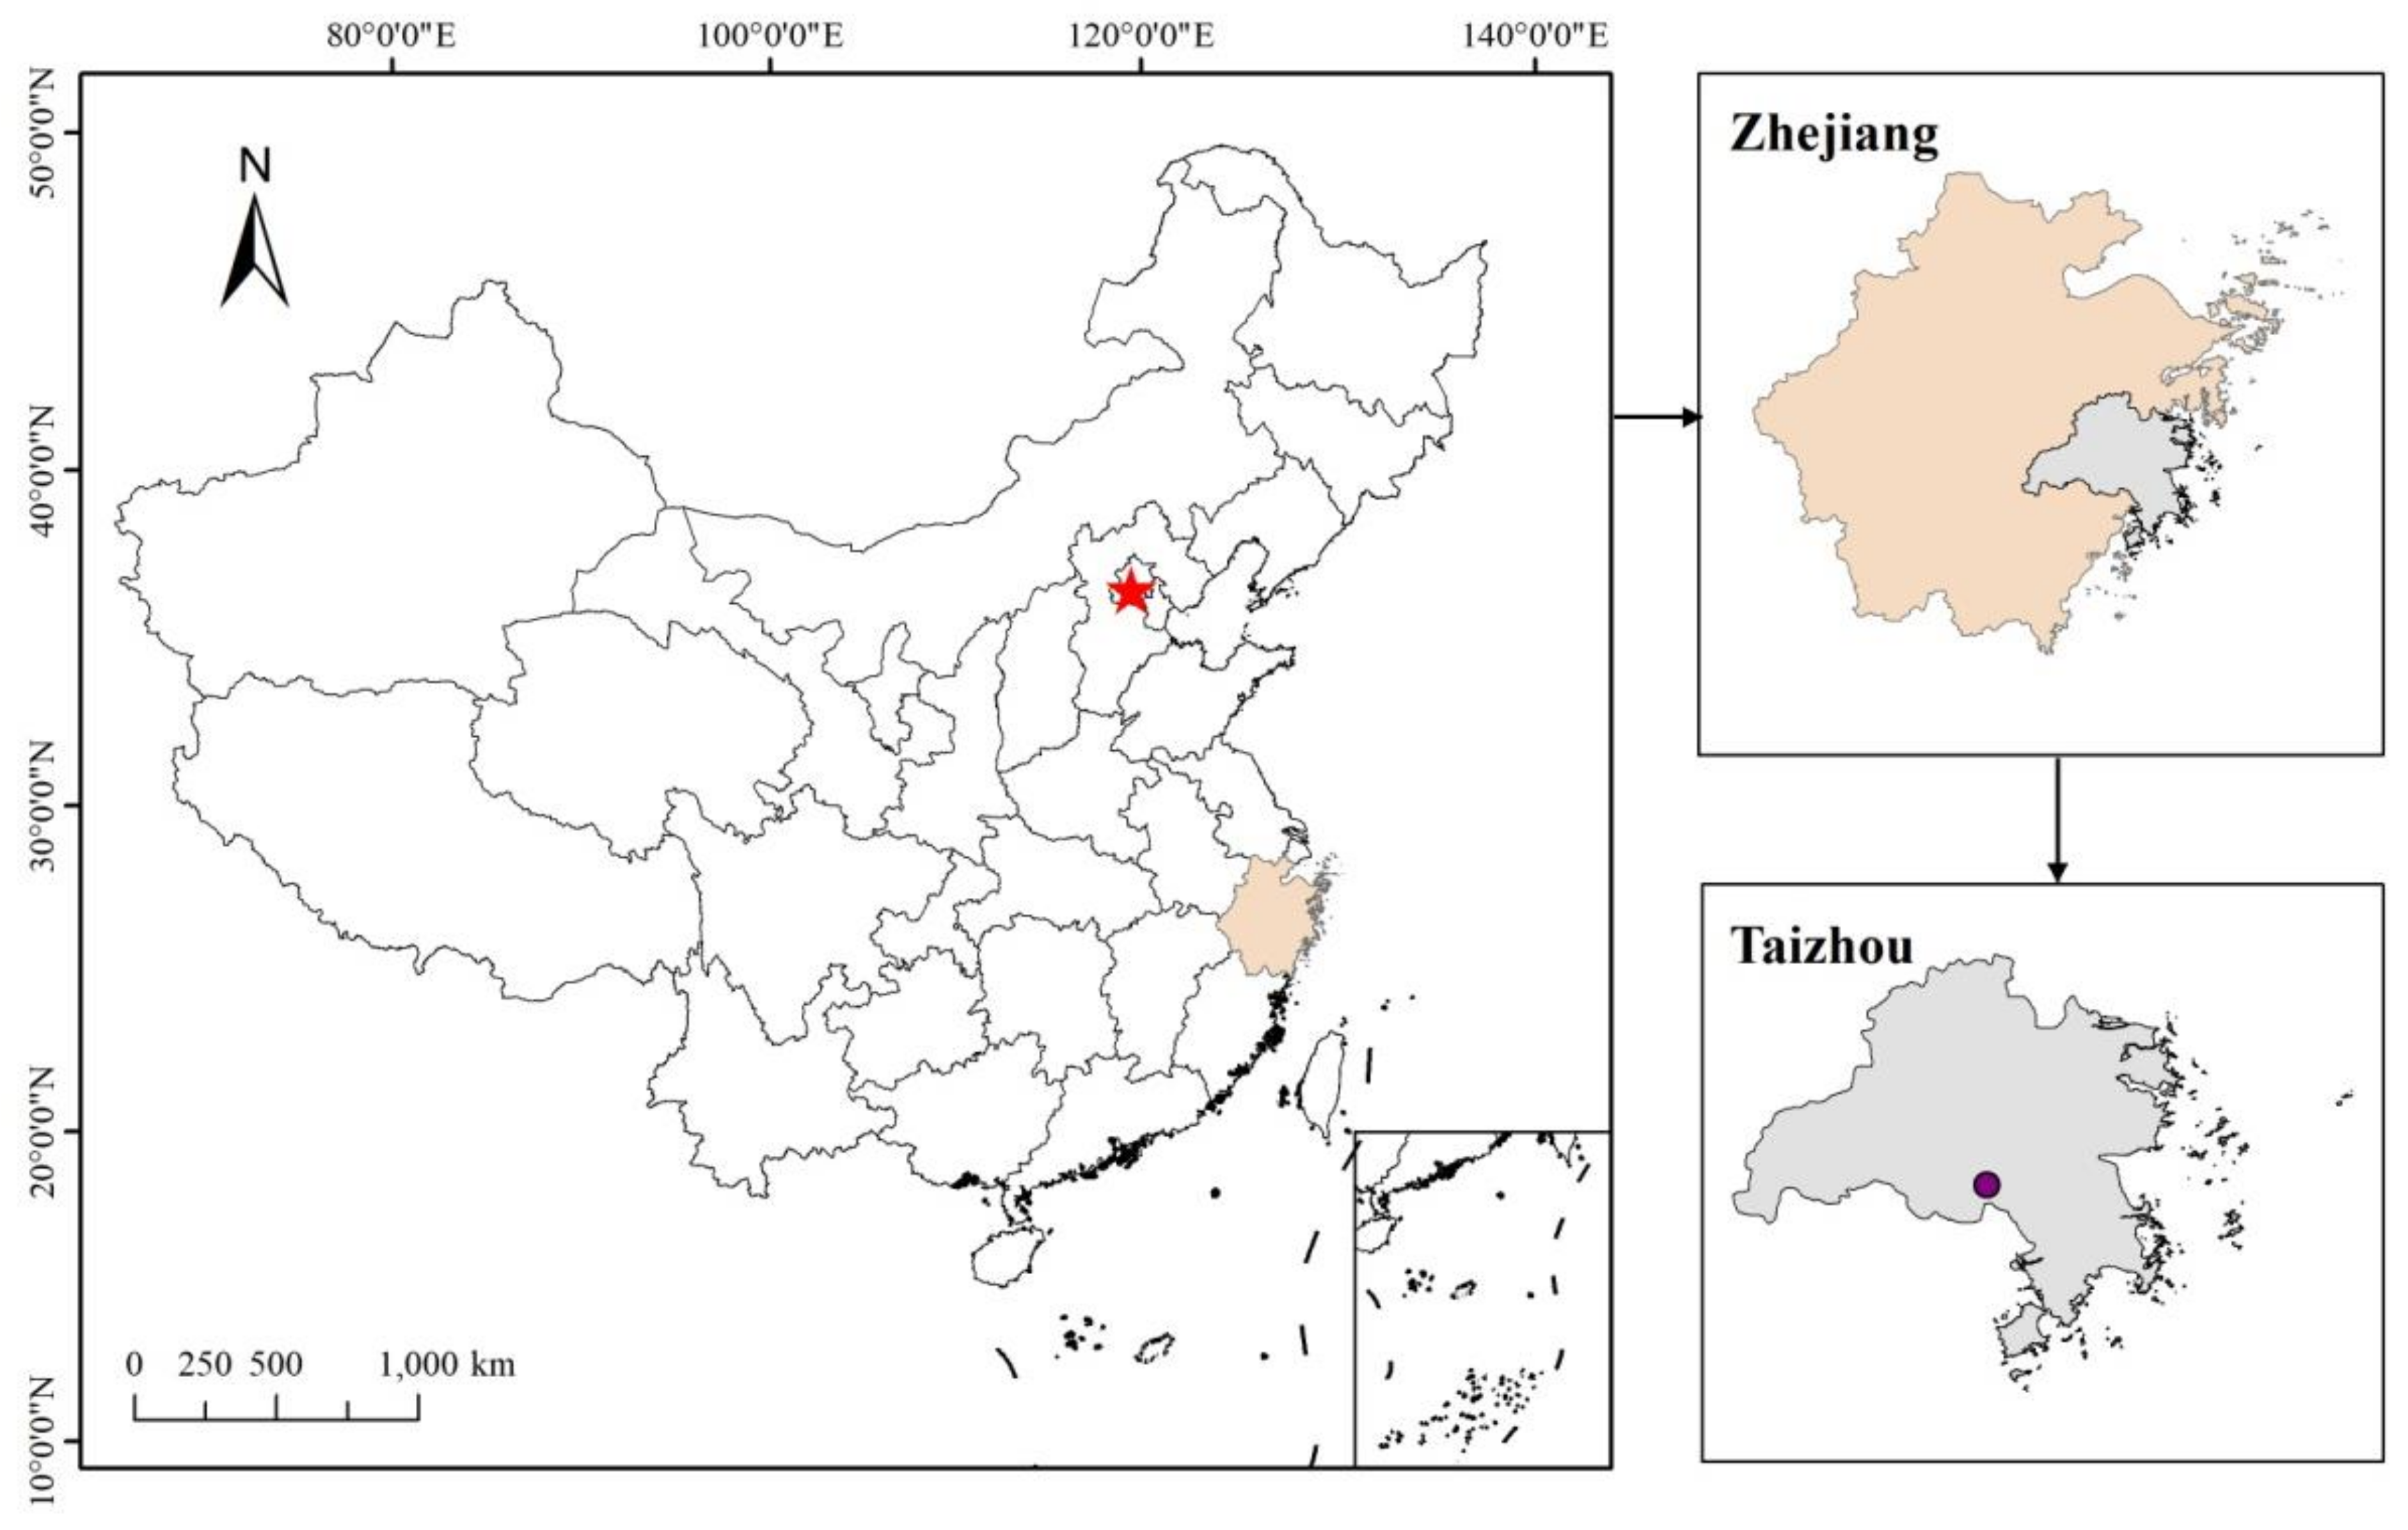
2.1. Study Area and Sampling

Taizhou is located in the middle of the East China Sea coast of Zhejiang province, with a population of 6.6 million and an area of 9411 km2. The sampling site (28.5994 N, 121.0954 E) is located in a rural area in the south-central part of the city, with no factories nearby (Figure 1). There is no fireworks ban here.
The sampling campaigns were conducted during CSF in 2018 and 2020. Sampling activities took place from 5 to 20 February 2018 and from 18 January to 12 February 2020, with 23 h of sampling per day. A portable particle sampler (Mini-vol TAS-5.0; Airmetrics, Springfield, OR, USA) was deployed on the roof of a two-story building to collect PM2.5 with quartz filters (Whatman; 47 mm, CAT No.1851-047) from the air at a flow rate of 5 L/min. The pump flow rate was corrected to 5 ± 0.05 L/min before and after sampling using a soap film flow calibrator (Gilibrator-2; Sensidyne, St. Petersburg, FL, USA).
Prior to sampling, the quartz filters were pre-cleaned at 500 °C for 6 h to remove volatile impurities and equilibrated in a desiccator at 25 °C and 40% relative humidity for 48 h. The filters were weighed on an analytical balance (AR224CN; Ohaus, Parsippany, NJ, USA) before and after sampling. The PM2.5 samples were stored in sealed polyethylene bags at −20 °C until further analysis.
The Lunar New Year in 2018 and 2020 fell on 16 February 2018 and 25 January 2020, respectively. As shown in Table 1, the sampling period was divided into three sections according to the human activities: (1) 5–14 February 2018 (10 days) and 16–23 January 2020 (8 days), before SF (pre-SF), when people prepared for the holiday and national lockdown on 23 January 2020; (2) 15–20 February 2018(6 days) and 24–30 January 2020 (7 days), the CSF holiday (SF), including Lunar New Year’s Eve (big fireworks evening, 24 January) and Lunar New Year’s day (CSF, 25 January 2020); and (3) 31 January–11 February 2020 (12 days), when people stayed at home because of lockdown measures (post-SF).

2.2. Chemical Analysis

Half of each filter sample was cut into pieces and placed in a digestion tube containing 20 mL of HCl-HNO3 digestion solution. The digestion was carried out at 100 °C for 2 h using an electric oven digester (BHW-09C heating block; BOTONYC, Shanghai, China). After cooling to room temperature, the digests were filtered through a 0.22 m filter and then diluted to 50 mL with deionized water. Ten elements (As, Ba, Co, Cr, Cu, Fe, Mn, Pb, Sr, and Ti) were analyzed using inductively coupled plasma optical emission spectroscopy (ICP-OES, iCAP 7000; Thermo Fisher, Waltham, MA, USA). The method detection limits (MDLs) from the OES instrument were in the range of 0.001–0.03 μg/m3. The recoveries of all elements were in the range of 95–105%.
A 0.495 cm2 punch from the sample filter was used to analyze the organic carbon (OC) and elemental carbon (EC) in PM2.5 samples by a thermal/optical carbon analyzer (DRI 2015; Atmoslytic, Calabasas, CA, USA) following the IMPROVE_A protocol. The analyzer was calibrated daily with a known quantity of CH4. MDLs for OC and EC were 0.18 μgC/cm2 and 0.04 μgC/cm2, respectively. One sample was analyzed in duplicate from each group of 10 samples. The difference between OC and EC determined from the duplicate analyses was less than 10%.

2.3. Human Exposure and Health Risk Assessment Model

The health risk assessment model recommended by USEPA was adopted in this paper (EPA, 2011). The risk effects consisted of noncarcinogenic and carcinogenic risk assessments according to USEPA IRIA and IARC. In this study, we mainly calculated the health risks caused by respiratory intake.
Inhalation exposure concentrations (ECi, μg/m3) of a given TMs were calculated as follows [36]:
EC i = C i × ET × EF × ED AT
where Ci is the exposure concentration of metals in PM2.5 (μg/m3); ET is the exposure time (24 h/day); EF is the exposure frequency (180 days/year); ED is the exposure duration (24 years for adults); and AT is the averaging time (for noncarcinogens, AT = ED × 365 days × 24 h/day, and for carcinogens, AT = 70 years × 365 days/year × 24 h).
The hazard quotient (HQ) for noncarcinogenic effects and carcinogenic risks (CRs) from exposure to the selected PM2.5-bound TMs were calculated as follows:
HQ = ECi/(RfCi × 1000 μg/mg)
CR = IURi × ECi
where RfCi is the reference concentration for inhalation exposure for a given metal (mg/m3); and IURi is the inhalation unit risk ((μg/m3)−1). An HQ value below 1 is ascribed no significant risk of non-cancer health effects, whereas a value above 1 indicates a chance at which noncarcinogenic effects may occur [37]. Furthermore, as for the carcinogenic risk, the acceptable precautionary criterion is from 1 × 10⁻⁶ to 1 × 10⁻⁴ [37]. For regulatory purposes, a CR value of 1 × 10⁻⁶ is adopted as the precautionary criterion in the present study [38].
The RfCi, IURi, and standard default values for exposure parameters were taken from the user’s guide and technical background document of the US Environmental Protection Agency (EPA) regional screening level (RSL) summary table (TR =1 × 10⁻⁶, HQ = 1) [39]. The hazard index (HI), equal to the sum of HQ, is used to assess the overall potential for noncarcinogenic effects:
HI =   HQ
In this study, since Cr was not speciated into Cr(III) and Cr(VI) and only the total Cr concentration was measured in each fraction, the CR of Cr (VI) was calculated as one-seventh of the total Cr concentration, based on the fact that the concentration ratio of Cr(VI) to Cr(III) in the air is about 1:6 [40]. We did not discuss Fe, Cu, Zn, and Ti because their RfCi values were unavailable.

3. Results and Discussion

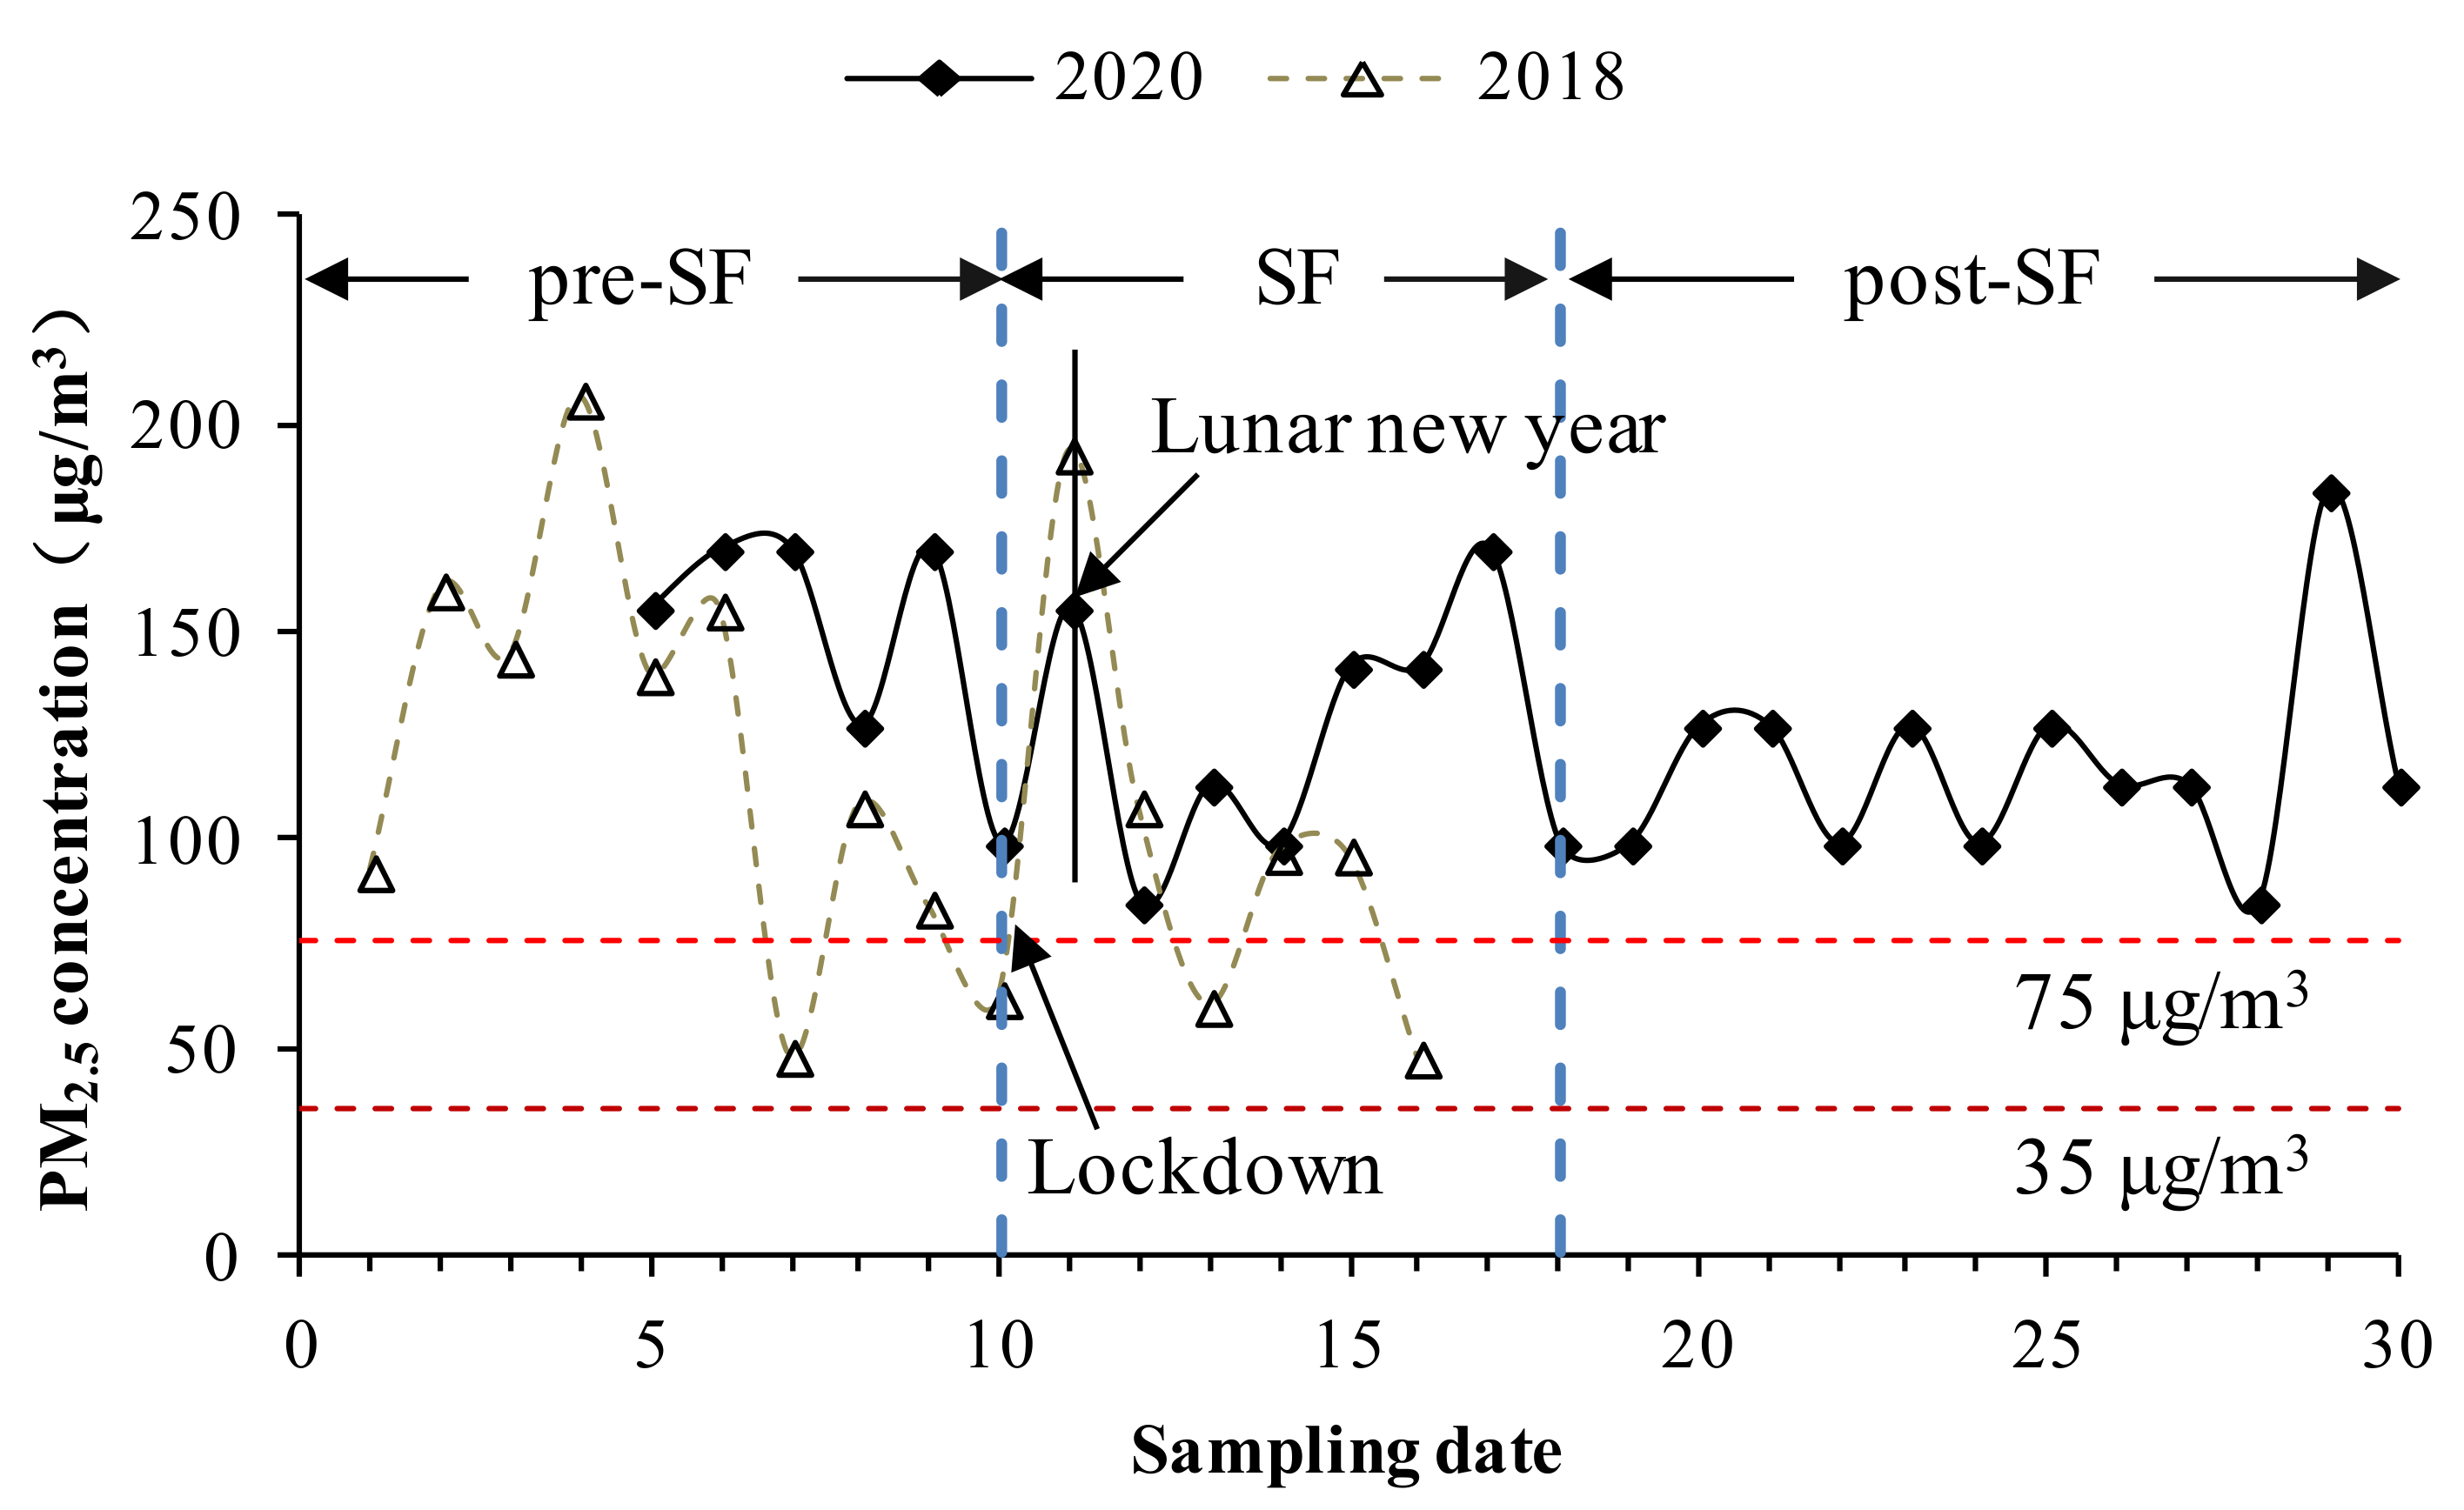
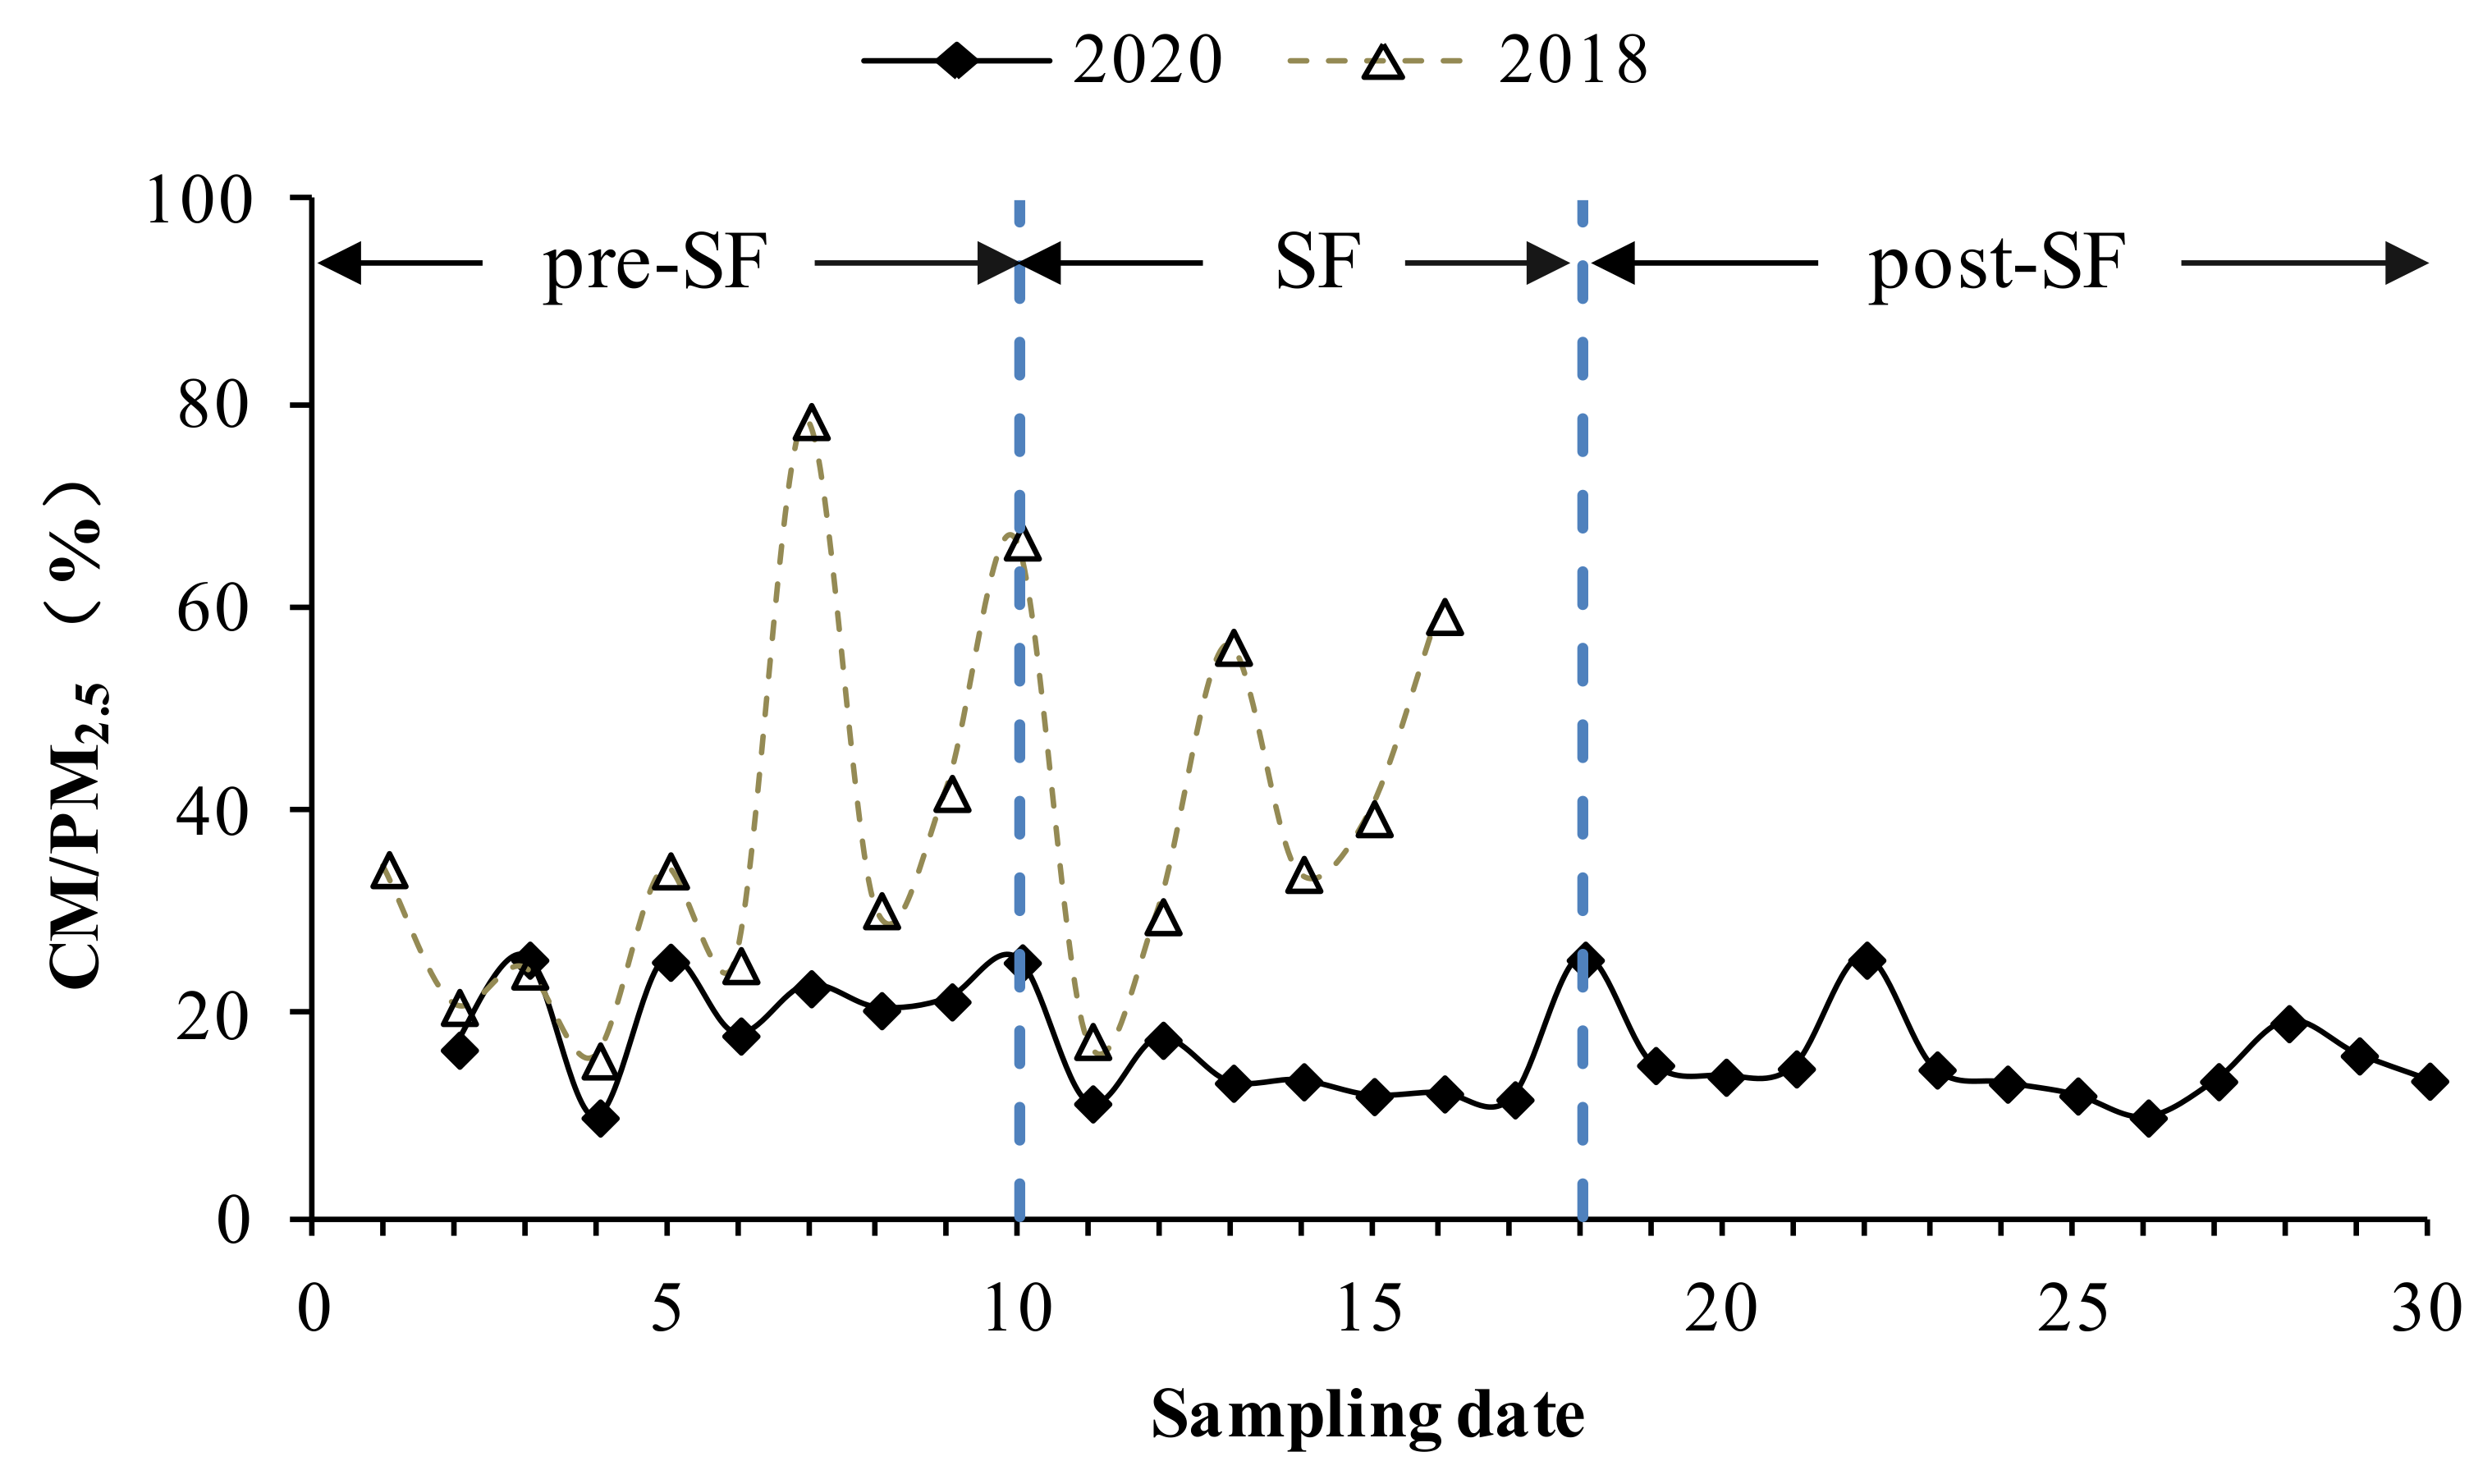
3.1. Impact of COVID-19 on the Characteristics of PM2.5 during the CSF

Figure 2 shows the mass variations of PM2.5 over the same sampling period in 2018 and 2020. The mean concentrations of PM2.5 were 112.77 ± 49.45 μg/m3 and 127.66 ± 29.48 μg/m3 during the observation period in 2018 and 2020, respectively, which reached three–four times the annual value (35 μg/m3) recommended in the National Ambient Air Quality Standard of China (NAAQS, GB3095-2012). Compared to 2018, Taizhou experienced an increase in PM2.5 in 2020, although some studies showed that quarantine measures led to an improvement in air quality [29,30,41]. Our results are consistent with studies in Beijing-Tianjin-Hebei (BTH) and Shanghai, which point to unfavorable meteorological conditions contributing to this outcome [33,34]. Low temperatures and high relative humidity (RH) during the wintertime usually favor the formation of sulfate, nitrate, and ammonium (SNA) aerosols. NO2 is a major contributor to atmospheric soot and haze, and atmospheric oxidants can promote the formation of secondary particles [42]. Therefore, we looked into the meteorological conditions (temperature, relative humidity, and wind speed) and NO2 and O3 levels from the website of the Ministry of Ecology and Environmental of the People’s Republic of China and found that the similar meteorological condition, the sudden drop in NO2 (Table S1 (Supplementary Materials)), and the slightly elevated O3 level after the COVID-19 outbreak do not explain the observed increased PM2.5 pollution in CSF-2020 well. Thus, the synergistic effects of emissions, chemistry, and transport may have led to increased PM2.5 pollution during CSF-20 [34,43,44]. Both the mean and median PM2.5 concentrations showed a downward trend throughout the study period in 2020, which could be attributed to the reduction in vehicles and industry activities following the national lockdown [12,45].
The average PM2.5 concentrations reached 120.17 μg/m³ and 148.94 μg/m³ in the pre-SF-2018 and pre-SF-2020, respectively; reduced to 100.44 μg/m³ and 125.30 μg/m³ in the SF-2018 and SF-2020, with a reduction of 16.42% and 15.87%, respectively; then, rose back up to 116.75 μg/m³ in post-SF-2020. This temporal pattern is consistent with the typical fluctuation of energy demand before, during, and after the CSF holidays, as discussed in Shanghai [34]. The intensive fireworks displays and cross-region transport of humans and vehicles, caused by the return of migrant workers to their hometowns, contributed to the high PM2.5 level in the pre-SF period [46,47]. PM2.5 peaks in 2018 and 2020 were observed in all three intervals owing to fireworks/firecrackers burning during festivals (Lunar New Year’s day, the Lantern festival) and rituals, which were also found in Shanghai, Chengdu, and Xiamen [47,48,49].
Concentrations of carbonaceous matter and trace elements in PM2.5 are summarized in Table 2. During 2018 CSF, the concentrations of OC and EC were 30.743 ± 2.416 μg/m³ and 6.063 ± 1.834 μg/m³ in the pre-SF period and 28.527 ± 2.416 μg/m³ and 4.767 ± 1.827 μg/m³ in the SF period, respectively. The mean OC/EC ratios were 5.293 and 6.906 in pre-SF and SF periods in 2018, respectively. The OC/EC ratio over three intervals during 2020 CSF was higher than that in 2018. After the lockdown, the mean OC/EC values increased first and then decreased, highlighting a decrease in the relative contribution of primary emissions to carbonaceous pollutants during the SF period [50], as EC is derived from the incomplete combustion of residential coal, vehicle fuels, and biomass and an increase in the relative contribution of secondary emissions during the post-SF period in 2020.
Carbonaceous matter (CM), which is the sum of organic matter (OM = 1.6 OC (Turpin and Lim, 2001)) and EC, was 55.25 μg/m³ in pre-SF, reduced by 8.76% to 50.41 μg/m³ during SF-2018. Since EC only comes from primary combustion emissions and behaves inertly to chemical reactions, the ratio of CM to PM2.5 can somewhat reflect the relative changes between secondary production and primary emission [51]. As shown in Figure 3, CM accounted for 17.50–78.59% of PM2.5, with an average value of 38.12%. The highest CM value occurred on 9 February 2018 (Little New Year, a week before the Lunar New Year).
In the 2020 observation period, CM values were 43.72–70.57 μg/m³, accounting for 10.09–25.61% of PM2.5, with an average value of 16.76%. The CM in the pre-SF period was similar to the level in 2018 at 50.25 μg/m³ but was significantly reduced by 48.68% to 25.79 μg/m³ in the SF period. A decrease in CM/PM2.5 occurred during SF and COVID lockdown, followed by an increase during the post-COVID period. This result indicates that secondary aerosol production was enhanced relative to primary emissions during SF and COVID lockdown compared to the pre- and post-COVID phases. Similar cases were observed in other cities [12,52].
The concentrations of 10 trace elements are presented in Table 2. The PM2.5-bound metal concentrations in 2020 were lower than those in 2018, despite the higher PM2.5 concentration in 2020 CSF. The decreases in As, Cr, Fe, Pb, and Ti were likely to be due to reductions in industrial activities and traffic [24,53]. Among the metals studied, Fe, Mn, and Cu were the most abundant elements in PM2.5 in both study years. The levels of Co, Cd, Pb, and Ti increased during the SF period compared to pre-SF in 2018, while they decreased in 2020. The As and Cr (VI) concentrations in both years exceeded the NAAQS guideline values of 0.006 and 0.000025 µg/m3, respectively. Therefore, As and Cr (VI) may be of significant health concern.
The PCA results (Table 3) for the PM2.5 showed three factors that had a total variance of 76.812% in 2018 CSF. The variance of the first, second, and third factors were 32.517%, 23.387%, and 20.907%, respectively. Factor 1 showed high Pb, Cr, and Ti loadings and low Co and Cu loadings, which were linked to industry sources. Factor 2 was associated with combustion sources, with high loads of EC, OC, and Mn. Factor 3, contributing to the high loading of mineral elements (Fe and Cu), was characterized by mineral/road dust. Three factors were also identified in 2020. Compared to 2018, the proportion of combustion sources remained at the same level, while industry sources decreased by 5.871%, likely because of the CLDs. Therefore, the industry emissions were the major underlying reasons for the change in the chemical component of PM2.5 in Taizhou, potentially leading to different health threats. Secondary sources could also contribute to the sources of PM2.5, which constitute a difference in total variance.

3.2. Comparison of Health Risks Associated with Metals in PM2.5 in 2018 and 2020

Human health risks associated with PM2.5-bound metals during the sampling period were calculated, as shown in Table 4 and Table 5. The noncarcinogenic risk posed by As, Co, Mn, and Ti in 2018 and As and Mn in 2020 exceeded the acceptable level (HQ > 1), while indicating the existence of significant noncarcinogenic risk. The carcinogenic risk posed by As, Cr (VI), and Pb also exceeded the accepted precautionary limit (1 × 10⁻⁶) in 2018 and 2020, indicating exposure to PM2.5-bound metals posed potential carcinogenic risks during CSF. Using the PCA-identified sources as the basis, the HQ of two selected metals (Mn and As) in PM2.5 mass was the highest for PM2.5 from mineral/road dust sources and combustion sources, while the CRs of Cr (VI) and As were the highest for PM2.5 from industry sources.
Among the evaluated metals, Mn, accounting for 34.68–51.10% and 58.83–76.99% of the total noncarcinogenic risk to humans in 2018 and 2020, respectively, and Cr (VI), accounting for approximately 80% of the total carcinogenic risk, were the major pollutants. Cr (VI) showed the largest CR in PM2.5, implying its associated source, industry, was the greatest risk to people in Taizhou after exposure to PM2.5.
Although the health risks of Fe and Cu are not discussed in this study, as their RfCi values were not available, the presence of these metals in particles is still of concern, as transition metals were found to be associated with oxidative stress [54,55,56,57,58] and iron metabolism may be involved in the development of cancer [59].

4. Conclusions

This study examined the characteristics, sources, and health risks of metals associated with PM2.5 during the CSF in Taizhou. PM2.5 samples were collected in 2018 and 2020. The results showed a decreasing trend in both the mean and median PM2.5 concentrations throughout the study period in 2018 and 2020. In addition, despite the lockdown measures, the average PM2.5 concentration in 2020 was higher than in 2018, reaching three–four times the recommended annual value (35 μg/m3) of China’s National Ambient Air Quality Standard, which may be due to the synergistic effects of emissions, chemistry, and transport during CSF-2020. Compared to CSF-2018, the CM and elements were reduced by 39.41% and 53.84%, respectively, during CSF-2020, which should be attributed to the lockdown measures. The proportion of carbonaceous substances to PM2.5 indicate a decrease in the relative contribution of primary emissions during the SF period and an increase in the relative contribution of secondary emissions in the post-SF period. Fe, Mn, and Cu were the predominant metals. Of all carcinogenic metals, As and Cr(VI) exceeded the values set by the NAAQS guideline. PCA was applied to identify the possible carbonaceous and metal sources contributing to air pollution during the CSF. Combustion, industry, and soil sources were identified as the PM2.5 sources and accounted for about 76% and 68% of the total variance in 2018 and 2020, respectively. The industry source was reduced by 5.87% with the impact of the city lockdown.
The health risk assessment showed that the total HQ and the total CR were higher than the acceptable limits during the CSF. The individual HQs for As, Co, and Mn and the individual CRs for As, Cr(VI), and Pb were above the acceptable limits in PM2.5. Mn and Cr(VI) were the major pollutants. Industry sources were the largest risk to people after exposure to PM2.5 in Taizhou.
This study has some limitations. For example, meteorological parameters were not measured at the sampling site. PM2.5 sources could be better identified if water-soluble ions were included and more samples were taken. Nevertheless, the findings provide scientific evidence for understanding the air quality and, thus, public health in Taizhou during the CSF. Detailed exposure assessment for the specific sources of PM2.5 based on health protection objectives can help make a considerable effort in air quality improvement. Control strategies and regional joint management efforts are important for the effective removal of air pollutants.

Supplementary Materials

The following supporting information can be downloaded at: https://www.mdpi.com/article/10.3390/atmos13122099/s1, Table S1: Pollutant concentrations (μg/m3) and meteorological conditions during the CSF.

Author Contributions

Conceptualization, S.H.; methodology, S.H. and Q.W.; software, K.J.; validation, K.J., H.Q., Q.W. and S.H.; formal analysis, Q.W.; investigation, Q.W., X.W. and W.F.; resources, S.H.; data curation, X.W.; writing—original draft preparation, Q.W. and X.W.; writing—review and editing, S.H.; visualization, W.F.; supervision, S.H. and D.W.; project administration, S.H., T.H. and J.L.; funding acquisition, S.H., T.H. and J.L. All authors have read and agreed to the published version of the manuscript.

Funding

This work received funding from the Postdoctoral Science Foundation of Jiangxi Province (no. 2016KY13), the Science and Technology Research Project of Jiangxi education department (no. 60011), Youth Science Foundation of Jiangxi Province (no. 20181BAB213017), and the National Natural Science Foundation of China (no. 52064037).

Institutional Review Board Statement

Not applicable.

Informed Consent Statement

Not applicable.

Data Availability Statement

The pollutant concentrations in Table S1 in supplementary file can be found at the China National Environmental Monitoring Center website http://www.cnemc.cn/. The meteorological data in Table S1 can be found at the China meteorological data network website http://data.cma.cn.

Acknowledgments

The authors are grateful for the above financial support and thank the two anonymous reviewers for their insightful comments.

Conflicts of Interest

The authors declare no conflict of interest.

References

  1. Wang, H.; Gao, Z.; Ren, J.; Liu, Y.; Chang, L.T.-C.; Cheung, K.; Feng, Y.; Li, Y. An urban-rural and sex differences in cancer incidence and mortality and the relationship with PM2.5 exposure: An ecological study in the southeastern side of Hu line. Chemosphere 2019, 216, 766–773. [Google Scholar] [CrossRef] [PubMed]
  2. Wu, C.; Wang, G.; Wang, J.; Li, J.; Ren, Y.; Zhang, L.; Cao, C.; Li, J.; Ge, S.; Xie, Y.; et al. Chemical characteristics of haze particles in Xi’an during Chinese Spring Festival: Impact of fireworks burning. J. Environ. Sci. 2018, 71, 179–187. [Google Scholar] [CrossRef] [PubMed]
  3. Singh, A.; Pant, P.; Pope, F.D. Air quality during and after festivals: Aerosol concentrations, composition and health effects. Atmos. Res. 2019, 227, 220–232. [Google Scholar] [CrossRef]
  4. Dai, L.; Zanobetti, A.; Koutrakis, P.; Schwartz, J.D. Associations of fine particulate matter species with mortality in the United States: A multicity time-series analysis. Environ. Health Perspect. 2014, 122, 837–842. [Google Scholar] [CrossRef]
  5. Dehghani, M.; Keshtgar, L.; Javaheri, M.R.; Derakhshan, Z.; Conti, G.O.; Zuccarello, P.; Ferrante, M. The effects of air pollutants on the mortality rate of lung cancer and leukemia. Mol. Med. Rep. 2017, 15, 3390–3397. [Google Scholar] [CrossRef] [PubMed] [Green Version]
  6. Lee, B.-J.; Kim, B.; Lee, K. Air pollution exposure and cardiovascular disease. Toxicol. Res. 2014, 30, 71–75. [Google Scholar] [CrossRef]
  7. Zhang, Y.-L.; Cao, F. Fine particulate matter (PM2.5) in China at a city level. Sci. Rep. 2015, 5, 14884. [Google Scholar] [CrossRef] [PubMed] [Green Version]
  8. Xie, J.; Jin, L.; Cui, J.; Luo, X.; Li, J.; Zhang, G.; Li, X. Health risk-oriented source apportionment of PM2.5-associated trace metals. Environ. Pollut. 2020, 262, 114655. [Google Scholar] [CrossRef] [PubMed]
  9. Sørensen, M.; Schins, R.P.; Hertel, O.; Loft, S. Transition metals in personal samples of PM2.5 and oxidative stress in human volunteers. Cancer Epidemiol. Biomark. Prev. 2005, 14, 1340–1343. [Google Scholar] [CrossRef] [Green Version]
  10. Liu, P.; Lei, Y.; Ren, H.; Gao, J.; Xu, H.; Shen, Z.; Zhang, Q.; Zheng, C.; Liu, H.; Zhang, R.; et al. Seasonal Variation and Health Risk Assessment of Heavy Metals in PM2.5 during Winter and Summer over Xi’an, China. Atmosphere 2017, 8, 91. [Google Scholar] [CrossRef]
  11. Jiang, N.; Duan, S.; Yu, X.; Zhang, R.; Wang, K. Comparative major components and health risks of toxic elements and polycyclic aromatic hydrocarbons of PM2.5 in winter and summer in Zhengzhou: Based on three-year data. Atmos. Res. 2018, 213, 173–184. [Google Scholar] [CrossRef]
  12. Liu, L.; Zhang, J.; Du, R.; Teng, X.; Hu, R.; Yuan, Q.; Tang, S.; Ren, C.; Huang, X.; Xu, L.; et al. Chemistry of Atmospheric Fine Particles During the COVID-19 Pandemic in a Megacity of Eastern China. Geophys. Res. Lett. 2021, 48, 2020GL091611. [Google Scholar] [CrossRef] [PubMed]
  13. Karagulian, F.; Belis, C.A.; Dora, C.F.C.; Prüss-Ustün, A.M.; Bonjour, S.; Adair-Rohani, H.; Amann, M. Contributions to cities’ ambient particulate matter (PM): A systematic review of local source contributions at global level. Atmos. Environ. 2015, 120, 475–483. [Google Scholar] [CrossRef]
  14. Thurston, G.D.; Ito, K.; Lall, R. A source apportionment of U.S. fine particulate matter air pollution. Atmos. Environ. 2011, 45, 3924–3936. [Google Scholar] [CrossRef] [PubMed] [Green Version]
  15. Cheng, N.; Zhang, C.; Jing, D.; Li, W.; Guo, T.; Wang, Q.; Li, S. An integrated chemical mass balance and source emission inventory model for the source apportionment of PM2.5 in typical coastal areas. J. Environ. Sci. 2020, 92, 118–128. [Google Scholar] [CrossRef]
  16. Jiang, Q.; Sun, Y.L.; Wang, Z.; Yin, Y. Aerosol composition and sources during the Chinese Spring Festival: Fireworks, secondary aerosol, and holiday effects. Atmos. Chem. Phys. 2015, 15, 6023–6034. [Google Scholar] [CrossRef] [Green Version]
  17. Feng, J.; Yu, H.; Su, X.; Liu, S.; Li, Y.; Pan, Y.; Sun, J.-H. Chemical composition and source apportionment of PM2.5 during Chinese Spring Festival at Xinxiang, a heavily polluted city in North China: Fireworks and health risks. Atmos. Res. 2016, 182, 176–188. [Google Scholar] [CrossRef]
  18. Becker, J.M.; Iskandrian, S.; Conkling, J. Fatal and near-fatal asthma in children exposed to fireworks. Ann. Allergy Asthma Immunol. 2000, 85, 512–513. [Google Scholar] [CrossRef]
  19. Liu, J.; Chen, Y.; Chao, S.; Cao, H.; Zhang, A. Levels and health risks of PM2.5-bound toxic metals from firework/firecracker burning during festival periods in response to management strategies. Ecotoxicol. Environ. Saf. 2019, 171, 406–413. [Google Scholar] [CrossRef] [PubMed]
  20. Yang, L.; Gao, X.; Wang, X.; Nie, W.; Wang, J.; Gao, R.; Xu, P.; Shou, Y.; Zhang, Q.; Wang, W. Impacts of firecracker burning on aerosol chemical characteristics and human health risk levels during the Chinese New Year Celebration in Jinan, China. Sci. Total Environ. 2014, 476, 57–64. [Google Scholar] [CrossRef] [PubMed]
  21. Pirker, L.; Velkavrh, Ž.; Osīte, A.; Drinovec, L.; Močnik, G.; Remškar, M. Fireworks—A source of nanoparticles, PM2.5, PM10, and carbonaceous aerosols. Air Qual. Atmos. Health 2022, 15, 1275–1286. [Google Scholar] [CrossRef]
  22. Nasir, U.P.; Brahmaiah, D. Impact of fireworks on ambient air quality: A case study. Int. J. Environ. Sci. Technol. 2015, 12, 1379–1386. [Google Scholar] [CrossRef]
  23. Huang, C.; Wang, Y.; Li, X.; Ren, L.; Zhao, J.; Hu, Y.; Zhang, L.; Fan, G.; Xu, J.; Gu, X.; et al. Clinical features of patients infected with 2019 novel coronavirus in Wuhan, China. Lancet 2020, 395, 497–506. [Google Scholar] [CrossRef] [PubMed] [Green Version]
  24. Dai, Q.; Ding, J.; Song, C.; Liu, B.; Bi, X.; Wu, J.; Zhang, Y.; Feng, Y.; Hopke, P.K. Changes in source contributions to particle number concentrations after the COVID-19 outbreak: Insights from a dispersion normalized PMF. Sci. Total Environ. 2021, 759, 143548. [Google Scholar] [CrossRef]
  25. Kraemer, M.U.; Yang, C.-H.; Gutierrez, B.; Wu, C.-H.; Klein, B.; Pigott, D.M.; Group†, O.C.-D.W.; Plessis, L.D.; Faria, N.R.; Li, R. The effect of human mobility and control measures on the COVID-19 epidemic in China. Science 2020, 368, 493–497. [Google Scholar] [CrossRef] [Green Version]
  26. Tian, H.; Liu, Y.; Li, Y.; Wu, C.-H.; Chen, B.; Kraemer, M.U.; Li, B.; Cai, J.; Xu, B.; Yang, Q. An investigation of transmission control measures during the first 50 days of the COVID-19 epidemic in China. Science 2020, 368, 638–642. [Google Scholar] [CrossRef] [Green Version]
  27. Rodríguez-Urrego, D.; Rodríguez-Urrego, L. Air quality during the COVID-19: PM2.5 analysis in the 50 most polluted capital cities in the world. Environ. Pollut. 2020, 266, 115042. [Google Scholar] [CrossRef] [PubMed]
  28. Chauhan, A.; Singh, R.P. Decline in PM2.5 concentrations over major cities around the world associated with COVID-19. Environ. Res. 2020, 187, 109634. [Google Scholar] [CrossRef]
  29. Chen, H.; Huo, J.; Fu, Q.; Duan, Y.; Xiao, H.; Chen, J. Impact of quarantine measures on chemical compositions of PM2.5 during the COVID-19 epidemic in Shanghai, China. Sci. Total Environ. 2020, 743, 140758. [Google Scholar] [CrossRef]
  30. Tobías, A.; Carnerero, C.; Reche, C.; Massagué, J.; Via, M.; Minguillón, M.C.; Alastuey, A.; Querol, X. Changes in air quality during the lockdown in Barcelona (Spain) one month into the SARS-CoV-2 epidemic. Sci. Total Environ. 2020, 726, 138540. [Google Scholar] [CrossRef]
  31. Le, T.; Wang, Y.; Liu, L.; Yang, J.; Yung, Y.L.; Li, G.; Seinfeld, J.H. Unexpected air pollution with marked emission reductions during the COVID-19 outbreak in China. Science 2020, 369, 702–706. [Google Scholar] [CrossRef] [PubMed]
  32. Wang, H.; Miao, Q.; Shen, L.; Yang, Q.; Wu, Y.; Wei, H. Air pollutant variations in Suzhou during the 2019 novel coronavirus (COVID-19) lockdown of 2020: High time-resolution measurements of aerosol chemical compositions and source apportionment. Environ. Pollut. 2021, 271, 116298. [Google Scholar] [CrossRef] [PubMed]
  33. Sulaymon, I.D.; Zhang, Y.; Hopke, P.K.; Hu, J.; Zhang, Y.; Li, L.; Mei, X.; Gong, K.; Shi, Z.; Zhao, B. Persistent high PM2.5 pollution driven by unfavorable meteorological conditions during the COVID-19 lockdown period in the Beijing-Tianjin-Hebei region, China. Environ. Res. 2021, 198, 111186. [Google Scholar] [CrossRef] [PubMed]
  34. Chang, Y.; Huang, R.-J.; Ge, X.; Huang, X.; Hu, J.; Duan, Y.; Zou, Z.; Liu, X.; Lehmann, M.F. Puzzling Haze Events in China during the Coronavirus (COVID-19) Shutdown. Geophys. Res. Lett. 2020, 47, e2020GL088533. [Google Scholar] [CrossRef] [PubMed]
  35. Kim, Y.; Jeon, K.; Park, J.; Shim, K.; Kim, S.-W.; Shin, H.-J.; Yi, S.-M.; Hopke, P.K. Local and transboundary impacts of PM2.5 sources identified in Seoul during the early stage of the COVID-19 outbreak. Atmos. Pollut. Res. 2022, 13, 101510. [Google Scholar] [CrossRef] [PubMed]
  36. USEPA. Risk Assessment Guidance for Superfund Volume I: Human Health Evaluation Manual (Part F, Supplemental Guidance for Inhalation Risk Assessment); EPA-540-R-070-002, OSWER 9285.7-82; Office of Superfund Remediation and Technology Innovation, United States Environmental Protection Agency: Washington, DC, USA, 2009; pp. 13–24. [Google Scholar]
  37. USEPA. Risk-Assessment Guidance for Superfund. Volume 1. Human Health Evaluation Manual. Part A. Interim Report (Final); EPA/540/1-89/002; Office of Solid Waste and Emergency Response: Washington, DC, USA, 1989; pp. 8–28. [Google Scholar]
  38. USEPA. Risk Assessment Guidance for Superfund, Volume 1, Human Health Evaluation Manual (Part B, Development of Risk-Based Preliminary Remediation Goals); EPA/540/R-92/003; Office of Emergencyand Remedical Response: Washington, DC, USA, 1991; pp. 1–4. [Google Scholar]
  39. USEPA. Regional Screening Level (RSL) Summary Table (TR = 1E-06, HQ = 1); US Environmental Protection Agency (EPA): Washington, DC, USA, 2021. [Google Scholar]
  40. Taner, S.; Pekey, B.; Pekey, H. Fine particulate matter in the indoor air of barbeque restaurants: Elemental compositions, sources and health risks. Sci. Total Environ. 2013, 454–455, 79–87. [Google Scholar] [CrossRef] [PubMed]
  41. Xue, W.; Shi, X.; Yan, G.; Wang, J.; Xu, Y.; Tang, Q.; Wang, Y.; Zheng, Y.; Lei, Y. Impacts of meteorology and emission variations on the heavy air pollution episode in North China around the 2020 Spring Festival. Sci. China Earth Sci. 2021, 64, 329–339. [Google Scholar] [CrossRef] [PubMed]
  42. Xu, H.; Chen, L.; Chen, J.; Bao, Z.; Wang, C.; Gao, X.; Cen, K. Unexpected rise of atmospheric secondary aerosols from biomass burning during the COVID-19 lockdown period in Hangzhou, China. Atmos. Environ. 2022, 278, 119076. [Google Scholar] [CrossRef]
  43. An, Z.; Huang, R.-J.; Zhang, R.; Tie, X.; Li, G.; Cao, J.; Zhou, W.; Shi, Z.; Han, Y.; Gu, Z.; et al. Severe haze in northern China: A synergy of anthropogenic emissions and atmospheric processes. Proc. Natl. Acad. Sci. USA 2019, 116, 8657–8666. [Google Scholar] [CrossRef] [Green Version]
  44. Guo, S.; Hu, M.; Zamora, M.L.; Peng, J.; Shang, D.; Zheng, J.; Du, Z.; Wu, Z.; Shao, M.; Zeng, L.; et al. Elucidating severe urban haze formation in China. Proc. Natl. Acad. Sci. USA 2014, 111, 17373–17378. [Google Scholar] [CrossRef] [PubMed]
  45. Wang, Y.; Yuan, Y.; Wang, Q.; Liu, C.; Zhi, Q.; Cao, J. Changes in air quality related to the control of coronavirus in China: Implications for traffic and industrial emissions. Sci. Total Environ. 2020, 731, 139133. [Google Scholar] [CrossRef]
  46. Luo, K.; Wang, Z.; Wu, J. Association of population migration with air quality: Role of city attributes in China during COVID-19 pandemic (2019–2021). Atmos. Pollut. Res. 2022, 13, 101419. [Google Scholar] [CrossRef] [PubMed]
  47. Wang, S.; Yu, R.; Shen, H.; Wang, S.; Hu, Q.; Cui, J.; Yan, Y.; Huang, H.; Hu, G. Chemical characteristics, sources, and formation mechanisms of PM2.5 before and during the Spring Festival in a coastal city in Southeast China. Environ. Pollut. 2019, 251, 442–452. [Google Scholar] [CrossRef]
  48. Feng, J.; Sun, P.; Hu, X.; Zhao, W.; Wu, M.; Fu, J. The chemical composition and sources of PM2.5 during the 2009 Chinese New Year’s holiday in Shanghai. Atmos. Res. 2012, 118, 435–444. [Google Scholar] [CrossRef]
  49. Wu, K.; Duan, M.; Liu, H.; Zhou, Z.; Deng, Y.; Song, D.; Tan, Q. Characterizing the composition and evolution of firework-related components in air aerosols during the Spring Festival. Environ. Geochem. Health 2018, 40, 2761–2771. [Google Scholar] [CrossRef] [PubMed]
  50. Turpin, B.J.; Huntzicker, J.J. Identification of secondary organic aerosol episodes and quantitation of primary and secondary organic aerosol concentrations during SCAQS. Atmos. Environ. 1995, 29, 3527–3544. [Google Scholar] [CrossRef]
  51. Zhang, J.; Liu, L.; Wang, Y.; Ren, Y.; Wang, X.; Shi, Z.; Zhang, D.; Che, H.; Zhao, H.; Liu, Y.; et al. Chemical composition, source, and process of urban aerosols during winter haze formation in Northeast China. Environ. Pollut. 2017, 231, 357–366. [Google Scholar] [CrossRef] [PubMed]
  52. Wang, P.; Chen, K.; Zhu, S.; Wang, P.; Zhang, H. Severe air pollution events not avoided by reduced anthropogenic activities during COVID-19 outbreak, Resources. Conserv. Recycl. 2020, 158, 104814. [Google Scholar] [CrossRef] [PubMed]
  53. Hong, Y.; Xu, X.; Liao, D.; Zheng, R.; Ji, X.; Chen, Y.; Xu, L.; Li, M.; Wang, H.; Xiao, H.; et al. Source apportionment of PM2.5 and sulfate formation during the COVID-19 lockdown in a coastal city of southeast China. Environ. Pollut. 2021, 286, 117577. [Google Scholar] [CrossRef]
  54. Nieuwenhuijsen, M.J.; Gómez-Perales, J.E.; Colvile, R.N. Levels of particulate air pollution, its elemental composition, determinants and health effects in metro systems. Atmos. Environ. 2007, 41, 7995–8006. [Google Scholar] [CrossRef]
  55. Winterbourn, C.C. Toxicity of iron and hydrogen peroxide the Fenton reaction. Toxicol. Lett. 1995, 82–83, 969–974. [Google Scholar] [CrossRef] [PubMed]
  56. Park, J.; Park, E.H.; Schauer, J.J.; Yi, S.-M.; Heo, J. Reactive oxygen species (ROS) activity of ambient fine particles (PM2.5) measured in Seoul, Korea. Environ. Int. 2018, 117, 276–283. [Google Scholar] [PubMed]
  57. Keeling, B.; Li, K.Y.; Churg, A. Iron enhances uptake of mineral particles and increases lipid peroxidation in tracheal epithelial cells. Am. J. Respir. Cell Mol. Biol. 1994, 10, 683–688. [Google Scholar] [CrossRef] [PubMed]
  58. Chen, S.; Li, D.; Wu, X.; Chen, L.; Zhang, B.; Tan, Y.; Yu, D.; Niu, Y.; Duan, H.; Li, Q.; et al. Application of cell-based biological bioassays for health risk assessment of PM2.5 exposure in three megacities, China. Environ. Int. 2020, 139, 105703. [Google Scholar] [CrossRef]
  59. Park, E.J.; Kim, S.N.; Lee, G.H.; Jo, Y.M.; Yoon, C.; Kim, D.W.; Cho, J.W.; Han, J.S.; Lee, S.J.; Seong, E.; et al. Inhaled underground subway dusts may stimulate multiple pathways of cell death signals and disrupt immune balance. Environ. Res. 2020, 191, 109839. [Google Scholar] [CrossRef]
Figure 1. Sampling site in this study.
Atmosphere 13 02099 g001
Figure 2. PM2.5 mass concentration during CSF in 2018 and 2020.
Atmosphere 13 02099 g002
Figure 3. CM/PM2.5 during CSF in 2018 and 2020.
Atmosphere 13 02099 g003
Table 1. Time period description in 2018 CSF and 2020 CSF.
Sampling PeriodPre-SFSFPost-SFLunar New Year
2018 CSF5–14 February 201815–20 February 2018/16 February 2018
2020 CSF16–23 January 202024–30 January 202031 January−11 February 202025 January 2020
Table 2. Carbonaceous and trace elements in PM2.5 in different intervals (μg/m³).
2018Pre-SFSF2020Pre-SFSFPost-SF
OC30.743 ± 3.65628.527 ± 2.416OC28.897 ± 6.43615.113 ± 1.78715.372 ± 3.815
EC6.063 ± 1.8344.767 ± 1.827EC4.019 ± 1.3371.612 ± 0.4663.074 ± 2.241
OC/EC5.293 ± 0.9786.906 ± 3.036OC/EC7.962 ± 3.1909.832 ± 1.9896.544 ± 3.373
CM55.252 ± 7.1656.906 ± 3.036CM50.255 ± 10.14625.792 ± 3.28427.669 ± 7.534
As0.084 ± 0.0180.084 ± 0.021As0.070 ± 0.0200.030 ± 0.0240.036 ± 0.026
Ba--Ba0.152 ± 0.0110.262 ± 0.2340.158 ± 0.022
Cd--Cd0.005 ± 0.0010.003 ± 0.0030.003 ± 0.001
Co0.014 ± 0.0000.019 ± 0.001Co---
Cr0.128 ± 0.0220.157 ± 0.013Cr0.009 ± 0.0010.010 ± 0.0010.010 ± 0.001
Cu0.355 ± 0.0730.398 ± 0.060Cu0.199 ± 0.0170.242 ± 0.0300.215 ± 0.030
Fe5.052 ± 3.6253.625 ± 0.616Fe1.489 ± 0.1661.555 ± 0.2031.465 ± 0.142
Mn0.506 ± 0.0930.299 ± 0.161Mn0.419 ± 0.0320.542 ± 0.1190.442 ± 0.047
Pb0.176 ± 0.0680.313 ± 0.120Pb0.087 ± 0.0180.069 ± 0.0200.043 ± 0.016
Ti0.154 ± 0.0520.227 ± 0.028Ti0.034 ± 0.0030.034 ± 0.0030.031 ± 0.004
Table 3. Factor loadings of PM2.5 in Taizhou.
2018Principle Components2020Principle Components
PC1PC2PC3PC1PC2PC3
OC 0.529 OC 0.738
EC 0.938 EC 0.611
As 0.777As 0.725
Cd Cd −0.661
Co0.643 Co
Cr0.851 Cr 0.744
Cu0.543 0.667Cu0.928
Fe 0.782Fe0.856
Mn 0.599 Mn0.934
Pb0.958 Pb 0.704
Ti0.817 Ti 0.596
Variance, %32.51723.38720.907Variance, %30.17523.45715.036
Cumulative, %32.51755.90576.812Cumulative, %30.17553.63268.669
SourceIndustryCombustion Mineral/road dust Mineral/road dust Combustion Industry
Table 4. Noncarcinogenic risks via inhalation exposure to PM2.5-bound metals during SF.
HQRfCi
(mg/m3)
20182020
Pre-SFSFPre-SFSFPost-SF
As1.5 × 10−52.77 ± 0.602.77 ± 0.682.30 ± 0.660.99 ± 0.781.17 ± 0.86
Ba5 × 10−4--0.15 ± 0.010.26 ± 0.230.16 ± 0.02
Cd1 × 10−5--0.23 ± 0.070.14 ± 0.130.16 ± 0.06
Co6 × 10−61.16 ± 0.211.55 ± 0.12---
Cr(VI)1 × 10−40.09 ± 0.020.11 ± 0.010.04 ± 0.000.05 ± 0.010.05 ± 0.00
Mn5 × 10−54.99 ± 0.922.95 ± 1.594.13 ± 0.045.35 ± 0.134.36 ± 0.05
Ti1 × 10−40.76 ± 0.261.12 ± 0.140.17 ± 0.010.17 ± 0.010.15 ± 0.02
Table 5. Carcinogenic risks via inhalation exposure to PM2.5-bound metals during SF.
CRIUR
(μg/m3)−1
2018 2020
pre-SFSFpre-SFSFpost-SF
As4.3 × 10−36.12 × 10⁻⁵ ±
1.32 × 10⁻⁵
6.12 × 10⁻⁵ ±
1.50 × 10⁻⁵
5.09 × 10⁻⁵ ±
1.45 × 10⁻⁵
2.18 × 10⁻⁵ ±
1.73 × 10⁻⁵
2.59 × 10⁻⁵ ±
1.91 × 10⁻⁵
Cd1.8 × 10−3--7.84 × 10⁻⁹ ±
2.42 × 10⁻⁹
4.79 × 10⁻⁹ ±
4.49 × 10⁻⁹
5.50 × 10⁻⁹ ±
2.11 × 10⁻⁹
Co9 × 10−31.43 × 10⁻⁸ ± 2.57 × 10−91.92 × 10−8 ±
1.46 × 10⁻⁹
---
Cr(VI)8.4 × 10−22.60 × 10−4 ±
4.43 × 10⁻⁵
3.18 × 10⁻⁴ ±
2.66 × 10⁻⁵
1.29 × 10⁻⁴ ±
1.08 × 10⁻⁵
1.37 × 10⁻⁴ ±
1.59 × 10⁻⁵
1.35 × 10⁻⁴ ±
1.42 × 10⁻⁵
Pb8 × 10-52.38 × 10⁻⁶ ±
9.20 × 10⁻⁷
4.23 × 10⁻⁶ ±
1.62 × 10⁻⁶
1.18 × 10⁻⁶ ±
2.73 × 10⁻⁸
9.34 × 10⁻⁷ ±
3.15 × 10⁻⁸
5.88 × 10⁻⁷ ±
2.44 × 10⁻⁸
Disclaimer/Publisher’s Note: The statements, opinions and data contained in all publications are solely those of the individual author(s) and contributor(s) and not of MDPI and/or the editor(s). MDPI and/or the editor(s) disclaim responsibility for any injury to people or property resulting from any ideas, methods, instructions or products referred to in the content.

