Article

Effective Moisture Evolution since the Last Glacial Maximum Revealed by a Loess Record from the Westerlies-Dominated Ili Basin, NW China

1
State Key Laboratory of Loess and Quaternary Geology, Institute of Earth Environment, Chinese Academy of Sciences, Xi’an 710061, China
2
University of Chinese Academy of Sciences, Beijing 100049, China
3
Institute of Geology and Geophysics, University of Geological Sciences, State Committee of the Republic of Uzbekistan on Geology and Mineral Resources, Tashkent 100041, Uzbekistan
*
Author to whom correspondence should be addressed.
Atmosphere 2022, 13(11), 1931; https://doi.org/10.3390/atmos13111931
Submission received: 1 November 2022 / Revised: 16 November 2022 / Accepted: 17 November 2022 / Published: 19 November 2022
(This article belongs to the Special Issue Quaternary Westerlies and Monsoon Interaction in Asia)

Abstract

:
Moisture variation is extremely relevant for the stability of ecosystems in Central Asia (CA). Therefore, moisture evolution and its potential driving mechanism over the region are always a hot research topic. Although much effort has been devoted to understanding the processes of moisture evolutions in CA during the Quaternary, particularly the Holocene, the associated underlying mechanisms remain in a state of persistent debate. In this study, the granulometry, clay mineral and chroma properties of a loess section (named ZSP section) in the westerlies-dominated Ili Basin, NW China are investigated. With the accelerator mass spectrometry radiocarbon dating (AMS 14C)-based Bayesian age–depth model, we provide a sensitive record of effective moisture evolution since the last glacial maximum (LGM) in the basin, and the results help enhance understanding of the possible driving mechanisms for westerly climate change. Comparisons of clay mineralogy indices shows that the study area is involved in the Northern Hemisphere dust cycle processes as a dust source, and the content of <2 μm grain size fraction in the ZSP section can thereby be used to reflect the westerlies’ intensity. After deducting the complicated influencing factors for lightness changes throughout the section, the calibrated lightness is adopted to indicate the regional effective moisture. Our findings show that effective moisture is relatively abundant during the LGM and the middle–late Holocene, with dry climate conditions during the last deglaciation and early Holocene. We argue that westerlies’ intensity was the main factor for driving the effective moisture evolution in the Ili Basin since the LGM. Local and source evaporation intensity and effective intra-annual control time of the westerlies over the study area exerted a minor influence on the moisture changes.

1. Introduction

The Ili Basin (Figure 1a) is located in the arid and semiarid regions of eastern Central Asia (CA), surrounded to the north, east, and south by the branches of the Tianshan Mountains (Figure 1b). It is highly vulnerable to climate change. The westerlies are the main moisture carrier [1,2,3,4]. Marine and terrestrial moistures carried by the mid-latitude westerlies from remote and local sources [3,5] were uplifted by the Tianshan Mountains to produce orographic rainfall in the basin (Figure 1b). That is essential for maintaining the ecological stability of the Ili Basin.
Many studies on moisture evolution in the Ili Basin and CA have been conducted to date [6,7,8,9]. However, on the one hand, these studies primarily focus on the Holocene or the last thousand years. On the other hand, the following four inconsistent patterns of Holocene moisture evolution were detected: (1) arid climate in the early Holocene, wet climate in the middle Holocene, and relatively dry climate in the late Holocene [7,10,11]; (2) wet early–middle Holocene, and dry late Holocene [12,13,14,15]; (3) a continuous increase in humidity from the early to late Holocene [16,17,18]; (4) wet climate in the early and late Holocene and dry climate in the middle Holocene [19]. Correspondingly, there are two major perspectives on the mechanisms of the above-mentioned moisture evolutions: (1) changes in westerlies’ intensity and its north–south migration, and the intensity of evaporation in the water vapor sources upwind of the westerlies, namely, westerlies’ circulation is primarily responsible for moisture evolution in CA [2]; (2) changes in local evaporation intensity and water vapor saturation threshold caused by local temperature variations, namely, moisture evolution is primarily controlled by local temperature [20,21]. Therefore, further work needs to be carried out to elaborate the uncertainties about the moisture evolution processes and the potential mechanisms.
As mentioned above, the pre-Holocene cold period has received little attention, partly due to a lack of reliable paleoclimatic indices. Although the variation trend of Holocene temperature in CA is still debated, previous studies have shown a persistent warming trend during the Holocene [22,23,24]. Consequently, it is difficult to further characterize moisture evolutions of the glacial period under the conditions of the ongoing warming during the Holocene. The lack of investigating the moisture evolutions over a longer timescale is also not conducive to developing a comprehensive picture of paleoclimate changes and the relevant influencing factors in CA.
The foregoing studies on moisture evolutions in CA are mainly based on indices such as stalagmite oxygen isotopes [12,25], loess magnetic parameters [16,26], grain size and pollen assemblages of lacustrine sediments [9,27,28], biomarkers of peat [29], and the total count fossils (TCF) of terrestrial mollusks [30]. However, whether stalagmite oxygen isotope is a reliable proxy for regional precipitation is a moot point [31,32]. Song et al. (2010) [33] investigated the magnetic properties of the Zhaosu loess in the Ili Basin, demonstrating that the wind velocity/vigor model has dominated the enhancement in magnetic susceptibility for the Ili loess, with only a minor contribution from pedogenesis. Therefore, there is uncertainty about loess magnetic indices to reflect moisture evolution in CA. In addition, according to Chen et al. (2016) and Long et al. (2017) [7,16], the pollen spectrum of lacustrine sediments of Li et al. (2011) [34] may be influenced by depositional environment changes, and thus this pollen assemblage as a reliable regional moisture proxy is still debatable.
Loess deposits are widely distributed in the Ili Basin [35,36], which provide a promising archive for paleoclimate study in CA. Although Chen et al. (2016) [16] have used the lightness (L*) indicator of loess in the Ili Basin to reflect precipitation, the arid climate conditions in CA lead to very weak carbonate leaching of loess, and the higher carbonate content and its dilution effect on other materials in loess probably weaken the sensitive response of L* of loess to paleoclimate changes. A recent study suggested that the CA loess chromaticity index (ΔL*) can be used to reconstruct the history of effective moisture evolution [21]. Loess ΔL*, produced by removal of the noise signals from L*, is mainly a function of organic matter [21] and includes precipitation and temperature signals, which contributes to mirroring actual regional humidity conditions. In this study, based on accelerator mass spectrometry radiocarbon dating (AMS 14C) results, the clay mineral compositions, grain sizes, and chromaticity ΔL* of a loess section from the Ili Basin are employed to investigate the effective moisture evolution since the LGM and the relevant driving mechanisms under different boundary conditions (i.e., remarkable changes in atmospheric temperature, CO2 concentration, and ice sheet volume from the LGM to the Holocene). Our results would provide an important reference to studies on influencing factors for moisture evolution in CA. Accordingly, valuable insights into developing mitigation strategies for sustainable water resource utilization under future climate change are also potentially obtained.

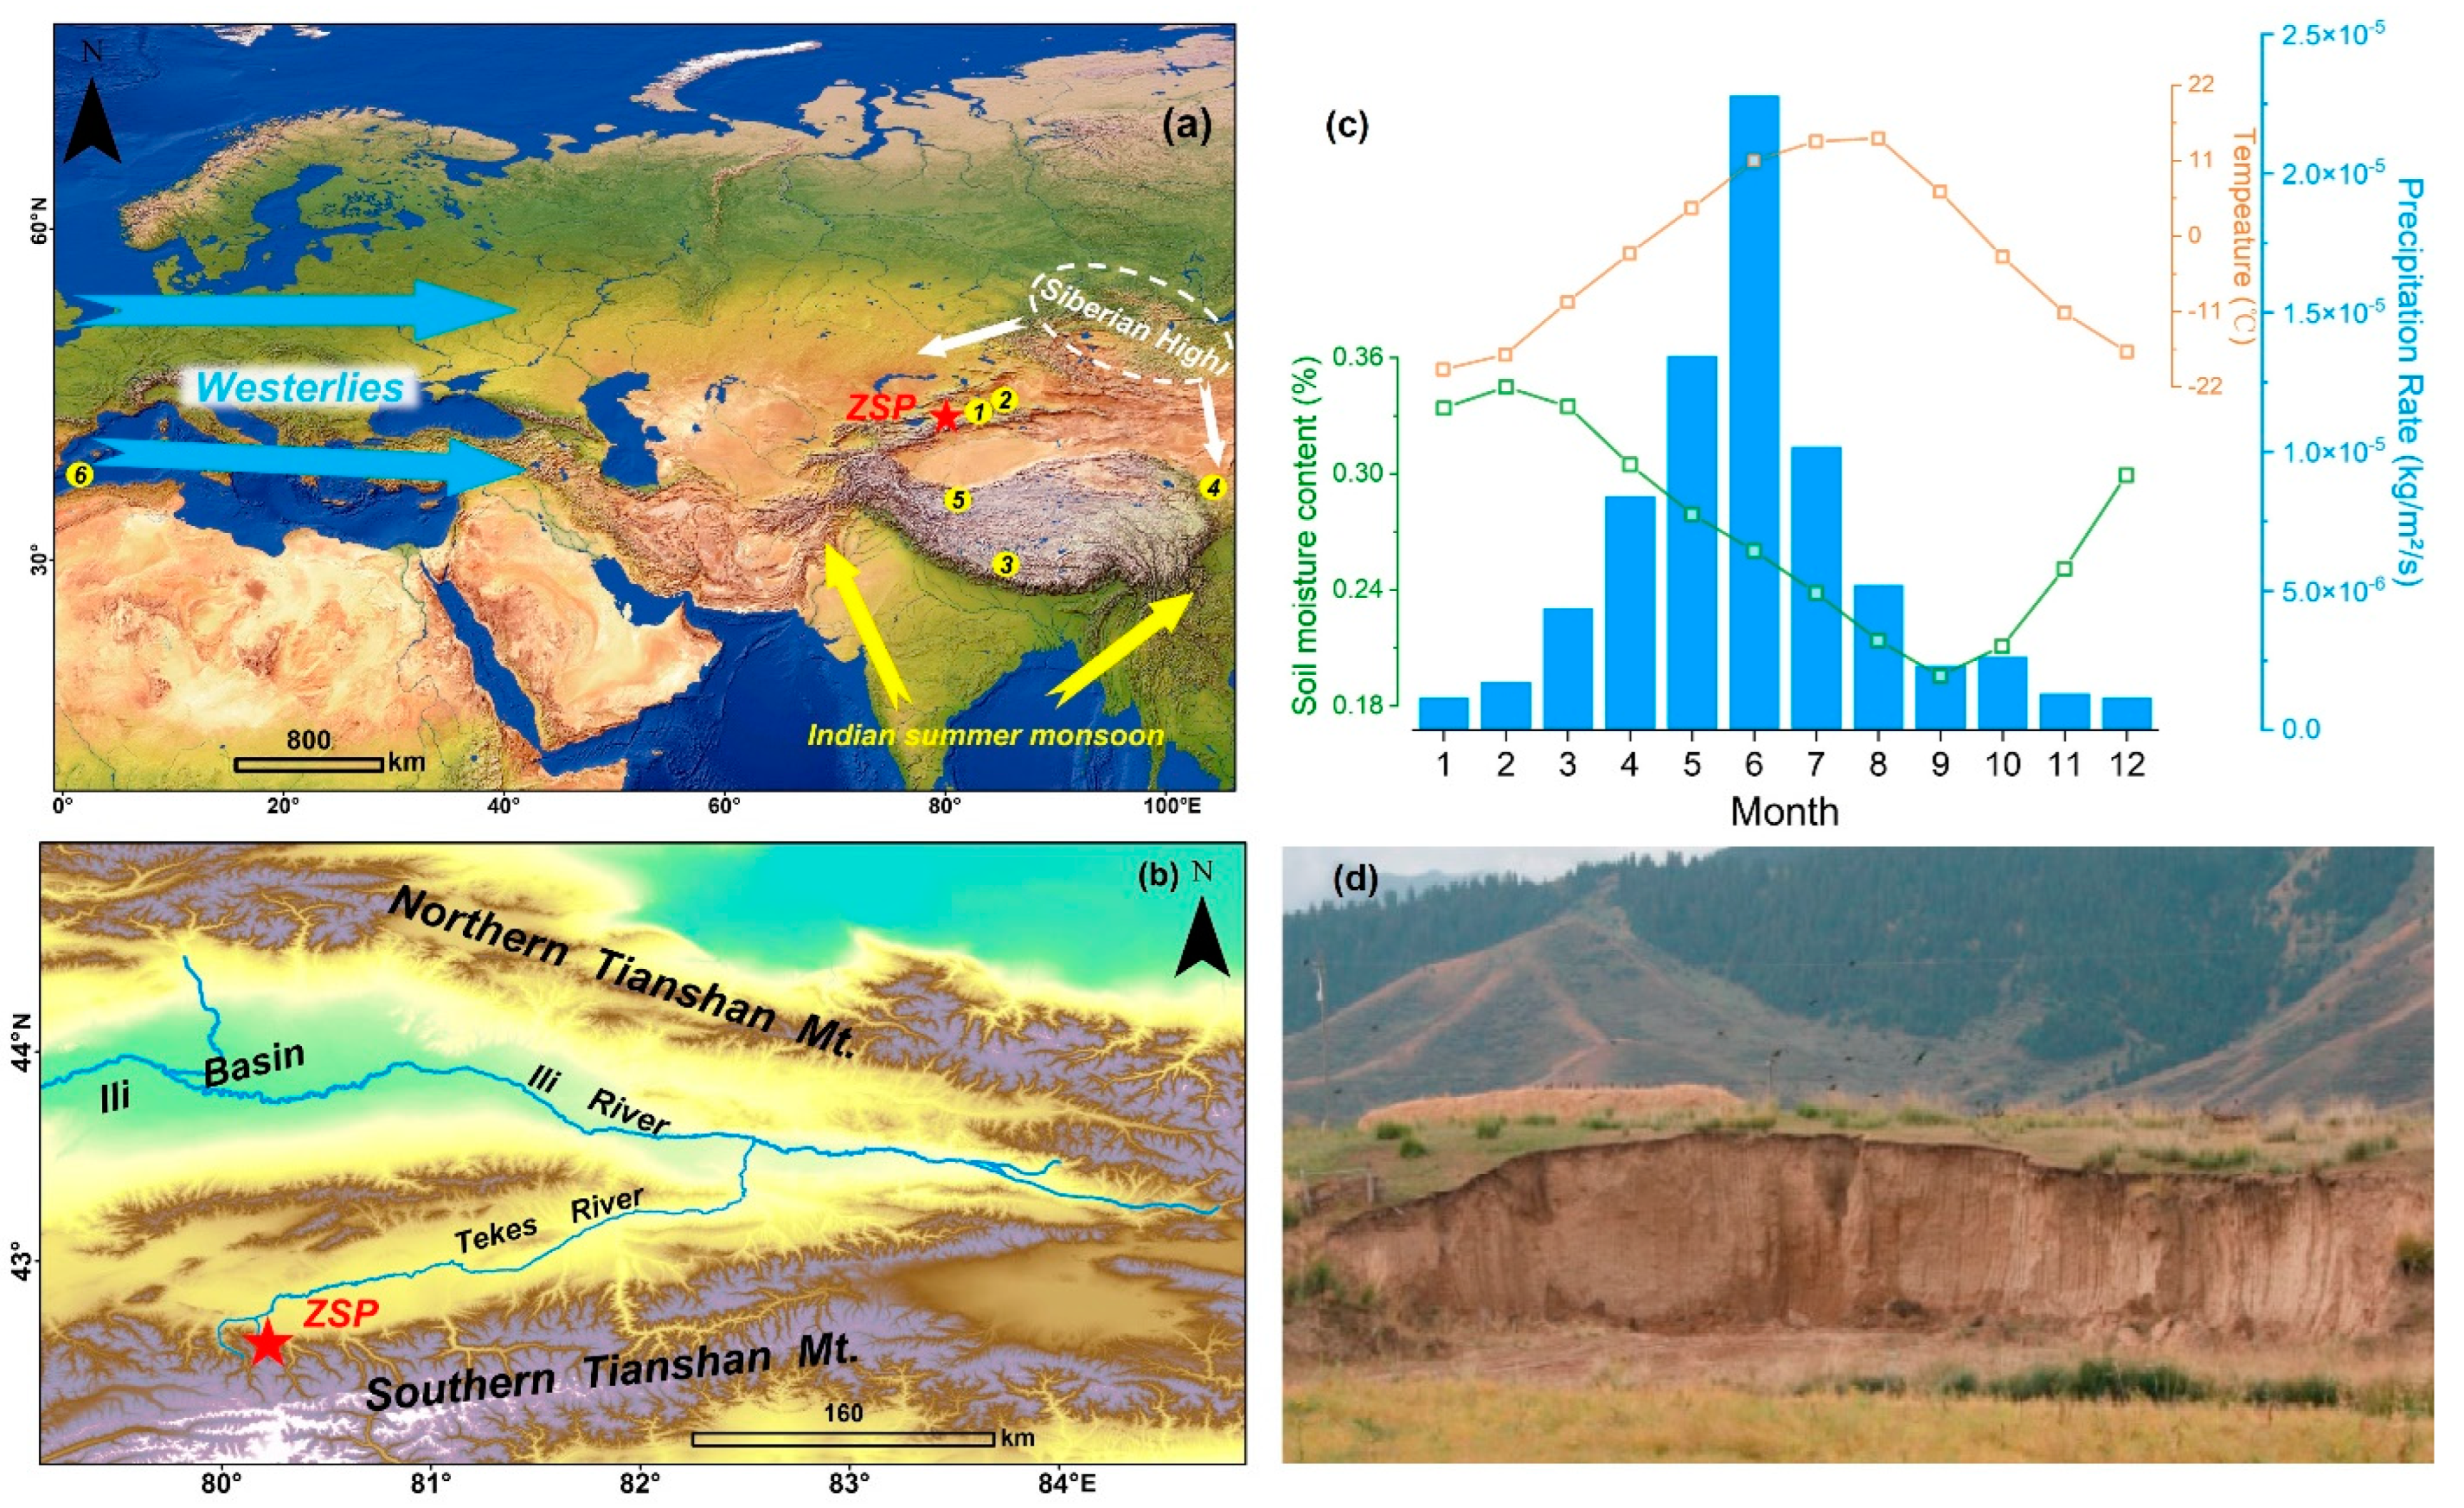
2. Study Area, Materials, and Methods

2.1. Loess Section and Sampling

The Ili Basin is located in NW China, eastern CA, with a temperate continental arid-semiarid climate [37,38,39]. The basin is dominated by the prevailing westerlies, but is frequently affected by polar fronts and Asian winter winds associated with the Siberian High (SH) in winter [40,41]. The mean annual temperature in the Ili Basin ranges from 2.6 to 10.4 °C, with severely cold winter and hot summer. Precipitation in the basin increases with elevation, with 200–500 mm in the low-altitude plains and up to 1000 mm in the high-altitude mountains [35]. Throughout the year, the basin receives significantly more precipitation in May–June than in July–August (Figure 1c). The loess deposits in the basin are mostly found on the foothills of the Tianshan Mountains and the river terraces, with thicknesses ranging from a few meters to more than 200 m [35,36]. The oldest loess stratigraphy can be traced back to 900 ka [42]. Chestnut-calcium, black-calcium, and gray-calcium soils predominate in the Ili Basin [39], and the vegetation types are diverse, ranging from low-elevation desert vegetation to mid- to high-elevation mountain forests, grasslands, and meadow vegetation [43].
Figure 1. (a) Locations of the involved study site with atmosphere circulations. ZSP: Zhaosu poma loess section in the Ili Basin (this study); 1. Xinyuan17 loess section, 2. Lujiaowan loess section, 3. Sagaxi aeolian sediment section, 4. Jingyuan loess section, 5. Guliya ice core, 6. Mediterranean Sea (Core MD95−2043). (b) Topographic map showing the study area and its adjacent region. (c) modern soil moisture, temperature, precipitation rate in the Ili Basin, Hydrometeor data source: http://www.esrl.noaa.gov/psd/data/gridded/ (accessed on 1 October 2022), (Kalnay et al., 1996) [44]. (d) Photographs of the Zhaosu Poma (ZSP) loess section.
Atmosphere 13 01931 g001
This Zhaosupoma section (ZSP, 80.25° E, 42.69° N; 1875 m a.s.l, Figure 1d) used in this study is located on the second terrace of Tekes River in the southern Ili Basin [45]. This section has a thickness of 6.9 m, and can be subdivided into five pedostratigraphic units: S0, L1L1, L1S1, L1L2 and S1, which “S” represents paleosol and “L” represents loess (our stratigraphic division based on fieldwork and grain-size parameters; refer to song et al. (2018) [39] for details about the grain-size parameters). After removing dry, weathered sediments from the surface of the ZSP section, samples were taken at 5 cm intervals for laboratory tests. We focused on effective moisture evolution and possible driving mechanisms since the LGM with significant changes in temperature, CO2 concentration, and the ice sheet. Therefore, we collected samples from the upper part (0–3.65 m, since 25.974 ka) of the ZSP section based on the newly established Bayesian age–depth model.

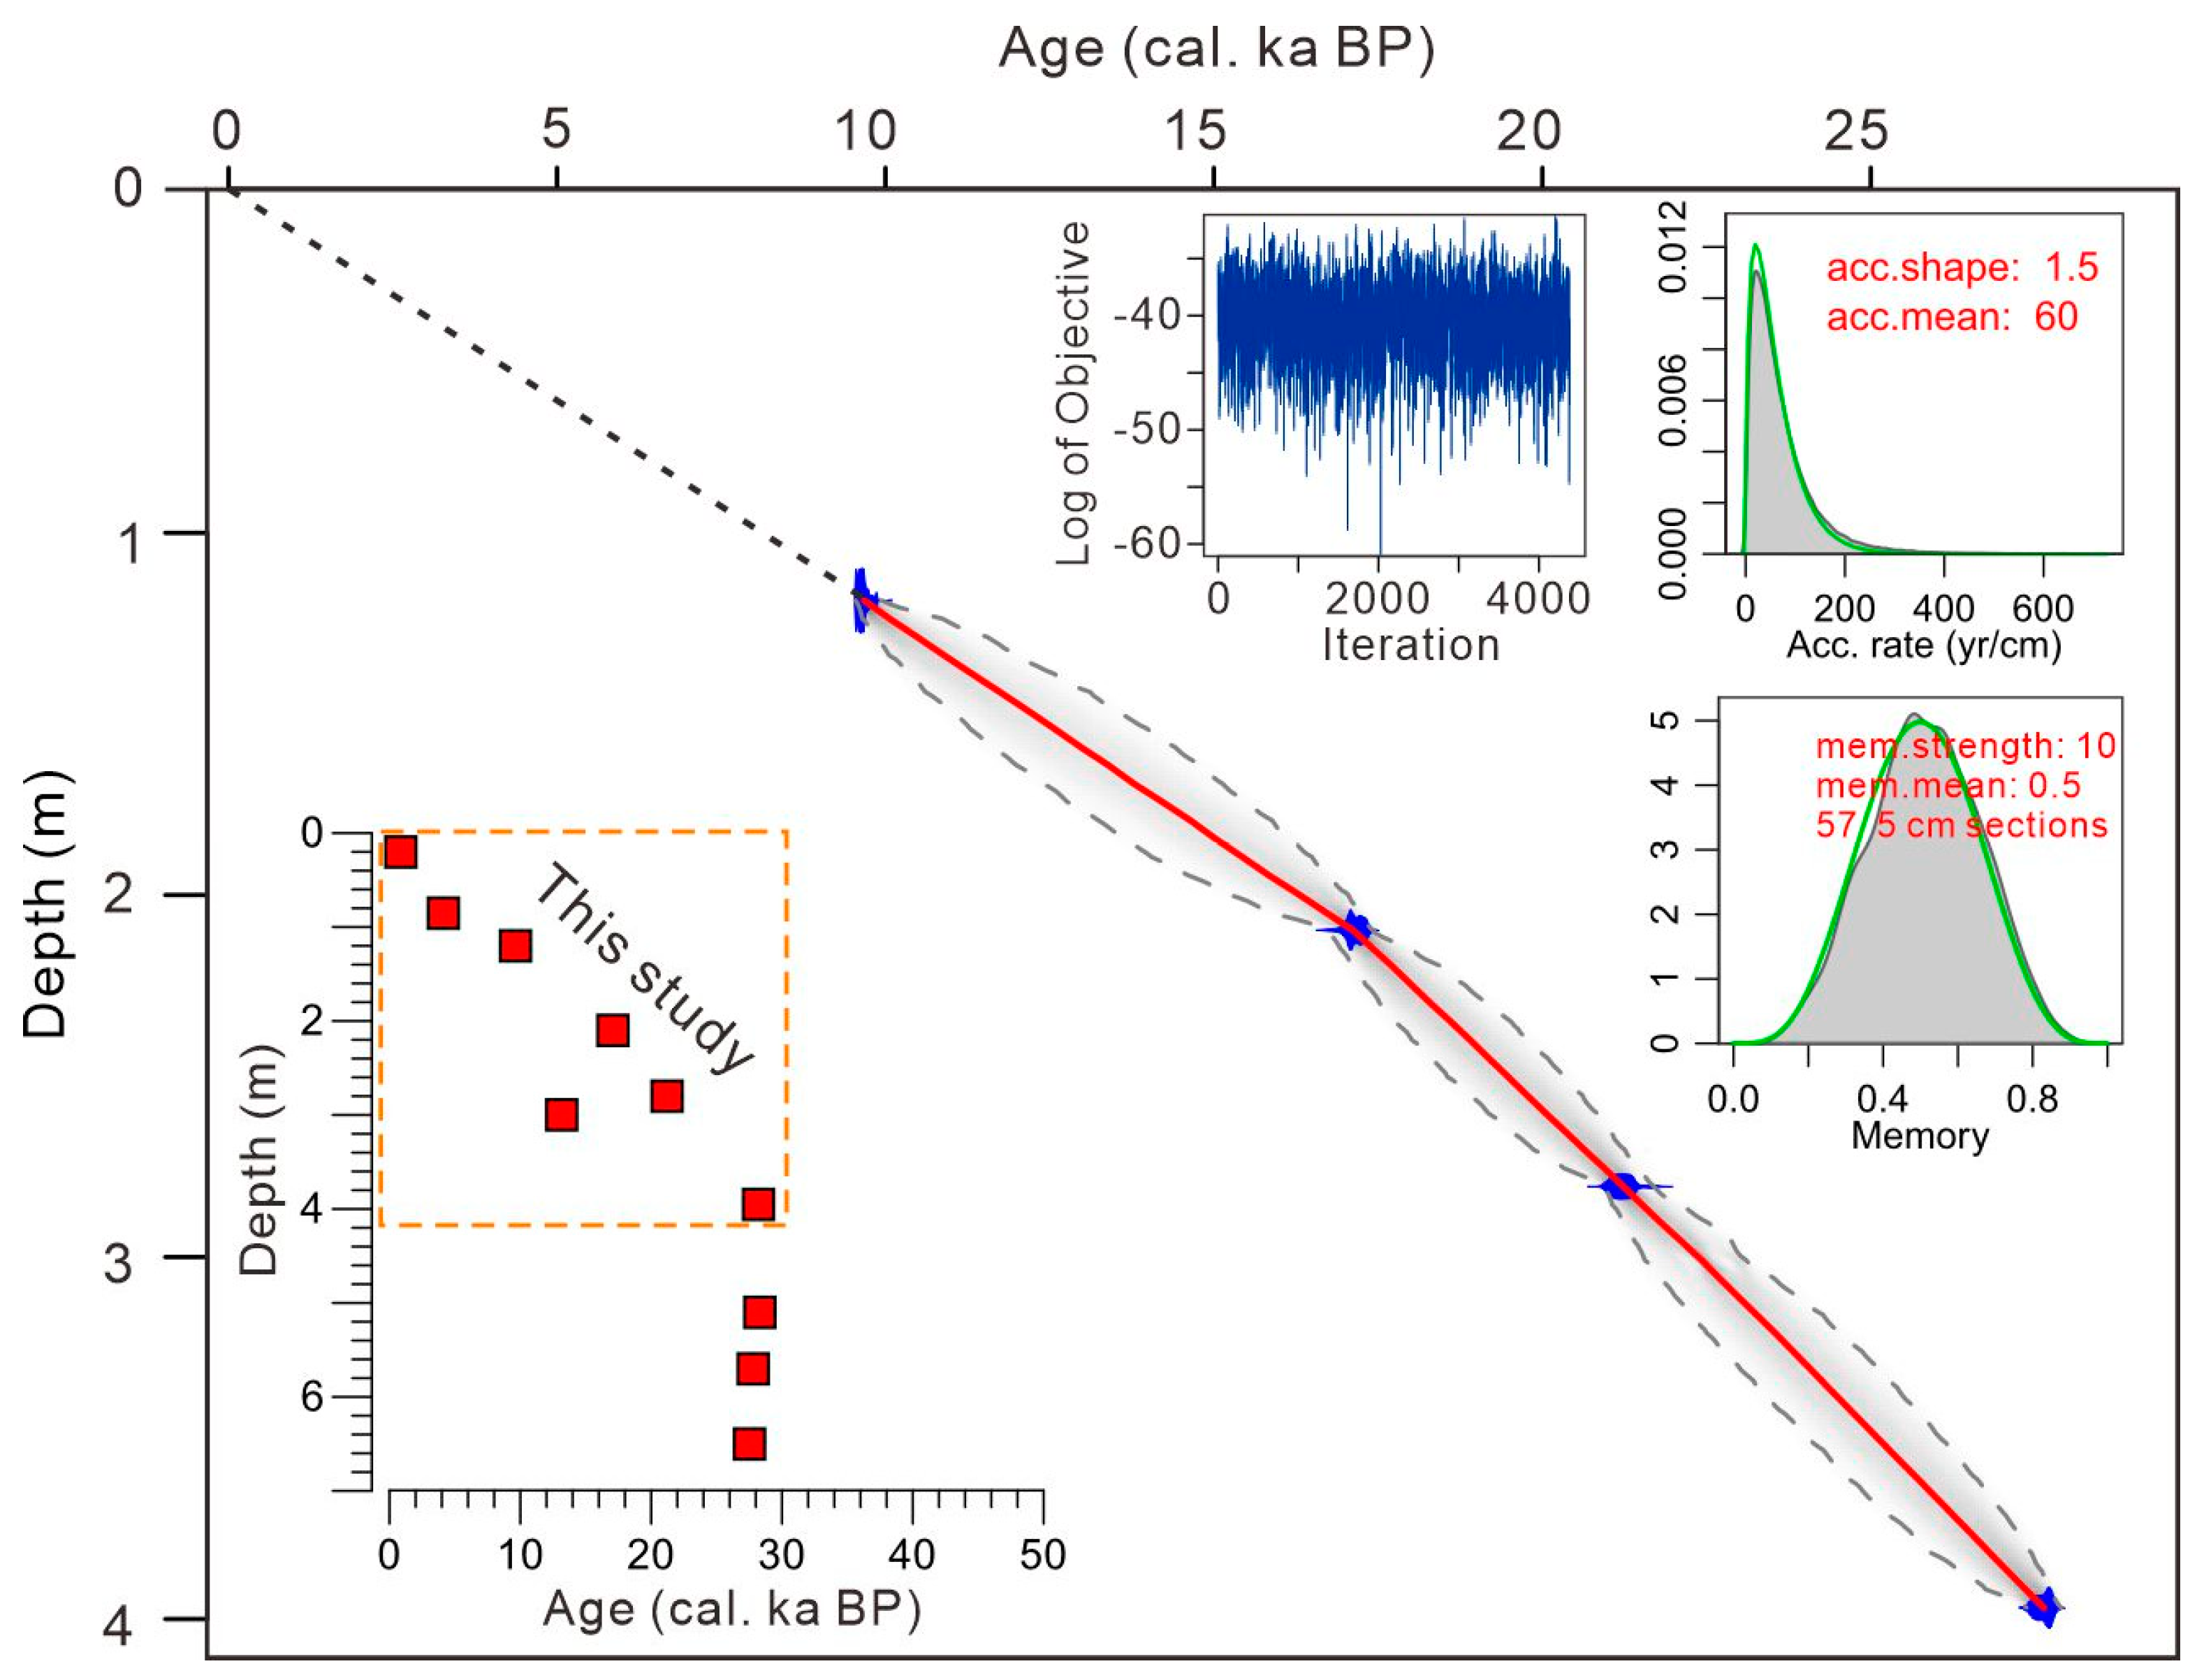
2.2. Age–Depth Models

Based on optically stimulated luminescence (OSL) and AMS 14C ages (<25 cal. kyr BP) [45,46], Song et al. (2018) [39] used a grain-size age model [47] to establish chronological sequence of the ZSP section [48]. However, since variations in the loess sedimentation rate in the Ili Basin are generally inconsistent with the grain-size variations [49], it should be improved. Thus, in the present study, the age–depth model was determined using the Bayesian method. Unfortunately, there is a lack of OSL dating results since the LGM [46]. Hence, the Bayesian age model [50] was established using AMS 14C dates [45].
A Bayesian method was used to analyze the correspondence between stratigraphic relationships and dating information [51]. The Bayesian age model for the ZSP section was constructed using the Bacon 2.2 program [50]. The radiocarbon dates were calibrated using IntCal20 [52] incorporated in the Bacon code (cc = 1). Prior information was constrained, including the gamma distribution for the accumulation rate, the beta distribution for the accumulation memory, and the section thickness, which dictate to some degree the flexibility of the age–depth model. We used the default values: accumulation (acc.) shape = 1.5 for the gamma distribution; memory (mem.) mean = 0.7 and mem.strength = 4 for the beta distribution. The mean accumulation time was set to 60 y cm−1 for the ZSP section, which was calculated by dividing the age by the considered thickness (Figure 2). To produce narrower uncertainty bounds and smoother changes in accumulation rate, we used thick = 5 (Figure 2), implying 5 cm-resolution thin sections being sampled from the ZSP section for the subsequent estimation of the accumulation rate based on millions of Markov Chain Monte Carlo (MCMC) iterations. The final Bayesian age–depth model is represented by the weighted mean modelled ages.

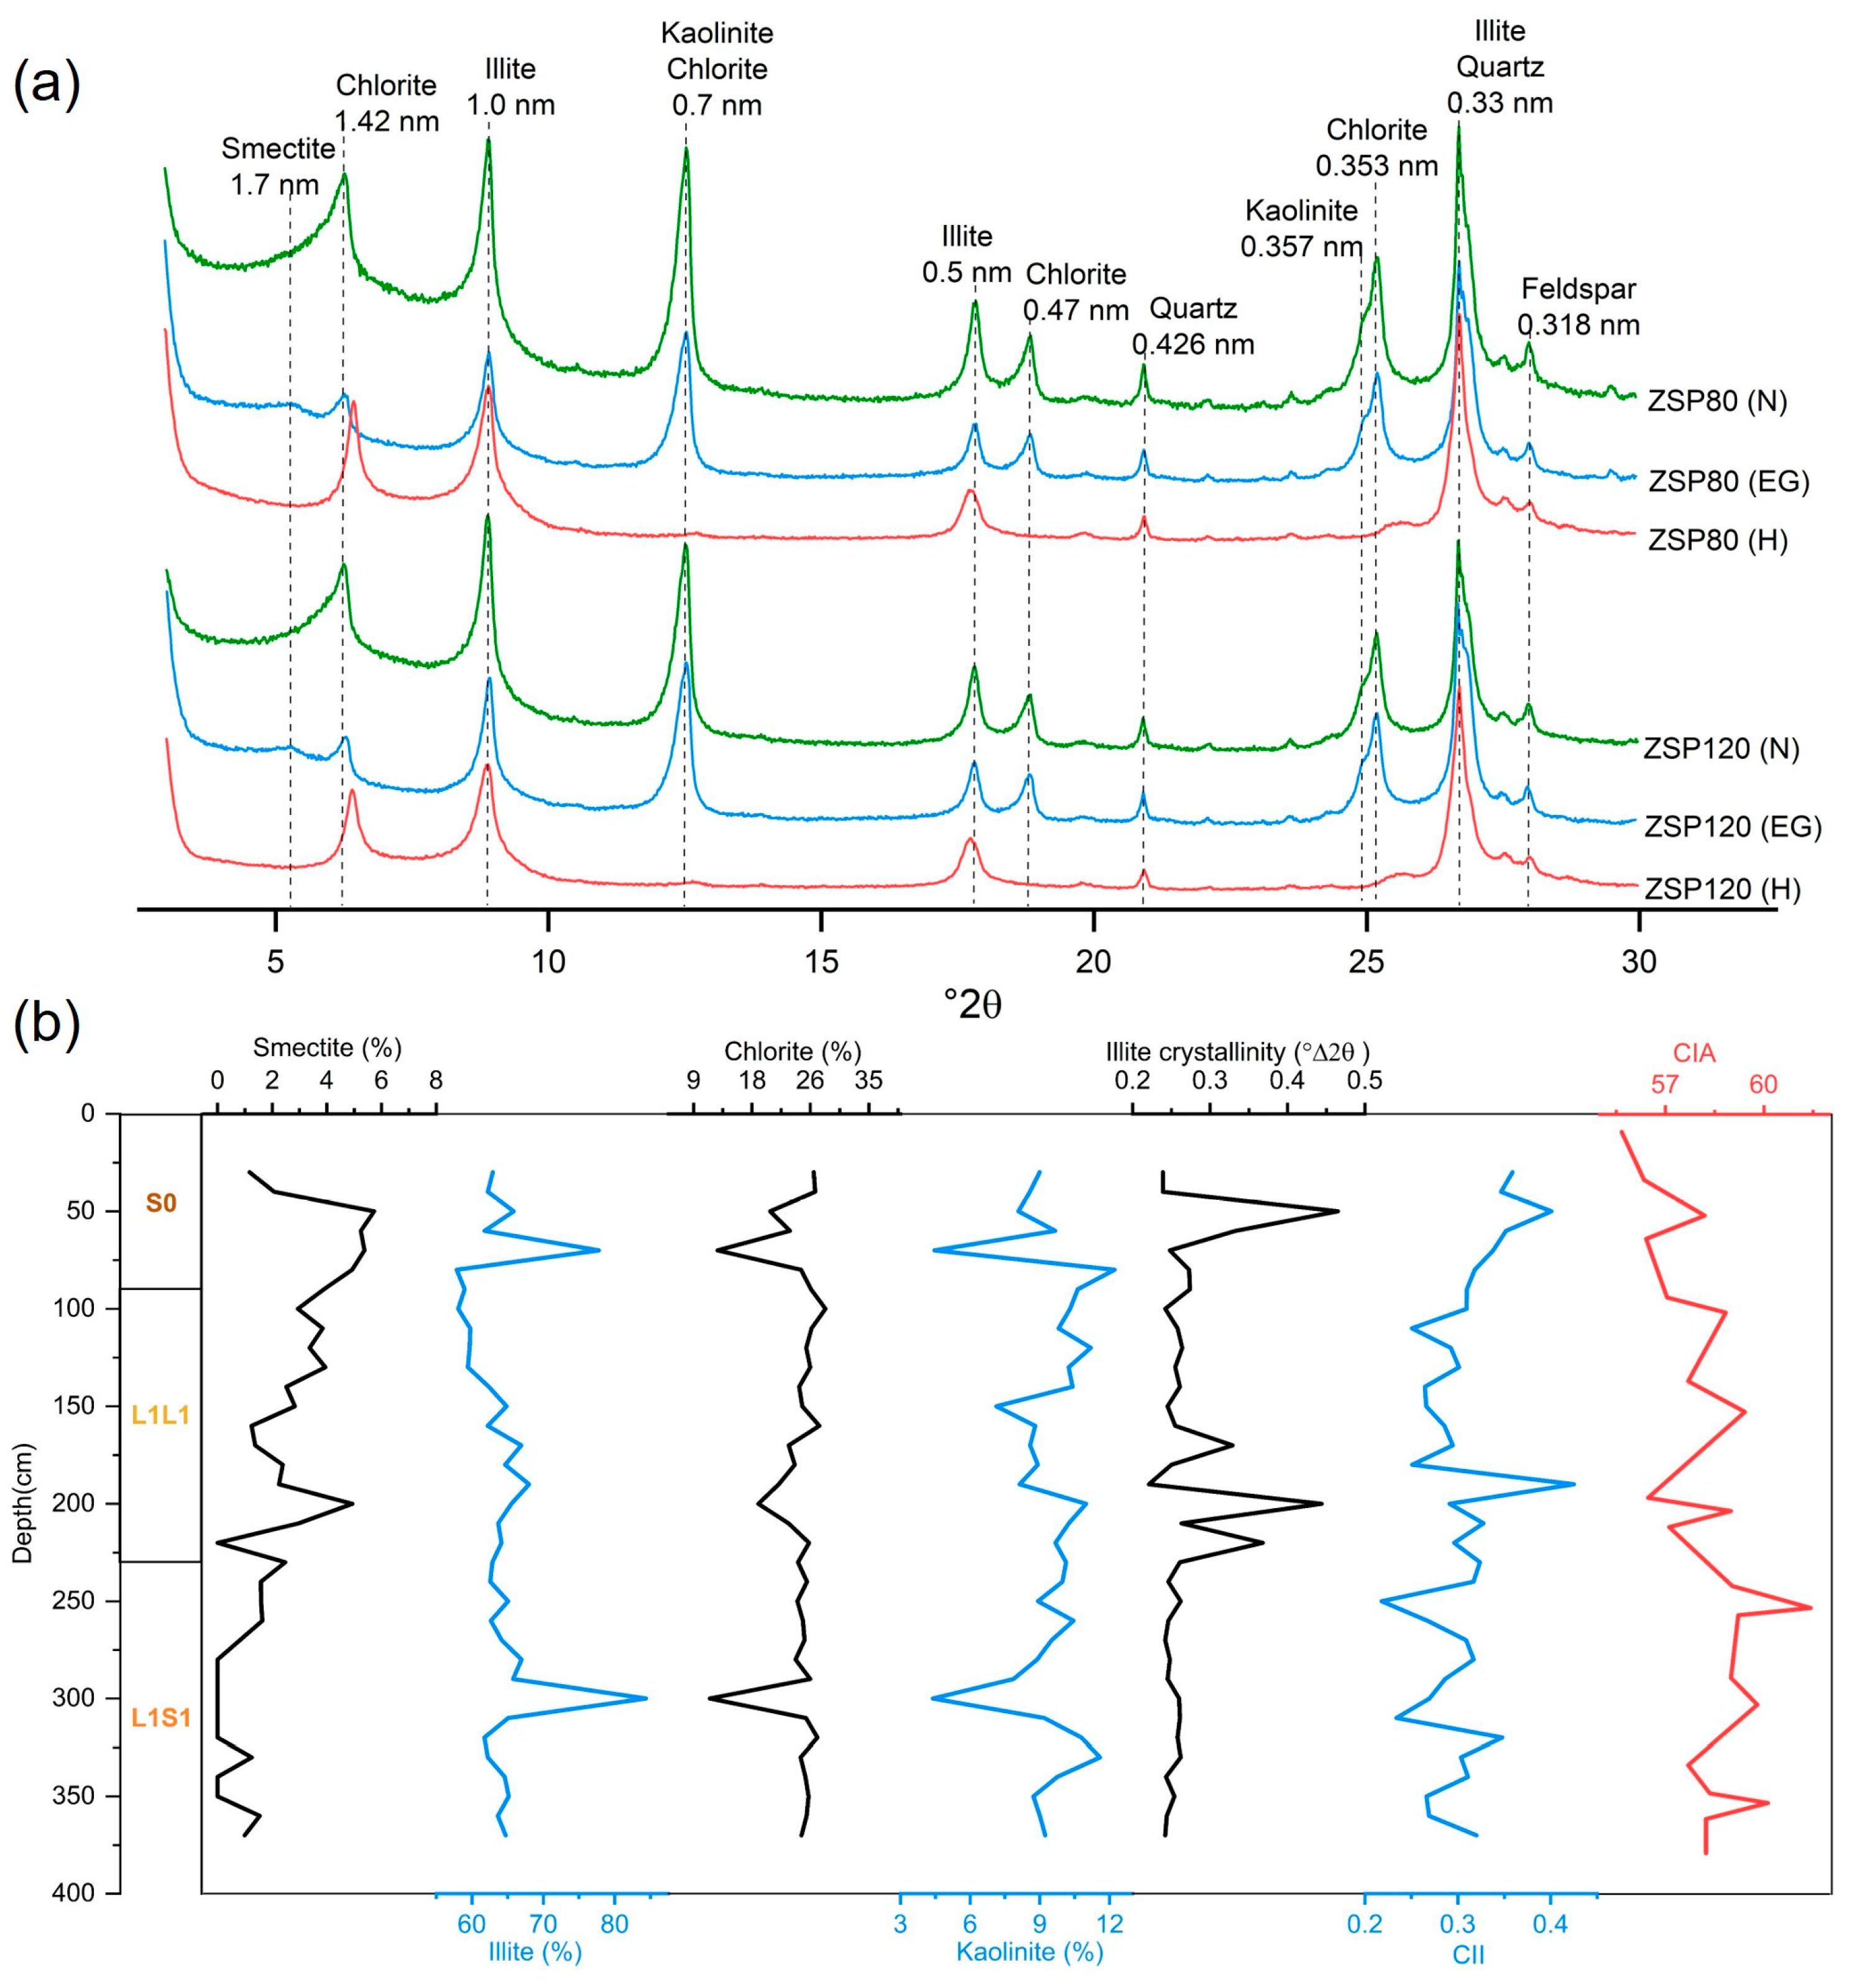
2.3. Clay Mineral Preparation Testing and Analysis

Bulk samples were pretreated for clay mineralogy analyses following Liu et al. (2005) [53]. A dried sample of ~20 g was put in a glass beaker, and then deionized water was added to disperse the samples. Subsequently, 30% hydrogen peroxide (H2O2) was added to the beakers to remove the organic matter, and then 10% dilute hydrochloric acid (HCl) to remove the carbonates. Deflocculation of clay was completed by repeatedly washing with deionized water. Finally, the <2 μm fraction was extracted from the suspension after a settling time calculated according to Stoke’s law, and then concentrated further by centrifugation. The centrifuged clay mixture was placed on a glass slide and dried overnight at room temperature. Three types of slices were prepared for each sample: (1) naturally (N) air-dried oriented slice, (2) ethylene glycol-saturated (EG) slice after saturating in glycol vapor for 24 h, and (3) heated (H) slice heating at 490 °C for 2 h.
The X-ray diffraction (XRD) patterns of clay mineral samples were measured using a PANalytical X’Pert Pro MPD diffractometer with CuKα radiation and a Ni filter, operating at 40 kV, 40 mA, at the Institute of Earth Environment, CAS. The test was carried out in the continuous scanning mode, with a scan range of 3–30° (2θ), a scanning step of 0.016711°/step, and a scanning speed of 0.07111 s/step. Qualitative analysis of clay mineral was based on a comparison of XRD patterns of N, EG, and H slices [54]. The peak areas of specific reflections in the EG runs were used to conduct semi-quantitative estimations of clay mineral compositions. The integrated peak areas were calculated by the MacDiff 4.2.5 software. The proportion of each clay mineral was calculated using Biscaye’s (1965) [55] empirical coefficients, with relative abundances of each clay mineral normalized to 100%.

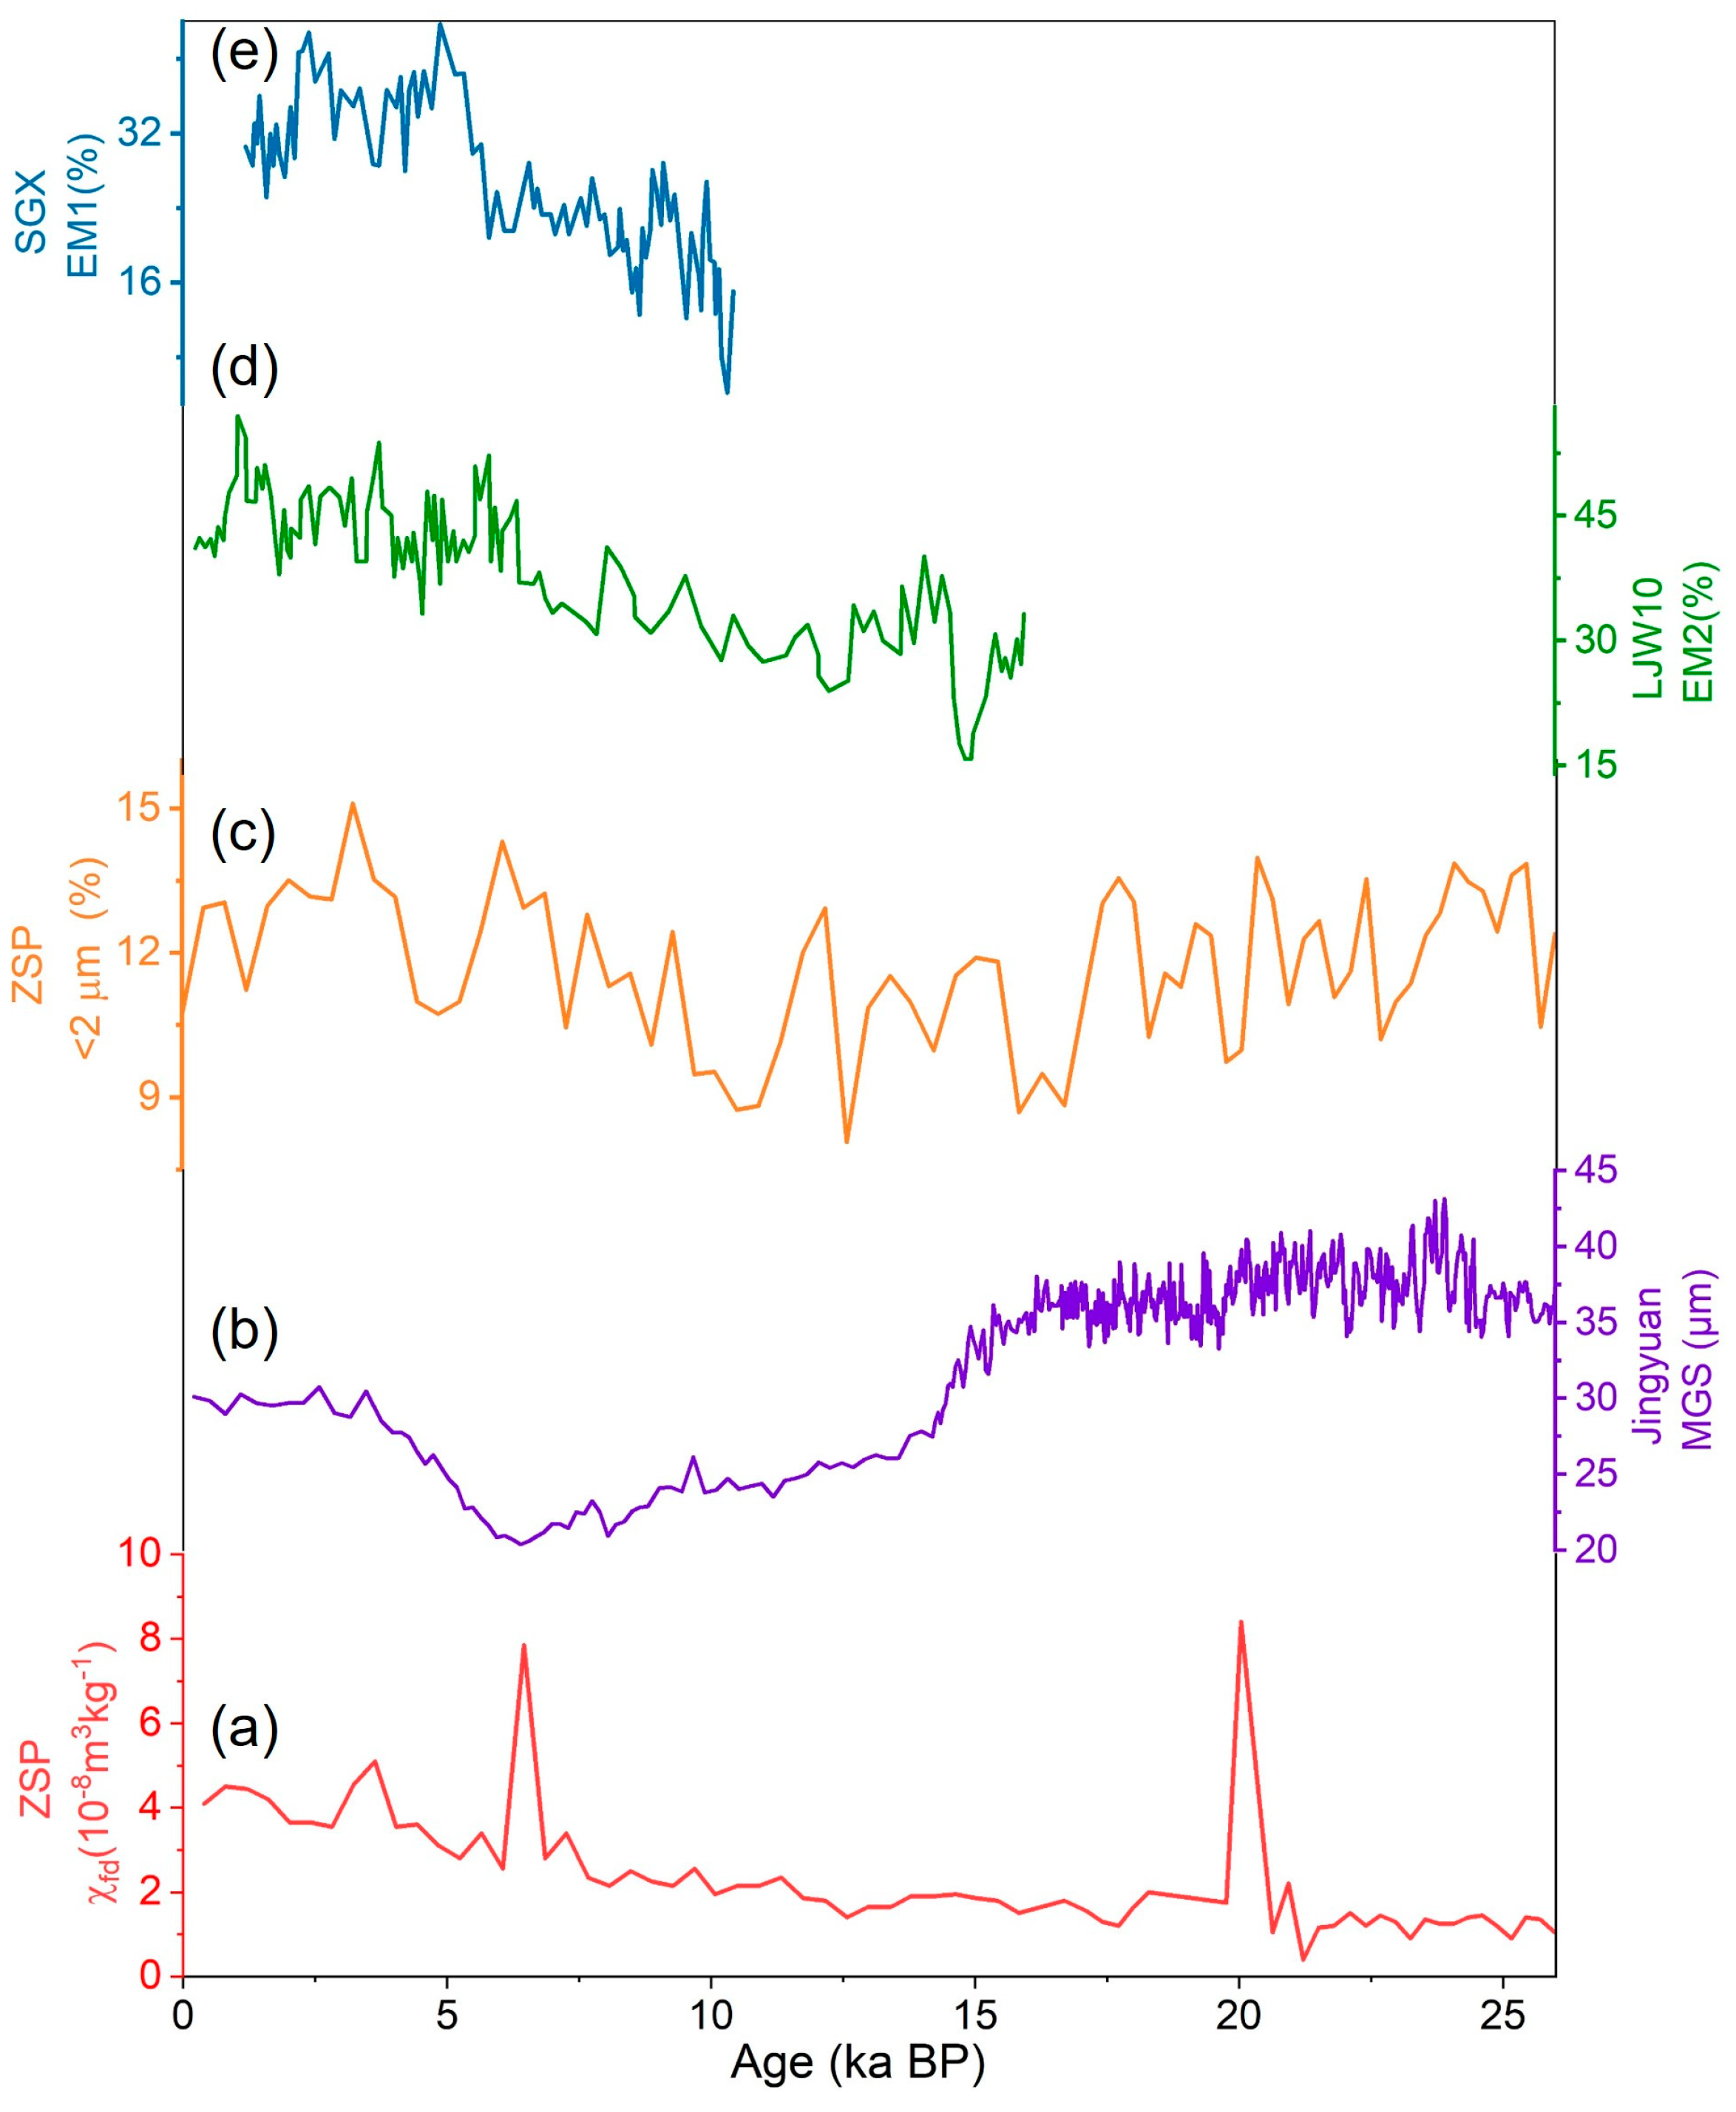
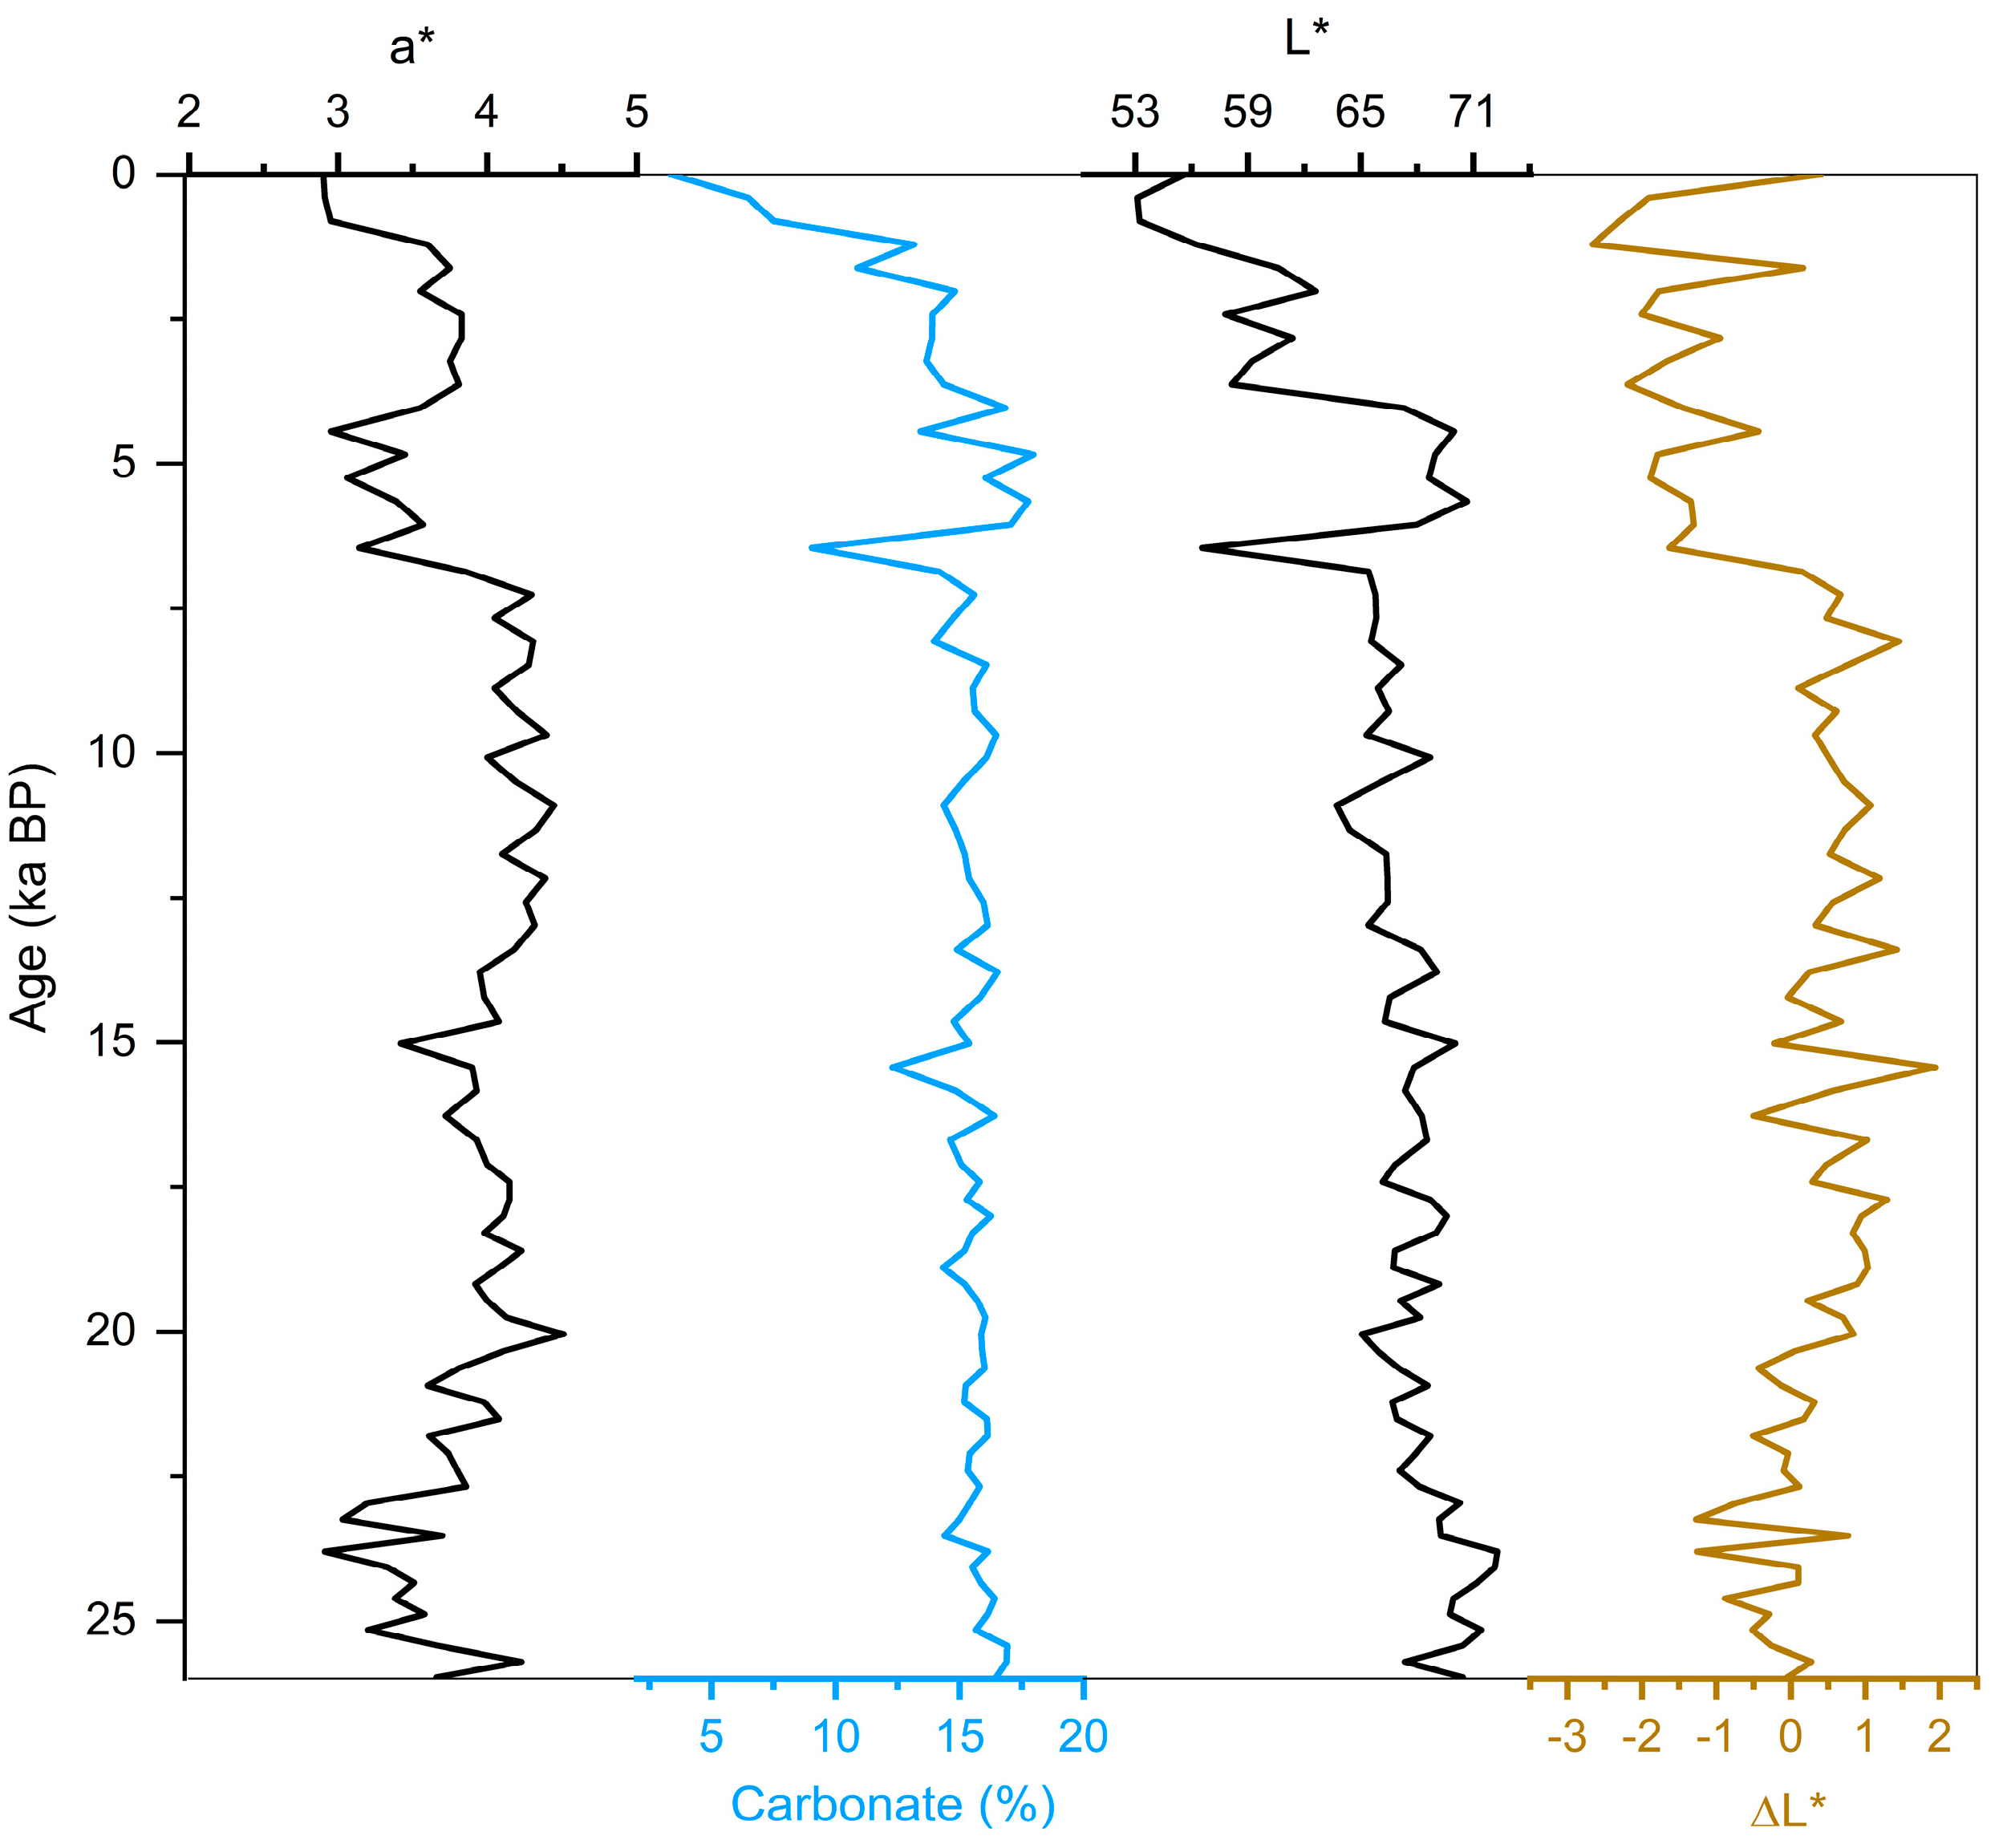
3. Results and Discussion

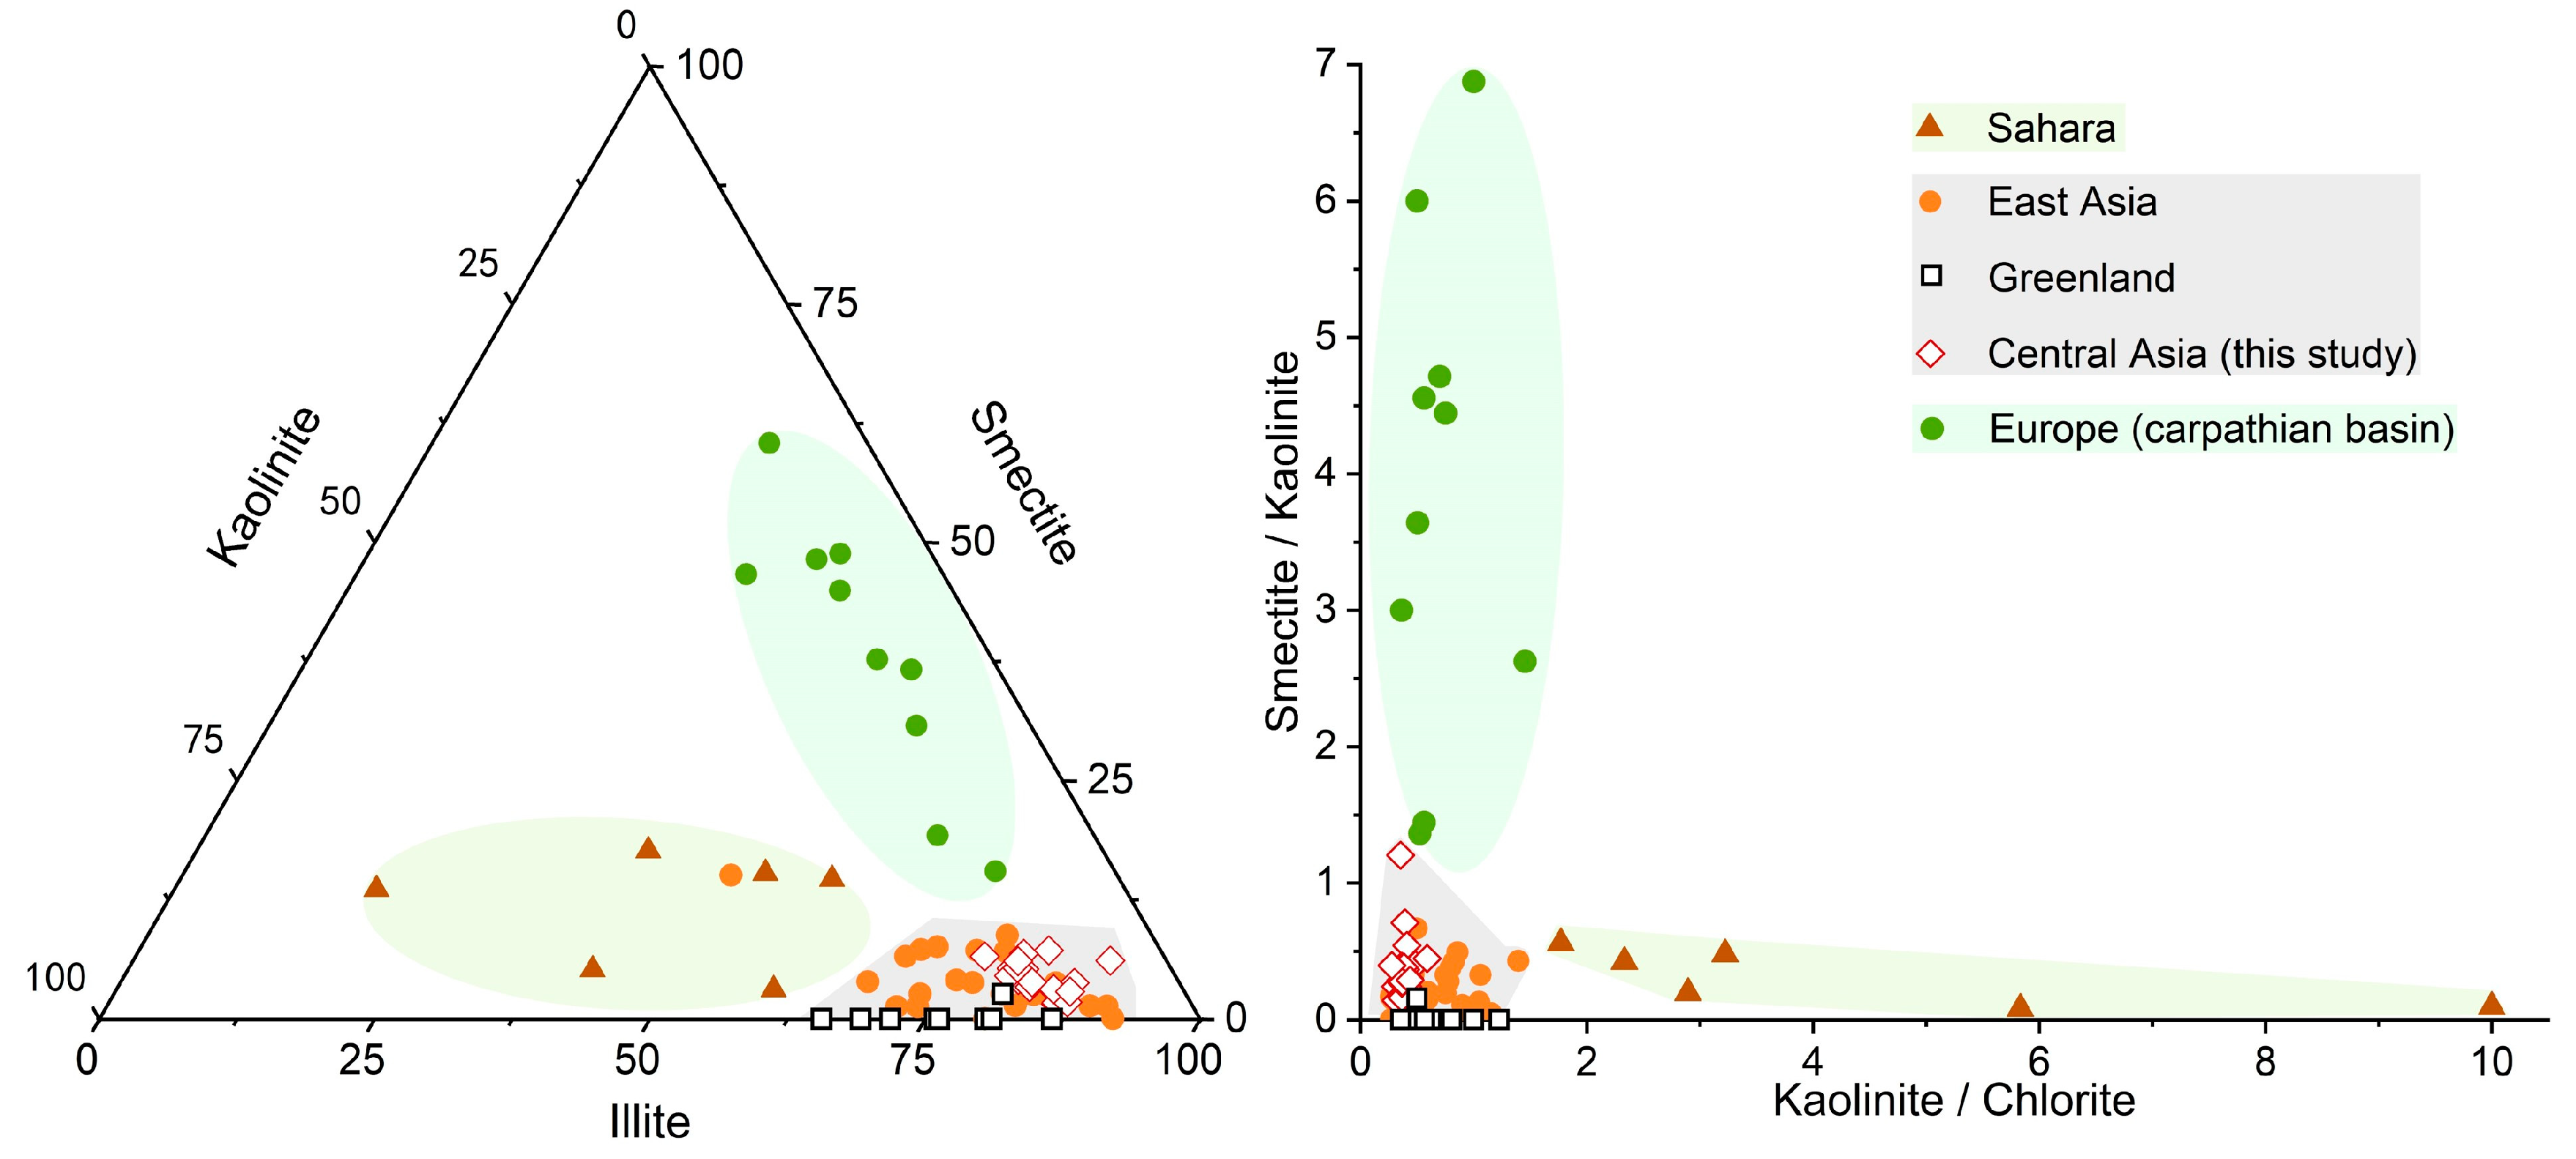
3.1. Origin and Significance of Clay Minerals

Illite, chlorite, smectite, and kaolinite dominated the clay mineral assemblage in the ZSP section (Figure 3a). Semi-quantitative estimations of clay minerals showed that illite (58–84%, average 64%) and chlorite (11–29%, average 24%) dominated the clay mineral assemblages, while smectite (0–6%, average 2%) and kaolinite (4–12%, average 9%) were less abundant (Figure 3b) (see Table S1). The relative contents of chlorite and kaolinite in the entire section showed no significant variation, except for their decreased contents in S0 and L1S1 units. The smectite content increased significantly in the middle and lower parts of the S0 unit, and the lower parts of L1L1 unit, but with a gradual decrease in content from the middle part of the S0 unit to the lower parts of the L1S1 unit. The relative content of illite gradually increased from S0 to the middle part of L1L1, and then slightly decreased downward. Except for a significant increase in the middle of L1S1, the relative content of illite showed no discernible variation trend (Figure 3b). Illite crystallinity (IC) ranged from 0.22 to 0.47, with an average value of 0.27 with high values in the lower part of S0 and L1L1 units. The chemical index of illite (CII) ranged from 0.22–0.42, with an average value of 0.3, and it increased significantly in the middle and lower parts of the S0 unit and the lower parts of the L1L1 unit (Figure 3b).
Terrestrial clay minerals are primarily authigenic and detrital in nature [56,57,58,59]. In general, clay mineral compositions in sediments are affected by the material composition of the parent rock, weathering pedogenesis, and post-burial diagenesis [60]. Loess is Quaternary loose aeolian sediment. Thus, the influence of diagenesis on clay mineral assemblages is thought to be limited. Therefore, the following discussions are primarily concerned with the composition of the parent rock and weathering pedogenesis, accompanied by an assessment of the paleoclimatic significance of the clay minerals.
The clay mineral assemblages in the ZSP section were dominated by illite (Figure 3b). The IC and CII are reliable indices of chemical weathering [61,62,63]. The IC of <0.4 indicates excellent illite crystallinity, subjected to less weathering decomposition. Physical weathering results in the formation of Fe/Mg-rich illite with a CII value of <0.5 [63,64]. The average IC value of the ZSP section is 0.2714, and the average CII is 0.304 (Figure 3b), indicating that post-depositional chemical weathering does not heavily alter the original mineral structure of Illite, and that the illite is of detrital origin. The CII values reveal biotite-like Fe/Mg-rich characteristics of the illite, implying its formation by the physical weathering of biotite-rich rocks rather than pedogenesis.
According to previous reports on the lithology of the West Tianshan orogenic belt [65,66], the West Tianshan in the west of the Ili Basin contains many Paleozoic granites and a few Mesozoic Permian gneisses, which would produce illite-rich detritus by denudation during physical weathering. These detrital sediments were initially transported by meltwater or rainwater to the loess source areas on the piedmonts [67,68,69], and subsequently transported by westerlies and deposited in the study area. Furthermore, the broken and rounded outline of the Illite from the NLK section of the Ili Basin was clearly observed in the scanning electron microscopy (SEM) images, possibly indicating illite in the Ili loess has a detrital, not a pedogenic, origin [68].
Chlorite accounts for relatively lower proportions than illite (Figure 3b). Chlorite is formed primarily in sedimentary rocks buried in deep metamorphic environments, highly susceptible to physical and chemical weathering on the surface, and absent in well-developed mild and moist soils [60,70]. Based on the relatively high chlorite content and no obvious trend in the change in the S0, L1L1, and L1S1 units (Figure 3b), we believe that the chlorite is a product of physical weathering, originating from the denudation of parent rocks in dry and cold environments. We also calculated the chlorite ratio (Al-chlorite/Fe-chlorite) as an index to measure the degree of weathering for the chlorite according to Peng et al. (2014) [71]. A higher chlorite ratio indicates more depleted Fe-chlorite and more enriched Al-chlorite resulting from stronger chemical weathering. The average chlorite ratio of the ZSP section was only 0.228 and had no significant change, indicating that post-depositional chemical weathering can be ignored.
The proportion of smectite was much lower (Figure 3b). Chemical weathering can easily convert volcanic clastic materials into smectite [56,72], which is always associated with tuff in sedimentary sequences [73]. In this study, a volcanic ash layer was not observed in the ZSP section, which excludes the generation of smectite by the weathering of pyroclastic material. In the temperate zone, smectite is also usually converted from primary illite and chlorite through hydrolysis and denudation during pedogenesis [60]. However, there was no significant chemical weathering of illite and chlorite as suggested above, indicating an absence of the transformation process in the loess deposition areas. However, this process cannot be ruled out in loess source areas, which may be related to the paleo-hydrological conditions of the areas. Smectite is often transported in the form of aggregates due to the high hygroscopic property [74]. Therefore, the larger aggregates are most likely to be transported to this study area by the stronger winds. Against this background, it is observed that the increased smectite contents have a counterpart to the increased grain sizes that are regarded as an indicator of wind intensity [48]. In conclusion, smectite was more likely formed by the transformation of biotite and illite in the source area; however, its role as an indicator of environmental conditions might also be limited due to its complex behaviors during emission, transport, and deposition.
Kaolinite is typically formed by chemical weathering in highly eluvial environments with abundant tropical vegetation [56,75]. Therefore, it is accepted that kaolinite from the ZSP section in the arid–semiarid region is not authigenic by weathering, but the result of physical weathering and denudation of clastic kaolinite in Tianshan Mountain.
In addition, the lower CIA (chemical index of alteration) value of the ZSP section indicates weak weathering [35]. That implies that the clay minerals have undergone extremely weak chemical weathering (Figure 3b). Overall, it is concluded that the clay minerals are of detrital origin, with limited impact from chemical weathering. In this context, the clay minerals have the potential to be used as proxies for tracking dust emission in CA and its transport on a hemisphere scale.
Fine-grained dust can be transported to Greenland by westerly circulations from the potential sources in the Northern Hemisphere [76]. Therefore, there are similarities in “fingerprints” (such as mineralogical indices) between sediments from potential source areas and Greenland ice core dust [77,78]. We collected clay mineral data from major dust potential source areas in the Northern Hemisphere and Greenland ice core. Comparisons of the clay mineral data [60] (including those from the ZSP section) show that the data points of the Greenland ice core and the East and Central Asian dust source areas are distributed in the same areas (Figure 4). Notably, previous studies have shown that although the source of loess in the Ili Basin is mainly local, about ~9% of them come from far sources [67,68,79]. Thus, far-sourced fine-particle fractions can be transported to the study area via the westerlies and then be settled via wet deposition. Siberia High intensity does not dominate fine-particle transport (Figure 5b,c) which, to a great extent, weakens the bond between near-surface wind regimes and the transport of the fine fraction in the ZSP loess. Therefore, Greenland ice core dust is also derived from CA region, from which fine particles are transported to Greenland through the upper-level westerly circulations.

3.2. Paleoclimatic Significance of <2 μm Grain Size Fraction

The fine component of loess is usually transported by wind in long-term suspension. Hence, this component potentially indicates variation in the westerlies’ intensity [89]. As discussed in Section 3.1, dust from the study area can be transported to Greenland via the Northern Hemisphere westerlies. Therefore, the content of <2 μm grain size fraction in the ZSP section could be used as an indicator of variations in the westerlies. To further clarify implication of the <2 μm fraction in the ZSP loess, we compared its content with the EM2 content of the LJW10 loess section in the northern Tianshan Mountains, NW China, and the EM1 content of the SGX section in the southern Tibetan Plateau, which are regarded as reflecting the intensity of the westerlies [90,91] (Figure 1a,b). It was found that these proxy records show generally consistent variation trends (Figure 5), indicating that the contents of <2 μm fractions can effectively reveal changes in the westerlies’ intensity. The higher (lower) the content of <2 μm fraction, the stronger (weaker) the westerlies’ intensity.
However, previous studies have also indicated that grain size variation in a loess section may result from pedogenesis [92,93,94,95]. The frequency-dependent magnetic susceptibility (χfd) indicates the concentration of superfine magnetic particles (magnetite, <~0.1 μm, maghemite, <~20 μm) considered to form in situ within soils during pedogenesis [96,97]. We thereby applied χfd to examine the intensity of pedogenesis. The χfd values downward in the section were low with extremely small fluctuation amplitudes (Figure 5). At the same time, the contents of <2 μm fraction and the χfd values did not show coherent variations (Figure 5). Therefore, pedogenesis is too weak to be responsible for the remarkable particle size variation. On the flip side, the CIA is considered as an available and reliable weathering index. The CIA values of 50–65 indicate weak weathering under cold and dry climatic conditions while values of 85–100 represent strong chemical weathering under hot–humid conditions. The CIA values of the ZSP loess samples ranged from 52 to 62, with an average of 56.7 [35] (Figure 3b), indicating that the section has undergone weak chemical weathering. A significant difference in the intensity of chemical weathering was not also distinguished between loess and paleosols. In summary, we suppose that the content of <2 μm grain size fraction provides a robust proxy for the intensity of the westerlies.
Figure 5. Comparison of the <2 μm content of the ZSP section [35] (c), the EM2 (11 μm) content of the LJW10 section in the northern Tianshan Mountains [90] (d), the EM1 (8.1 μm) content of the SGX section in the southern Tibetan Plateau [91] (e), mean grain sizes (MGS) of Jingyuan loess in the western Chinese Loess Plateau [98] (b) and the χfd of the ZSP loess [33] (a).
Atmosphere 13 01931 g005

3.3. The ΔL* of the ZSP Section and Its Paleoclimatic Significance

Color is the most distinct feature in the loess–paleosol sequence, which makes chroma the potential proxy to indicate paleoenvironmental and paleoclimate variations [99]. Sun et al. (2011) [100] used soil color in combination with magnetic susceptibility to reveal the characteristics of the Asia summer monsoon; Sun et al. (2020) [101] suggested that redness (a*) and yellowness (b*) in the loess section are related to concentrations of hematite (Hm) and goethite (Gt), and the Hm/Gt ratios can be applied to reveal the evolution of dry/humid conditions in CA loess. This section shows an obvious color differentiation, indicating that chroma as proxies in this profile has great potential to reflect paleoenvironmental changes.
Redness and yellowness are predominantly controlled by the types and concentrations of iron oxides mainly comprised of Hm and Gt. Sun et al. (2020) [101] indicated that Hm (red) affects the redness, and Gt (bright yellow) affects the yellowness. However, although the redness of the ZSP section is closely related to the Hm content, we demonstrated that a* alone does not provide a good reconstruction of the paleoenvironment [102], while the yellowness shows a poor correlation with the Gt content for the ZSP section, undermining the implication of the yellowness for paleoclimatic reconstruction [102]. In contrast, the lightness (L*) of loess is influenced by pedogenic matters (e.g., organic matters, carbonate and iron oxides) to varying degrees, depending on their concentrations [100,102]. For the CLP loess, Yang et al. (2001) [99] suggested that the variation in L* of loess–paleosol sequences is mainly controlled by the concentration of organic matter, and their linkages were strengthened significantly with increased organic matter contents [16,102]. The organic matter content of aeolian deposits in arid and semiarid regions usually reflects variations in vegetation cover and biomass productivity, which is sensitive to moisture availability or effective moisture. In short, the L* of the ZSP section associated with organic matter content has the potential to reveal the effective moisture evolution.
However, there are some noises in the L* signal that should be taken into serious consideration. On the one hand, the lightness of loess deposited in the arid and semiarid regions is disturbed by the carbonate content, for the high carbonate concentration will have a dilution effect on other substances, resulting in abnormally high lightness [21,100]. In the ZSP section, the degree of leaching was weak and carbonate content was high, and the variation trends of lightness and carbonate content showed similarities, implying that carbonates have a significant effect on lightness. On the other hand, the presence of iron oxides in detrital sediments from arid CA will produce abnormally low lightness [21]. To make L* reliably reflect the organic matter content, it is necessary to remove carbonate and iron oxide interference signals. Hence, according to Li et al. (2020) [21], we used calibrated lightness (ΔL*) in this study as a new reliable proxy for moisture variations. Specifically, by using the Z-score normalization method, three parameters (normalized L*, normalized carbonate content and normalized a* (signals reflecting the concentration of iron oxides)) were produced. Subsequently, the ΔL* is calculated by this formula: normalized L* minus normalized carbonate content and plus normalized a*. The more negative (positive) ΔL* indicates increased (decreased) effective moisture. ΔL* values ranged from −2.66 to 1.94, with an average value of −0.064. The lowest value occurred in the upper part of the S0 unit (~15 cm depth), and the highest value occurred in the L1L1 unit (~190 cm depth). Overall, ΔL* values showed negative values at the S0 unit and the middle and lower part of the L1L1 unit, and positive values at the L1S1 unit (Figure 6) (see Table S2).

3.4. Effective Moisture Evolution and Possible Driving Mechanism in the Ili Basin

Expansion of the SH pressure system can control the winter–spring climate of Eurasia [103,104]. Specifically, cold-air intrusion associated with the western spur of the SH can cause winter–spring dust storms in CA, which has a significant impact on wind dynamics and loess deposition in the region [41,105,106,107]. Based on high-quality luminescence chronology of several loess sections from the Ili Basin, Kang et al. (2022) [106] further expanded the discussion on the relationship between dust accumulation and atmospheric circulation in CA from a sit-specific record to a regional-scale integrated trend over the past 30 ka. The results show that strong (weakening) SH corresponds to higher (lower) dust fluxes, confirming the role of near-surface winds controlled by SH in controlling dust activity in the Ili Basin. In short, the SH is an important climate system affecting our study area. The mean grain size (MGS) of Jingyuan loess in the western Chinese loess Plateau was used to indicate the intensity of SH [98]. Therefore, the Jingyuan loess MGS is employed in the following analysis.
Based on the paleoclimatic significances of the <2 μm fraction content and ΔL* of the ZSP section, we reconstructed the evolutionary history of effective moisture in the study area since 26 ka based on the Bayesian age–depth model. Overall, effective moisture indicated by the ΔL* was relatively high during the LGM, lower during the last deglaciation and early Holocene, and reached its peak during the middle and late Holocene (Figure 7a). Specifically, the relatively high effective moistures during the LGM and the middle and late Holocene correspond to higher contents of <2 μm grain-size fraction (i.e., stronger westerly intensity), whereas the lower effective moistures during the last deglaciation and the early Holocene are attributed to weaker westerlies’ intensity indicated by lower contents of <2 μm grain-size fraction (Figure 7a,c). Moreover, the variation trend of the carbonate content in the XY17 section of the Ili Basin used as an indicator of precipitation [108] is also consistent with the <2 μm fraction content and ΔL* changes in the ZSP section (Figure 7b,c). Consequently, the comparisons suggest that the intensity of westerlies acts as a huge factor for the effective moisture change in the Ili Basin. Stronger westerlies can transport more moisture from the North Atlantic and the Mediterranean eastward to the Ili Basin in eastern CA [2,30,109] to the study area [2,16,109]. As shown in Figure 7d, the insolation gradient between mid- and high latitudes gradually reduced from the LGM to the last deglacial, followed by a persistent increase throughout the Holocene, which resulted in variations in westerlies’ intensity [2,16], as reflected by the changes in the <2 μm fraction content (Figure 7c).
Local evaporation intensity also exerts an important influence on humidity conditions in the arid and semiarid study area, in addition to westerlies’ intensity [20,21], with strong local evaporation increasing moisture loss and reducing effective moisture in the study area. The enhanced (weakened) SH leads to lower (higher) local temperature in eastern CA (Figure 7e,f), and thus a lower (higher) moisture saturation threshold [21]. As a result, effective moisture reduced from the last deglaciation to the early Holocene in the study area, compared to the LGM and the mid–late Holocene (Figure 7a,e). Importantly, despite increased westerlies’ intensity and evaporation from water vapor sources in the early Holocene, effective moisture in the study area remained low, owing to the strong local evaporation caused by high local temperature (Figure 7a,e,f).
However, although the temperature during the LGM was much lower than that of the middle to late Holocene, the effective moisture was lower (Figure 7a). This indicates that local evaporation appeared not to be the primary influencing factor for the effective moisture changes in the study area. During the LGM, large ice sheets were distributed throughout the Northern Hemisphere, and the SH pressure was stronger (Figure 7e,h), which may prolong the influence of the SH throughout the year over the study area and conversely, result in a shorter intra-annual effective control time for the westerlies. That likely diminished the input capacity of moisture in our study area. Additionally, surface temperature over the North Atlantic was significantly lower during the LGM (Figure 7g), which may result in weak evaporation from the water vapor source. It also resulted in a reduced supply of moisture to the study area. In contrast, in the mid- and late-Holocene, the effective intra-annual control time of the westerlies over the study area was extended due to the weakened SH intensity relative to the LGM (Figure 7e), and sea surface temperature in the North Atlantic increased (Figure 7g), which contributed to an increased supply of moisture to the study area. However, it was noted that the effective moisture during the last deglaciation with a weaker SH and higher evaporation from water vapor source was lower than that during the LGM (Figure 7a,e,g). It indicates that the intensity of evaporation from water vapor sources and the effective intra-annual control time of the westerlies over the study area may not be the main factors influencing the effective moisture changes in the Ili Basin.
Based on the above discussions, the moisture changes in the Ili Basin since the LGM are summarized as follows: stronger (weaker) westerlies transport more (less) moisture to the basin, which thus increases (decreases) effective moisture. Additionally, weaker (enhanced) local evaporation, enhanced (weaker) evaporation at the source of moisture, and longer (shorter) effective intra-annual control time of the westerlies over the study area may increase (decrease) moisture supply and effective moisture in the study area. We argue that the intensity of westerlies primarily drives the evolution of effective moisture in the Ili Basin, while the intensity of local evaporation, the intensity of evaporation at the source of moisture, and the effective control time of westerlies over the study area within a year are secondary factors.

4. Conclusions

Based on the newly established Bayesian age–depth model, we used the granulometry, clay mineral, and chroma properties of the ZSP loess to investigate the processes and mechanisms of effective moisture evolution in the Ili Basin since the LGM. The following conclusions were obtained: (1) Clay minerals from the ZSP section of the Ili Basin are mainly of detrital origin; (2) dust in the study area contributes to the Northern Hemisphere dust cycle, and the <2 μm grain size fraction content can be used as a valid indicator of westerlies’ intensity. The calibrated brightness (ΔL*) can be used as a reliable indicator of effective moisture. (3) Effective moisture in the Ili Basin was relatively higher during the LGM than that during the last deglaciation and early Holocene, and it increased to a much higher level in the middle to late Holocene. Since the LGM, the intensity of westerlies has primarily controlled the effective moisture in the Ili Basin, with secondary effects from the intensity of local evaporation, supply of water vapor from sources, and the effective intra-annual control time of the westerlies over the study area. The findings provide a theoretical foundation for understanding the driving mechanisms of moisture evolution in CA and developing measures for the sustainable use of regional water resources.

Supplementary Materials

The following supporting information can be downloaded at: https://www.mdpi.com/article/10.3390/atmos13111931/s1, Table S1. Clay mineral contents in the ZSP section; Table S2. Calibrated lightness (ΔL*) in the ZSP section.

Author Contributions

Conceptualization, Y.L. (Yudong Li); methodology, Y.L. (Yudong Li) and Y.L. (Yue Li); validation, Y.S., Y.L. (Yue Li) and N.S.; formal analysis, Y.L. (Yudong Li), H.W. and Y.W.; investigation, Y.S., Y.L. (Yudong Li) and Y.L. (Yue Li); resources, Y.S.; writing—original draft preparation, Y.L. (Yudong Li) and Y.L. (Yue Li); writing—review and editing, Y.S. and Y.L. (Yue Li), Y.W., H.W. and N.S.; visualization, Y.L. (Yudong Li); supervision, Y.S. and Y.L. (Yue Li); funding acquisition, Y.S. All authors have read and agreed to the published version of the manuscript.

Funding

This research was funded by the Natural Science Foundation of China (grant numbers 41977385 and 42102238) and State Key Laboratory of Loess and Quaternary Geology (SKLLQGPY2006).

Institutional Review Board Statement

Not applicable.

Informed Consent Statement

Not applicable.

Data Availability Statement

The datasets of this study are available from https://github.com/Yudongieecas/central-asia.git, accessed on 16 May 2022.

Acknowledgments

Many thanks to Zhengtao Shi and Junchao Dong for their field assistance, and Peng Chen for AMS 14C dating and discussion. We are grateful for critical comments and suggestions by the reviewers.

Conflicts of Interest

The authors declare no conflict of interest.

References

  1. Aizen, V.B.; Aizen, E.M.; Melack, J.M. Precipitation, melt and runoff in the northern Tien Shan. J. Hydrol. 1996, 186, 229–251. [Google Scholar] [CrossRef]
  2. Chen, F.H.; Chen, J.H.; Huang, W.; Chen, S.Q.; Huang, X.Z.; Jin, L.Y.; Jia, J.; Zhang, X.J.; An, C.B.; Zhang, J.W.; et al. Westerlies Asia and monsoonal Asia: Spatiotemporal differences in climate change and possible mechanisms on decadal to sub-orbital timescales. Earth-Sci. Rev. 2019, 192, 337–354. [Google Scholar] [CrossRef]
  3. Guan, X.F.; Yang, L.M.; Zhang, Y.X.; Li, J.G. Spatial distribution, temporal variation, and transport characteristics of atmospheric water vapor over Central Asia and the arid region of China. Glob. Planet. Change 2019, 172, 159–178. [Google Scholar] [CrossRef]
  4. Sorg, A.; Bolch, T.; Stoffel, M.; Solomina, O.; Beniston, M. Climate change impacts on glaciers and runoff in Tien Shan (Central Asia). Nat. Clim. Chang. 2012, 2, 725–731. [Google Scholar] [CrossRef]
  5. Wang, S.J.; Zhang, M.J.; Che, Y.J.; Chen, F.L.; Qiang, F. Contribution of recycled moisture to precipitation in oases of arid central Asia: A stable isotope approach. Water Resour. Res. 2016, 52, 3246–3257. [Google Scholar] [CrossRef] [Green Version]
  6. Li, J.Y.; Wang, N.L.; Dodson, J.; Yan, H.; Zhang, X.J.; Jia, P.W.; Seppa, H. Holocene negative coupling of summer temperature and moisture availability over southeastern arid Central Asia. Clim. Dyn. 2020, 55, 1187–1208. [Google Scholar] [CrossRef]
  7. Long, H.; Shen, J.; Chen, J.H.; Tsukamoto, S.; Yang, L.H.; Cheng, H.Y.; Frechen, M. Holocene moisture variations over the arid central Asia revealed by a comprehensive sand-dune record from the central Tian Shan, NW China. Quat. Sci. Rev. 2017, 174, 13–32. [Google Scholar] [CrossRef]
  8. Zhang, D.L.; Chen, X.; Li, Y.M.; Ran, M.; Yang, Y.P.; Zhang, S.R.; Feng, Z.D. Holocene moisture variations in the Arid Central Asia: New evidence from the southern Altai Mountains of China. Sci. Total Environ. 2020, 735, 8. [Google Scholar] [CrossRef]
  9. Wang, W.; Feng, Z.D.; Ran, M.; Zhang, C.J. Holocene climate and vegetation changes inferred from pollen records of Lake Aibi, northern Xinjiang, China: A potential contribution to understanding of Holocene climate pattern in East-central Asia. Quat. Int. 2013, 311, 54–62. [Google Scholar] [CrossRef]
  10. Chen, F.H.; Yu, Z.C.; Yang, M.L.; Ito, E.; Wang, S.M.; Madsen, D.B.; Huang, X.Z.; Zhao, Y.; Sato, T.; Birks, H.J.B.; et al. Holocene moisture evolution in arid central Asia and its out-of-phase relationship with Asian monsoon history. Quat. Sci. Rev. 2008, 27, 351–364. [Google Scholar] [CrossRef]
  11. Ran, M.; Zhang, C.J.; Feng, Z.D. Climatic and hydrological variations during the past 8000 years in northern Xinjiang of China and the associated mechanisms. Quat. Int. 2015, 358, 21–34. [Google Scholar] [CrossRef]
  12. Cheng, H.; Zhang, P.Z.; Spotl, C.; Edwards, R.L.; Cai, Y.J.; Zhang, D.Z.; Sang, W.C.; Tan, M.; An, Z.S. The climatic cyclicity in semiarid-arid central Asia over the past 500,000 years. Geophys. Res. Lett. 2012, 39, 5. [Google Scholar] [CrossRef] [Green Version]
  13. Rhodes, T.E.; Gasse, F.; Lin, R.F.; Fontes, J.C.; Wei, K.Q.; Bertrand, P.; Gibert, E.; Melieres, F.; Tucholka, P.; Wang, Z.X.; et al. A late Pleistocene-Holocene lacustrine record from Lake Manas, Zunggar (northern Xinjiang, western China). Paleogeogr. Paleoclimatol. Paleoecol. 1996, 120, 105–121. [Google Scholar] [CrossRef]
  14. Rudaya, N.; Tarasov, P.; Dorofeyuk, N.; Solovieva, N.; Kalugin, I.; Andreev, A.; Daryin, A.; Diekmann, B.; Riedel, F.; Tserendash, N.; et al. Holocene environments and climate in the Mongolian Altai reconstructed from the Hoton-Nur pollen and diatom records: A step towards better understanding climate dynamics in Central Asia. Quat. Sci. Rev. 2009, 28, 540–554. [Google Scholar] [CrossRef] [Green Version]
  15. Wei, K.; Gasse, F. Oxygen isotopes in lacustrine carbonates of West China revisited: Implications for post glacial changes in summer monsoon circulation. Quat. Sci. Rev. 1999, 18, 1315–1334. [Google Scholar] [CrossRef]
  16. Chen, F.H.; Jia, J.; Chen, J.H.; Li, G.Q.; Zhang, X.J.; Xie, H.C.; Xia, D.S.; Huang, W.; An, C.B. A persistent Holocene wetting trend in arid central Asia, with wettest conditions in the late Holocene, revealed by multi-proxy analyses of loess-paleosol sequences in Xinjiang, China. Quat. Sci. Rev. 2016, 146, 134–146. [Google Scholar] [CrossRef]
  17. Zhang, D.L.; Feng, Z.D. Holocene climate variations in the Altai Mountains and the surrounding areas: A synthesis of pollen records. Earth-Sci. Rev. 2018, 185, 847–869. [Google Scholar] [CrossRef]
  18. Ran, M.; Feng, Z.D. Holocene moisture variations across China and driving mechanisms: A synthesis of climatic records. Quat. Int. 2013, 313, 179–193. [Google Scholar] [CrossRef]
  19. Xu, H.; Zhou, K.E.; Lan, J.H.; Zhang, G.L.; Zhou, X.Y. Arid Central Asia saw mid-Holocene drought. Geology 2019, 47, 255–258. [Google Scholar] [CrossRef]
  20. Kang, S.G.; Wang, X.L.; Roberts, H.M.; Duller, G.A.T.; Song, Y.G.; Liu, W.G.; Zhang, R.; Liu, X.X.; Lan, J.H. Increasing effective moisture during the Holocene in the semiarid regions of the Yili Basin, Central Asia: Evidence from loess sections. Quat. Sci. Rev. 2020, 246, 11. [Google Scholar] [CrossRef]
  21. Li, Y.; Song, Y.G.; Orozbaev, R.; Dong, J.B.; Li, X.Z.; Zhou, J. Moisture evolution in Central Asia since 26 ka: Insights from a Kyrgyz loess section, Western Tian Shan. Quat. Sci. Rev. 2020, 249, 18. [Google Scholar] [CrossRef]
  22. Huang, X.Z.; Chen, C.Z.; Jia, W.N.; An, C.B.; Zhou, A.F.; Zhang, J.W.; Jin, M.; Xia, D.S.; Chen, F.H.; Grimm, E.C. Vegetation and climate history reconstructed from an alpine lake in central Tienshan Mountains since 8.5 ka BP. Paleogeogr. Paleoclimatol. Paleoecol. 2015, 432, 36–48. [Google Scholar] [CrossRef]
  23. Rao, Z.G.; Guo, H.C.; Cao, J.T.; Shi, F.X.; Jia, G.D.; Li, Y.X.; Chen, F.H. Consistent long-term Holocene warming trend at different elevations in the Altai Mountains in arid central Asia. J. Quat. Sci. 2020, 35, 1036–1045. [Google Scholar] [CrossRef]
  24. Wu, D.D.; Cao, J.T.; Jia, G.D.; Guo, H.C.; Shi, F.X.; Zhang, X.P.; Rao, Z.G. Peat brGDGTs-based Holocene temperature history of the Altai Mountains in arid Central Asia. Paleogeogr. Paleoclimatol. Paleoecol. 2020, 538, 11. [Google Scholar] [CrossRef]
  25. Cai, Y.J.; Chiang, J.C.H.; Breitenbach, S.F.M.; Tan, L.C.; Cheng, H.; Edwards, R.L.; An, Z.S. Holocene moisture changes in western China, Central Asia, inferred from stalagmites. Quat. Sci. Rev. 2017, 158, 15–28. [Google Scholar] [CrossRef] [Green Version]
  26. Jia, J.; Chen, J.H.; Wang, Z.Y.; Chen, S.Q.; Wang, Q.; Wang, L.B.; Yang, L.W.; Xia, D.S.; Chen, F.H. No evidence for an anti-phased Holocene moisture regime in mountains and basins in Central Asian: Records from Ili loess, Xinjiang. Paleogeogr. Paleoclimatol. Paleoecol. 2021, 572, 10. [Google Scholar] [CrossRef]
  27. Jiang, Q.F.; Ji, J.F.; Shen, J.; Matsumoto, R.; Tong, G.B.; Qian, P.; Ren, X.M.; Yan, D.Z. Holocene vegetational and climatic variation in westerly-dominated areas of Central Asia inferred from the Sayram Lake in northern Xinjiang, China. Sci. China-Earth Sci. 2013, 56, 339–353. [Google Scholar] [CrossRef]
  28. Zhang, X.N.; Zhou, A.F.; Huang, Z.D.; An, C.B.; Zhao, Y.T.; Yin, L.Y.; Russell, J.M. Moisture evolution in North Xinjiang (northwest China) during the last 8000 years linked to the westerlies’ winter half-year precipitation. Quat. Res. 2021, 100, 122–134. [Google Scholar] [CrossRef]
  29. Hong, B.; Gasse, F.; Uchida, M.; Hong, Y.T.; Leng, X.T.; Shibata, Y.; An, N.; Zhu, Y.X.; Wang, Y. Increasing summer rainfall in arid eastern-Central Asia over the past 8500 years. Sci. Rep. 2014, 4, 10. [Google Scholar] [CrossRef] [Green Version]
  30. Zong, X.L.; Dong, J.B.; Cheng, P.; Song, Y.G.; Liu, W.G.; Li, Y.; Lan, J.H. Terrestrial mollusk records in the loess sequences from eastern Central Asia since the last deglaciation and their paleoenvironmental significance. Paleogeogr. Paleoclimatol. Paleoecol. 2020, 556, 9. [Google Scholar] [CrossRef]
  31. Cheng, H.; Spoetl, C.; Breitenbach, S.F.M.; Sinha, A.; Wassenburg, J.A.; Jochum, K.P.; Scholz, D.; Li, X.L.; Yi, L.; Peng, Y.B.; et al. Climate variations of Central Asia on orbital to millennial timescales. Sci. Rep. 2016, 6, 11. [Google Scholar] [CrossRef] [PubMed] [Green Version]
  32. Rao, Z.G.; Wu, D.D.; Shi, F.X.; Guo, H.C.; Cao, J.T.; Chen, F.H. Reconciling the ‘westerlies’ and ‘monsoon’ models: A new hypothesis for the Holocene moisture evolution of the Xinjiang region, NW China. Earth-Sci. Rev. 2019, 191, 263–272. [Google Scholar] [CrossRef]
  33. Song, Y.G.; Shi, Z.T.; Fang, X.M.; Nie, J.S.; Naoto, I.; Qiang, X.K.; Wang, X.L. Loess magnetic properties in the Ili Basin and their correlation with the Chinese Loess Plateau. Sci. China-Earth Sci. 2010, 53, 419–431. [Google Scholar] [CrossRef]
  34. Li, X.Q.; Zhao, K.L.; Dodson, J.; Zhou, X.Y. Moisture dynamics in central Asia for the last 15 kyr: New evidence from Yili Valley, Xinjiang, NW China. Quat. Sci. Rev. 2011, 30, 3457–3466. [Google Scholar] [CrossRef]
  35. Song, Y.G.; Chen, X.L.; Qian, L.B.; Li, C.X.; Li, Y.; Li, X.X.; Chang, H.; An, Z.S. Distribution and composition of loess sediments in the Ili Basin, Central Asia. Quat. Int. 2014, 334, 61–73. [Google Scholar] [CrossRef]
  36. Song, Y.G.; Li, Y.; Cheng, L.Q.; Zong, X.L.; Kang, S.G.; Ghafarpour, A.; Li, X.Z.; Sun, H.Y.; Fu, X.F.; Dong, J.B.; et al. Spatio-temporal distribution of Quaternary loess across Central Asia. Paleogeogr. Paleoclimatol. Paleoecol. 2021, 567, 23. [Google Scholar] [CrossRef]
  37. Li, J.F. Climate in Xinjiang; China Meteorological Press: Beijing, China, 1991. (In Chinese) [Google Scholar]
  38. Ye, W. Sedimentary Characteristics of Loess and Paleoclimate in Westerly Region of Xinjiang; China Ocean Press: Beijing, China, 2001. (In Chinese) [Google Scholar]
  39. Song, Y.G.; Zeng, M.X.; Chen, X.L.; Li, Y.; Chang, H.; An, Z.S.; Guo, X.H. Abrupt climatic events recorded by the Ili loess during the last glaciation in Central Asia: Evidence from grain-size and minerals. J. Asian Earth Sci. 2018, 155, 58–67. [Google Scholar] [CrossRef]
  40. Machalett, B.; Oches, E.A.; Frechen, M.; Zoller, L.; Hambach, U.; Mavlyanova, N.G.; Markovic, S.B.; Endlicher, W. Aeolian dust dynamics in central Asia during the Pleistocene: Driven by the long-term migration, seasonality, and permanency of the Asiatic polar front. Geochem. Geophys. Geosyst. 2008, 9, 22. [Google Scholar] [CrossRef]
  41. Li, Y.; Song, Y.G.; Fitzsimmons, K.E.; Chang, H.; Orozbaev, R.; Li, X.X. Eolian dust dispersal patterns since the last glacial period in eastern Central Asia: Insights from a loess-paleosol sequence in the Ili Basin. Clim. Past. 2018, 14, 271–286. [Google Scholar] [CrossRef] [Green Version]
  42. Cheng, L.; Wu, Y.; Song, Y.; Yang, L.; Miao, X.; Sun, H.; Qiang, X.; Chang, H.; Long, H.; Dong, Z. Strong Asymmetry of Interhemispheric Ice Volume During MIS 11, MIS 9, and MIS 7 Drives Heterogeneity of Interglacial Precipitation Intensity Over Asia. Geophys. Res. Lett. 2022, 49, e2022GL100269. [Google Scholar] [CrossRef]
  43. Hu, R. Physical Geography of the Tianshan Mountains in China; China Environmental Science Press: Beijing, China, 2004; pp. 264–273. [Google Scholar]
  44. Kalnay, E.; Kanamitsu, M.; Kistler, R.; Collins, W.; Deaven, D.; Gandin, L.; Iredell, M.; Saha, S.; White, G.; Woollen, J.; et al. The NCEP/NCAR 40-year reanalysis project. Bull. Am. Meteorol. Soc. 1996, 77, 437–471. [Google Scholar] [CrossRef]
  45. Song, Y.G.; Luo, D.; Du, J.H.; Kang, S.G.; Cheng, P.; Fu, C.F.; Guo, X.H. Radiometric dating of late Quaternary loess in the northern piedmont of South Tianshan Mountains: Implications for reliable dating. Geol. J. 2018, 53, 417–426. [Google Scholar] [CrossRef]
  46. Song, Y.G.; Li, C.X.; Zhao, J.D.; Cheng, P.; Zeng, M.X. A combined luminescence and radiocarbon dating study of the Ili loess, Central Asia. Quat. Geochronol. 2012, 10, 2–7. [Google Scholar] [CrossRef]
  47. Porter, S.C.; An, Z.S. Correlation between climate events in the North Atlantic and China during the last glaciation. Nature 1995, 375, 305–308. [Google Scholar] [CrossRef]
  48. Li, C.; Song, Y.; Qian, L.; Wang, L. The history of climate change recorded by the grain size at the Zhaosu loess section in Central Asia since the last glacial period. Acta Sedimentol. Sinica 2011, 29, 1170–1179, (In Chinese with English abstract). [Google Scholar]
  49. Li, Y.; Song, Y.G.; Qiang, M.R.; Miao, Y.F.; Zeng, M.X. Atmospheric Dust Variations in the Ili Basin, Northwest China, During the Last Glacial Period as Revealed by a High Mountain Loess-Paleosol Sequence. J. Geophys. Res.-Atmos. 2019, 124, 8449–8466. [Google Scholar] [CrossRef]
  50. Blaauw, M.; Christen, J.A. Flexible Paleoclimate Age-Depth Models Using an Autoregressive Gamma Process. Bayesian Anal. 2011, 6, 457–474. [Google Scholar] [CrossRef]
  51. Rhodes, E.J.; Ramsey, C.B.; Outram, Z.; Batt, C.; Willis, L.; Dockrill, S.; Bond, J. Bayesian methods applied to the interpretation of multiple OSL dates: High precision sediment ages from Old Scatness Broch excavations, Shetland Isles. Quat. Sci. Rev. 2003, 22, 1231–1244. [Google Scholar] [CrossRef]
  52. Reimer, P.J.; Austin, W.E.N.; Bard, E.; Bayliss, A.; Blackwell, P.G.; Ramsey, C.B.; Butzin, M.; Cheng, H.; Edwards, R.L.; Friedrich, M.; et al. The IntCal20 Northern Hemisphere Radiocarbon Age Calibration Curve (0–55 cal kBP). Radiocarbon 2020, 62, 725–757. [Google Scholar] [CrossRef]
  53. Liu, Z.F.; Colin, C.; Trentesaux, A.; Blamart, D. Clay mineral records of East Asian monsoon evolution during late Quaternary in the southern South China Sea. Sci. China Ser. D-Earth Sci. 2005, 48, 84–92. [Google Scholar] [CrossRef]
  54. Moore, M.J.; Distefano, M.D.; Walsh, C.T.; Schiering, N.; Pai, E.F. Purification, crystallization, and preliminary-x-ray diffraction studies of the flavoenzyme mercuric ion reductase from bacillus sp strain-rc607. J. Biol. Chem. 1989, 264, 14386–14388. [Google Scholar] [CrossRef]
  55. Biscaye, P.E. Mineralogy and Sedimentation of Recent Deep-Sea Clay in the Atlantic Ocean and Adjacent Seas and Oceans. Geol. Soc. Am. Bull. 1965, 76, 803–832. [Google Scholar] [CrossRef]
  56. Chamley, H. Clay Sedimentology; Springer: Berlin/Heidelberg, Germany, 1989; pp. 3–94. [Google Scholar]
  57. Kalm, V.E.; Rutter, N.W.; Rokosh, C.D. Clay minerals and their paleoenvironmental interpretation in the Baoji loess section, Southern Loess Plateau, China. Catena 1996, 27, 49–61. [Google Scholar] [CrossRef]
  58. Liu, Z.F.; Colin, C.; Li, X.J.; Zhao, Y.L.; Tuo, S.T.; Chen, Z.; Siringan, F.P.; Liu, J.T.; Huang, C.Y.; You, C.F.; et al. Clay mineral distribution in surface sediments of the northeastern South China Sea and surrounding fluvial drainage basins: Source and transport. Mar. Geol. 2010, 277, 48–60. [Google Scholar] [CrossRef]
  59. Wang, Q.; Song, Y.; Li, Y. Clay mineralogy of the upper Miocene-Pliocene red clay from the central Chinese Loess Plateau and its paleoclimate implications. Quat. Int. 2020, 552, 148–154. [Google Scholar] [CrossRef]
  60. Fu, Y.; Hao, Q.Z.; Peng, S.Z.; Markovic, S.B.; Gao, X.B.; Han, L.; Wu, X.C.; Namier, N.; Zhang, W.; Gavrilov, M.B.; et al. Clay mineralogy of the Stari Slankamen (Serbia) loess-paleosol sequence during the last glacial cycle d Implications for dust provenance and interglacial climate. Quat. Sci. Rev. 2021, 263, 14. [Google Scholar] [CrossRef]
  61. Horiuchi, K.; Minoura, K.; Hoshino, K.; Oda, T.; Nakamura, T.; Kawai, T. Palaeoenvironmental history of Lake Baikal during the last 23000 years. Paleogeogr. Paleoclimatol. Paleoecol. 2000, 157, 95–108. [Google Scholar] [CrossRef]
  62. Lamy, F.; Klump, J.; Hebbeln, D.; Wefer, G. Late Quaternary rapid climate change in northern Chile. Terr. Nova 2000, 12, 8–13. [Google Scholar] [CrossRef]
  63. Ye, C.C.; Yang, Y.B.; Fang, X.M.; Guo, Z.G.; Zhang, W.L.; Liu, Y.D. Evolution of Paleogene weathering intensity in the Qaidam Basin, northeastern Tibetan Plateau: Insights from clay geochemistry. Catena 2022, 213, 13. [Google Scholar] [CrossRef]
  64. Petschick, R.; Kuhn, G.; Gingele, F. Clay mineral distribution in surface sediments of the South Atlantic: Sources, transport, and relation to oceanography. Mar. Geol. 1996, 130, 203–229. [Google Scholar] [CrossRef] [Green Version]
  65. Long, L.L.; Gao, J.; Klemd, R.; Beier, C.; Qian, Q.; Zhang, X.; Wang, J.B.; Jiang, T. Geochemical and geochronological studies of granitoid rocks from the Western Tianshan Orogen: Implications for continental growth in the southwestern Central Asian Orogenic Belt. Lithos 2011, 126, 321–340. [Google Scholar] [CrossRef]
  66. Rolland, Y.; Alexeiev, D.V.; Kröner, A.; Corsini, M.; Loury, C.; Monié, P. Late Palaeozoic to Mesozoic kinematic history of the Talas–Ferghana strike-slip fault (Kyrgyz West Tianshan) as revealed by 40Ar/39Ar dating of syn-kinematic white mica. J. Asian Earth Sci. 2013, 67–68, 76–92. [Google Scholar] [CrossRef]
  67. Li, Y.; Song, Y.G.; Fitzsimmons, K.E.; Chen, X.L.; Prud’homme, C.; Zong, X.L. Origin of loess deposits in the North Tian Shan piedmont, Central Asia. Paleogeogr. Paleoclimatol. Paleoecol. 2020, 559, 17. [Google Scholar] [CrossRef]
  68. Li, Y.; Song, Y.; Fitzsimmons, K.E.; Chen, X.; Wang, Q.; Sun, H.; Zhang, Z. New evidence for the provenance and formation of loess deposits in the Ili River Basin, Arid Central Asia. Aeolian Res. 2018, 35, 1–8. [Google Scholar] [CrossRef]
  69. Gallet, S.; Jahn, B.M.; Lanoe, B.V.; Dia, A.; Rossello, E. Loess geochemistry and its implications for particle origin and composition of the upper continental crust. Earth Planet. Sci. Lett. 1998, 156, 157–172. [Google Scholar] [CrossRef]
  70. Beaufort, D.; Rigault, C.; Billon, S.; Billault, V.; Inoue, A.; Inoue, S.; Patrier, P. Chlorite and chloritization processes through mixed-layer mineral series in low-temperature geological systems–A review. Clay Min. 2015, 50, 497–523. [Google Scholar] [CrossRef]
  71. Peng, S.Z.; Hao, Q.Z.; Oldfield, F.; Guo, Z.T. Release of iron from chlorite weathering and links to magnetic enhancement in Chinese loess deposits. Catena 2014, 117, 43–49. [Google Scholar] [CrossRef]
  72. Cuadros, J.; Caballero, E.; Huertas, F.J.; De Cisneros, C.J.; Huertas, F.; Linares, J. Experimental alteration of volcanic tuff: Smectite formation and effect on 18O isotope composition. Clay Clay Min. 1999, 47, 769–776. [Google Scholar] [CrossRef]
  73. Do Campo, M.; del Papa, C.; Nieto, F.; Hongn, F.; Petrinovic, I. Integrated analysis for constraining palaeoclimatic and volcanic influences on clay-mineral assemblages in orogenic basins (Palaeogene Andean foreland, Northwestern Argentina). Sediment. Geol. 2010, 228, 98–112. [Google Scholar] [CrossRef]
  74. Singer, A.; Dultz, S.; Argaman, E. Properties of the non-soluble fractions of suspended dust over the Dead Sea. Atmos. Environ. 2004, 38, 1745–1753. [Google Scholar] [CrossRef]
  75. Melo, V.F.; Singh, B.; Schaefer, C.; Novais, R.F.; Fontes, M.P.F. Chemical and mineralogical properties of kaolinite-rich Brazilian soils. Soil Sci. Soc. Am. J. 2001, 65, 1324–1333. [Google Scholar] [CrossRef]
  76. Uno, I.; Eguchi, K.; Yumimoto, K.; Takemura, T.; Shimizu, A.; Uematsu, M.; Liu, Z.Y.; Wang, Z.F.; Hara, Y.; Sugimoto, N. Asian dust transported one full circuit around the globe. Nat. Geosci. 2009, 2, 557–560. [Google Scholar] [CrossRef]
  77. Maggi, V. Mineralogy of atmospheric microparticles deposited along the Greenland Ice Core Project ice core. J. Geophys. Res.-Oceans 1997, 102, 26725–26734. [Google Scholar] [CrossRef]
  78. Li, Y.; Song, Y.; Zeng, M.; Lin, W.; Orozbaev, R.; Cheng, L.; Chen, X.; Halmurat, T. Evaluating the paleoclimatic significance of clay mineral records from a late Pleistocene loess-paleosol section of the Ili Basin, Central Asia. Quat. Res. 2017, 89, 660–673. [Google Scholar] [CrossRef]
  79. Li, Y.; Gholami, H.; Song, Y.G.; Fathabadi, A.; Malakooti, H.; Collins, A.L. Source fingerprinting loess deposits in Central Asia using elemental geochemistry with Bayesian and GLUE models. Catena 2020, 194, 12. [Google Scholar] [CrossRef]
  80. Svensson, A.; Biscaye, P.E.; Grousset, F.E. Characterization of late glacial continental dust in the Greenland Ice Core Project ice core. J. Geophys. Res.-Atmos. 2000, 105, 4637–4656. [Google Scholar] [CrossRef]
  81. Guerzoni, S.; Molinaroli, E.; Chester, R. Saharan dust inputs to the W. Mediterranean Sea: Depositional patterns, geochemistry and sedimentological implications. Deep. Sea Res. Part II Top. Stud. Oceanogr. 1997, 44, 631–654. [Google Scholar] [CrossRef]
  82. Peng, S. Composition of Clay Minerals of Eolian Deposits in Northern China since Miocene Times and its Environmental Implications. Ph.D. Dissertation, Chinese Academy of Sciences, Beijing, China, 2004. (In Chinese with English abstract). [Google Scholar]
  83. Gylesjo, S.; Arnold, E. Clay mineralogy of a red clay-loess sequence from Lingtai, the Chinese Loess Plateau. Glob. Planet. Change 2006, 51, 181–194. [Google Scholar] [CrossRef]
  84. Leinen, M.; Prospero, J.M.; Arnold, E.; Blank, M. Mineralogy of aeolian dust reaching the North Pacific Ocean: 1. Sampling and analysis. J. Geophys. Res.-Atmos. 1994, 99, 21017–21023. [Google Scholar] [CrossRef] [Green Version]
  85. Biscaye, P.E.; Grousset, F.E.; Revel, M.; Gaast, S.V.D.; Zielinski, G.A.; Vaars, A.; Kukla, G. Asian provenance of glacial dust (stage 2) in the Greenland Ice Sheet Project 2 Ice Core, Summit, Greenland. J. Geophys. Res.-Oceans. 1997, 102, 26765–26781. [Google Scholar] [CrossRef]
  86. Ujvari, G.; Varga, A.; Ramos, F.C.; Kovacs, J.; Nemeth, T.; Stevens, T. Evaluating the use of clay mineralogy, Sr-Nd isotopes and zircon U-Pb ages in tracking dust provenance: An example from loess of the Carpathian Basin. Chem. Geol. 2012, 304, 83–96. [Google Scholar] [CrossRef]
  87. Varga, A.; Ujvari, G.; Raucsik, B. Tectonic versus climatic control on the evolution of a loess-paleosol sequence at Beremend, Hungary: An integrated approach based on paleoecological, clay mineralogical, and geochemical data. Quat. Int. 2011, 240, 71–86. [Google Scholar] [CrossRef]
  88. Martinez-Lamas, R.; Toucanne, S.; Debret, M.; Riboulot, V.; Deloffre, J.; Boissier, A.; Cheron, S.; Pitel, M.; Bayon, G.; Giosan, L.; et al. Linking Danube River activity to Alpine Ice-Sheet fluctuations during the last glacial (ca. 33–17 ka BP): Insights into the continental signature of Heinrich Stadials. Quat. Sci. Rev. 2020, 229, 24. [Google Scholar] [CrossRef]
  89. Sun, D.H.; Bloemendal, J.; Rea, D.K.; An, Z.S.; Vandenberghe, J.; Lu, H.Y.; Su, R.X.; Liu, T.S. Bimodal grain-size distribution of Chinese loess, and its palaeoclimatic implications. Catena 2004, 55, 325–340. [Google Scholar] [CrossRef]
  90. Jia, J.; Liu, H.; Gao, F.Y.; Xia, D.S. Variations in in the westerlies in Central Asia since 16 ka recorded by a loess section from the Tien Shan Mountains. Paleogeogr. Paleoclimatol. Paleoecol. 2018, 504, 156–161. [Google Scholar] [CrossRef]
  91. Gao, F.Y.; Yang, J.H.; Wang, S.Y.; Wang, Y.J.; Li, K.M.; Wang, F.; Ling, Z.Y.; Xia, D.S. Variation of the winter mid-latitude Westerlies in the Northern Hemisphere during the Holocene revealed by aeolian deposits in the southern Tibetan Plateau. Quat. Res. 2022, 107, 104–112. [Google Scholar] [CrossRef]
  92. Bland, W. Weathering: An Introduction to the Scientific Principles; Oxford University Press: New York, NY, USA, 1998. [Google Scholar]
  93. Hao, Q.Z.; Oldfield, F.; Bloemendal, J.; Guo, Z.T. Particle size separation and evidence for pedogenesis in samples from the Chinese Loess Plateau spanning the past 22 m.y. Geology 2008, 36, 727–730. [Google Scholar] [CrossRef]
  94. Wang, H.; Mason, J.A.; Balsam, W.L. The importance of both geological and pedological processes in control of grain size and sedimentation rates in Peoria Loess. Geoderma 2006, 136, 388–400. [Google Scholar] [CrossRef]
  95. Xiao, J.; Porter, S.C.; An, Z.S.; Kumai, H.; Yoshikawa, S. Grain Size of Quartz as an Indicator of Winter Monsoon Strength on the Loess Plateau of Central China during the Last 130,000 Yr. Quat. Res. 1995, 43, 22–29. [Google Scholar] [CrossRef]
  96. Maher, B.A.; Taylor, R.M. Formation of ultrafine-grained magnetite in soils. Nature 1988, 336, 368–370. [Google Scholar] [CrossRef]
  97. Zhou, L.P.; Oldfield, F.; Wintle, A.G.; Robinson, S.G.; Wang, J.T. Partly pedogenic origin of magnetic variations in Chinese loess. Nature 1990, 346, 737–739. [Google Scholar] [CrossRef]
  98. Sun, Y.B.; Wang, X.L.; Liu, Q.S.; Clemens, S.C. Impacts of post-depositional processes on rapid monsoon signals recorded by the last glacial loess deposits of northern China. Earth Planet. Sci. Lett. 2010, 289, 171–179. [Google Scholar] [CrossRef]
  99. Yang, S.L.; Fang, X.M.; Li, J.J.; An, Z.S.; Chen, S.Y.; Fukusawa, H. Transformation functions of soil color and climate. Sci. China Ser. D-Earth Sci. 2001, 44, 218–226. [Google Scholar] [CrossRef]
  100. Sun, Y.B.; He, L.; Liang, L.J.; An, Z.S. Changing color of Chinese loess: Geochemical constraint and paleoclimatic significance. J. Asian Earth Sci. 2011, 40, 1131–1138. [Google Scholar] [CrossRef]
  101. Sun, H.Y.; Song, Y.G.; Chen, X.L.; Cheng, L.Q.; Liu, H.F. Holocene dust deposition in the Ili Basin and its implications for climate variations in Westerlies-dominated Central Asia. Paleogeogr. Paleoclimatol. Paleoecol. 2020, 550, 13. [Google Scholar] [CrossRef]
  102. Li, Y.; Song, Y.-G.; Wang, Q.-S. Chroma characteristics in the Zhaosu loess section and its paleoclimatic significance. J. Earth. Env. 2014, 4, 67–75. [Google Scholar] [CrossRef]
  103. Gong, D.Y.; Ho, C.H. The Siberian High and climate change over middle to high latitude Asia. Theor. Appl. Climatol. 2002, 72, 1–9. [Google Scholar] [CrossRef]
  104. Perşoiu, A.; Ionita, M.; Weiss, H. Atmospheric blocking induced by the strengthened Siberian High led to drying in west Asia during the 4.2 ka BP event–A hypothesis. Clim. Past 2019, 15, 781–793. [Google Scholar] [CrossRef] [Green Version]
  105. Issanova, G.; Abuduwaili, J. Aeolian Processes as Dust Storms in the Deserts of Central Asia and Kazakhstan. In Aeolian Processes as Dust Storms in the Deserts of Central Asia and Kazakhstan; Environmental Science and Engineering; Springer Singapore Pte Ltd.: Singapore, 2017. [Google Scholar]
  106. Kang, S.G.; Wang, X.L.; Wang, N.; Song, Y.G.; Liu, W.G.; Wang, D.; Peng, J. Siberian High Modulated Suborbital-Scale Dust Accumulation Changes Over the Past 30 ka in the Eastern Yili Basin, Central Asia. Paleoceanogr. Paleoclimatol. 2022, 37, 13. [Google Scholar] [CrossRef]
  107. Orlovsky, L.; Orlovsky, N.; Durdyev, A. Dust storms in Turkmenistan. J. Arid. Environ. 2005, 60, 83–97. [Google Scholar] [CrossRef]
  108. Li, G.Q.; Yang, H.; Stevens, T.; Zhang, X.J.; Zhang, H.X.; Wei, H.T.; Zheng, W.P.; Li, L.J.; Liu, X.J.; Chen, J.H.; et al. Differential ice volume and orbital modulation of Quaternary moisture patterns between Central and East Asia. Earth Planet. Sci. Lett. 2020, 530, 12. [Google Scholar] [CrossRef]
  109. Gao, F.; Yang, J.; Xia, D.; Lu, H.; Wang, S.; Li, K.; Wang, Z.; Wu, Z.; Zhou, J.; Shi, F. Linking moisture and near-surface wind with winter temperature to reveal the Holocene climate evolution in arid Xinjiang region of China. Geosci. Front. 2022, 13, 101433. [Google Scholar] [CrossRef]
  110. Laskar, J.; Robutel, P.; Joutel, F.; Gastineau, M.; Correia, A.C.M.; Levrard, B. A long-term numerical solution for the insolation quantities of the Earth. Astron. Astrophys. 2004, 428, 261–285. [Google Scholar] [CrossRef] [Green Version]
  111. Thompson, L.G.; Yao, T.; Davis, M.E.; Henderson, K.A.; Mosley Thompson, E.; Lin, P.N.; Beer, J.; Synal, H.A.; ColeDai, J.; Bolzan, J.F. Tropical climate instability: The last glacial cycle from a Qinghai-Tibetan ice core. Science 1997, 276, 1821–1825. [Google Scholar] [CrossRef] [Green Version]
  112. Cacho, I.; Grimalt, J.O.; Pelejero, C.; Canals, M.; Sierro, F.J.; Flores, J.A.; Shackleton, N. Dansgaard-Oeschger and heinrich event imprints in Alboran Sea paleotemperatures. Paleoceanography 1999, 14, 698–705. [Google Scholar] [CrossRef]
  113. Lisiecki, L.E.; Raymo, M.E. A Pliocene-Pleistocene stack of 57 globally distributed benthic delta 18O records. Paleoceanography 2005, 20, 17. [Google Scholar] [CrossRef]
Figure 2. Bayesian age—depth model of the ZSP section based on previous AMS 14C dates [45].
Atmosphere 13 01931 g002
Figure 3. X-ray diffractograms of clay fractions of selected samples (a) and relative contents variations of clay minerals with Illite crystallinity, CII (chemical index of illite), and CIA (chemical index of alteration) (b) from the ZSP section.
Atmosphere 13 01931 g003
Figure 4. Comparison of clay minerals in different regions of the Northern Hemisphere. (Data sources: Sahara—Svensson et al. (2000) [80], Guerzoni et al. (1997) [81]; East Asia—Peng (2004) [82], Gylesjo and Arnold (2006) [83], Leinen et al. (1994) [84], Svensson et al. (2000) [80]; Greenland—Biscaye et al. (1997) [85]; Europe—Fu et al. (2021) [60], Újvari et al. (2012) [86], Varga et al. (2011) [87], Martinez-Lamas et al. (2020) [88]).
Atmosphere 13 01931 g004
Figure 6. Variations in calibration lightness (ΔL*), lightness (L*), carbonate content (%), redness (a*) versus depth of the ZSP section. (L*, carbonate content and a* are from reference [102].)
Atmosphere 13 01931 g006
Figure 7. Mechanism of effective moisture evolution in the Ili Basin ((a) calibration lightness ΔL*; (b) CaCO3 content (%) from loess section XY17 [108]; (c) the <2 μm grain size fraction content (%) from ZSP section [39]; (d) summer insolation gradient between 35° N and 55° N [110]; (e) mean grain sizes (MGS) of Jingyuan loess in the western Chinese Loess Plateau [98]; (f) Guliya ice core δ18O record from the Northwestern Tibetan Plateau [111]; (g) Alboran sea surface temperature (°C) [112]; (h) benthic δ18O record [113]).
Atmosphere 13 01931 g007
Publisher’s Note: MDPI stays neutral with regard to jurisdictional claims in published maps and institutional affiliations.

