

Scenario Analysis of Air Quality Improvement in Warsaw, Poland, by the End of the Current Decade

1
Systems Research Institute, Polish Academy of Sciences, 01-447 Warsaw, Poland
2
Warsaw School of Information Technology (WIT), 01-447 Warsaw, Poland
*
Author to whom correspondence should be addressed.
Atmosphere 2022, 13(10), 1613; https://doi.org/10.3390/atmos13101613
Submission received: 5 September 2022
/
Revised: 21 September 2022
/
Accepted: 27 September 2022
/
Published: 2 October 2022
(This article belongs to the Special Issue Air Pollution at the Urban and Regional Level: Sources, Sinks, and Transportation)
Abstract
:Very low air quality in the Warsaw conurbation, Poland, similarly to the case in many large European cities, poses a serious threat to the residents’ health, being a significant source of premature mortality. Many results presented in earlier publications indicated local heating installations and car traffic as the main emission categories responsible for this adverse population exposure, where the dominant polluting compounds are NOx, PM10, PM2.5, and BaP. The last two mainly originate from individual household heating installations, both in the city of Warsaw and in its vicinity. To reduce the health risk of air pollution, the city authorities have recently made fundamental decisions, related to the individual housing sector, aimed at the radical decarbonization of all heating installations in Warsaw and its surroundings. On the other hand, the ongoing modernization of the city’s car fleet (including individual and public transport), taking into account the restrictive EU emission standards, as well as the quickly growing share of electric and hybrid cars (BEVs and PHEVs), gives a good prospect of a fundamental improvement in air quality in Warsaw conurbation. The main subject of the paper is a quantitative assessment of the air quality improvement in the current decade (by 2030), resulting from the above modernization activities. The final results are expressed as the attributed reduction in population exposure, which was found to be 28–30% with respect to NOx and PM, and the associated health risk, i.e., 204 fewer avoidable deaths with respect to NOx and 607 fewer with respect to PM2.5.
1. Introduction
More than 70% of European citizens live in urban areas [1], where, due to high population densities and economic activities, they are exposed to high levels of air pollution [2,3,4,5]. The adverse concentrations often exceed the WHO guidelines, especially the currently established, more restrictive limits [6]. Exposure to particulate matter, ozone, nitrogen oxides, and other pollutants is associated with serious health problems [7], including premature mortality in European cities.
According to the above EEA reports, the most premature deaths related to nitrogen dioxide pollution in Europe were recorded in the main Western Europe conurbations, e.g., in Spain, Italy, France, and Belgium [8,9]. Although in Polish cities, particularly in Warsaw, the NO2 concentrations are comparatively slightly lower (Warsaw’s position is 24th in the NO2 ranking list of 1000 most polluted European cities [9], with 743 avoidable deaths, estimated according to the current WHO recommendations [6]), the overall air quality in Warsaw is much worse compared to other European capitals, mainly due to extremely high PM2.5 concentrations. A similar situation is also observed in most other Polish conurbations, which is the main reason for Poland suffering some of the lowest air quality [10,11,12] in Europe. This, in part, results from the burning of low-quality fuels in residential heating, as well as due to the country’s reliance on coal.
The municipal and housing sectors in Poland mainly use coal fuel [13,14,15]. Emitters related to the individual heating of apartments and buildings are located in residential areas, and the related pollutions usually occur at a low height above the ground level. As a result, these emissions directly affect concentrations of the pollutants in places where people live and often exceed the air quality standards, especially for PM2.5. In 2018, the emissions in Poland from this source category accounted for approximately 47% of total PM10 dust emissions and 52% of total PM2.5 emissions. In the abovementioned list of 1000 most PM2.5 polluted European cities [9], Warsaw’s ranking position was 20 (with five other Polish cities having an even higher rank), with 2023 avoidable deaths according to WHO regulations [6]. It was also confirmed by [8,12] that the annual mean concentration of PM2.5 particles in Poland was worst in all the EU, where 30 Polish cities were among 100 most polluted European ones.
This situation means that any effective scenario of air quality improvement in Warsaw must simultaneously take into account a reduction in both dominating pollution categories, the road traffic-induced NOx concentrations, as well as PM2.5 and BaP (benzo[α]pyrene) pollutions, also emitted mainly by the municipal sector. The effectiveness of possible corrective actions in both cases will be directly dependent on the government’s energy and climate policy implemented in the coming years.
The Fit for 55 package adopted on 14 July 2021 by the European Commission [16] modifies the existing climate and energy legislation to meet the new EU objective of a minimum 55% reduction in greenhouse gas (GHG) emissions by 2030 (as compared with 1990 levels). Directly related to the Commission’s 2030 Climate Target Plan [17,18,19], it not only explicitly supports the 55% GHG target, but also indicates that 38–40% renewable energy sources (RES) share by 2030 is the minimum necessary to meet this goal.
As stated above, many Polish conurbations are among the most polluted ones in Europe. Recent years have seen grassroots initiatives, as well as very little governmental effort aiming to reduce pollution levels, with minor results. In 2021, the share of coal in the energy mix for the first time dropped below 70%, with a simultaneous 17% share of RES [20]. The current economic and political situation in Europe forces a radical reduction in fossil fuels; however, in the case of Poland, the achievement of the EC strategic goals is rather unrealistic [21,22]. However, an announcement [23] was aimed at bringing the Polish fuel mix closer to EU requirements. At the same time, local authorities of the most polluted conurbations are taking their own initiatives to reduce the level of the most troublesome pollutants, while researchers are looking for the adequate strategies to obtain this goal. For example, the authors of [24,25,26,27] identified the main sources responsible for standards violations and presented selected results focused on air pollution mitigation in Polish cities (Cracow and Warsaw). There are also numerous case studies dealing with air quality deterioration in major European cities, caused by both urban transport and other municipal sources. Most of the studies (e.g., [28,29,30]) focused on assessing the impact of urban transport on air quality in the city, where the authors of [30] additionally utilized the AERMOD modeling system to assess emission scenarios to reduce the high level of population exposure caused by the traffic-related NOx pollution in Trabzon, Turkey region. Furthermore, the authors of [31,32,33] analyzed hypothetical emission reduction strategies related to PM and NOx pollutions of urban areas.
This study was aimed at a quantitative assessment of the possible improvement of air quality in Warsaw, Poland, resulting from a reduction in pollution emissions mainly caused by road traffic and coal-fueled municipal installations. Projects recently launched by the Warsaw authorities are considered, regarding both residential heating and urban transportation, where the general trends in the transportation sector development and modernization were additionally taken into account. To fully assess environmental benefits coming from implementation of these corrective actions, the emission inventory for the year 2018/2019 (prior to the project initialization) was taken as the baseline dataset.
2. Methods
Modeling of atmospheric pollution dispersion in the city was carried out using the Gaussian modeling system CALPUFF, v.7.0 [34] with the CALMET meteorological preprocessor. The linear structure of the CAPUFF model enables independent analysis of the impact of the municipal and transportation sectors, while utilizing superposition of the results to estimate the final assessment of the decarbonization scenario. This linearity property was also used in the estimation of the final environmental effects (more information on CALPUFF system calculations and the model prediction accuracy and uncertainty can be found in [35,36,37]). Using this system, spatial maps of the annual average concentrations of the main air pollutants were obtained in order to determine areas where the permissible concentration levels of individual pollutants were exceeded and to identify the sources of emissions responsible for these exceedances.
The study domain considered in the computer simulation includes the Warsaw metropolitan domain (inside the capital administrative boundary), as well as the surrounding vicinity belt, about 30 km wide (Figure 1). The emission field combines a large number of sources that differ in technological parameters, emission characteristics, composition of emitted compounds, and assigned uncertainty [27,38]. In this study, the sources were divided into three basic categories, according to their emission parameters: (a) point sources (4073), (b) line sources of the transport networks (1806 + 4918), and (c) area sources of the municipal sector (1452 + 5819). All emitters for the pointwise sources were kept in one file (the number of sources in brackets). In the area and line sources, the emitters were divided into two subsets: sources located within the city domain and those in the outer belt (the respective components are shown in brackets) to help in assessing the contribution of the surrounding emission field to the total urban pollution. The external inflow of pollutants entering the study domain was also taken into account, calculated offline using the regional-scale CAMx model, with all categories of emission sources located in Poland, outside the analyzed region. The resulting concentration field, including primary and secondary pollutants (e.g., aerosols), was the pollution background to which the CALPUFF forecast was added.
For calculation of the pollutant concentrations, the Warsaw metropolitan area (about 520 km2 within administrative boundaries) was digitized with a homogeneous grid 0.5 km × 0.5 km. The aggregated resolution of 1 km × 1 km was applied in the surrounding belt, where the satellite cities were also discretized using a fine-resolution grid. Using emission data given in these grids, the resulting concentrations were calculated in 2111 elementary mesh receptors inside Warsaw’s administrative area (compare Figure 1). The calculations were performed for emission and meteorological data in 2018 [14,15]. According to the goal of this study, the following pollutants characterizing the urban atmosphere were analyzed: PM10, PM2.5, NOx, and BaP. The average annual concentration values of individual pollutants, averaged over the area of a unit grid element, were adopted as the final value for each receptor.
3. Air Pollution in the Baseline Year
Computer simulations provided annual mean concentration maps, showing distributions of the main pollutants that characterize the urban atmospheric environment. They also indicated which pollutants exceeded the WHO limit values and where these violations were the highest. The linear structure of the CALPUFF model allowed indication of the emission categories responsible for standards violation (source apportionment). Moreover, it was possible to quantify the percentage share of an individual emission source category in the total concentration at a given receptor point or in a district. This is very useful for elaborating an abatement strategy to improve the city air quality.
Figure 2 presents the resulting concentration maps of the key pollutants, NOx and PM2.5, calculated for the baseline emission dataset in 2018. As compared with the previously obtained outputs [27,38,39], computation results differed in the spatial distribution of some pollutants, particularly PM and BaP, although not particularly in the overall health pollution impacts. This was mainly due to different meteorological conditions but also to some extent to conurbation development. The wind field in Warsaw, similarly to the entire territory of Poland, is usually dominated by western circulation. In 2018, however, the westerly and easterly winds were more balanced (compare Figure S1). Comparison of this and previous spatial distributions also indirectly indicated the high impact of pollutions inflowing from the surrounding belt on pollution concentrations in the city itself.
As shown in Figure 2, the air quality standards for the polluting compounds considered were exceeded in a large part of the city area. In particular, according to the current Polish regulations, as well as EU Air Quality Directives [40], the annual mean NOx concentration limit (30 μg/m3) was exceeded in 50% of the receptor points, while the respective limit value for PM2.5 (25 μg/m3) was exceeded in about 62% of receptors. The calculated PM10 and BaP pollution concentrations also exceeded the respective limit values (40 μg/m3) for PM10 in 33% of the receptors, as well as that (1 ng/m3) for BaP in the entire urban area. This reflects a general situation related to the strong domination of coal in the fuel mix in Poland [4,10,26,38,41]. Furthermore, the modified and much more restrictive WHO air quality guidelines [6] for the pollutants discussed here were exceeded in the entire study domain.
The quoted above shares of receptor points where the limits were exceeded are smaller than those calculated for 2012 emission dataset [27,38], which were equal to 64% for NOx and 75% for PM2.5. At the same time, the spatial distributions of pollutants for 2012 and 2018 differed quite significantly from each other. This was mainly seen for NOx, whose concentrations were strongly dispersed in the 2012 case study, with the maximum values in the central districts. On the other hand, in the year 2018, the car-induced pollutions were much less dispersed, but clearly concentrated along the main streets. This was caused, first of all, by strong administrative limits imposed in last few years on the car traffic in the city center. Moreover, the S8 expressway, launched in stages in 2013–2015, currently crosses the northern districts of the city (compare Figure 2) and handles very heavy traffic, including the intensive truck transit. This results in high pollution around the entire street, with the maximum NOx concentrations occurring just along this route. Spatial distributions of PM concentrations (including PM2.5) for 2012 and 2018 case studies differed mainly due to different dominating wind directions (as stated above). However, the average BaP concentrations showed a significant increase (about 50%) in 2018 compared to 2012. This increase was, in similar proportions, due to three basic groups of the area sources: Warsaw’s local emitters, sources located in the immediate vicinity of Warsaw, and the external inflow.
4. Projected Decarbonization Modernization
4.1. Official Plans and Scenarios Considered
The official document of the Ministry of Climate and Environment On the state’s energy policy until 2040 [23] presents activities aimed at bringing Polish fuel mix closer to the EU requirements, despite the existing limitations. According to this document, the share of coal in the structure of energy consumption in 2030 will be at most 56%, with a simultaneous increase in the share of RES to at least 23% in gross final energy consumption (at least 32% in the electricity sector). The increase in the share of renewable energy sources is expected to be mainly possible thanks to new onshore and offshore wind farms, photovoltaics, and heat pumps in the individual housing installations.
According to the program launched in 2020 by the Warsaw authorities [42], it is planned to substantially modernize municipal coal fueled installations within the next few years and substantially reduce PM2.5 and BaP exposures. Currently, the impact of this program will be radically strengthened and extended to the entire Mazovian Voivodeship thanks to the initiative presented in Section 4.2 [42].
In the sequel, two emission abatement scenarios are discussed. They are connected with: (a) particulate matter pollutions (including PM10, PM2.5, and BaP), mainly depending on residential sector activity, and (b) NOx pollution where urban road traffic is the dominant contributing sector. However, the municipal emissions also partially contribute to NOx pollution, and the transport sector activity affects particulate matter concentrations.
The three basic scenarios considered in this study are as follows:
- Baseline share of main emission categories (2018 emission dataset),
- Reduction in the area emission from municipal sector, due to regulations on the limit on coal fired installations in Warsaw and vicinity, and the national level act on fuel mix decarbonization (horizon 2030)—Section 4.2,
- On top of B, imposing the restrictive emission standard for the car fleet in Warsaw (to E4 norm at least) and taking into account the forecasted increase in the share of electric cars (horizon 2030)—Section 4.3.
4.2. Municipal Sector Modernization
Particulate matter, PM10 and PM2.5, including carcinogenic BaP, constitutes a group of hazardous to health pollutants, whose dominant share comes from the area sources of the municipal sector (mainly due to coal combustion), located both in the city and in its vicinity. In this case, the transboundary inflow (Figure 1) of pollutants also plays an important role, while the impact of road traffic is generally minor.
Regulations on the Anti-Smog Resolution [39] for Warsaw and its wide surroundings approved (26.04.2022) by the authorities of the Mazovian Voivodeship introduced the ban on burning coal in ordinary fireplaces in Warsaw from 2023 and throughout the Mazovian Voivodeship from 2028. The only approved furnace type is the low-emission class 5 boiler [43], which guarantees a radical reduction in particulate matter and organic compounds (BaP) emissions (compare Table S4). Thus, the above regulations mean a significant reduction in PM and BaP emissions from area sources, located both in the city and in its vicinity. The calculations performed for the baseline data show that this category of emission sources was responsible for about 50% of particulate matter pollutants and more than 70% of BaP.
Actually, efficiency of this modernization ranged from 20% to 60% and depended primarily on the parameters of the replaced boiler (Table S4). Since rather low-quality boilers (mostly of class 3) are expected in the case considered, the value 50% was assumed in the calculations as the average emission reduction factor. In the case of an action covering such a large area and a number of replaced sources, a certain number of installations usually cannot be modernized (for various reasons). Thus, it was assumed that the modernization would be implemented in at least 80% of the considered installations, which in turn would mean about a 40% reduction in the baseline emissions for PM10 and PM2.5.
According to the official documents of the Ministry of Climate and Environment concerning decarbonization policy of the Polish economy [23], by the end of this decade, the share of coal in the country’s energy needs is to drop to at least 56% (from the current 70%), with an equivalent increase in the use of renewable sources. This means about a 20% decrease in the volume of pollutants emitted nationwide, which translates into a corresponding reduction in the transboundary inflow.
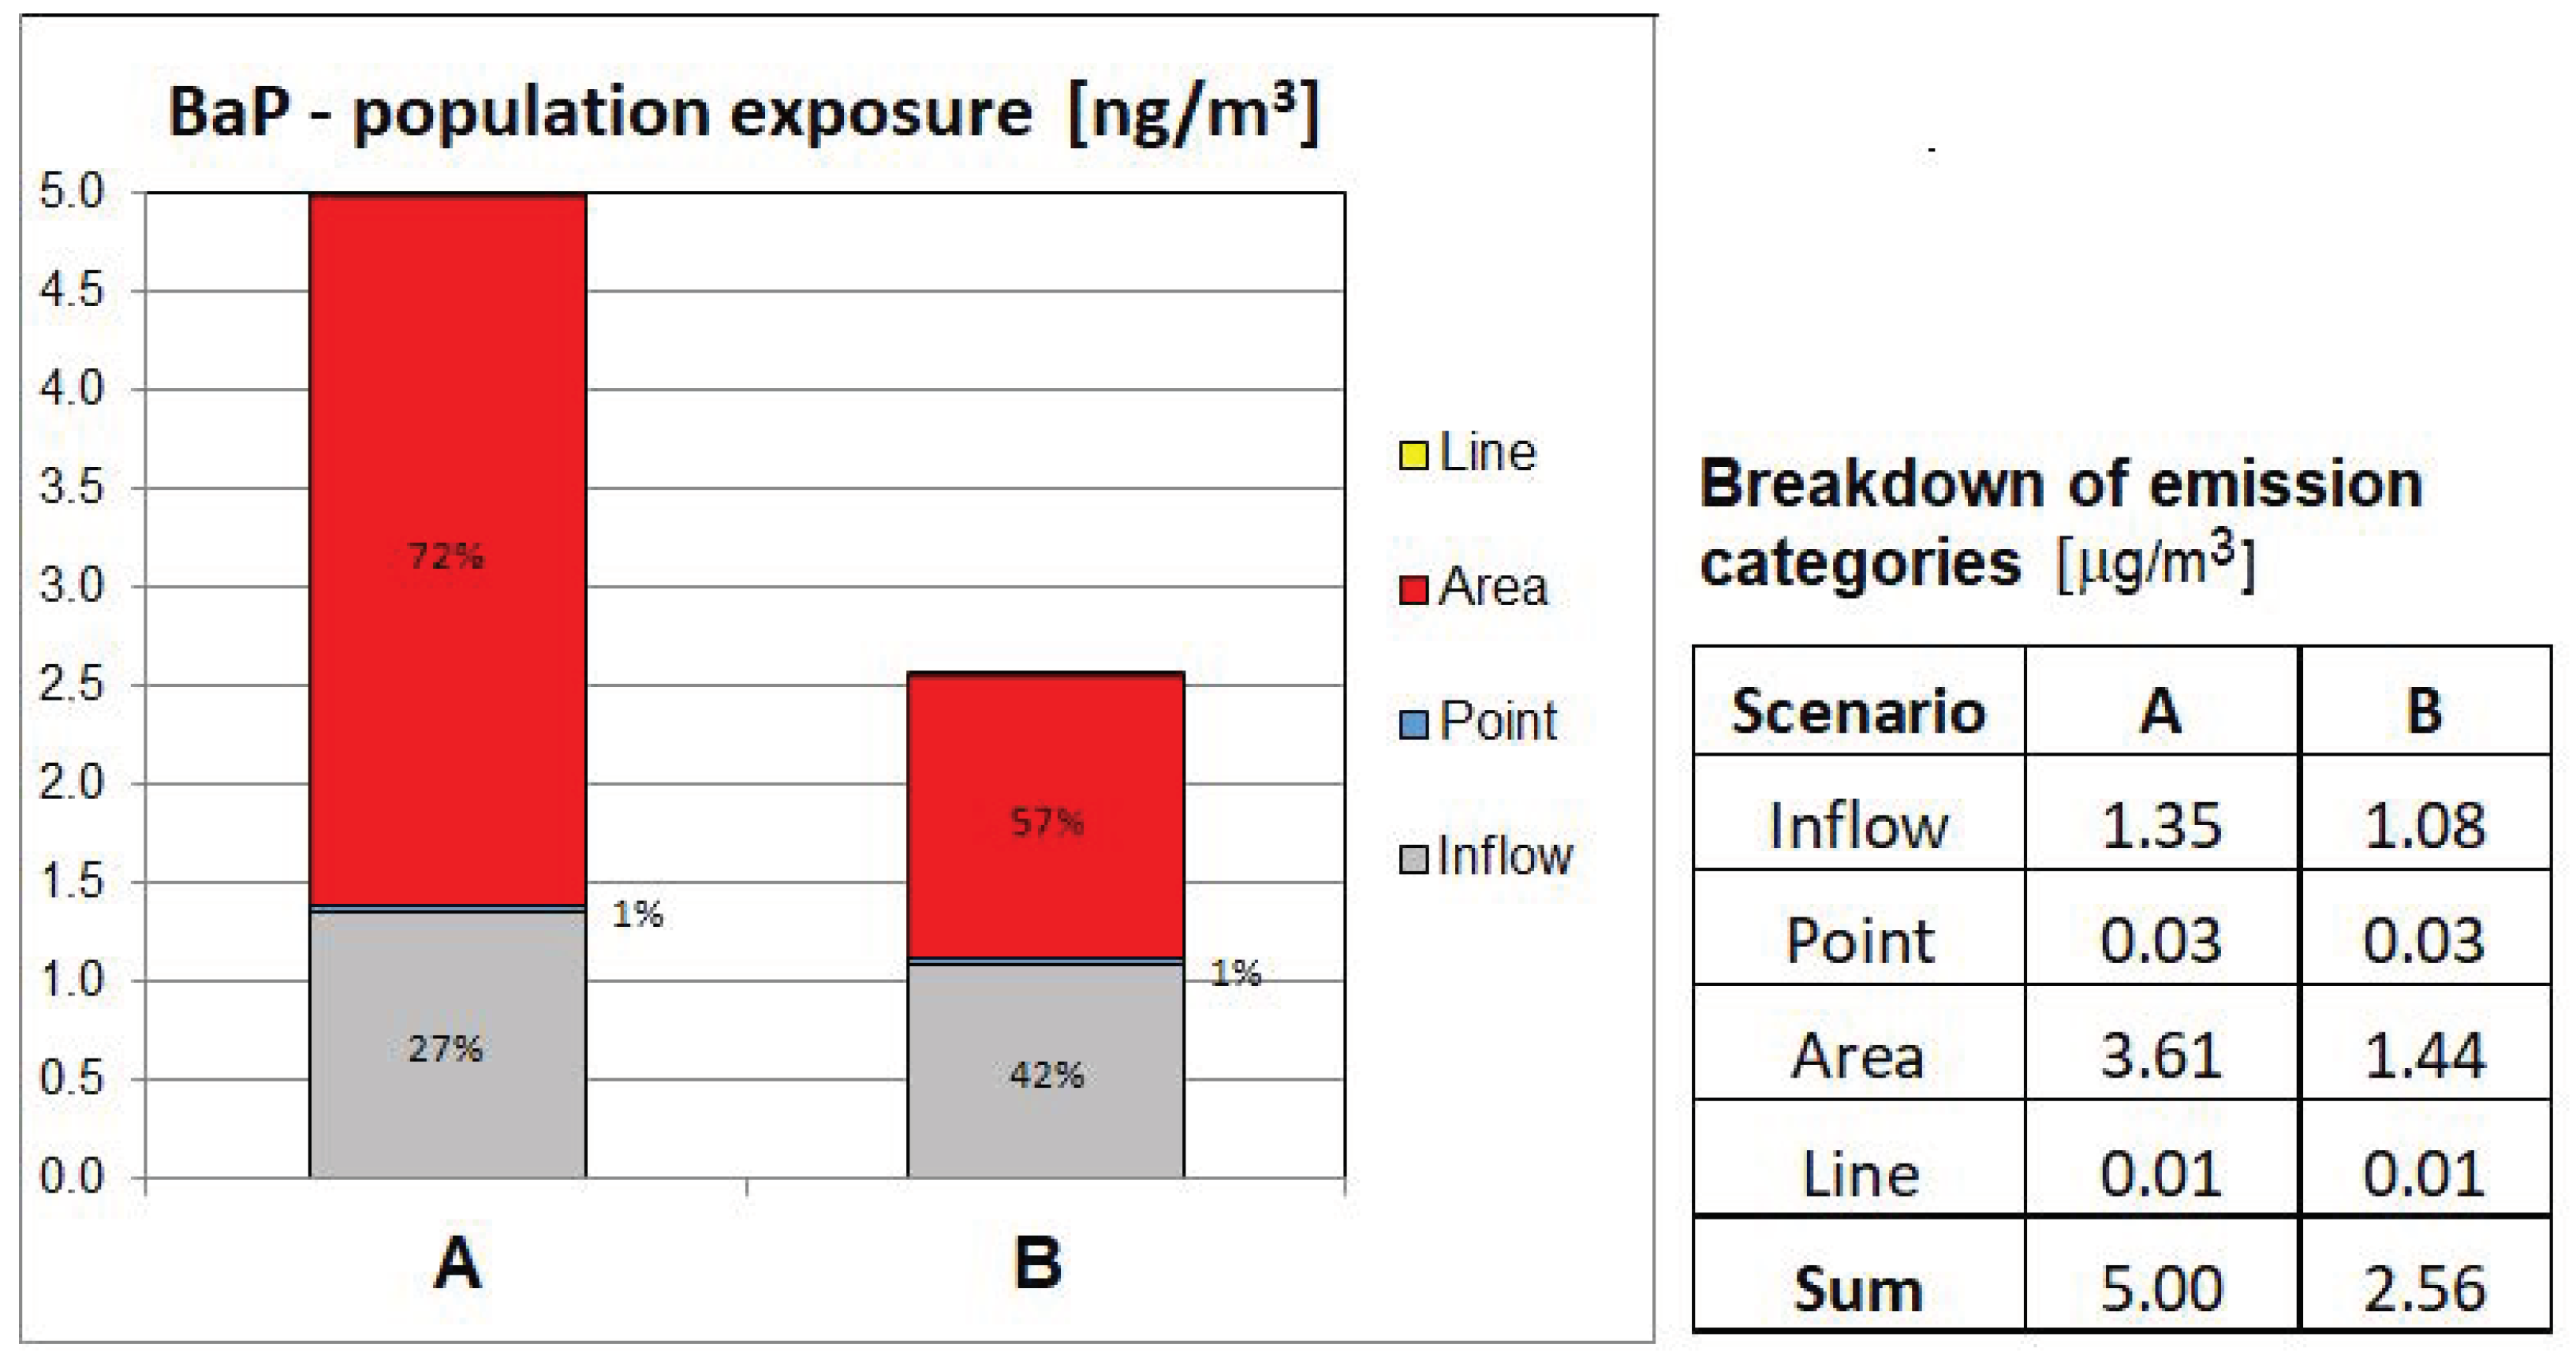
A similar efficiency of BaP emission reduction ranges from 30% to 75% (Table S4) column OGC (organic gaseous carbon) that includes, in addition to BaP, other harmful PAHs (polycyclic aromatic hydrocarbons) and dioxins. Thus, on the basis of the same arguments, 50% can be taken as the average value of BaP emission abatement from the area sources. The overall BaP concentration is about 70% contributed from the area sources and about 30% contributed from the transboundary inflow (Figure 6 (A)). Application of class 5 boilers denotes in this case about a 60% reduction in BaP emission. Moreover, the planned fuel-mix decarbonization causes, as previously, a 20% reduction in the transboundary component. The resulting concentration at the end of 2030 is shown -in Section 5.
As shown in Figure 3 (A), the area sources significantly contribute (about 20%) to the final NOx concentration for the baseline emission dataset. On the other hand, as follows from [43], low-emission class 5 boilers, meeting the Ecodesign Directive, also reduce NOx emissions by about 50–60%, as compared with the currently used, low-class installations (see also Table S4). Moreover, taking into account the approximately 16% reduction in the transboundary NOx inflow, due to the fuel mix modifications, we obtain an additional reduction of approximately 10% in the overall NOx exposure.
4.3. Urban Transport Modernization
The scenario connected with the environmental influence of urban road transport takes into account several factors that, taken together, should visibly reduce the negative impact of this sector. First of all, on the basis of earlier results [27,28], effects of the passenger fleet modernization in terms of meeting EU emission standards should be considered. The analysis utilizes results of [28,29] where, using the national emission data, the NO2 emission rates per fuel and Euro Norm for 30 European cities were collected. Furthermore, the Warsaw transportation system was fully specified there, including the fleet composition, fuel type used, yearly distance driven, and emission rates connected with the Euro norms depending on car production years. These data can be used to assess the emission reduction rate that may relate to the emission scenario being implemented. Below, we assume the respective emission rate reduction of cars from E0–E3 categories, which will be replaced by newer ones, meeting the Euro 4 standard, at least. The required emission data are shown in Table 1, which is an aggregated form of the detailed specification in [27,29].
Table 1 shows a dominant share of high emission (pre-E4) cars in Warsaw’s car fleet. Using these data, it can be estimated that implementation of the assumed modernization scenario implies about a 22% emission reduction in the passenger car category.
The rapidly growing segment of electric cars will also contribute to reducing air pollution coming from road transport. This upward trend is additionally accelerated by appropriate financial incentives, as well as by the general EU policy in this field. Thus, the resulting cumulative number of battery electric vehicle (BEV) registrations in 2030 may exceed 955,000 cars [44,45]. There should be added to this number plug-in hybrids vehicles (PHEV), which in Poland in 2030 is forecasted at 653,000 cars. Thus, in 2030, up to 1.6 million electric cars (mainly passenger vehicles) may exist on Polish roads. According to estimates [45], about one-quarter of all electric vehicles have been registered in Warsaw, which means a cumulative number of about 400,000 electric cars in 2030, representing approximately 30% of all passenger cars in the city. Given the approximately 60% share of BEVs among electric vehicles, an additional reduction in emissions for this vehicle category can be estimated at about 15%.
Fulfilling the Euro 4 emission standard by the truck/van vehicles and taking into account a minor share of electric units will also result in a certain reduction in this category’s emission. Taking into account appropriate unit norms for HDV cars (Table S3), the overall reduction for this vehicle category was estimated at about 22%.
At the end of 2021, 27% of the public transport buses were low-emission vehicles, i.e., LNG/CNG, along with rather few electric units. According to the plans of the Public Transport Authorities [46] in Warsaw, by the end of 2022, the share of this class of vehicles is to be 38%, while, in 2030, whole bus transport in the city will be performed by low-emission and zero-emission (electric) vehicles. The corresponding emission reduction resulting from this modernization has been estimated to be at around 16%.
The carbon monoxide (CO) concentration in the city mainly depends on the emissions of gasoline passenger cars. However, the calculations on the baseline dataset showed that the CO concentrations in the city are well below the relevant WHO limits [6].
Modernization of the car fleet also affects the total dust pollution, but rather insignificantly, as the contribution of this sector is 23% and 14% in the case of PM10 and PM2.5 pollutants, respectively (compare Figure 4 and Figure 5 (A)). In addition, in the case of particulate matter, the modernization process only reduces the emissions coming from the fuel combustion (primary), approximately 18% for PM10 and 40% for PM2.5 of these emissions [13,27], while the secondary emissions (resuspended) dominate, especially in the case of PM10.
Table 1 shows that pre-E4 cars cover 75% of the total distance traveled by passenger vehicles. Extending this relation to other car vehicles and taking into account Euro Norm limits for dust (Tables S1–S3), it is possible to estimate the related reduction in PM emissions as 6% for PM10 and 11% for PM2.5. The increase in the number of electric cars, mainly passenger ones, projected at the end of the decade, will also contribute to the reduction in dust emissions. As indicated earlier, the estimated share of BEV/HPEV cars is around 30% of all passenger cars. Taking into account the share of passenger cars in the entire vehicle fleet, the resulting emission reduction can be estimated at 3% and 5%, for the considered PM categories. In addition, a slight reduction in PM concentrations resulting from the modernization of truck/van vehicles should be taken into account (respectively 3% and 5%). Thus, the overall reduction in PM emission related to the contribution of the transportation sector can be estimated at 13% and 21% for PM10 and PM2.5, respectively (see also Figure 4 and Figure 5).
5. Comparative Simulation Results
The results presented below illustrate the environmental impact of the implementation of the emission reduction scenarios on the appropriate reduction of the negative influence of the four key pollutants discussed in the previous sections, NOx, PM10, PM2.5, and BaP. The final impact of each scenario defined in Section 4 is expressed as population exposure to the individual pollutant, calculated as the population-weighted averaged concentration within the Warsaw’s receptor field (Figure 1, inside the administrative border).
For each pollutant, one of the scenarios is predominant, while the other has a complementary effect. In order to standardize the message, the same sequence of scenarios in all figures was adopted. Scenario B (municipal sector and national economy decarbonization) is a natural approach for particulate matter pollutants, while scenario C (car fleet modernization added to B scenario) gives obviously the most significant benefit for NOx, which can be seen when comparing B and C steps. However, the municipal sector contributes quite significantly to NOx pollution, via both the area and the transboundary inflow. Since low-emission boilers installed in municipal sector also reduce NOx emission, scenario B implementation implies approximately a 10% reduction in NOx pollution.
In the case of PMs pollutions, scenario B has a dominant impact on the emission reduction, which is visible in Figure 3, Figure 4, Figure 5 and Figure 6 (B). The effect of modifying the transport sector, by reducing pollution from fuel combustion, is insignificant in this case. This is because resuspended particulate matter (secondary emissions) is predominant in PM10 emissions, while, in PM2.5, where secondary emissions have a lower share, the total influence of linear sources is small. The total reduction attributable to the line sources is about 2%, which can be seen in the transition from scenarios B to C in Figure 4 and Figure 5.
The concentration of BaP depends entirely on the emission of area sources, located both in the city and in its surroundings (the share of other types of sources is below 1%). As the low-emission boiler technology enables a significant reduction in BaP emission (Table S4), the total improvement in air quality in this case is close to 50%.
6. Discussion
According to many assessments [8,9,12], ambient air quality in Warsaw is one of the worst among large European cities. One, although not dominant reason, is the high level of car traffic and the associated emissions of nitrogen oxides, NOx. However, the main factor that determines bad air quality in Warsaw is the extremely high (for European conditions)concentration of particulate matter, especially PM2.5 and the carcinogenic BaP. This is due to many years of dependence on coal (hard coal and lignite) of the Polish national energy and the municipal sectors. Therefore, high concentrations of PMs in Warsaw come from overlapping impacts of local sources, including to a large extent those located in the city’s surroundings, as well as the transboundary inflow. As a result, the concentrations of PMs pollutants in a large area of the city exceed the WHO limit values, which were recently significantly tightened [6].
Emission abatement strategies discussed in the paper take into account technological progress and general trends observed, for example, in the transportation sector, as well as pro-ecological policies implemented by the EU regulations, including relevant legislative initiatives referring to both a national and a regional level. Using the 2018 emission inventory as the baseline dataset, two scenarios of emission reduction are considered. Scenario B, related mainly to PM pollution, follows the very restrictive legislative decision [47] of the Mazovian Voivodship concerning coal-fired installations in Warsaw and its vicinity (the latter emission abatement decisions are to be implemented by 2028), as well as the national-level legislation related to coal share reduction in the fuel mix with a simultaneous increase in the use of renewable sources. Scenario C, which mainly reflects the car fleet modernization (reduction of pre-E4 vehicles) and rapidly increasing share of electric cars (BEV/PHEV), is mainly responsible for NOx pollution.
A key factor of this strategy is the carbon footprint of electric cars, primarily related to battery manufacturing. As shown in the ICCT report [48], even when the battery-related footprint is added to the total life cycle of car production, the overall carbon footprint is definitely lower than that attributed to a comparable combustion car. The main problem in this case is the share of fossil fuels in the fuel mix of the electrical energy sector used for charging the car batteries, which is high in Poland. However, as shown in [49,50,51], even with such an unfavorable energy mix as for Poland in 2018, usage of electric cars lead to a reduction (albeit small one) in the carbon footprint. Therefore, taking into account the results presented above, the implementation of emission abatement scenarios discussed in this paper can result in a further reduction in the carbon footprint, associated with both the road traffic and the municipal sector.
In addition to the air pollution-related deaths, the climate policy will result in reduction in diet-related deaths and deaths due to physical inactivity [52]. The latter is related with active transportation [53], particularly cycling, which has been developed quite extensively in Warsaw. Although this change in transportation only marginally improves the air quality [27], the health impact connected with intensified physical activity is definitely positive in Warsaw air pollution conditions [54]. A negative factor of more intensive cycling and walking is caused by the connected increased rates of traffic incidents, although this is estimated to be minor in comparison with the health benefits gained by the physical activity [53].
An additional advantage of transportation changes is related to the reduction in noise. Driving technologically more advanced cars, particularly hybrid and electric ones, using electric scooters, cycling, or walking instead of driving significantly lowers the noise level coming from transportation, which is a main source of urban noise and reduces the connected health risk [39,53].
7. Conclusions
The paper presented an analysis of consequences of implementing the official scenario prepared for air quality improvement in Warsaw, Poland, particularly in terms of the population exposure and the associated health risk at the end of the present decade. The main tool used was a Gaussian system CALPUFF for modeling atmospheric pollution dispersion. Four pollutants, NOx, PM10, PM2.5, and BaP, all of which presently exceed environmental limits in Warsaw, were considered.
Results showed a reduction in population exposure attributed to the specific pollutants and scenarios being implemented. The final reduction in population exposure to NOx was about 28%, as depicted in Figure 3. This means that the base avoidable mortality assigned to this pollutant, 743 avoidable deaths [9], would be reduced by about 204 cases. The analogous result for PM2.5 was more significant (Figure 5). Here again, the ~30% reduction in population exposure would reduce the avoidable yearly deaths by 607 cases, from the initial value of 2023 avoidable deaths. The reduction in exposure to PM10 (Figure 4) was similar, amounting to about 28%, while, for carcinogenic BaP (Figure 6), it was as much as approximately 50%. In the latter case, the concentration depended solely on the municipal sector emissions and the transboundary inflow, while the influence of other sources was negligible.
The considered undertakings would considerably improve air quality, but they are not sufficient. However, the processes of reducing the main polluting compounds, which are essential for air quality in the city and are presented in this paper, will be continued in the next decade. The basic EU regulations [16,18] will force the acceleration of the national economy decarbonization processes and a significant increase in the share of renewable energy sources in the fuel mix. European Union has an ambitious goal to become a climate-neutral continent by 2050 [40]. As a consequence, this will also force a further reduction in dust emissions, both from the local sources and from the transboundary inflow. In line with the above policy, electric vehicles (BEVs/PHEVs) are expected to have a dominant share in the car fleet, in both private and public transport [55,56]. To achieve this target, the European Commission announced a multitude of new legislative proposals in the coming years, where many of them target transport [57]. In particular, the European Parliament approved an effective EU ban on the sale of new petrol and diesel cars from 2035, to speed Europe’s shift to electric vehicles [58].
Paradoxically, due to the country’s significant backwardness compared to the EU average, Poland has potential opportunities to effectively implement recovery plans and to clearly improve air quality. This depends substantially on policies of the city, province, and country authorities. Implementation of these plans is subject to high uncertainty. Imagination of future conditions in even a couple of years may be far from reality. Recent events such as the COVID-19 pandemic, the energy resource crisis connected with the war in Ukraine, or economic turbulences caused by both these events, make this clear. During the pandemic, air quality tended to improve due to highly limited transportation because virtual meeting technologies reduced commuting and business travel. On the other hand, home delivery caused enhanced delivery truck and van traffic. Both these trends are seemingly continuing, despite being rather difficult to foresee when plans were made a few years ago. The energy resource crisis made the achievement of the presupposed goals questionable, also affected by the more difficult economic conditions. However, our considerations span to rather many years ahead; hence, we hope that these important environmental plans will not be substantially reduced or abandoned by these unforeseen perturbations.
Supplementary Materials
The following supporting information can be downloaded at: https://www.mdpi.com/article/10.3390/atmos13101613/s1, Table S1. Euro Norms for the gasoline cars; Table S2. Euro Norms for the diesel cars; Table S3. Euro Norms for HDV diesel cars; Table S4. Limit emission norms for low-emission boilers; Figure S1. Wind Rose for Warsaw 2018
Author Contributions
Conceptualization, P.H. and Z.N.; methodology, P.H.; software, A.K.; validation, Z.N., P.H. and A.K.; formal analysis, Z.N.; writing—original draft preparation, P.H.; writing—review and editing, Z.N.; visualization, A.K.; project administration, Z.N. All authors have read and agreed to the published version of the manuscript.
Funding
This research received no external funding.
Institutional Review Board Statement
Not applicable.
Informed Consent Statement
Not applicable.
Acknowledgments
Research conducted by Z. Nahorski was partially supported by the National Science Center, Poland under the Grant DEC-2018/30/Q/HS4/00764.
Conflicts of Interest
The authors declare no conflict of interest.
References
- EEA. Europe’s Air Quality Status 2022. Available online: https://www.eea.europa.eu/publications/status-of-air-quality-in-Europe-2022/europes-air-quality-status-2022 (accessed on 12 March 2021).
- EC. Urban Air Pollution—What Are the Main Sources across the World? 2015. Available online: https://ec.europa.eu/jrc/en/news/what-are-main-sources-urban-air-pollution (accessed on 12 March 2021).
- EC. Air Quality: Traffic Measures Could Effectively Reduce NO2 Concentrations by 40% in Cities. 2019. Available online: https://ec.europa.eu/jrc/en/news/air-quality-traffic-measures-could-effectively-reduce-no2-concentrations-40-europe-s-cities (accessed on 12 March 2021).
- EEA. Exceedance of Air Quality Standard in Europe. 2018. Available online: https://www.eea.europa.eu/ims/exceedance-of-air-quality-standards (accessed on 12 March 2021).
- ETC/ATNI Report 2019/9. European Air Quality Maps for 2017. 2019. Available online: https://www.academia.edu/77543868/ETC_ATNI_Report_2019_9_European_air_quality_maps_for_2017_PM10_PM2_5_Ozone_NO2_and_NOx_spatial_estimates_and_their_uncertainties (accessed on 12 March 2021).
- WHO. WHO Global Air Quality Guidelines. 2021. Available online: https://apps.who.int/iris/handle/10665/345329 (accessed on 12 March 2021).
- WHO. Ambient (Outdoor) Air Pollution. 2018. Available online: https://www.who.int/news-room/fact-sheets/detail/ambient-(outdoor)-air-quality-and-health (accessed on 12 March 2021).
- AIR8. Most Polluted Cities in Europe in 2021. Available online: https://air8.tech/most-polluted-cities-in-europe-in-2021/ (accessed on 12 March 2021).
- ISGlobal—Ranking of Cities. 2021. Available online: https://isglobalranking.org/ranking/#air (accessed on 12 March 2021).
- EEA. Report, No 10/2019. Air Quality in Europe—2019 Report. Available online: https://www.eea.europa.eu/publications/air-quality-in-europe-2019 (accessed on 20 July 2021).
- EEA. Report 2020. Available online: https://www.eea.europa.eu/publications/air-quality-in-europe-2020-report (accessed on 15 September 2021).
- EEA. Air Quality in Europe 2021. Available online: https://www.eea.europa.eu/publications/air-quality-in-europe-2021 (accessed on 20 September 2021).
- GIOS. Yearly Assessment of Air Quality in the Mazovian Voivodship. Report for the Year 2018. 2019. Available online: https://powietrze.gios.gov.pl/pjp/rwms/publications/card/3 (accessed on 20 September 2021). (In Polish)
- GIOS. Yearly Assessment of Air Quality in the Mazovian Voivodship. Report for the Year 2019. 2020. Available online: https://powietrze.gios.gov.pl/pjp/rwms/publications/card/1162 (accessed on 20 September 2021). (In Polish)
- GIOS. Yearly Assessment of Air Quality in the Mazovian Voivodship. Report for the Year 2020. 2021. Available online: https://powietrze.gios.gov.pl/pjp/rwms/publications/card/1421 (accessed on 20 September 2021). (In Polish)
- FIT55. EU Fit for 55 Package. 2021. Available online: https://europeanclimate.org/the-fit-for-55-package/ (accessed on 15 May 2022).
- EC. EU Green Deal. 2019. Available online: https://ec.europa.eu/info/strategy/priorities-2019-2024/european-green-deal_en (accessed on 15 May 2022).
- EC. 2021. Available online: https://ec.europa.eu/clima/eu-action/european-green-deal/2030-climate-target-plan_en (accessed on 15 May 2022).
- EC. The 8th Environment Action Programme till 2030. Decision (EU) 2022/591 of the European Parliament. 2022. Available online: http://data.europa.eu/eli/dec/2022/591/oj (accessed on 15 May 2022).
- Energy. Electricity Sources in Poland in 2020. 2021. Available online: https://wysokienapiecie.pl/35619-zrodla-energii-w-polsce-w-2020-mniej-wegla-wiecej-gazu-oze/ (accessed on 15 May 2022).
- FIT55 2022. Will the Polish RES Target Be Consistent with the EU Climate Policy? Available online: https://instrat.pl/fit-for-55/ (accessed on 15 May 2022).
- Energy 2022. Polityka Energetyczna Polski do 2040 r. Available online: https://bip.mos.gov.pl/strategie-plany-programy/polityka-energetyczna-polski-do-2040-r/ (accessed on 15 May 2022).
- MP 2021. Monitor Polski. Announcement (2.03.2021) of the Minister of Climate and Environment on Poland’s Energy Policy until 2040. Available online: https://www.gov.pl/web/climate/energy-policy-of-poland-until-2040-epp2040 (accessed on 15 May 2022).
- Bogacki, M.; Oleniacz, R.; Rzeszutek, M.; Bździuch, P.; Szulecka, A.; Gorzelnik, T. Assessing the Impact of Road Traffic Reorganization on Air Quality: A Street Canyon Case Study. Atmosphere 2020, 11, 695. [Google Scholar] [CrossRef]
- Juda-Rezler, K.; Reizer, M.; Maciejewska, K.; Błaszczak, B.; Klejnowski, K. Characterization of atmospheric PM2.5 sources at a Central European urban background site. Sci. Total Environ. 2020, 713, 136729. [Google Scholar] [CrossRef] [PubMed]
- Holnicki, P.; Tainio, M.; Kałuszko, A.; Nahorski, Z. Burden of mortality and disease attributable to multiple air pollutants in Warsaw, Poland. Int. J. Environ. Res. Public Health 2017, 14, 1359. [Google Scholar] [CrossRef] [PubMed] [Green Version]
- Holnicki, P.; Nahorski, Z.; Kałuszko, A. Impact of car fleet modernization on the traffic originated air pollution in an urban area—Case study. Atmosphere 2021, 12, 1581. [Google Scholar] [CrossRef]
- Degraeuwe, B.; Thunis, P.; Clappier, A.; Weiss, M.; Lefebvre, W.; Janssen, S.; Vranckx, S. Impact of passenger car NOx emissions on urban NO2 pollution—Scenario analysis for 8 European cities. Atmos. Environ. 2017, 171, 330–337. [Google Scholar] [CrossRef]
- Degraeuwe, B.; Pisoni, E.; Peduzzi, E.; De Meij, A.; Monforti-Ferrario, F.; Bodis, K.; Mascherpa, A.; Astorga-Llorens, M.; Thunis, P.; Vignati, E. Urban NO2 Atlas (EUR 29943 EN); Publications Office of the European Union: Luxembourg, 2019. [Google Scholar]
- Tezel-Oguz, M.N.; Sari, D.; Ozkurt, N.; Keskin, S.S. Application of reduction scenarios. on traffic-related NOx emissions in Trabzon, Turkey. Atmos. Pollut. Res. 2020, 11, 2379–2389. [Google Scholar] [CrossRef]
- Karagulian, F.; Belis, C.A.; Carlos Francisco, C.; Dora, C.F.C.; Prüss-Ustün, A.M.; Bonjour, S.; Adair-Rohani, H.; Amann, M. Contributions to cities’ ambient particulate matter (PM): A systematic review of local source contributions at global level. Atmos. Environ. 2015, 120, 475–483. [Google Scholar] [CrossRef]
- Kiesewetter, G.; Borken-Kleefeld, J.; Schöpp, W.; Heyes, C.; Thunis, P.; Bessagnet, B.; Terrenoire, E.; Gsella, A.; Amann, M. Modelling NO2 concentrations at the street level in the GAINS integrated assessment model: Projections under current legislation. Atmos. Chem. Phys. 2014, 14, 813–829. [Google Scholar] [CrossRef] [Green Version]
- Mediavilla-Sahagún, A.; ApSimon, H.M. Urban scale integrated assessment for London: Which emission reduction strategies are more effective in attaining prescribed PM10 air quality standards by 2005? Environ. Model. Softw. 2006, 21, 501–513. [Google Scholar] [CrossRef]
- Exponent. CALPUFF Version 7—Users Guide Addendum; Exponent, Inc.: Maynard, MA, USA, 2019; Doc. no. Z170308064614-0072. [Google Scholar]
- Holnicki, P.; Kałuszko, A.; Nahorski, Z.; Stankiewicz, K.; Trapp, W. Air quality modeling for Warsaw agglomeration. Arch. Environ. Prot. 2017, 43, 48–64. [Google Scholar] [CrossRef]
- Holnicki, P.; Kałuszko, A.; Trapp, W. An urban scale application and validation of the CALPUFF model. Atmos. Pollut. Res. 2015, 7, 393–402. [Google Scholar] [CrossRef]
- Holnicki, P.; Nahorski, Z. Emission data uncertainty in urban air quality modeling—Case Study. Environ. Model. Assess. 2015, 20, 583–597. [Google Scholar] [CrossRef] [Green Version]
- Holnicki, P.; Kałuszko, A.; Nahorski, Z.; Tainio, M. Intra-urban variability of the intake fraction from multiple emission sources. Atmos. Pollut. Res. 2018, 9, 1184–1193. [Google Scholar] [CrossRef] [PubMed]
- Tainio, M. Burden of disease caused by local transport in Warsaw, Poland. J. Transp. Health 2015, 2, 423–433. [Google Scholar] [CrossRef] [PubMed] [Green Version]
- EU. Air Quality Standards. 2021. Available online: https://www.eea.europa.eu/themes/air/air-quality-concentrations/air-quality-standards (accessed on 15 May 2022).
- EEA. Air Quality in Europe—2018 Report; EEA Report, No 12/2018. 2018. Available online: https://www.eea.europa.eu/publications/air-quality-in-europe-2018 (accessed on 15 May 2022).
- Anti-smog. 2022. Available online: https://www.powietrze.mazovia.pl/uchwala-antysmogowa/informacje-ogolne-na-temat-uchwaly-antysmogowej (accessed on 15 May 2022).
- LE-Boil. 2021. Available online: https://czysteogrzewanie.pl/podstawy/normy-emisji-i-sprawnosci-dla-domowych-kotlow (accessed on 15 May 2022).
- PSPA. 2021. Available online: https://www.teraz-srodowisko.pl/aktualnosci/elektromobilnosc-raport-PSPA-9889.html (accessed on 15 May 2022).
- EV Outlook. 2021. Available online: https://pspa.com.pl/2021/raport/najnowsza-edycja-jedynej-na-rynku-kompleksowej-analizy-sektora-e-mobility-w-polsce-polish-ev-outlook-2021-jest-juz-dostępna/ (accessed on 15 May 2022).
- BUS. 2021. Available online: https://www.transport-publiczny.pl/wiadomosci/mza-warszawa-do-konca-2022-r-38-autobusow-zero (accessed on 15 May 2022).
- Smoglab. 2022. Available online: https://smoglab.pl/zakaz-spalania-wegla-od-pazdziernika-2023/ (accessed on 15 May 2022).
- Messagie, M.; Boureima, F.-S.; Coosemans, T.C.; Macharis, C.; Van Mierlo, J.A. Range-Based Vehicle Life Cycle. Assessment Incorporating Variability in the Environmental Assessment of Different Vehicle Technologies and Fuels. Energies 2014, 7, 1467–1482. [Google Scholar] [CrossRef]
- Hamilton, I.; Kennard, H.; McGushin, A.; Höglund-Isaksson, L.; Kiesewetter, G.; Lott, M.; Milner, J.; Purohit, P.; Rafaj, P.; Sharma, R.; et al. The public health implications of the Paris Agreement: A modelling study. Lancet Planet. Health 2021, 5, e74–e83. [Google Scholar] [CrossRef]
- Mueller, N.; Rojas-Rueda, D.; Cole-Hunter, T.; de Nazelle, A.; Dons, E.; Gerike, R.; Götschi, T.; Int Panisi, L.; Kahlmeier, S.; Nieuwenhuijsen, M. Health impact assessment of active transportation: A systematic review. Prev. Med. 2015, 76, 103–114. [Google Scholar] [CrossRef] [PubMed]
- Tainio, M.; de Nazelle, A.J.; Götschi, T.; Kahlmeier, S.; Rojas-Rueda, D.; Nieuwenhuijsen, M.J.; de Sá, T.H.; Kelly, P.; Woodcock, J. Can air pollution negate the health benefits of cycling and walking? Prev. Med. 2016, 87, 233–236. [Google Scholar] [CrossRef] [PubMed] [Green Version]
- Mehling, D.; Woodward, H.; Oxley, T.; Holland, M.; ApSimon, H. Electrification of Road transport and the Impacts on Air Quality and Health in the UK. Centre for Environmental Policy, Imperial College London. Atmosphere 2021, 12, 1491. [Google Scholar] [CrossRef]
- UN Environment Programme. Available online: https://www.unep.org/resources/report/used-vehicles-and-environment-progress-and-updates-2021 (accessed on 15 May 2022).
- VIRTA. 2022. Available online: https://www.virta.global/blog/this-is-how-eu-regulation-accelerates-the-electric-vehicle-revolution (accessed on 15 May 2022).
- EU. 2022. Available online: https://www.france24.com/en/europe/20220609-eu-parliament-approves-ban-on-new-fossil-fueled-cars-b (accessed on 15 May 2022).
- ICCT. A Global Comparison of the Life-Cycle Greenhouse Gas Emissions of Combustion Engine and Electric Passenger Cars. 2021. Available online: https://theicct.org/publication/a-global-comparison-of-the-life-cycle-greenhouse-gas-emissions-of-combustion-engine-and-electric-passenger-cars/ (accessed on 15 May 2022).
- Messagie, M. Life Cycle Analysis of the Climate Impact of Electric Vehicles (2017) Semantic Scholar. Available online: https://www.semanticscholar.org/paper/Life-Cycle-Analysis-Of-The-Climate-Impact-Of-Messagie/1eb5b7c002404326dca2391b2004daa56dc18028 (accessed on 15 May 2022).
- EV F-PRINT. 2021. Available online: https://ev.auto-swiat.pl/wiadomosci/auta-elektryczne-juz-dzis-pozostawiaja-mniejszy-slad-weglowy-niz-spalinowe/m1ct39h (accessed on 15 May 2022).
Figure 1.
The study domain covering receptor area, inside Warsaw and in its vicinity.
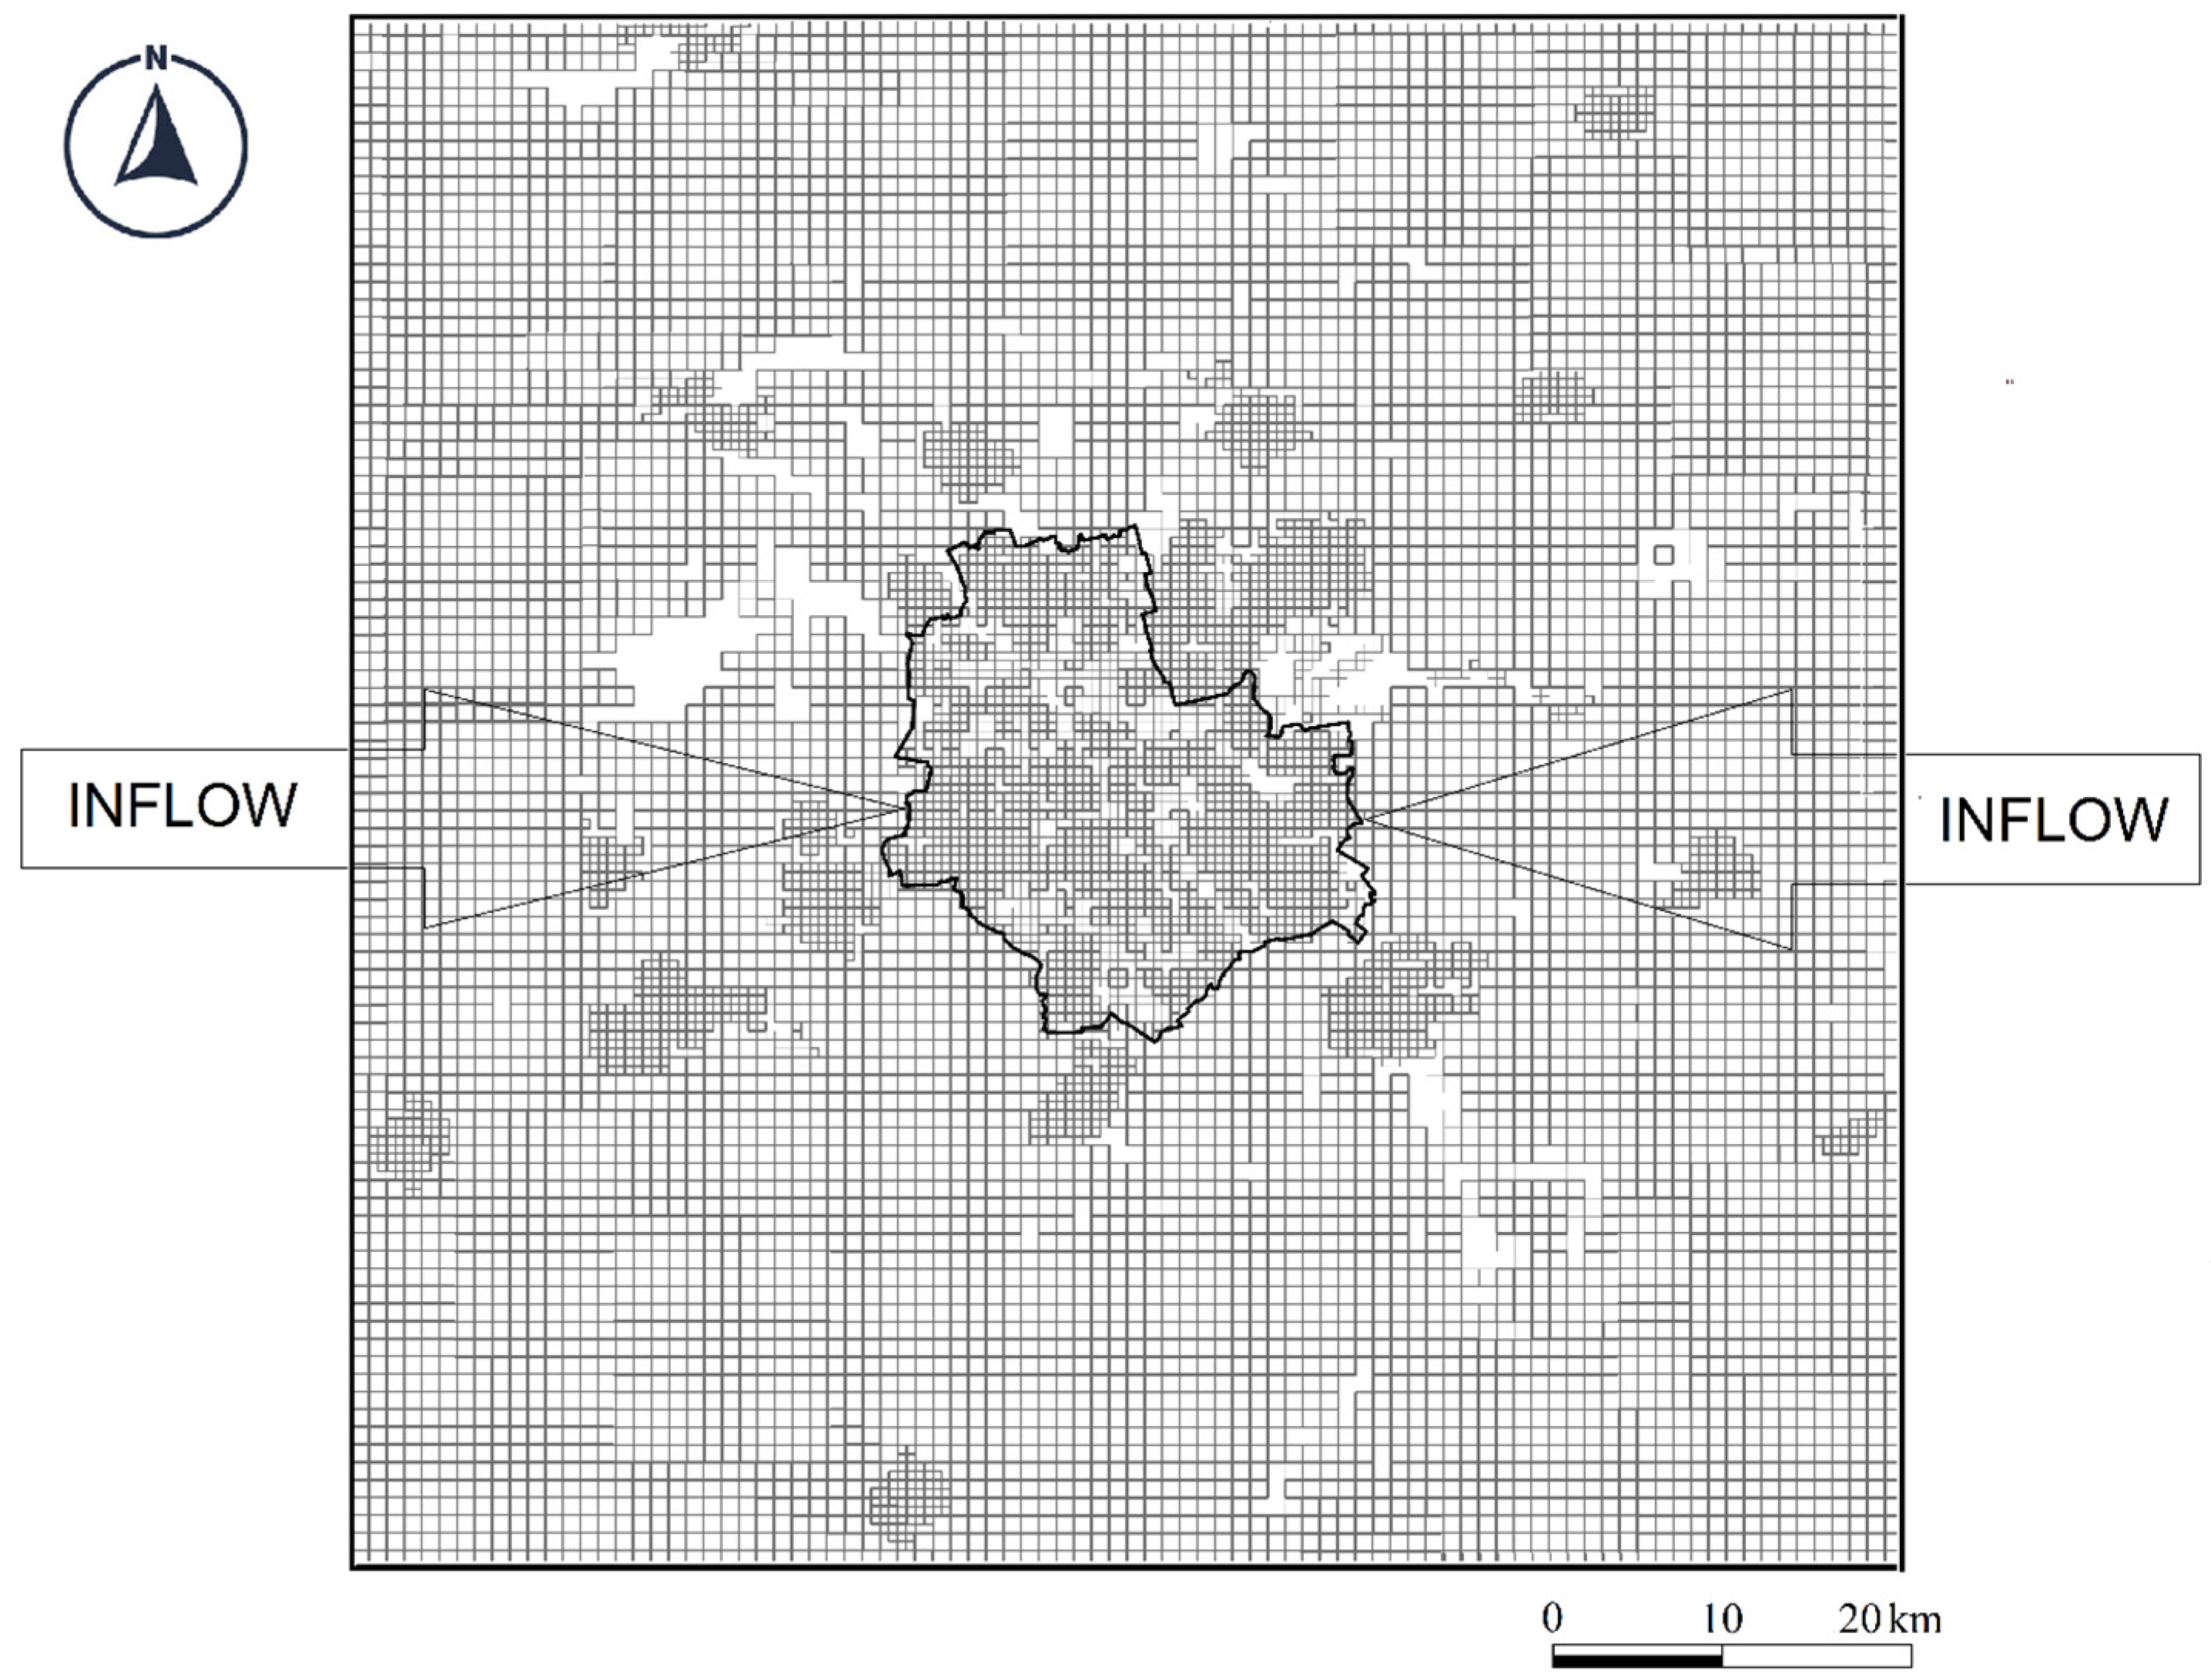
Figure 2.
Concentrations for the baseline year dataset: NOx—left, PM2.5—right. The geographical orientation and scales are the same as in Figure 1.
Figure 2.
Concentrations for the baseline year dataset: NOx—left, PM2.5—right. The geographical orientation and scales are the same as in Figure 1.
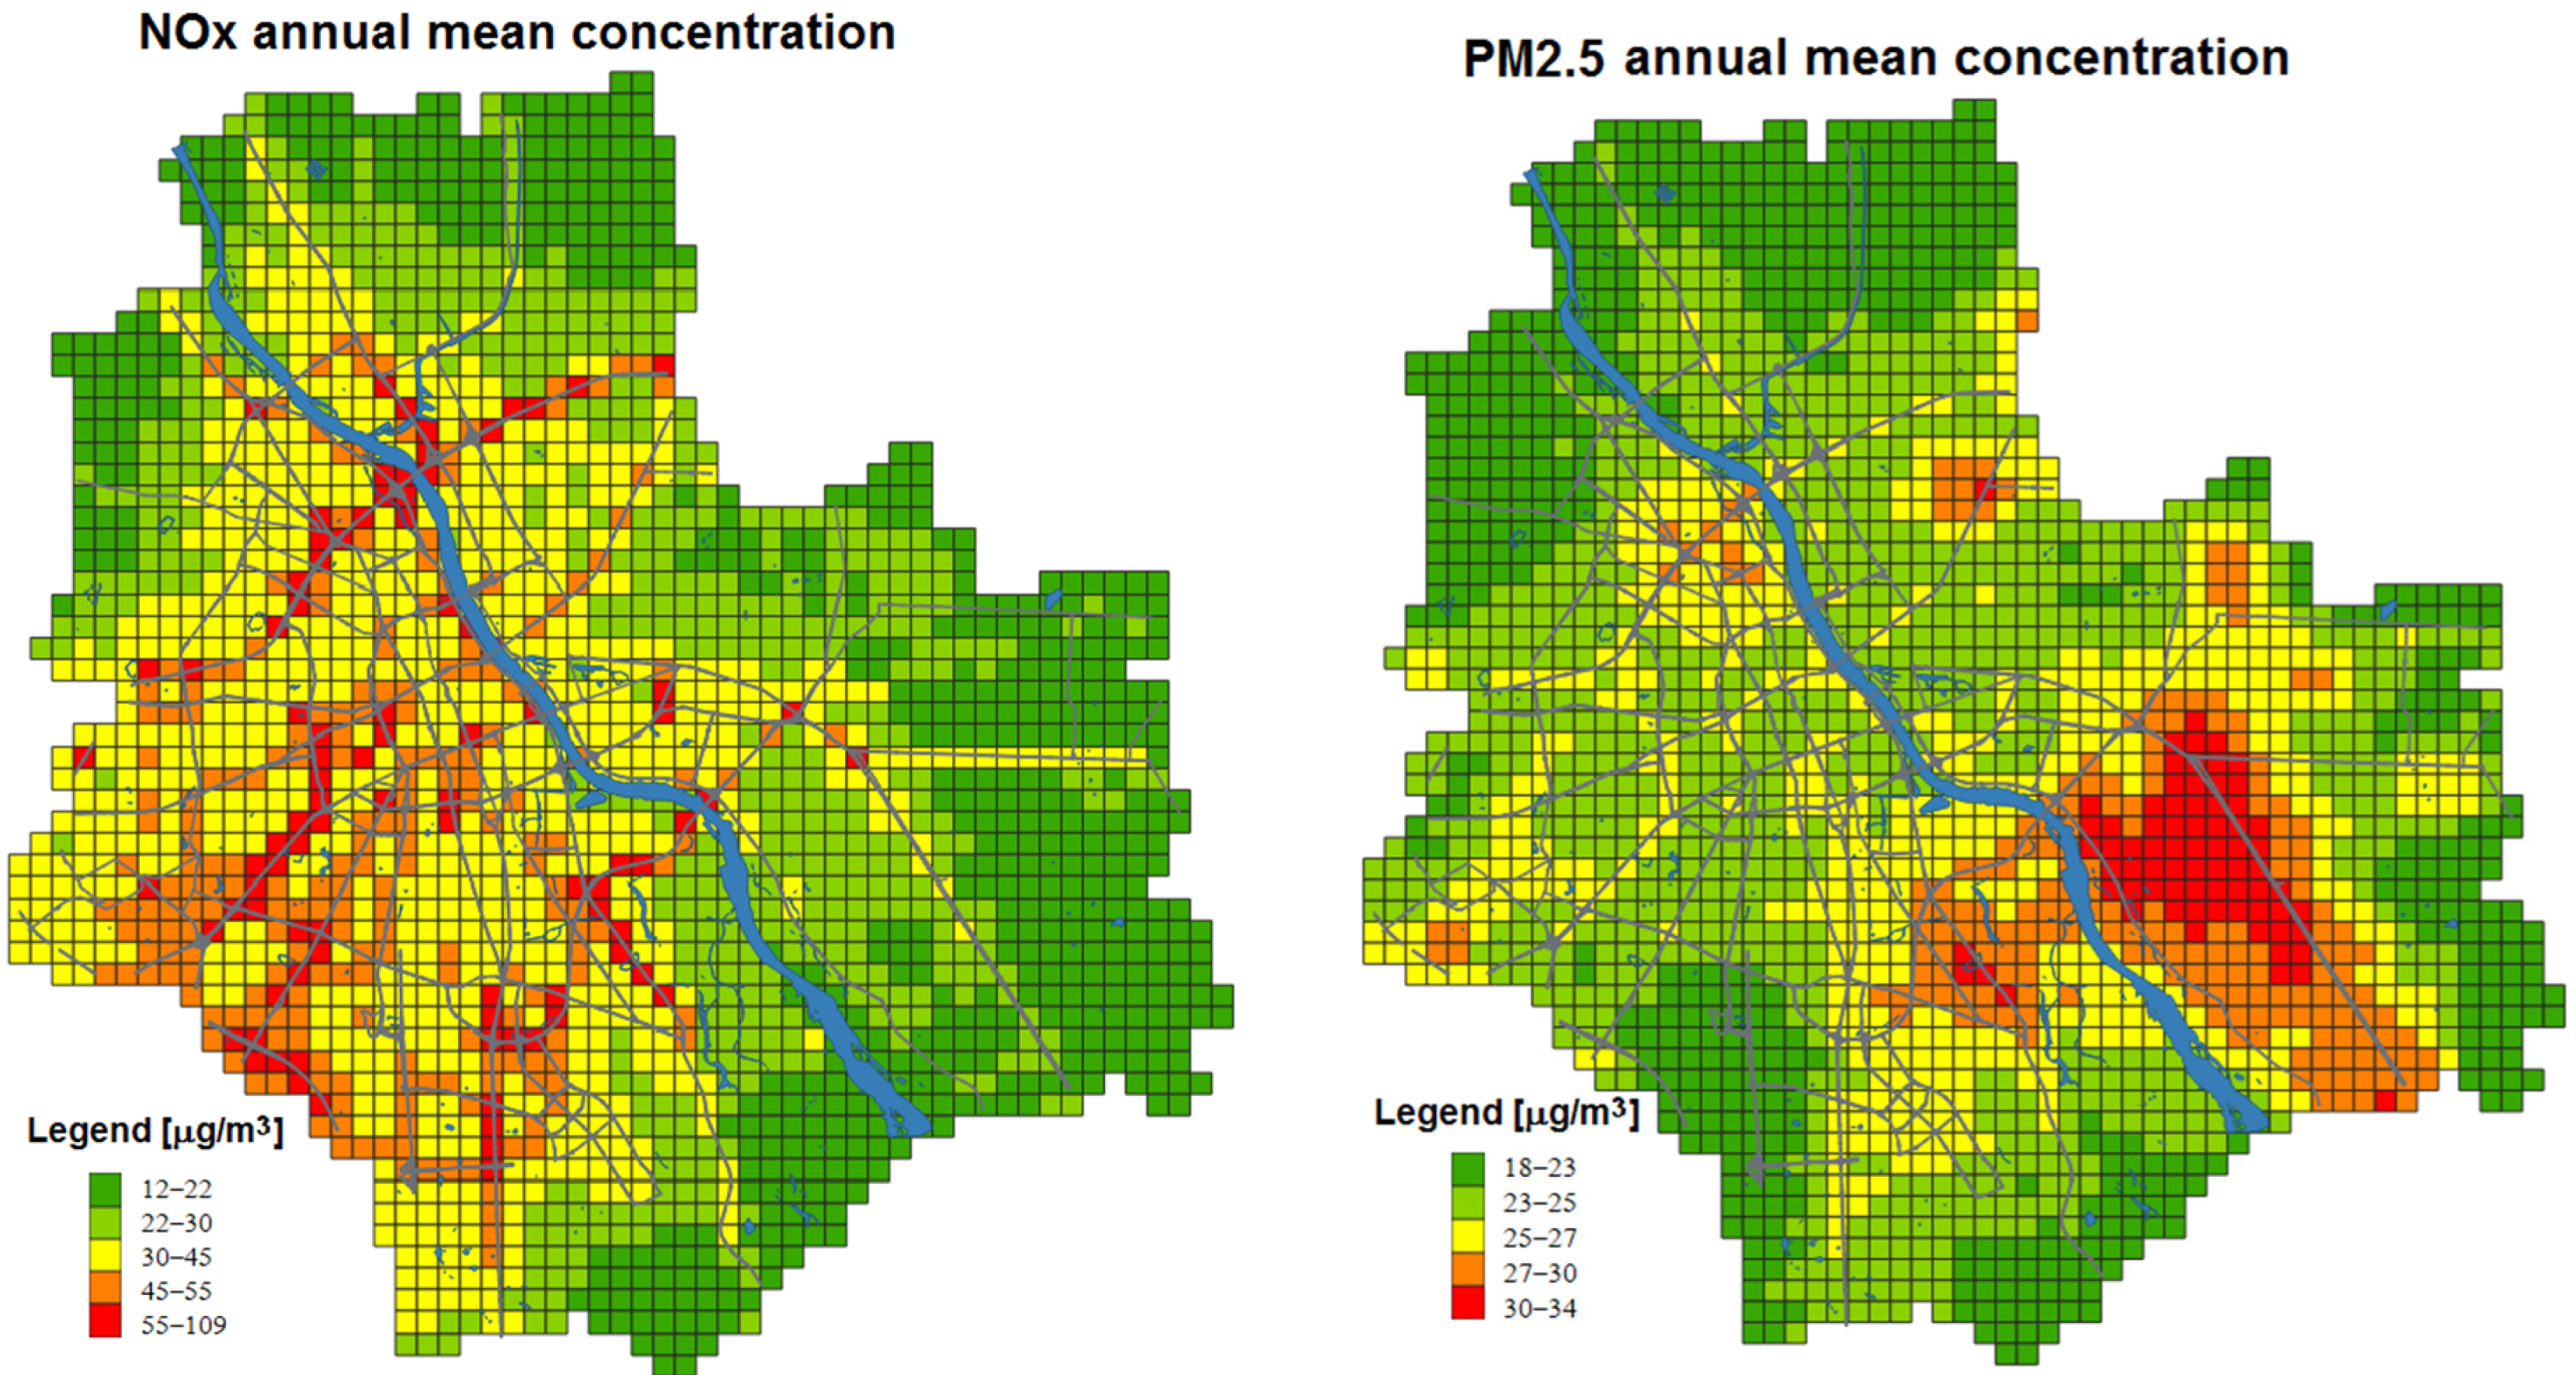
Figure 3.
Modifications of NOx exposure.
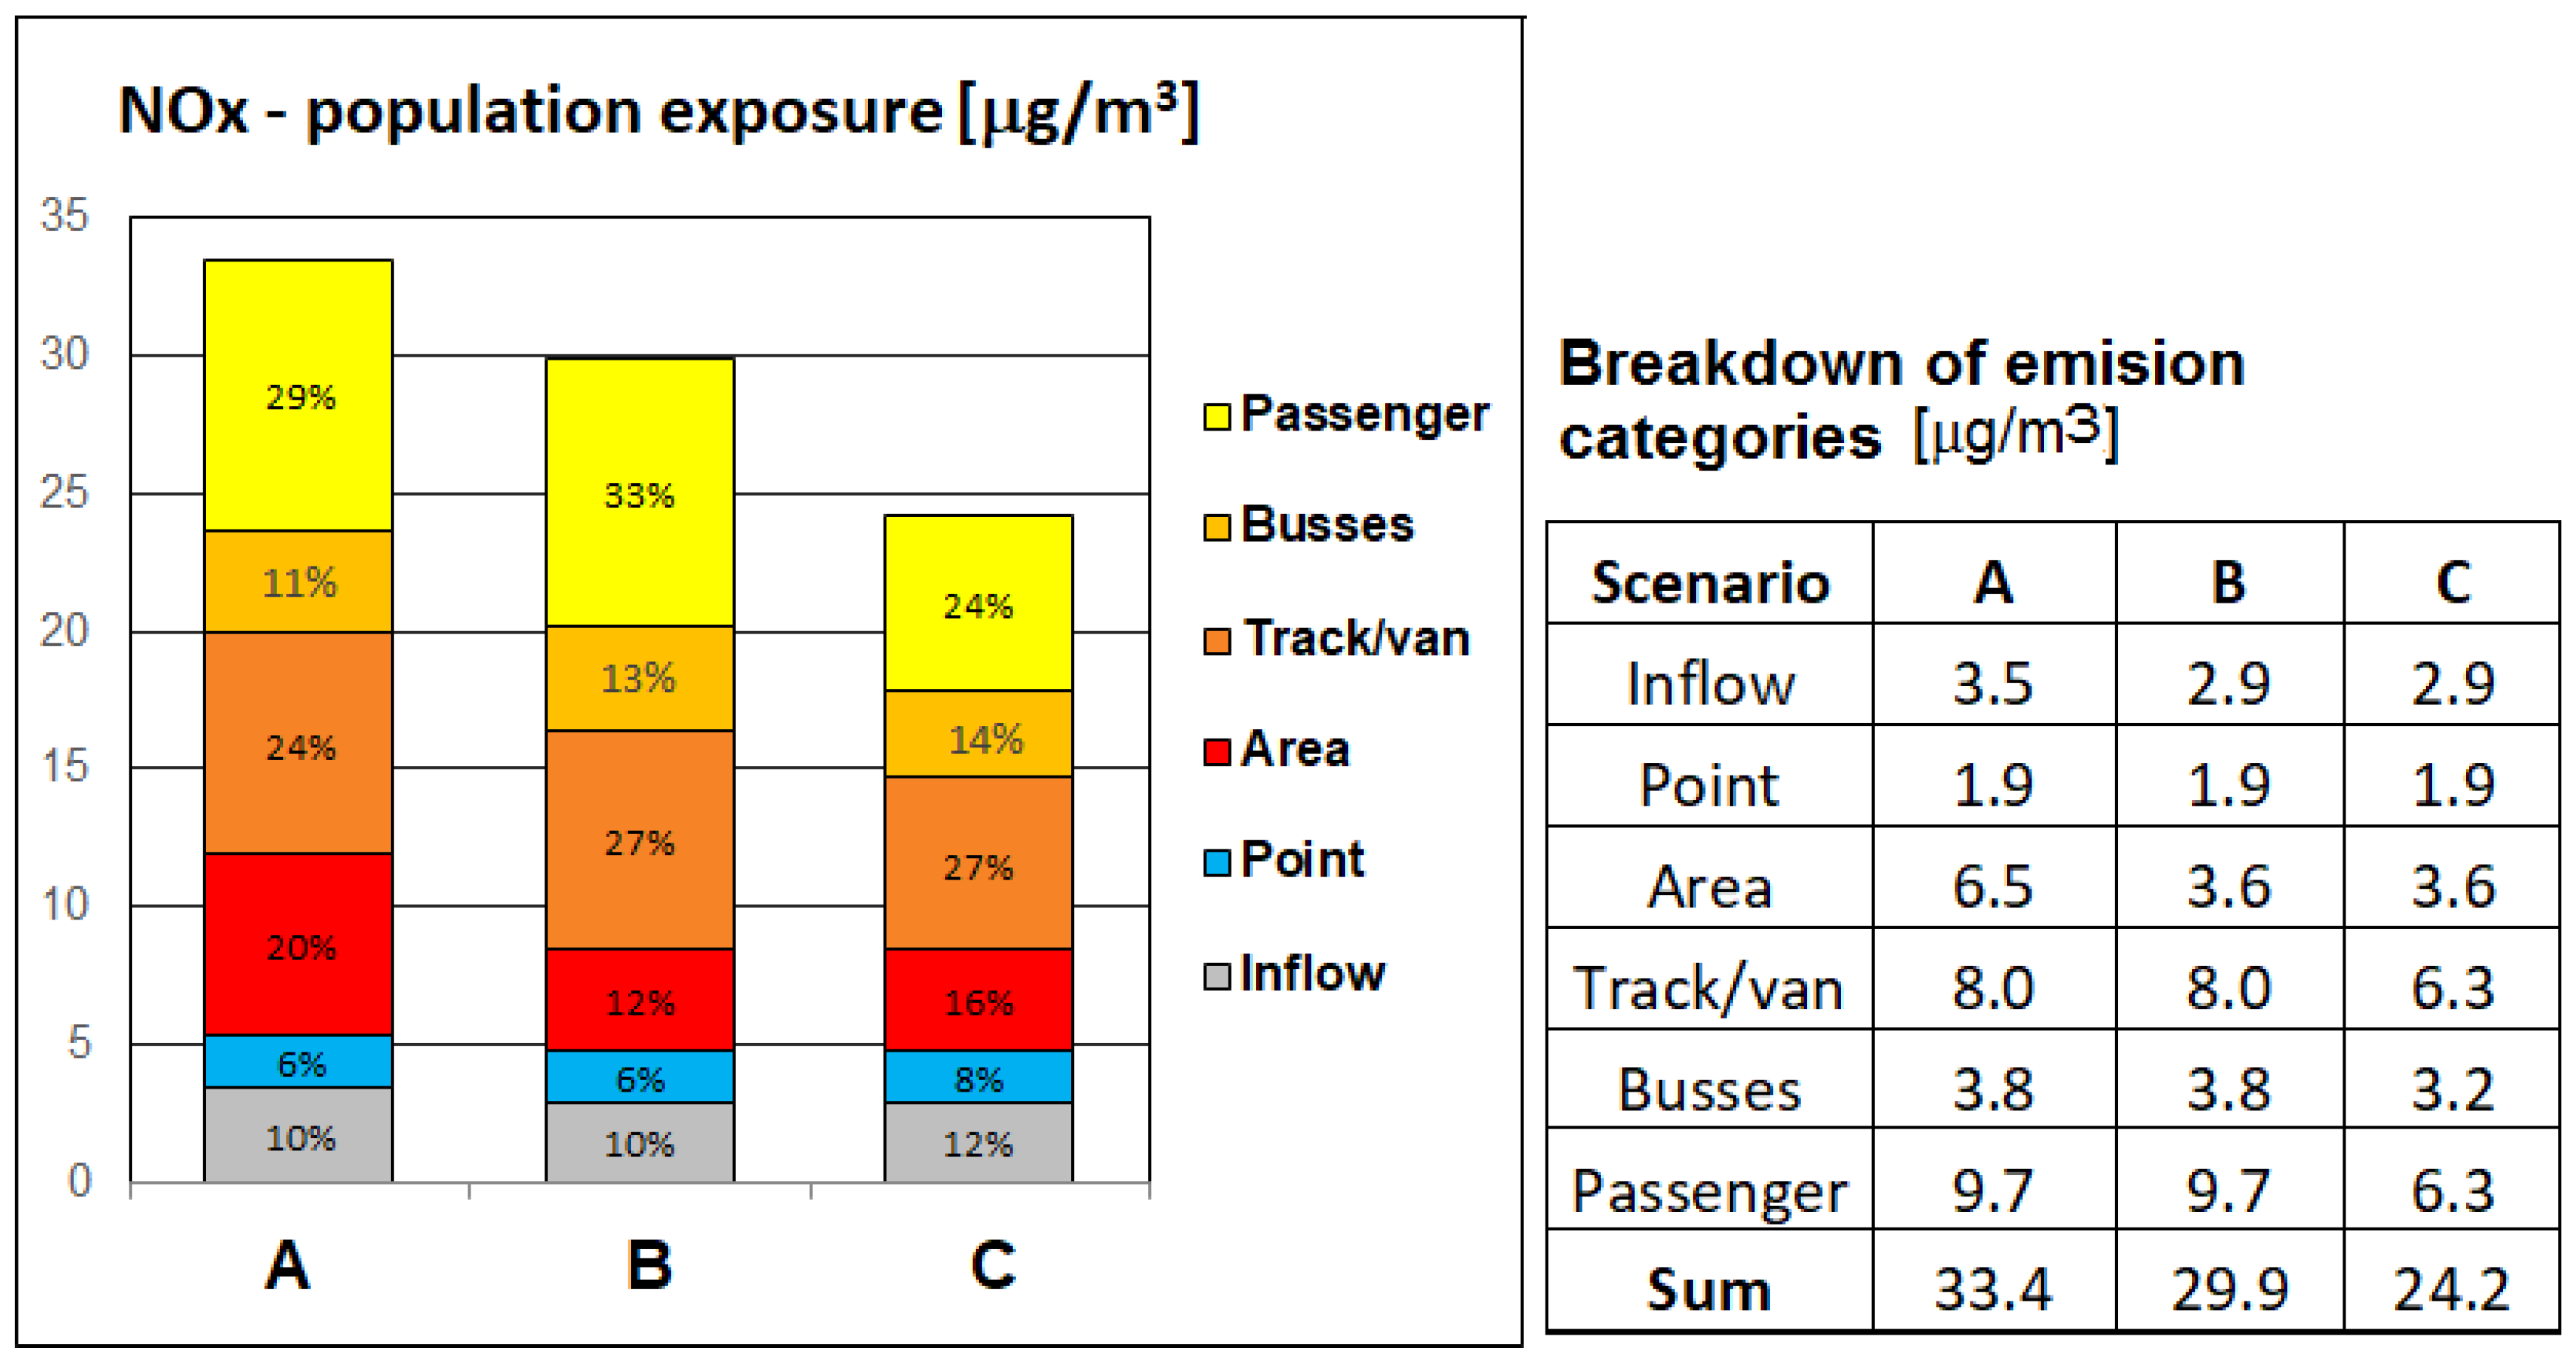
Figure 4.
Modifications of PM10 exposure.
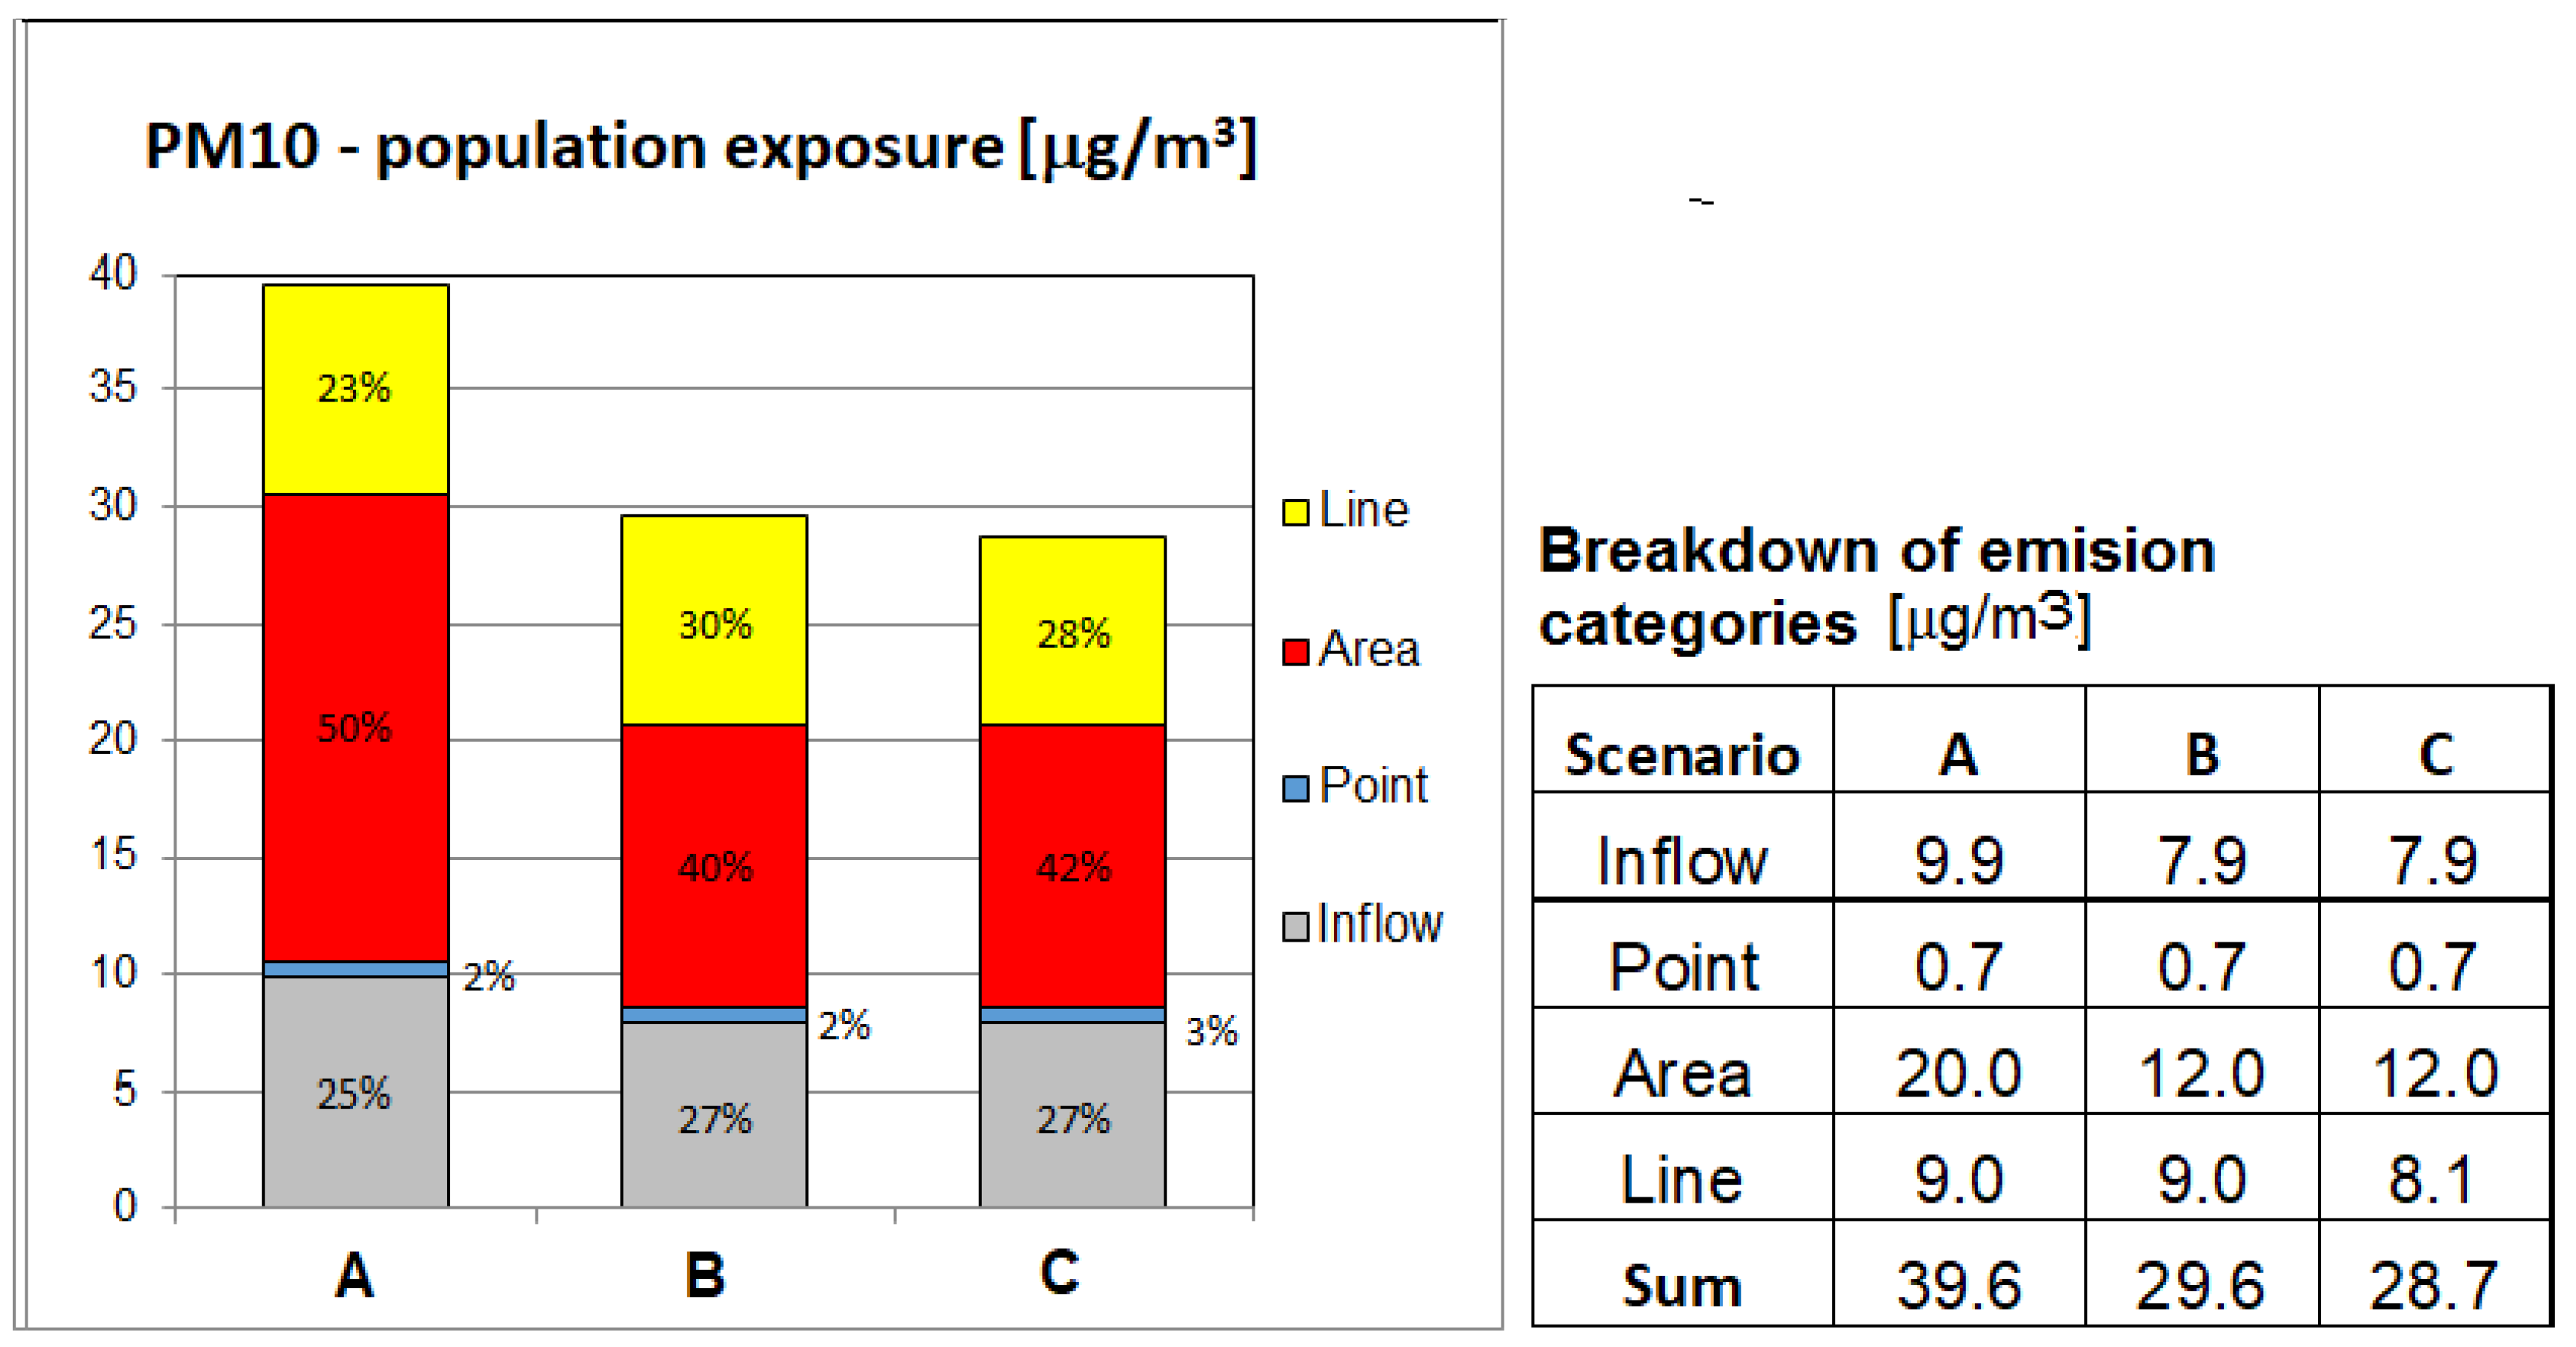
Figure 5.
Modifications of PM2.5 exposure.
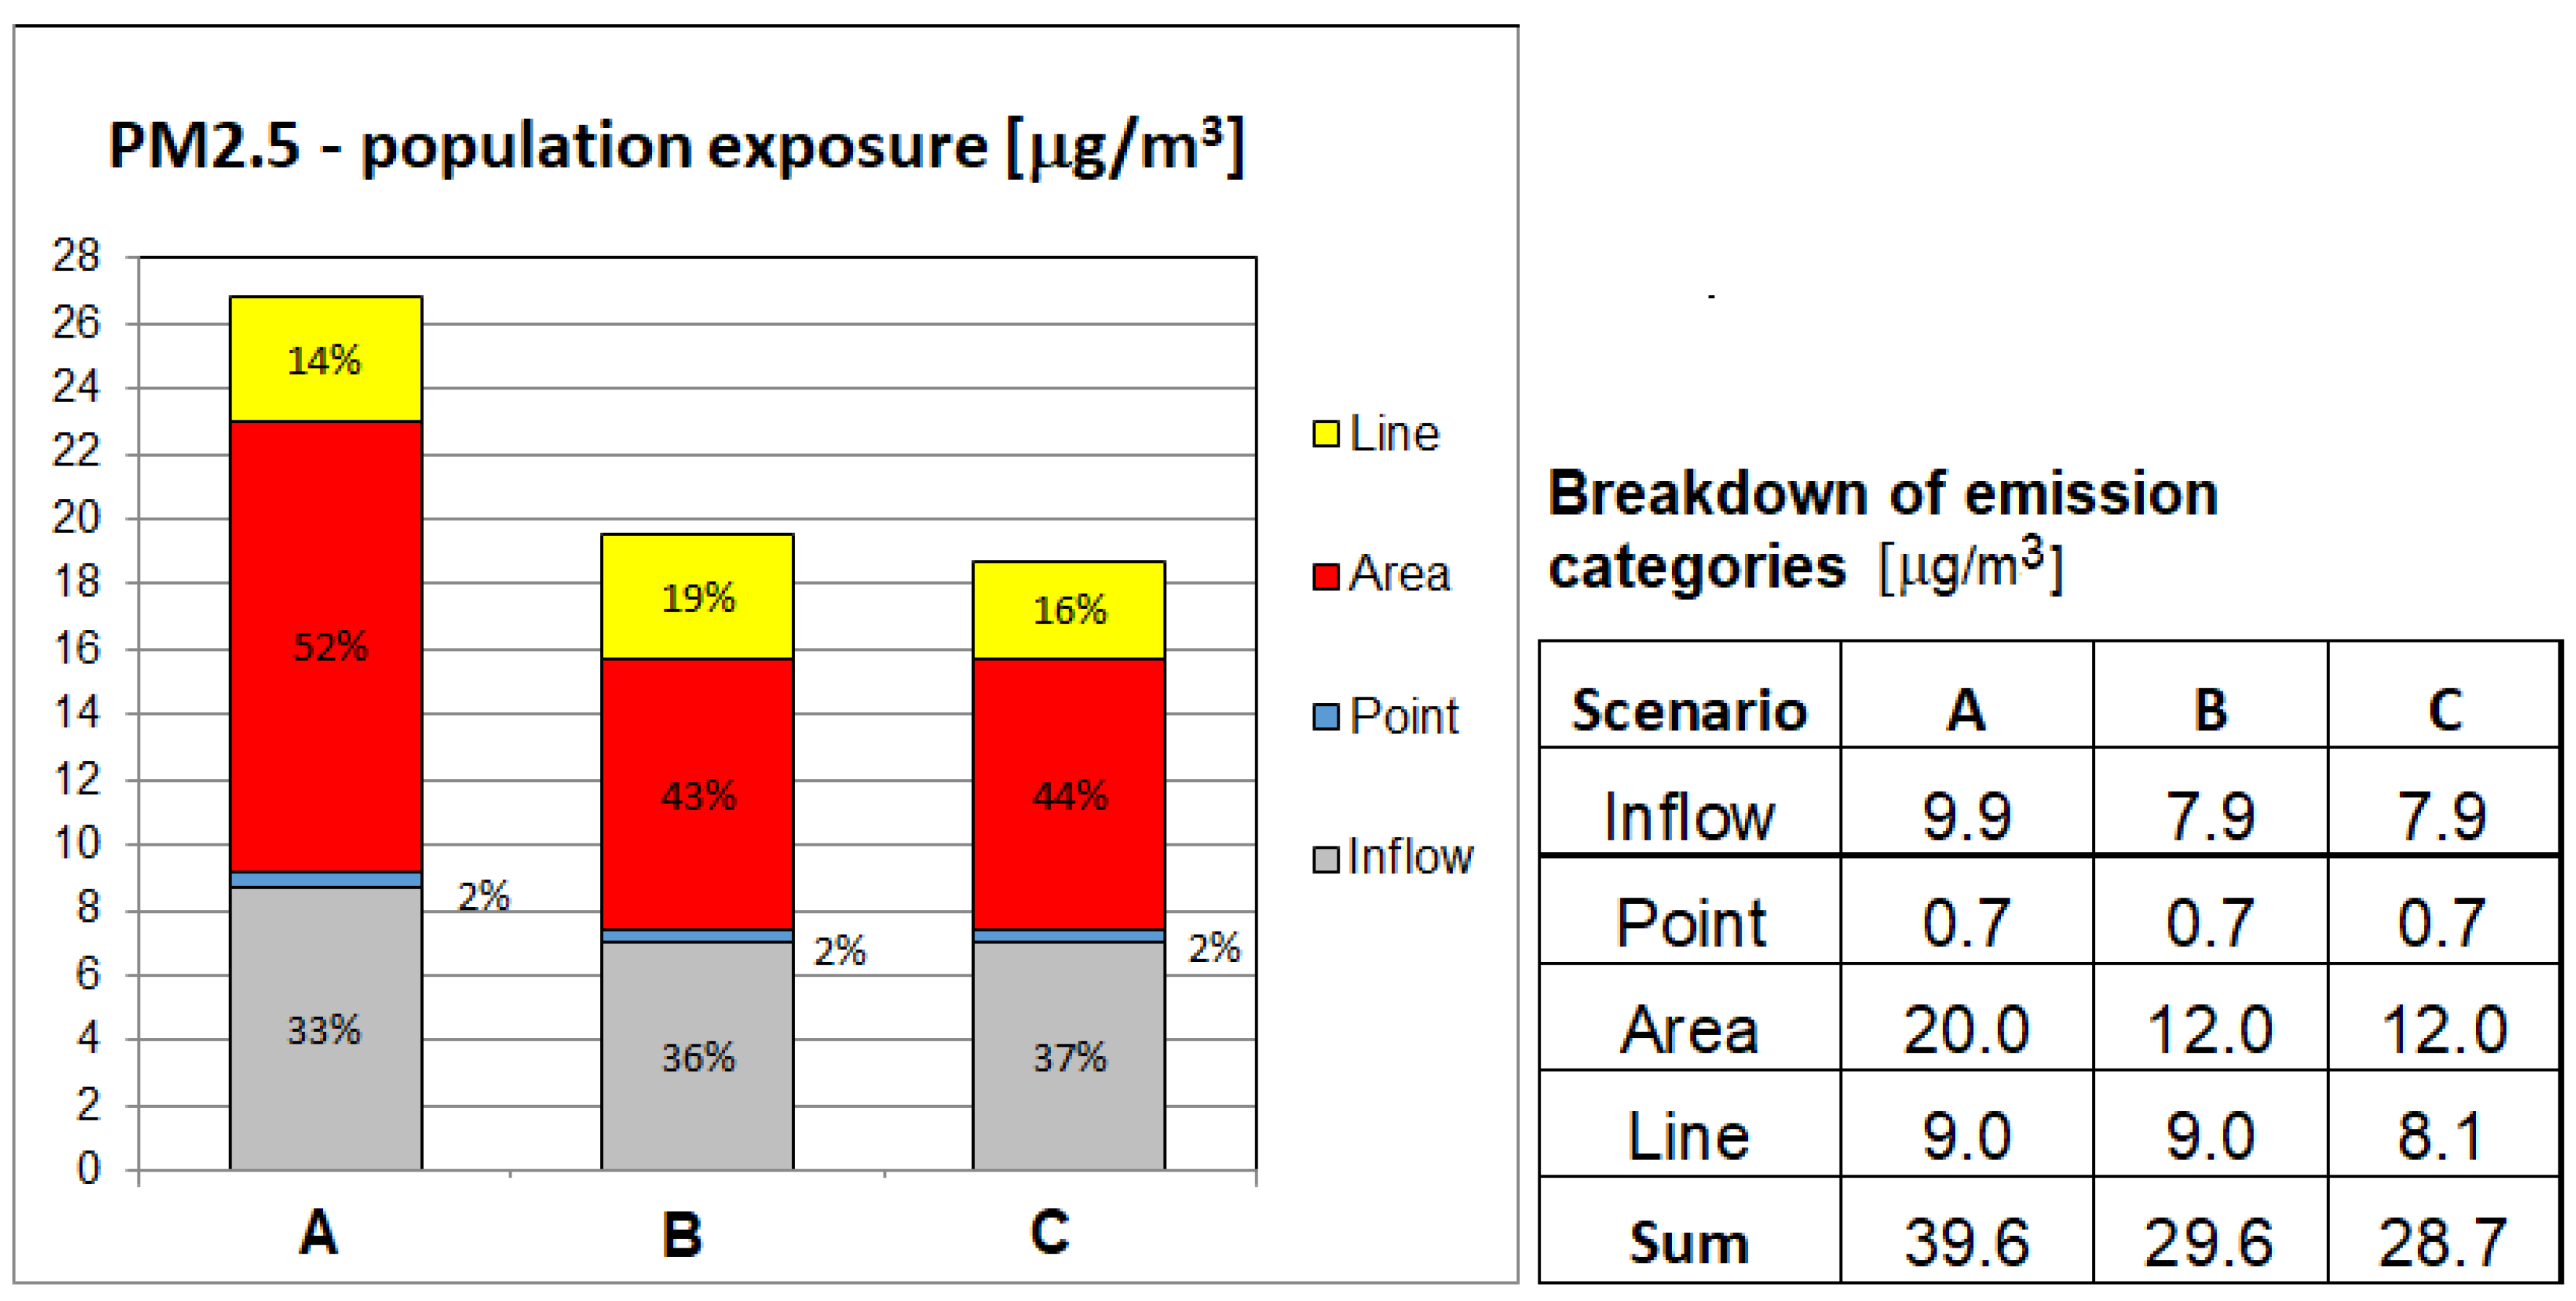
Figure 6.
Modifications of BaP exposure.

Table 1.
Reference NO2 passenger car emissions in Warsaw per fuel and Euro norm.
| Euro Norm | Distance [km × 106] | Share [%] | Emiss. Rate [g/km] | Emission [kg × 103] | Share [%] | |
|---|---|---|---|---|---|---|
| Gasoline | E0-E3 | 52,894 | 32% | 0.32 | 17,000 | 19% |
| E4-E6 | 13,684 | 9% | 0.1 | 1368 | 2% | |
| distance | 66,678 | 41% | emission | 18,368 | 21% | |
| Diesel | E0-E3 | 67,895 | 42% | 0.77 | 51,190 | 59% |
| E4-E6 | 26,316 | 16% | 0.65 | 17,105 | 20% | |
| distance | 94,211 | 59% | emission | 68,295 | 79% | |
| TOTAL | 160,789 | 100% | 86,663 | 100% |
Publisher’s Note: MDPI stays neutral with regard to jurisdictional claims in published maps and institutional affiliations. |
© 2022 by the authors. Licensee MDPI, Basel, Switzerland. This article is an open access article distributed under the terms and conditions of the Creative Commons Attribution (CC BY) license (https://creativecommons.org/licenses/by/4.0/).
Share and Cite
MDPI and ACS Style
Holnicki, P.; Kałuszko, A.; Nahorski, Z. Scenario Analysis of Air Quality Improvement in Warsaw, Poland, by the End of the Current Decade. Atmosphere 2022, 13, 1613. https://doi.org/10.3390/atmos13101613
AMA Style
Holnicki P, Kałuszko A, Nahorski Z. Scenario Analysis of Air Quality Improvement in Warsaw, Poland, by the End of the Current Decade. Atmosphere. 2022; 13(10):1613. https://doi.org/10.3390/atmos13101613
Chicago/Turabian StyleHolnicki, Piotr, Andrzej Kałuszko, and Zbigniew Nahorski. 2022. "Scenario Analysis of Air Quality Improvement in Warsaw, Poland, by the End of the Current Decade" Atmosphere 13, no. 10: 1613. https://doi.org/10.3390/atmos13101613
Note that from the first issue of 2016, this journal uses article numbers instead of page numbers. See further details here.