Article

Assessment of Pollution Sources and Contribution in Urban Dust Using Metal Concentrations and Multi-Isotope Ratios (13C, 207/206Pb) in a Complex Industrial Port Area, Korea

1
Environmental Measurement & Analysis Center, Fundamental Environmental Research Department, National Institute of Environmental Research (NIER), Incheon 22689, Korea
2
Fundamental Environmental Research Department, National Institute of Environmental Research (NIER), Incheon 22689, Korea
*
Authors to whom correspondence should be addressed.
Atmosphere 2021, 12(7), 840; https://doi.org/10.3390/atmos12070840
Submission received: 30 May 2021 / Revised: 19 June 2021 / Accepted: 21 June 2021 / Published: 29 June 2021

Abstract

:
The metal concentrations and isotopic compositions (13C, 207/206Pb) of urban dust, topsoil, and PM10 samples were analyzed in a residential area near Donghae port, Korea, which is surrounded by various types of industrial factories and raw material stockpiled on empty land, to determine the contributions of the main pollution sources (i.e., Mn ore, Zn ore, cement, coal, coke, and topsoil). The metal concentrations of urban dust in the port and residential area were approximately 85~112 times higher (EF > 100) in comparison with the control area (EF < 2), especially the Mn and Zn ions, indicating they were mainly derived from anthropogenic source. These ions have been accumulating in urban dust for decades; furthermore, the concentration of PM10 is seven times higher than that of the control area, which means that contamination is even present. The isotopic (13C, 207/206Pb) values of the pollution sources were highly different, depending on the characteristics of each source: cement (−19.6‰, 0.8594‰), Zn ore (−24.3‰, 0.9175‰), coal (−23.6‰, 0.8369‰), coke (−27.0‰, 0.8739‰), Mn ore (−24.9‰, 0.9117‰), soil (−25.2‰, 0.7743‰). As a result of the evaluated contributions of pollution source on urban dust through the Iso-source and SIAR models using stable isotope ratios (13C, 207/206Pb), we found that the largest contribution of Mn (20.4%) and Zn (20.3%) ions are derived from industrial factories and ore stockpiles on empty land (Mn and Zn). It is suggested that there is a significant influence of dust scattered by wind from raw material stockpiles, which are stacked near ports or factories. Therefore, there is evidence to support the idea that port activities affect the air quality of residence areas in a city. Our results may indicate that metal concentrations and their stable isotope compositions can predict environmental changes and act as a powerful tool to trace the past and present pollution history in complex contexts associated with peri-urban regions.

1. Introduction

Rapid urban development, explosive population growth, industrial activities, and increases in automobile exhaust have caused widespread pollution in the surrounding environment [1,2,3,4]. Pollutants steadily accumulate in urban areas, and toxic substances, especially heavy metals, are excessively concentrated [4]. Urban dust (house and road) and topsoil are environmental key indicators due to the fact that they contain complex particle mixtures and heavy metal ions from atmospheric deposition [5,6,7]. Therefore, studies on metal enrichment in urban dust and surface topsoil has been reported in the numerous scientific literature [8,9,10,11,12,13,14,15,16]. It is generally derived from several sources, such as crustal material, atmospheric sediment, industrial activity, coal combustion, biomass burning, and traffic activity (emissions, tire wear, brake wear, and road wear) [13], and can be easily transported by runoff or resuspended by wind [14]. These pollutants in industrial complexes and ports, and frequent exposure to residents in adjacent living areas, can cause various health problems, such as respiratory disease, lung disease, heart disease, and rhinitis [17,18,19,20,21,22,23,24,25]. Thus, tracking the source of heavy metal ions and investigating the quantitative contribution of pollutants as an environmental forensic science is critical to understanding their environmental behavior and controlling exposure risk [26,27].
Previous studies have developed numerous methods to trace various types of environmental pollutions that are often difficult to identify. Metal concentrations and statistical analyses, such as clustering analysis, principal component analysis (PCA), and multivariate and geostatistical analysis, are frequently used to identify environmental pollution sources and the routes of metal contamination [3,28,29,30,31,32,33,34,35,36,37]. These methods are easy to use, but typically only offer general information on the sources. Another approach is the use of metal ratios of some crustal elements, such as Al and Fe (Enrichment Factor, [3]). These methods may provide useful information on potential enrichments, but the determination of sources based on these measurements is often uncertain. Isotopic fingerprinting, which is based on stable isotopic ratios, is a superior and in-depth method used to identify the origins of various contaminants because isotopic ratios are highly sensitive tracers, as different pollutant sources have difference isotopic values [38,39,40,41,42,43]. The stable C isotope ratio (δ13C) of various types of environmental samples reflects the isotope ratio of their source material and isotopic fractionations related to their generation processes. Samples (e.g., urban dust, topsoil, and atmospheric PM) with C derived from different plant materials (C3 and C4 plants), different fossil fuels (coal, diesel, gasoline, natural gas, and crude oil), different combustion conditions, and different degrees of post-emission transformation can be differentiated using their δ13C compositions. Therefore, the δ13C values of samples have been determined in various studies and used for source apportionment [25,42,44,45,46]. A number of studies have used Pb isotope ratios to identify the sources and transport pathways of Pb in atmospheric PM because the Pb isotope ratio does not change during industrial or environmental processing, retaining its characteristic ratio inherited at its source [47,48]. Kelepertzis (2016) analyzed the origin of natural Pb originating from soil and Pb from concrete, asphalt, automobile exhaust gas, and various types of plants [49]. Han (2016) examined the contribution from external sources using the 206Pb/207Pb isotope ratios of road dust (anthropogenic source) and crust (natural source) [50]. Li (2018) used Pb isotope consumption to reveal that residential dust originates from coal combustion, while road dust is an automobile exhaust gas emission [3]; Kumar (2013) found that road dust in residential areas and adjacent highway dust have different origins [51]. Identifying a definite source with this information, however, is sometimes difficult due to the uncertainty associated with the isotope composition of the source (distributed over a wide range) or occasionally overlapping sources. Because the use of the single isotope ratio has some limitations in pollution research, better results can be obtained by multiple isotope systems [3,12,52,53]. Therefore, presents studies have now proposed a new paradigm based on the understanding of pollution sources of urban dust and topsoil, which indicate that the combination of multiple approaches should provide more detailed information rather than the application of only one method. In this study, C and Pb isotopic fingerprints were determined in main urban pollutant sources such as stockpiles of Mn and Zn ore, cement, coal, cokes, and topsoil collected from the industrial and residential areas of Donghae port. This port is one of five major trading ports in Korea, is characterized by international trade exchanges, and has serious problems with air quality.
Here, the objectives of this study are to (1) determine the metal concentrations in urban dust (house and road) topsoil, and PM10 samples in industrial, residential, and port areas; (2) evaluate the spatial distribution of metal concentrations; (3) asses the metal pollution level; and (4) reveal the potential sources and their contribution through multi isotopic (C, Pb) compositions. To the best of our knowledge, this is the first study that combines metal concentrations and multi stable isotope (C and Pb) approaches to address the behavior of urban dust and the contributions of anthropogenic pollution sources in a complex industrial area near an international shipping port. Our results should provide an improved understanding of the metal behavior in urban dusts and the ability to effectively manage human and environmental exposure risks.

2. Materials and Methods

2.1. Site Information

Donghae port (37.4° S, 129.12° N) is an artificial port that was built in 1974, with an area of 13,542 thousand m2. The port is characterized by a small difference in tides, and is the largest trading port of the East Sea, which allows entry and departure at all times. The world’s largest cement plant, Korea’s largest ferroalloy production plant, a steel plant, a small-scale industrial complex, and a thermal power plant are located adjacent to Donghae port. Logistics warehousing and stevedoring businesses are prospering at the port, with a total annual cargo volume of 30,000 tons and a maximum simultaneous berthing capacity of 16 thousand tons (50,000 tons, class 8 ships) for a total of 3000 ships. By cargo type, the port stores ore products (12,400 thousand tons) and cement and coal (11,645 thousand tons and 4290 thousand tons, respectively) [54]. However, due to a lack of warehouses and logistical planning, raw materials (Mn and Zn ore, cement, zinc, coke, and briquettes, among others) shipped to the port have been stacked as a stockpile in surrounding empty land and have been left unattended for decades. There is no minimum cover facility at the port. Ore materials, transported by means of trucks, are also stacked uncovered in the ore processing area and are scattered to adjacent areas via wind, such that the constant exposure of residential areas or adjacent soil is a substantial problem that has been causing numerous diseases for decades. In addition because the residential area is located between the port and an industrial complex, residents have been exposed to various pollutants for an extended period (more than 30 years), resulting in lung diseases (pneumonia, lung nodules, atelectasis, and calcification), respiratory disorders, and other chronic health damage. Currently, 16,000 people live in adjacent residential areas; however, this population decreases every year.

2.2. Sampling

Urban dust (road and house), topsoil, PM10, and pollution source (Mn and Zn ore, coal, cokes, and cement) samples were collected in June 2016. All samples were taken in duplicate. The sampling sites were located in different functional areas, including port, industrial, and residential areas, as shown in Figure 1. In order to compare with the study area, rural topsoil from 30 km away, in an area that is not affected by industrial complexes, was selected as a control. Pollution source samples were collected directly at the stockpiles using a plastic seedling shovel and transferred to 200 mL glass vials for storage. Urban dust samples were collected from the rooftops and windows of houses in residential areas, and road dust samples were collected from roads adjacent to the port, using a brush and plastic dustpan at least three times within 0.5 m. Repeatedly, the total weight was carefully swept over 300 g. Collected samples were stored in sealed plastic bags and immediately transferred to the laboratory. Sample were air-dried in the laboratory for 15 days, then sieved through a 500 μm nylon sieve to remove small stones and bricks, leaves, cigarette butts, and other debris, and were finally stored in a refrigerator at 4 °C. Topsoil samples were taken three times from the surface to a depth of 1 cm within the upper 1 m2 range using a stainless steel shovel at the site. The samples were then sealed in a clean polyethylene plastic bag and transferred to the laboratory. After drying the sample for weeks, foreign substances, such as leaves and large stones, were removed with a 500 μm nylon sieve, and the samples were pulverized into particles using a mortar and pestle. The pulverized sample was stored in a refrigerator at 4 °C. PM10 sample collectors were installed on the rooftops of schools, buildings, and houses in residential, urban, and control areas. PM10 samples were collected for 72 h once a week from Monday to Wednesday using a high-volume air sampler (HV-1000R, Sibata, Japan), adapted with a PM10 impactor (Sibata, Japan). PM10 were sampled in quartz microfiber filters (254 mm × 203 mm × 2.2 mm) that were pre-combusted to 700 °C for 2 h to remove any volatile organic compound before sampling.

2.3. Trace Elemental Analysis

All samples were processed and analyzed in a trace metal clean HEPA filtered laboratory, using high purity acids and milliQ water. The ground samples (10 g, minimum) and quartz filters were digested in a Teflon tube with 50 mL of high-purity mixture acids (HF/HCl/HNO3, 1:6:2), sonicated for 2 h, and heated on a hot-block at 100 °C for 4 h. The obtained solutions were cooled, filtered through Whatman No. 40 filter paper, and diluted in 10 mL of 2% HNO3 for subsequent analysis [55]. This digestion procedure was repeated twice. The solution samples were analyzed by inductively coupled plasma optical emission spectrometry (ICP-OES, Optima 5300 DV, Perkin Elmer, Wellesley, MA, USA) for Cr, Mn, Co, Ni, Cu, Zn, As, Cd, Pb, Sr, Ba, and Ni.

2.4. Stable Isotope Analysis

For Pb isotope ratio determination, the extracted solutions were purified with exchange resin (AG1x8, anionic resin), and were adjusted to a Pb concentration of 20 μg L−1 using 2% HNO3 to monitor the performance of the instrument. The 206Pb/204Pb, 207Pb/204Pb, 208Pb/204Pb, 208Pb/206Pb, and 207Pb/206Pb ratio analyses were carried out on an MC-ICP-MS (Nu plasma II, Nu). To inject the samples into the MC-ICP-MS, a DSN-100 desolvating system equipped with a micromist nebulizer was employed.
Thallium (T1, NIST 997), as an internal standard material, was added to all samples to correct for instrumental drift and Pb mass fractionation, which improved the reproducibility of the isotope value. In addition, Pb isotope ratios were corrected using a standard reference material (NIST 981, National Institute of Standards and Technology, USA) through the standard bracketing method. The NIST SRM 981 standard was separately run after every five samples to compensate for any mass bias and to assess precision. The combination of T1 normalization and the classic bracketing method provided an analytical precision of 0.0021, 0.0005, and 0.0002 for 208Pb/206Pb, 207Pb/206Pb, and 206Pb/204Pb, respectively.
To analyze the C isotope ratios of the dust, pollution source, and soil samples, carbonate was removed using concentrated 1 N HCl for 6 h [56]. Triplicate samples placed in acid with an HCl fume were compared with samples that were not placed in acid with an HCl fume. This test showed no differences in the δ13C isotope values at less than 0.2‰. Therefore, no pre-treatment was necessary for the isotope analysis. The stable C isotopic ratios (δ13C) in all samples were measured by an isotope ratio mass spectrometer (IRMS) with an elemental analyzer (Vario MicroCube-Isoprime 100; Elementar-GV Instruments, UK).
The δ values (‰) were calculated using the following equation:
δ (‰) = [(Rsample)/(Rstandard) − 1] × 1000
where R = (13C/12C). The international reference standard materials for the stable isotope analysis of δ13C, i.e., Vienna Pee Dee Belemnite (VPDB), were used. The reference materials were procured from the International Atomic Energy Agency, Vienna, Austria. The δ13C value was standardized using IAEA-CH-6 (Sucrose) and USGS24 (Graphite). The analytical precision for the standardization of the reference materials was 0.1‰.

2.5. Assessment of Heavy Metal Pollution

To assess the heavy metal contamination of urban dust, the enrichment factor (EF) was used:
EF = (Metal/Li)sample/(Metal/Li)background
where (Metal/Li)sample is the concentration of the heavy metal and Li in the sample and (Metal/Li)background is the concentration of the heavy metal and Li in the control area. For the background concentration, the average perceptual concentration reported in Rudnick and Gao (2003) was used [57]. Al, Fe, and Li are generally used as normalizing elements [58,59]. Because Al and Fe hydroxides can precipitate when the salinity is changed in the estuary environment, Li can be more suitable for normalizing than Al and Fe. Additionally, for road dust, Li has been used frequently as a normalizing element [4,12,15,17]. The EF is divided into five classes according to each heavy metal type as follows: EF < 2, minimal enrichment; 5 < EF > 2, moderate enrichment; 20 < EF > 5, significant enrichment; 40 < EF > 20, very high enrichment; and EF > 40, extremely high enrichment [60,61].

2.6. Mixing Model

Statistical analyses were performed using the SIAR (Stable Isotope Analysis) Bayesian mixing model in R (version 3.1.10, [62]). Before the analysis, all data were verified for normality and homogeneity of variances. Correlations between variables were valuated using Pearson correlation coefficients.

3. Results and Discussion

3.1. Heavy Metals in Urban Dust, Topsoil and PM10

The concentrations of Co, Sr, and Ba in urban dust (house and road) and topsoil are similar to the concentration of topsoil in the control area, whereas the concentrations of Mn, Ni, Cu, Cr, Zn, As, Cd, and Pb are significantly higher than those in the control topsoil (Table 1). This suggests that Co, Sr, and Ba in urban dust and topsoil are likely predominantly derived from natural sources; however, Mn, Ni, Cu, Cr, Zn, As, Cd, and Pb may be influenced by anthropogenic sources. The average concentrations of Mn, Zn, Pb, and Cd in urban dust are 84-, 111-, 25-, and 56-fold higher and are 241-, 43-, 17-, and 18-fold higher in topsoil compared with those of topsoil in the control area, respectively. In addition, the average concentrations for those of PM10 in urban area are also approximately 1.3–7.0 times higher compared with the control area, which means that contamination is even present (Table 2). When compared with the metal concentrations and enrichment factors of urban dust in other environments worldwide, the levels of Mn, Zn, and Cd were dozens of time higher; Pb also shows high concentrations, except for in a few studies (Table 1 and Table 3). It is indicated that the study area exhibited severe Mn, Zn, Cd, and Pb pollution. Therefore, we focused on metals of environmental concern: Mn, Zn, Cd, and Pb.
Table 1. Results of metal concentration in pollution source, control soil, and urban dust samples of this study and other literature values.
LocationType Metal Ion (mg/kg)Reference
CrMnCoNiCuZnAsCdPbSrBa
Donghae, Koreaurban dust
(Port area, n = 5)
Minimum24.625377.214.850.836411.52.515.912017.5This study
Maximum56.038,58335.929.286657,584127192680286213
Mean35.513,73615.119.624413,86036.747.720916495.7
Median33.110,98810.818.3110146912.99.037.712777.6
SD11.914,79411.75.635024,67750.881.628670.371.7
urban dust
(Residence area, n = 6)
Minimum59.919,13918.529.9103525511.45.519.210129.0
Maximum496157,11946.013643935,57085.91193389250181
Mean23268,79328.484.027612,11442.541.279415486.3
Median22152,29323.481.9257640027.014.924214969.6
SD16452,37411.742.412512,79931.248.2129554.864.2
topsoil
(Residence area, n = 3)
Minimum10586,52530.549.3131262012.29.833.619092
Maximum583144,21437.797.3241736629.324.2751.13841444
Mean329117,79834.774.0177508022.414.9338277557
Median198122,75335.875.4158525625.710.5227256135
SD24129,2113.724.057.123789.08.1371.198.5768.4
Pollution sourceMn OreMean1.4411,439541451015.40.61.256124
CoalMean25753.85.126377.30.75.313664
CokesMean10172.53603371.80.70.73.65.8
CementMean6.88951768140337300.934242144
Zn oreMean2115,419658359398450,428229252103.23.8
topsoil
(Control, rural area)
514889.611391165.80.82071309
Seoul, Koreadust (urban)Mean5820701791.035[63]
Ulsan, Koreadust (industry)Mean181191361.482[64]
Shihwa, Koreadust (industry)Mean468660171811034126121161.91418[4]
Gary, USAdust (industry)Mean153266830202207302[65]
Stratoni, Greecedust (mining)Mean12504462720101660[66]
Volos, Greecedust (industry)Mean745302193.5154216957.36.2300[11]
Beijing, Chinadust (urban)Mean114.368512.330.462.33185.60.985.3349754[67]
Hangzhou, Chinadust (urban)Mean6160.61165[3]
Huludao, Chinadust (industry)264527172.8533[68]
Sonora, Mexicodust (urban)Mean11.12.24.726.3387.94.236.1[69]
Hong Kongdust (industry)Mean12429110384067120[70]
Hamilton, USAdust (urban)Mean34793382456114468128[71]
Newcastle, UKdust (urban)261324216.41.0992[72]
Baghdad, Iraqdust (urban)323228024940.9156[73]
Specifically, the concentrations of Zn in urban dust (max = 57,584 mg/kg, mean = 12,987 mg/kg) and topsoil (max = 7366 mg/kg, mean = 5080 mg/kg) around residence and port areas are significantly higher than those of topsoil in the control area (116 mg/kg). Zinc can provide parts made of ferrous metal with very efficient anti-corrosion protection in the long run. It is used as a protective coating for steel products and can be galvanized, sheradized, or electroplated; it is also a component of zinc rich paint and printing ink for corrosion protection [4,74,75]. Because there is a Zn smelting plant and steel-related and auto-parts manufactures located in the study area, it is estimated that the particles generated from them contributed to the dust in urban area. In addition, frequent transportation by automobile from the port to the ferroalloy and steel production plants would have affected urban dust, because Zn is closely related to traffic activities such as tire and brake pad wear [76]. A comparison of the metal concentration in urban dust with scientific reports are shown in Table 1. Our results were dozens of times higher compared to those in domestic industrial complexes [4,12] and other regions of worldwide: Yeung et al. (2003) in Hong Kong [70], Argyraki (2014) in Greece [66], Yu et al. (2016) in China [8], and Dietrich et al. (2019) in the USA [65]. The reasons for this trend could be due to the possibility that there are other major pollutants except for the known Zn sources previously described. It may result that the particles scattered by the wind from the Zn ore stockpile containing a high Zn concentration have accumulated in urban dust. Therefore, stockpiles of raw materials could have a greater impact in urban dust than traffic activities or steel-related factory operation.
The concentration of Mn in urban dust (max = 157,119 mg/kg, mean = 41,265 mg/kg) and topsoil (max = 144,214 mg/kg, mean = 117,797 mg/kg) around residence and port areas are significantly higher than those of topsoil in the control area (488 mg/kg). Manganese has a very important position in the steel industry. The majority of Mn used in the steel industry is for strengthening and desulfurization of steel, while the remaining 5% is used in chemical and battery industries. This is because Mn improves toughness, hardness, and strength and is used in steel alloy applications [77]. It is also widely used in batteries, metallurgy, glass materials, ceramic objects, pigments, dyes, glass, fireworks, food, and medicine [78,79]. Many Mn-related factories are located in the study area, and higher Mn concentration in the urban dust may result from industrial processes from steel, battery, and chemical plants. It is indicated that particles derived from Mn-related industries may be deposited in the urban dust. However, Mn concentrations were 15- to 60-fold higher than in domestic industries with the most Mn-related factories [4,12] as well as industries of the world (Table 1). These results suggest that there is another major Mn source apart from the known sources previously described; the particles scattered by the wind from the uncovered Mn ore stockpile in the factory and port area might be deposited in the surrounding urban and road dust.
The concentrations of Cd in urban dust (max = 192 mg/kg, mean = 44.5 mg/kg) and topsoil (max = 119 mg/kg, mean = 18.5 mg/kg) around residence and port areas are significantly higher than those of topsoil in the control area (0.8 mg/kg). It is indicated that the Cd from various industries might be deposited in the surrounding environment. Cd and Cd compounds are used in a variety of industries, including in the manufacture of Ni-Cd batteries and pigment manufacturing [80]. In addition, car tires, body corrosion, and the lubrication and wear of galvanized parts of vehicles have been reported as a major source of Cd contamination [81]. Cd is 3-fold higher than in the Shihwa industrial complex in Korea [4,12] and 4- to 10-fold higher than in most of the literature data in the world (Table 1). Therefore, industrial activities, transportation by means of automobile, and the manufacturing and processing of raw materials could have a greater impact on Cd concentration in urban dust. In addition, because the Zn ore stockpile itself contains a very high Cd concentration, it is very likely that the particles from the Zn ore stockpile have affected the Cd concentration in urban dust.
The concentrations of Pb in urban dust (max = 3389 mg/kg, mean = 501 mg/kg) and topsoil (max = 751 mg/kg, mean = 337 mg/kg) around residence and port areas are significantly higher than those of topsoil in control area (19.8 mg/kg). Lead is mainly derived from coal power plants, burning fossil fuels, metal coatings, paint factories, lead batteries, leather whipping, and waste pyromania, and it is also used as a component in plastics and rubber [82,83,84]. In Korea, high Pb concentrations (82 mg/kg) occur in urban dust from the Ulsan industrial complex, where large factories are located [64]. Argyraki (2014) reported Pb concentrations of 1660 mg/kg [66], Li et al. (2018) reported 1165 mg/kg in China [3], and Kelepertizis et al. (2020) reported 85.3 mg/kg in Greece [11] (Table 1). However, unlike Mn, Zn, and Cd, Pb-ion concentrations are higher than those in domestic industrial complexes, but lower than those in other urban area in the world. This is because lead smelting facilities and PCB manufactures are few in Donghae port.
The study area is a port where raw materials are loaded and moved more frequently than in urban are, and the number of industrial facilities (metal manufacturing, ore processing) and power plant operated per unit area is the highest in Korea. The main sources of urban dust may be pollutants emitted from industrial complexes (steel, cement, coal, alloy factories), construction and repair activities largely operating in the city and asphalt pavement weathering, pollutants generated during cargo entry and unloading operations, pollutants generated from vehicles passing through the port and surrounding roads for transportation, and spills from adjacent industrial areas. However, this study area has unique characteristics compared to other area. Due to a lack of storage warehouses, raw materials (Mn and Zn ore, coal, coke, cement) are stockpiled in the surrounding area of the port and steel related plants, all within 3 km of the residence, and they are often left for decades. Therefore, particles scattered by wind from stockpiles (Mn and Zn ore, coal, coke, cement), which are stacked near ports or factories, is considered to be the main pollutant source. Among the stockpiles of raw material in the port area, the Mn ore stockpile has a very high Mn concentration, and the Zn ore stockpile has a high Zn, Cd, and Pb concentration in comparison with other ions, which supports the preceding hypothesis.

3.2. Spatial Distribution of Metals in Urban Dust

The concentration of heavy metals in the urban dust samples was examined as a spatial distribution (Figure 2). The Zn concentration was the highest, with an average of 13,860 mg/kg for urban dust in port area, followed by Mn > Cu > Pb > Sr > Ba > Cd > As > Cr > Ni > Co. In particular, the maximum concentration (57,584 mg/kg) occurs at the I-3 site closest to the port, where the Zn ore stockpile is located, with the concentration being 4-fold higher than the average value and 494-fold higher than the control area, indicating severe Zn contamination. The Mn concentration was the highest, with an average of 68,793 mg/kg for urban dust in residence area, followed by Zn > Pb > Cu > Sr > Cr > Ba > Ni > Cd > As > Co. The maximum concentration (157,119 mg/kg) occurred at the O-4 site adjacent to the ferroalloy and Mn-related plant where the Mn ore stockpile is located, with severe Mn contamination being twice the average value and 321-fold higher than that in the control area (Figure 2). The Cd and Pb concentrations are, respectively, dozens of orders of magnitude higher at I-3 and O-1 than those in the control area. The I-3 site, closest to the port where the Zn ore stockpile is located, is thought to have an effect on the Cd concentration. Mn, Zn, Cd, and Pb in urban dust showed a smooth decrease with distance from the pollution source (Mn: R2 = 0.67, Zn: R2 = 0.67, Cd: R2 = 0.69, Pb: R2 = 0.69) (Figure 2), which indicates that atmospheric deposition from pollutants (Mn and Zn ore stockpiles) is the main source of heavy metals in urban dust.
As the distance increases, it is less susceptible to being transported or scattered by the wind. Nevertheless, the Mn concentration was 39-fold higher than in the control area, while the Zn concentration was 3-fold higher than in the control area at site O-1, which is farthest from the ferroalloy plant. In this study, the general spatial distribution indicates that the Mn ore stockpile in the ferroalloy production plant and the Zn ore stockpile on empty space in the port area are the main sources of Mn and Zn in urban dust. However, several factors may affect the concentration of Mn and Zn ion observed within a specific spatial region. There are relevant contributions from vehicular and pedestrian traffic, agricultural activities, street sweeping, specific industrial processes, and incineration and construction operations [85,86,87]. Street dust and the fine soil resuspension fractions are enriched in anthropogenic trace elements, which, if resuspended, can make a notable contribution to the inhalable trace element load of an urban aerosol [4]. Furthermore, the emissions profile of refuse incineration depends on a number of process factors; Pacyna (1983) and Kowalczyk et al. (1982) reported that incineration is a major source of Zn, Cd, and Sb [88,89]. Wadge et al. (1986) found high levels of Pb and Cd in the finest fraction of refuse incineration fly ash [90]. However, the concentrations of Mn, Zn, Cd, and Pb in our studies are dozens to hundreds of times higher than those reported in the literature; the previously described processes cannot be regarded as the origin of urban dust. Therefore, it indicates that the origin of the main pollutants in urban dust in this study area is the Mn and Zn ore stockpiles.

3.3. Metal Enrichment in Urban Dust: Heavy Metal Pollution Assessment

To assess the anthropogenic contamination level, we calculated the EF against the local baseline (Table 3). Co, Ba, and Sr showed a range from 2 ≤ EF ≤ 5 in all samples, indicating that they are mainly of crustal origin. Cr, Ni, Cu, and As were characterized by moderate enrichment on average (2 ≤ EF ≤ 5), but some samples showed 5 ≤ EF ≤ 10, suggesting that they were affected by anthropogenic pollutants. These results may reflect the impact of intensive industrial activities, especially metal processing industries, in this region. Cd and Pb were characterized by moderate enrichment or higher, and Mn and Zn especially had extremely high enrichment values of EF exceeding 200, often reaching 400; as the distance decreases from the ore stockpile, the EF tends to increase. These results also exhibit a similar trend as in recent studies [4,12]. In the case of Mn, EF is the highest in the topsoil in residential areas, and this is the closest place to the Mn ore stockpile in the factory.
Table 3. Comparison of EF value in pollution source, control soil and urban dust sample of this study and other literature values. (EF < 2, minimal enrichment; 5 < EF > 2, moderate enrichment; 20 < EF > 5, significant enrichment; 40 < EF > 20, very high enrichment; and EF > 40, extremely high enrichment).
LocationTypeMetal Ion (mg/kg)Reference
CrMnCoNiCuZnAsCdPbSrBa
Donghae, KoreaUrban dust
(Port area)
0.728.11.61.76.2119.06.460.210.62.30.3This study.
Urban dust
(Residence area)
4.6140.93.07.47.0104.07.451.940.12.20.3
topsoil
(Residence area)
6.5241.23.66.54.543.63.918.717.13.91.8
Shihwa, Koreadust (industry)6.31.01.24.743.522.75.324.295.2--[4]
Busan, Koreadust (urban)4.212.619.14.521.911.8[15]
Shijiazhuang, Chinadust (industry)2.41.11.41.65.77.638.79.5--[91]
Kathmandu, Nepaldust (urban)2.874.62.82.5--[81]
Palermo, Italydust (urban)48.22.11.91416.4472--[92]
Bolgatanga, Ghanadust (urban)0.010.020.010.010.030.00300.01--[93]
Taraba, Nigeriadust (urban)48.361.717.41.3--[94]
Baghdad, Iraqdust (urban)3.84.916.56.612.442.5107.6--[73]
Kayseri, TurkeyUrban dust0.9512.825.220.2190111--[95]
Paris, Francedust (rural highway)1262.511.5126--[96]
Sonora, Mexicodust (urban)17.11.70.98.179.460139.1--[69]
Vellore, Indiadust (urban)1.30.60.43.622.70.916.30.5[97]
Enugu, Nigeriadust (urban)2.30.583.5171.9129.313.7596180[34]
Huainan, Chinadust (industry)2.31.30.41.54.2132.94.5[53]
Atmosphere 12 00840 i001: EF > 40; Extremely high enrichment; Atmosphere 12 00840 i002: 20 < EF < 40; Very high enrichment; Atmosphere 12 00840 i003: 5 < EF < 20; Significant enrichment; Atmosphere 12 00840 i004: 2 < EF < 5; Moderate enrichment; Atmosphere 12 00840 i005: EF < 2; Deficiency to minimal enrichment.
On the other hand, in the case of Zn, EF is the highest in the urban dust in the port area near to the Zn ore stockpile on empty land. This relationship indicates that the Mn and Zn ore-processing facility and ore stockpile in Donghae port presents a distinct point source. The EF results for urban dust in this study were significantly higher than those reported in other studies (Table 3). The average EF of Mn was 28.1 in the urban dust (port) sample and 140.9 in the urban dust (residence area) sample, which is substantially higher than that reported by Jeong (2020, EF = 1) [4], Wan (2016, EF = 1.1) [91], Varrica (2013, EF = 8.2) [92], and Hameed (2013, EF = 4.9) [73] in urban areas. The average EF of Zn is 119 in the urban dust (port) sample and 104 in the urban dust (residence area) sample. Our results for the EF values are significantly higher than those in industrial areas of China (Wan et al., 2016) [91], near highways in France [96], and urban areas in Mexico [69] and India [97]. Therefore, our results show that heavy metals, especially Mn and Zn ions, in urban dust and topsoil might severely impact biota and human health. Long-term exposure to Zn can lead to respiratory compression, high fever, chills, and gastroenteritis [98]. Mn toxicity occurs when excessive manganese is inhaled (or when drinking water contains abundant Mn) and results in neurotoxic symptoms such as muscle pain, tremors, and memory loss, which can lead to neuromotor disorders [99]. Cadmium is used for plastic plating and is classified as a Class 1 human carcinogenic substance by the International Cancer Institute (IARC). Long-term exposure to Cd dust can increase the risk of developing kidney stones composed of Ca and P [100]. Pb is one of the most important environmental pollutants, which is highly toxic even at low concentrations and can threaten human life due to rapid bioaccumulation and a long biological half-life when exposed [101,102]. Therefore, the high concentrations of some ions in dust and topsoil in this study area may adversely affect the health of residents. These observations confirm that the contamination of urban dust and topsoil in Donghae port should be a concern for local authorities, as these elements threaten both ecological and human health.

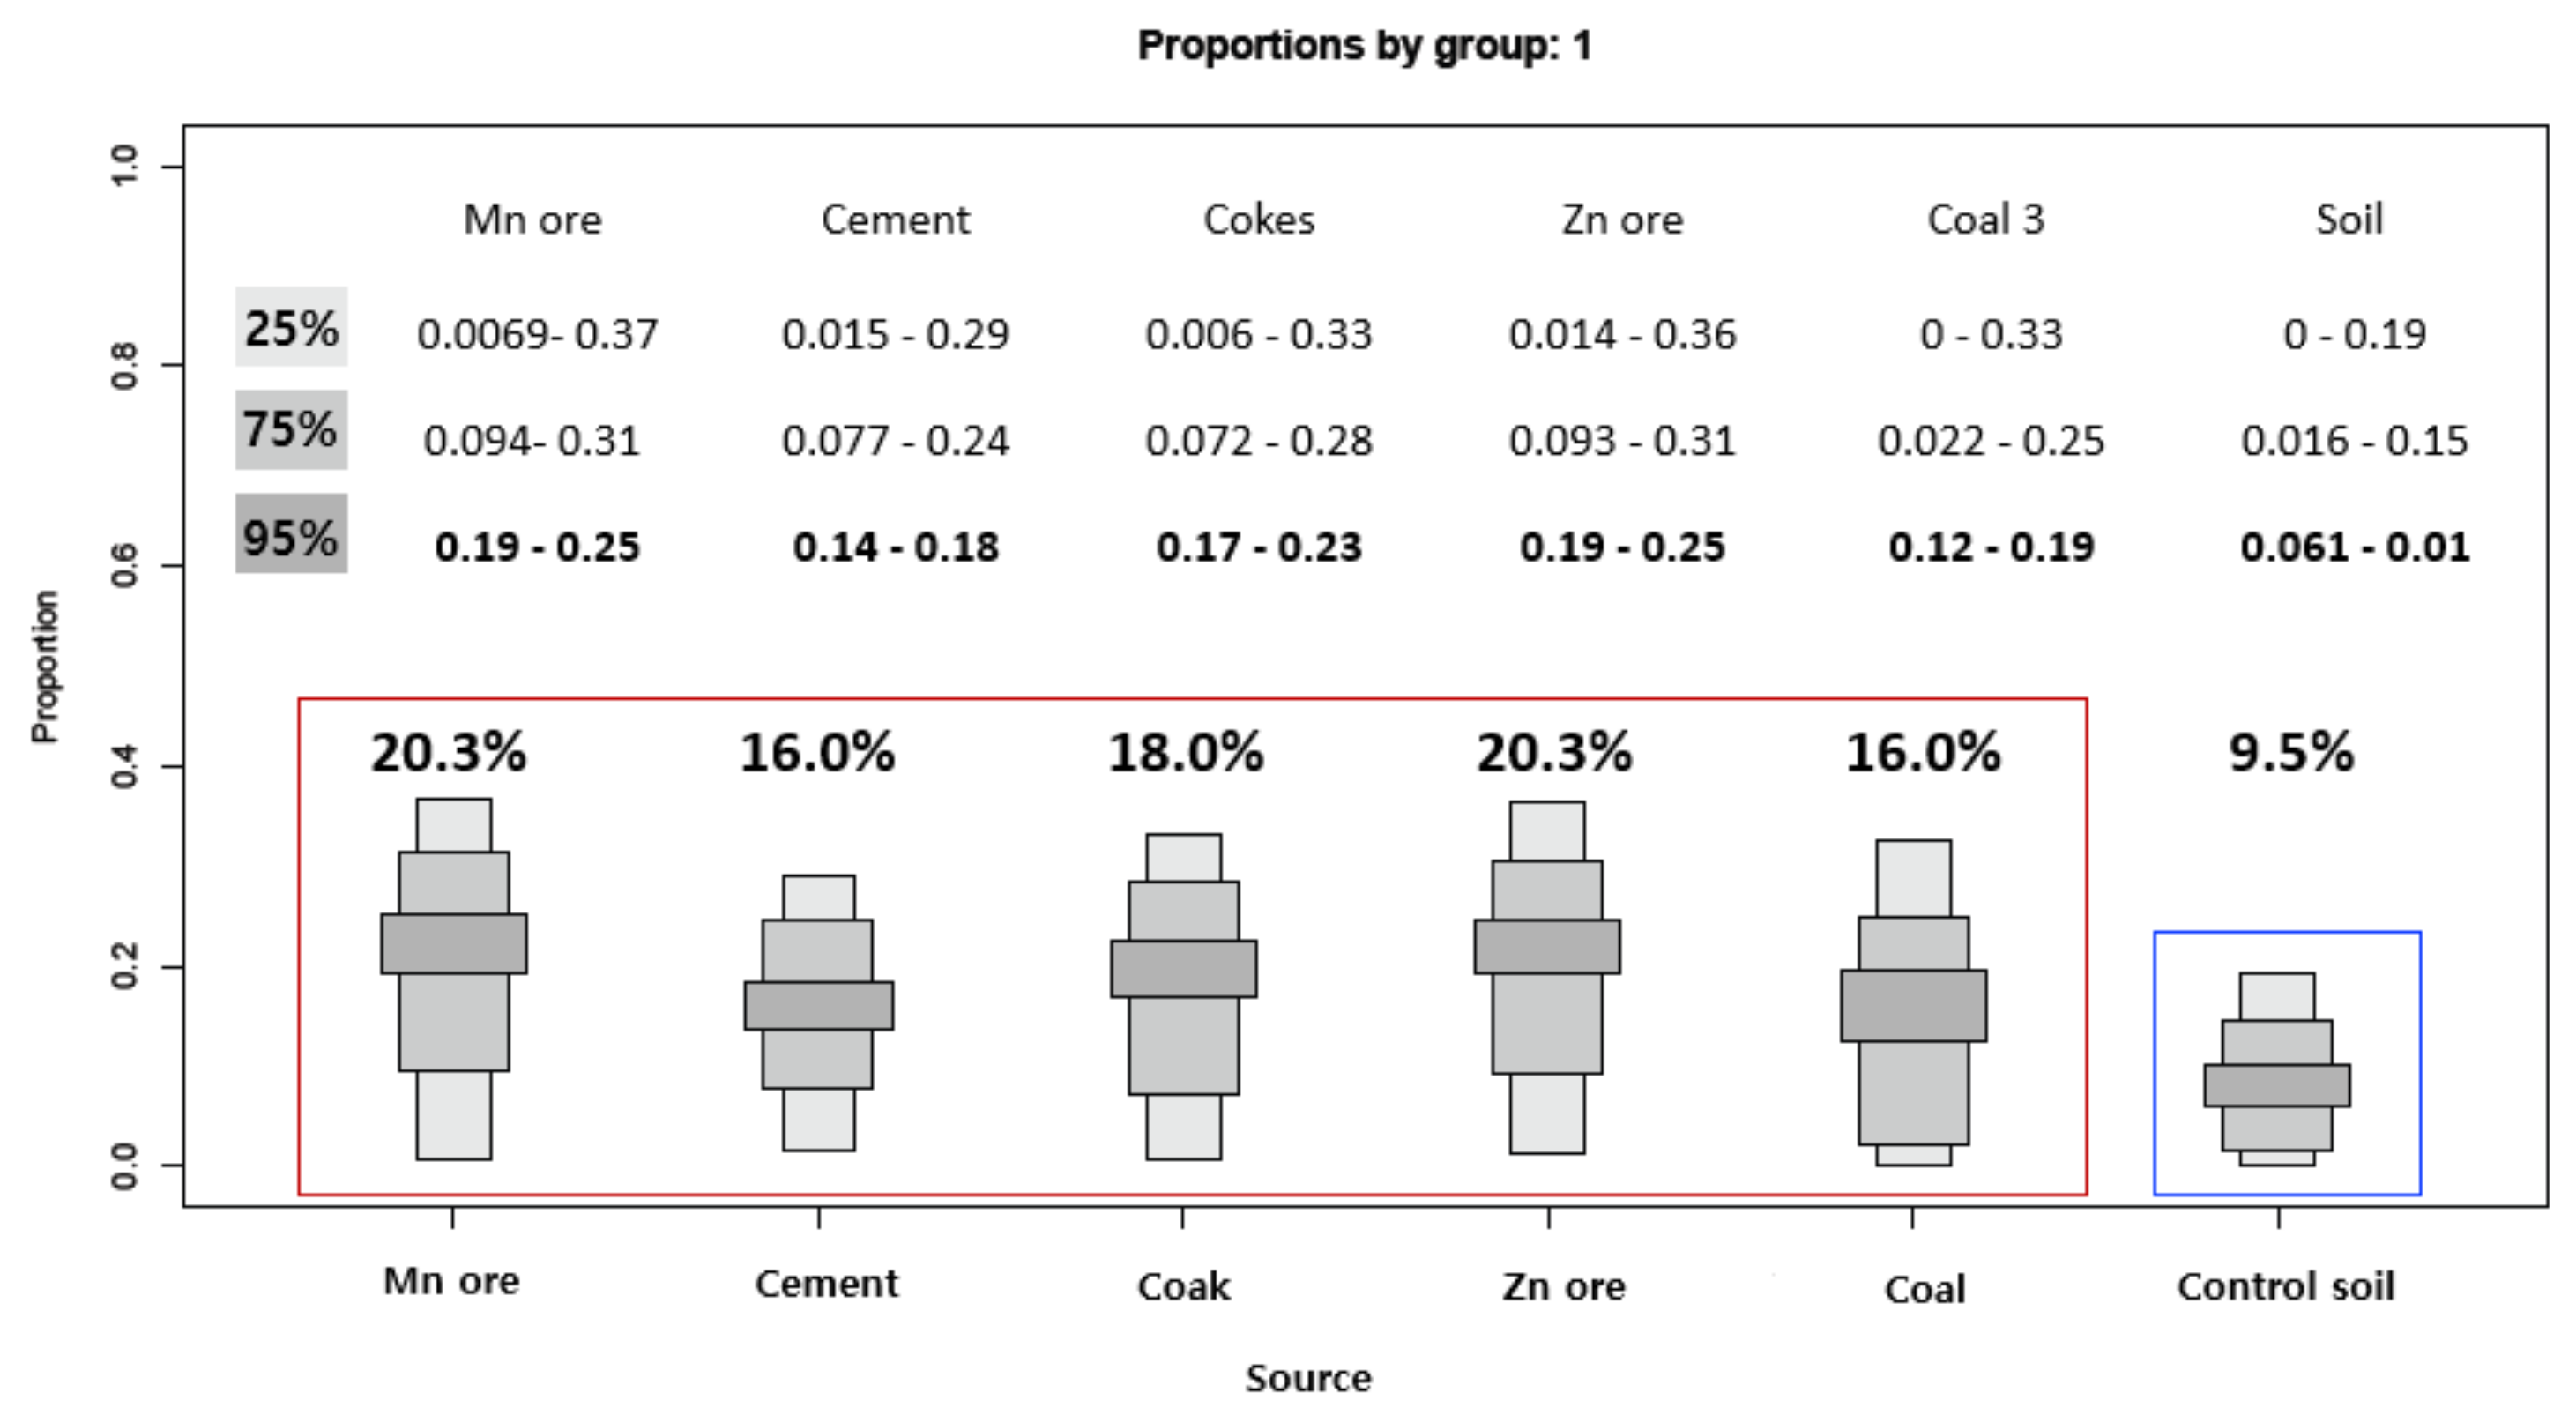
3.4. Contribution of Heavy Meatal Pollution to Urban Dust from the Pollution Source

The stable C isotope ratios (δ13C) in the urban dust (port) samples range from −23.8 to −25.8‰, except at the I-5 site (−20.8‰); urban dust (residence area) ranges from −23.5 to −25.1‰, and the topsoil samples from −24.3 to −25.8‰ (Figure 3). Urban dust (port) shows a heavy value of −20.8‰ at I-5, but the rest of the study area exhibits a similar range between urban dust (port) and topsoil, from −24.0 to −25.0‰. Among the pollutant sources, the stable C isotope ratios of Mn ore, cement, coke, Zn ore, coal, and control topsoil were −24.8, −19.9, −26.9, −24.2, −23.6, and −25.1‰, respectively, with a clear difference. The stable C isotope values of soils reflect the isotopic composition of the local vegetation, which in turn, depends on their photosynthetic pathways and land use [103]. However, the within-site δ13C values in topsoil samples in the study area were smaller, such that there is no effect from local vegetation on the relative proportions of C3 and C4 plants. The δ13C values in urban dust ranged from −23.5 to −25.1‰, except at I-5 (−20.8‰). Morera-Gomez et al. (2018) characterized the δ13C of aerosols emitted by several sources of contamination in Cienfuegos: soot particles from the combustion of diesel (δ13C: −26.3‰), shipping (δ13C: −25.7‰), and power plants (δ13C: −27.1‰) [42]. The δ13C value of urban dust in this study were enriched relative to these sources. In Mexico city, the δ13C values in urban dust (−17.0‰) and PM2.5 (−22‰) are more enriched [104], and are also more enriched, ranging from −16.4 to −18.4‰, in street dust in Japan [105], and more depleted, ranging from −26.4 to −26.6‰ of aerosol in France [106] (Figure 3). However, our results are similar to those from Kumasi street dust in Africa, which range from −23.9 to −26.6‰ [46]. We cannot easily explain the differences between the values for urban dust from our study and that from previous studies. This trend may be due to the concentration of black carbon, organic carbon, and inorganic carbon contained in the urban dust. The δ13C value of black carbon is more depleted than that of TC because of the higher contribution of fossil fuels [106].
The combustion of biomass and automobile fuels (gasoline, LPG, and diesel) can also contribute to the carbon content of urban dust. Previous studies have reported the typical δ13C values associated with various fossil fuels, biomass, and their combustion products [45,82,84]. The δ13C values in urban dust from the study area were out of range of the C3 and C4 plants [104,106]; also burning has not occurred in or near the study area for decades. Therefore, urban dust at each location in the study area are notably impacted by mixtures of the main sources (Mn ore, Zn ore, cement, cokes, coal, and topsoil) with different δ13C values. The most negative δ13C values were found at a coke stockpile, while the most enriched δ13C values were found at a cement stockpile. The δ13C values at site I-5 (port area) were 13C-enriched relative to the other sites, which likely reflects different carbon sources. The location of site I-5 is close to the cement stockpile, where the δ13C values are similar to those of cement source, such that there is a possible influence from cement. However, the δ13C values at site I-4 (port area) had more negative values than the other sites, i.e., similar to the coke source, which had the most negative δ13C value. The variations in the δ13C of urban dust from the different locations may therefore reflect differences in the sources and/or intensity of pollution.
The Pb isotope signatures of urban dust (port) range from 0.864 to 0.889 for 207/206Pb and 2.102 to 2.136 for 208/206Pb. The 207/206Pb and 208/206Pb ratios of urban dust (resident) range between 0.863 and 0.882, and 2.093 and 2.127, respectively. The 207/206Pb and 208/206Pb ratios of topsoil range between 0.869 and 0.891, and 2.107 and 2.139, respectively (Figure 4). Among the pollutant sources, the Pb stable isotope ratio of Mn ore, cement, coke, Zn ore, coal, and control topsoil is 0.911, 0.859, 0.874, 0.917, 0.836, and 0.774, respectively. In general, the results show that these source groups are notably different in terms of their Pb isotope compositions. The 207/206Pb and 208/206Pb ratios plotted in Figure 4 show a linear trend for all samples with an excellent regression coefficient (R2 = 0.89), although a slightly better regression coefficient is obtained when only dust is considered (R2 = 0.92, not shown in figure). The linear array is interpreted to illustrate mixing. The control topsoil has more radiogenic Pb isotope values, forming a restricted field that defines the lithologic Pb isotope signature for this region. The Pb isotope value of the pollution source sample does not overlap the soil sample, suggesting it may be an important component of the geogenic end-member. In contrast, urban dust, such as the topsoil sample, has a less radiogenic Pb value, which represents the isotopic imprint of a yet unknown anthropogenic end-member. In general, the characteristics of Pb isotopes, after the smelting of nonferrous metals, reflect the Pb isotope values in the ore before processing because the fractionation of Pb isotopes rarely occurs during the smelting process, or its effect is minimal. In general, the Zn concentrations in Zn ore are 4–10%, but when Zn ore is used as a raw material in Korea, the concentration is increased to 55–60% through flotation [67]. All of these materials are imported from Australia, Peru, and Mexico (http://www.kita.net accessed on 10 June 2021). In general, Zn ore from Central and South America is known to have 207/206Pb values of 0.829 to 0.851, while Zn ore from Australia ranges from 0.909 to 0.970. For Australian Zn ore used in domestic Zn smelting facilities, 207/206Pb was found to have a value of 0.929 to 0.956. The Pb isotope ratio of Zn ore in the study area falls within the range of the Pb isotope ratios of Australian Zn ore rather than those from Central and South America; furthermore, these ratios follow the characteristic Pb isotope line of large sulfide mines such as the Broken Hill mine in Australia. However, in the study area, the Pb isotope ratio in the urban dust sample was 0.864–0.891, which is different from the Pb isotope ratio of the Zn and Mn ore. These results indicate that Pb-induced pollutants in the urban dust are not only from Zn or Mn ore, but also from a wide variety of pollutants, such as cement, coke, Zn, and soil. The contribution rate was calculated using the C and Pb stable isotope ratio of the sample.
As a result of the evaluated contribution of pollutant sources on deposited dust through the Iso-source and SIAR models using the stable isotope ratios (13C, 207/206Pb), we found that the largest contribution was derived from Mn (20.4%) and Zn (20.3%) from industrial factories (Figure 5). These results are consistent with the results of high concentrations of Mn and Zn in the urban dust mentioned above. In previous studies, Pb or C isotope ratios alone were used to trace pollution sources, but this is the first study to identify pollutants using both isotopes ratios.

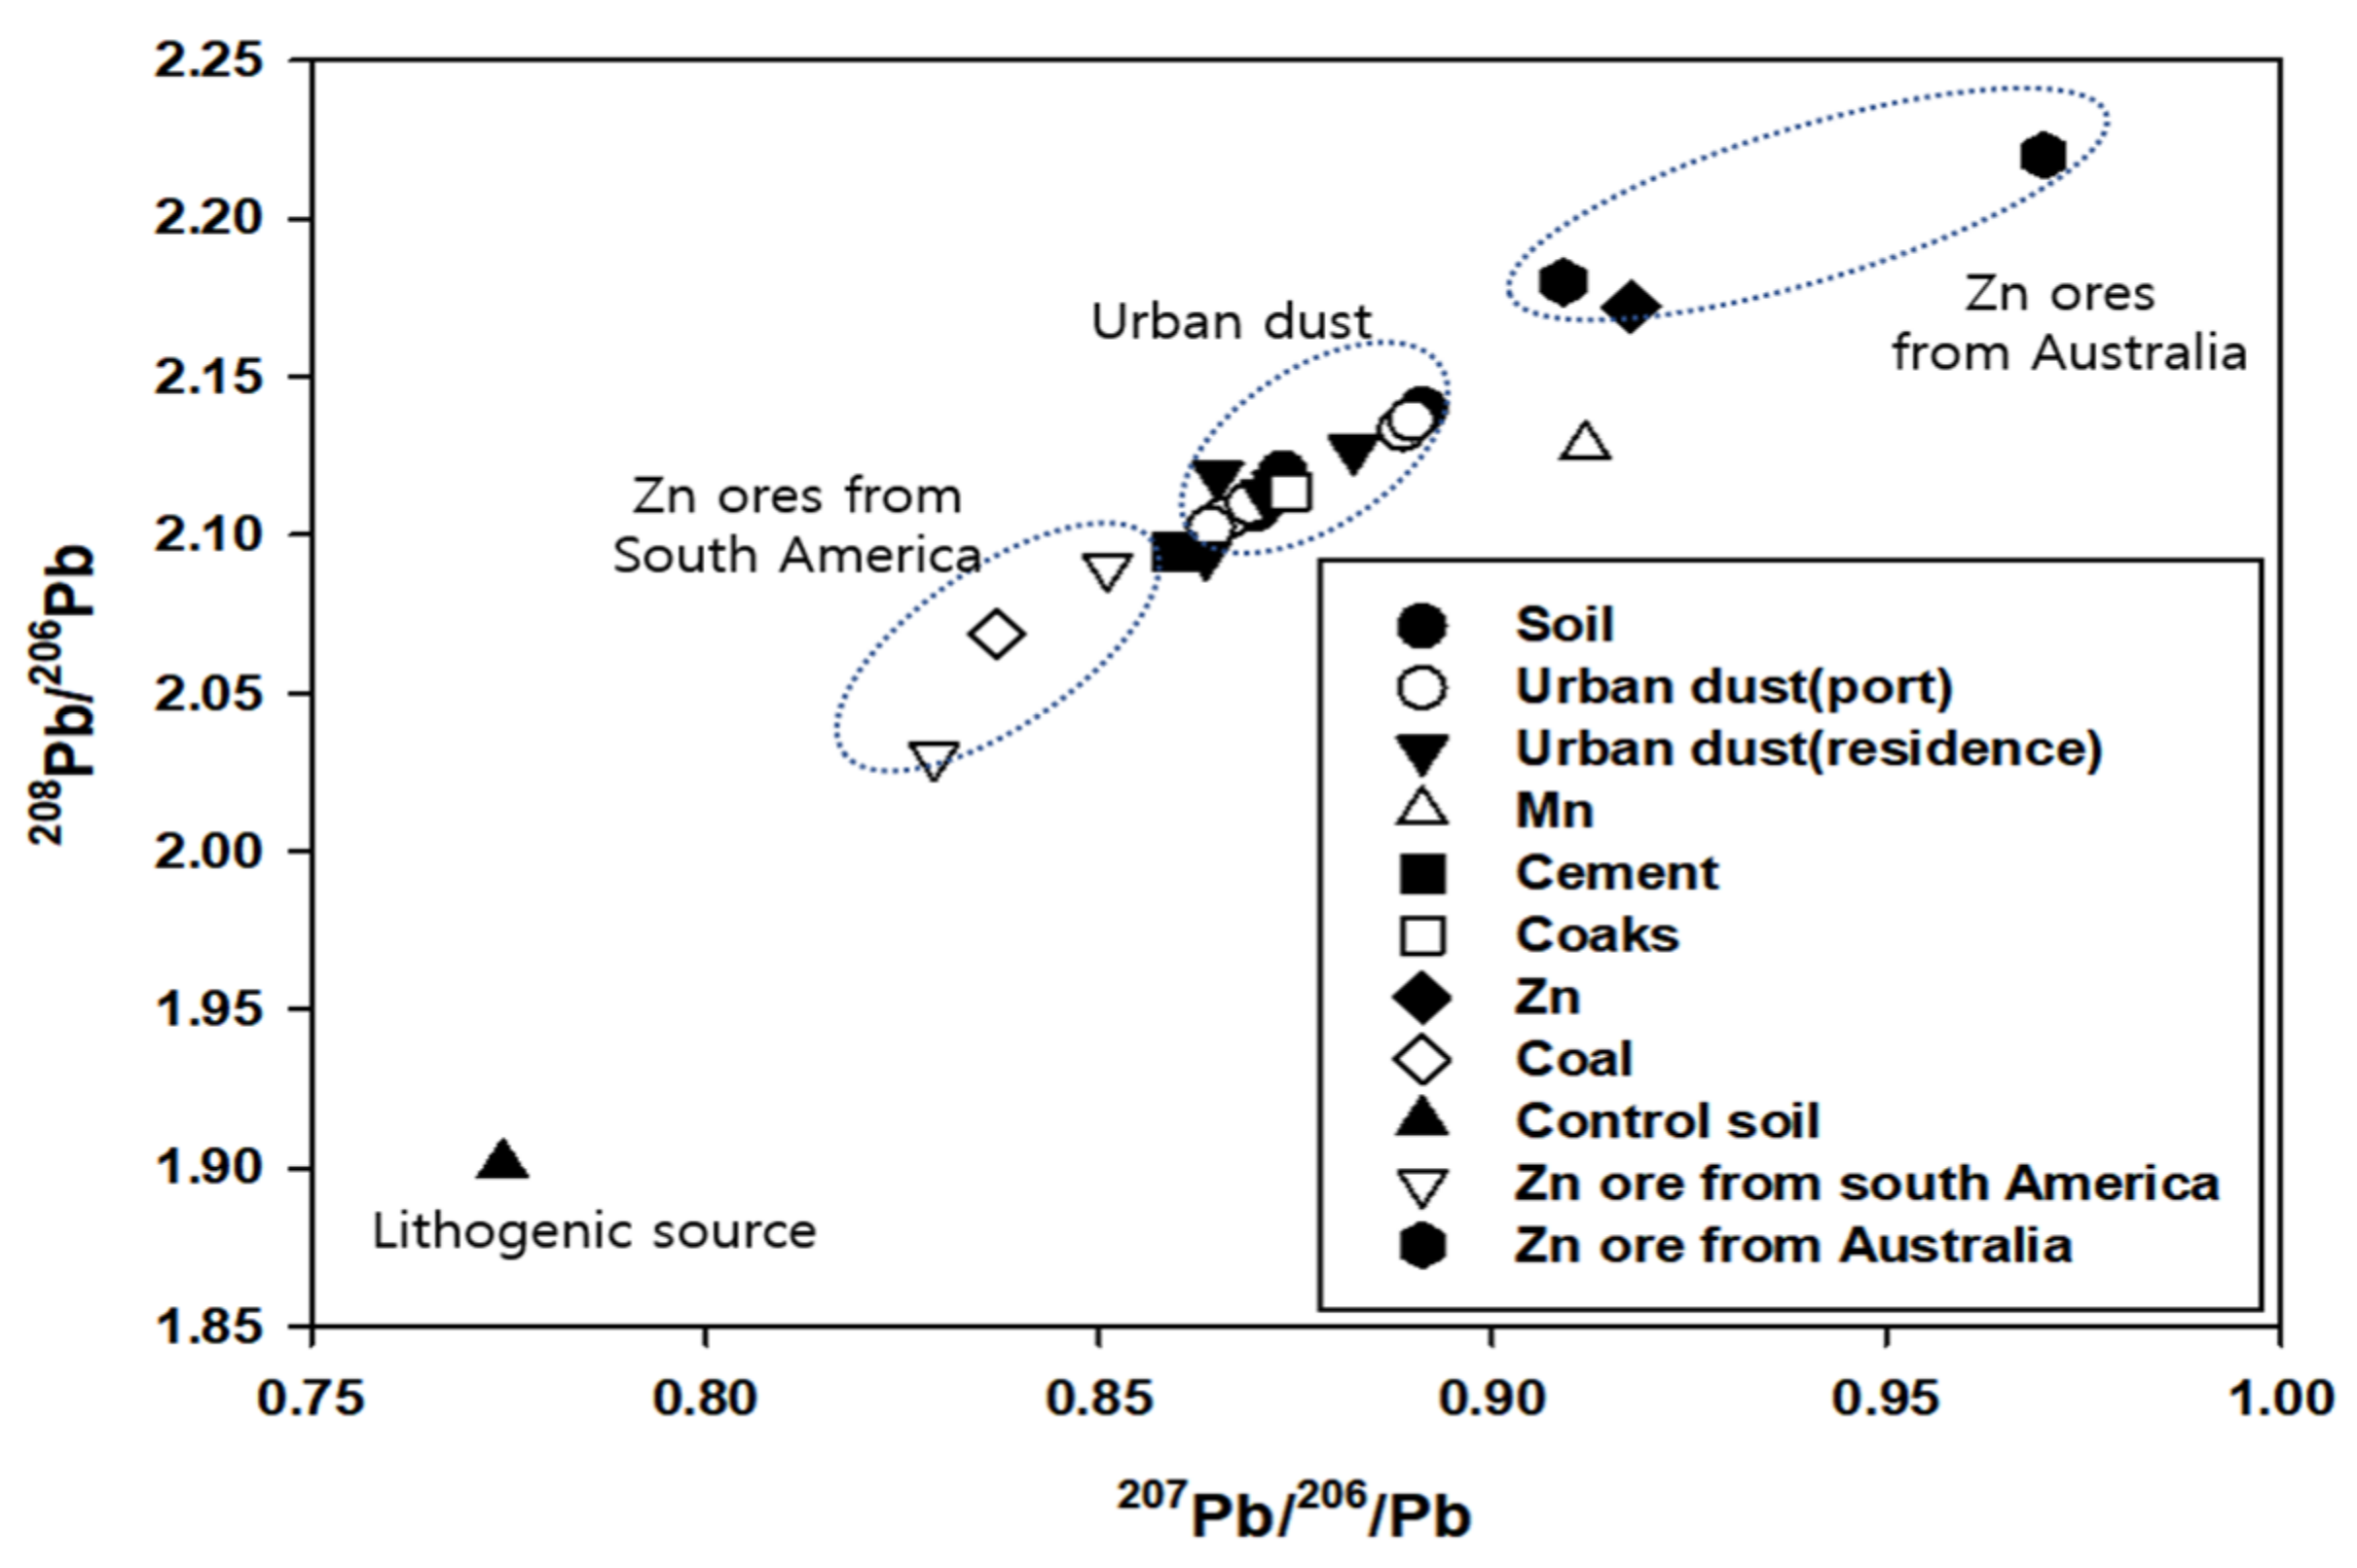
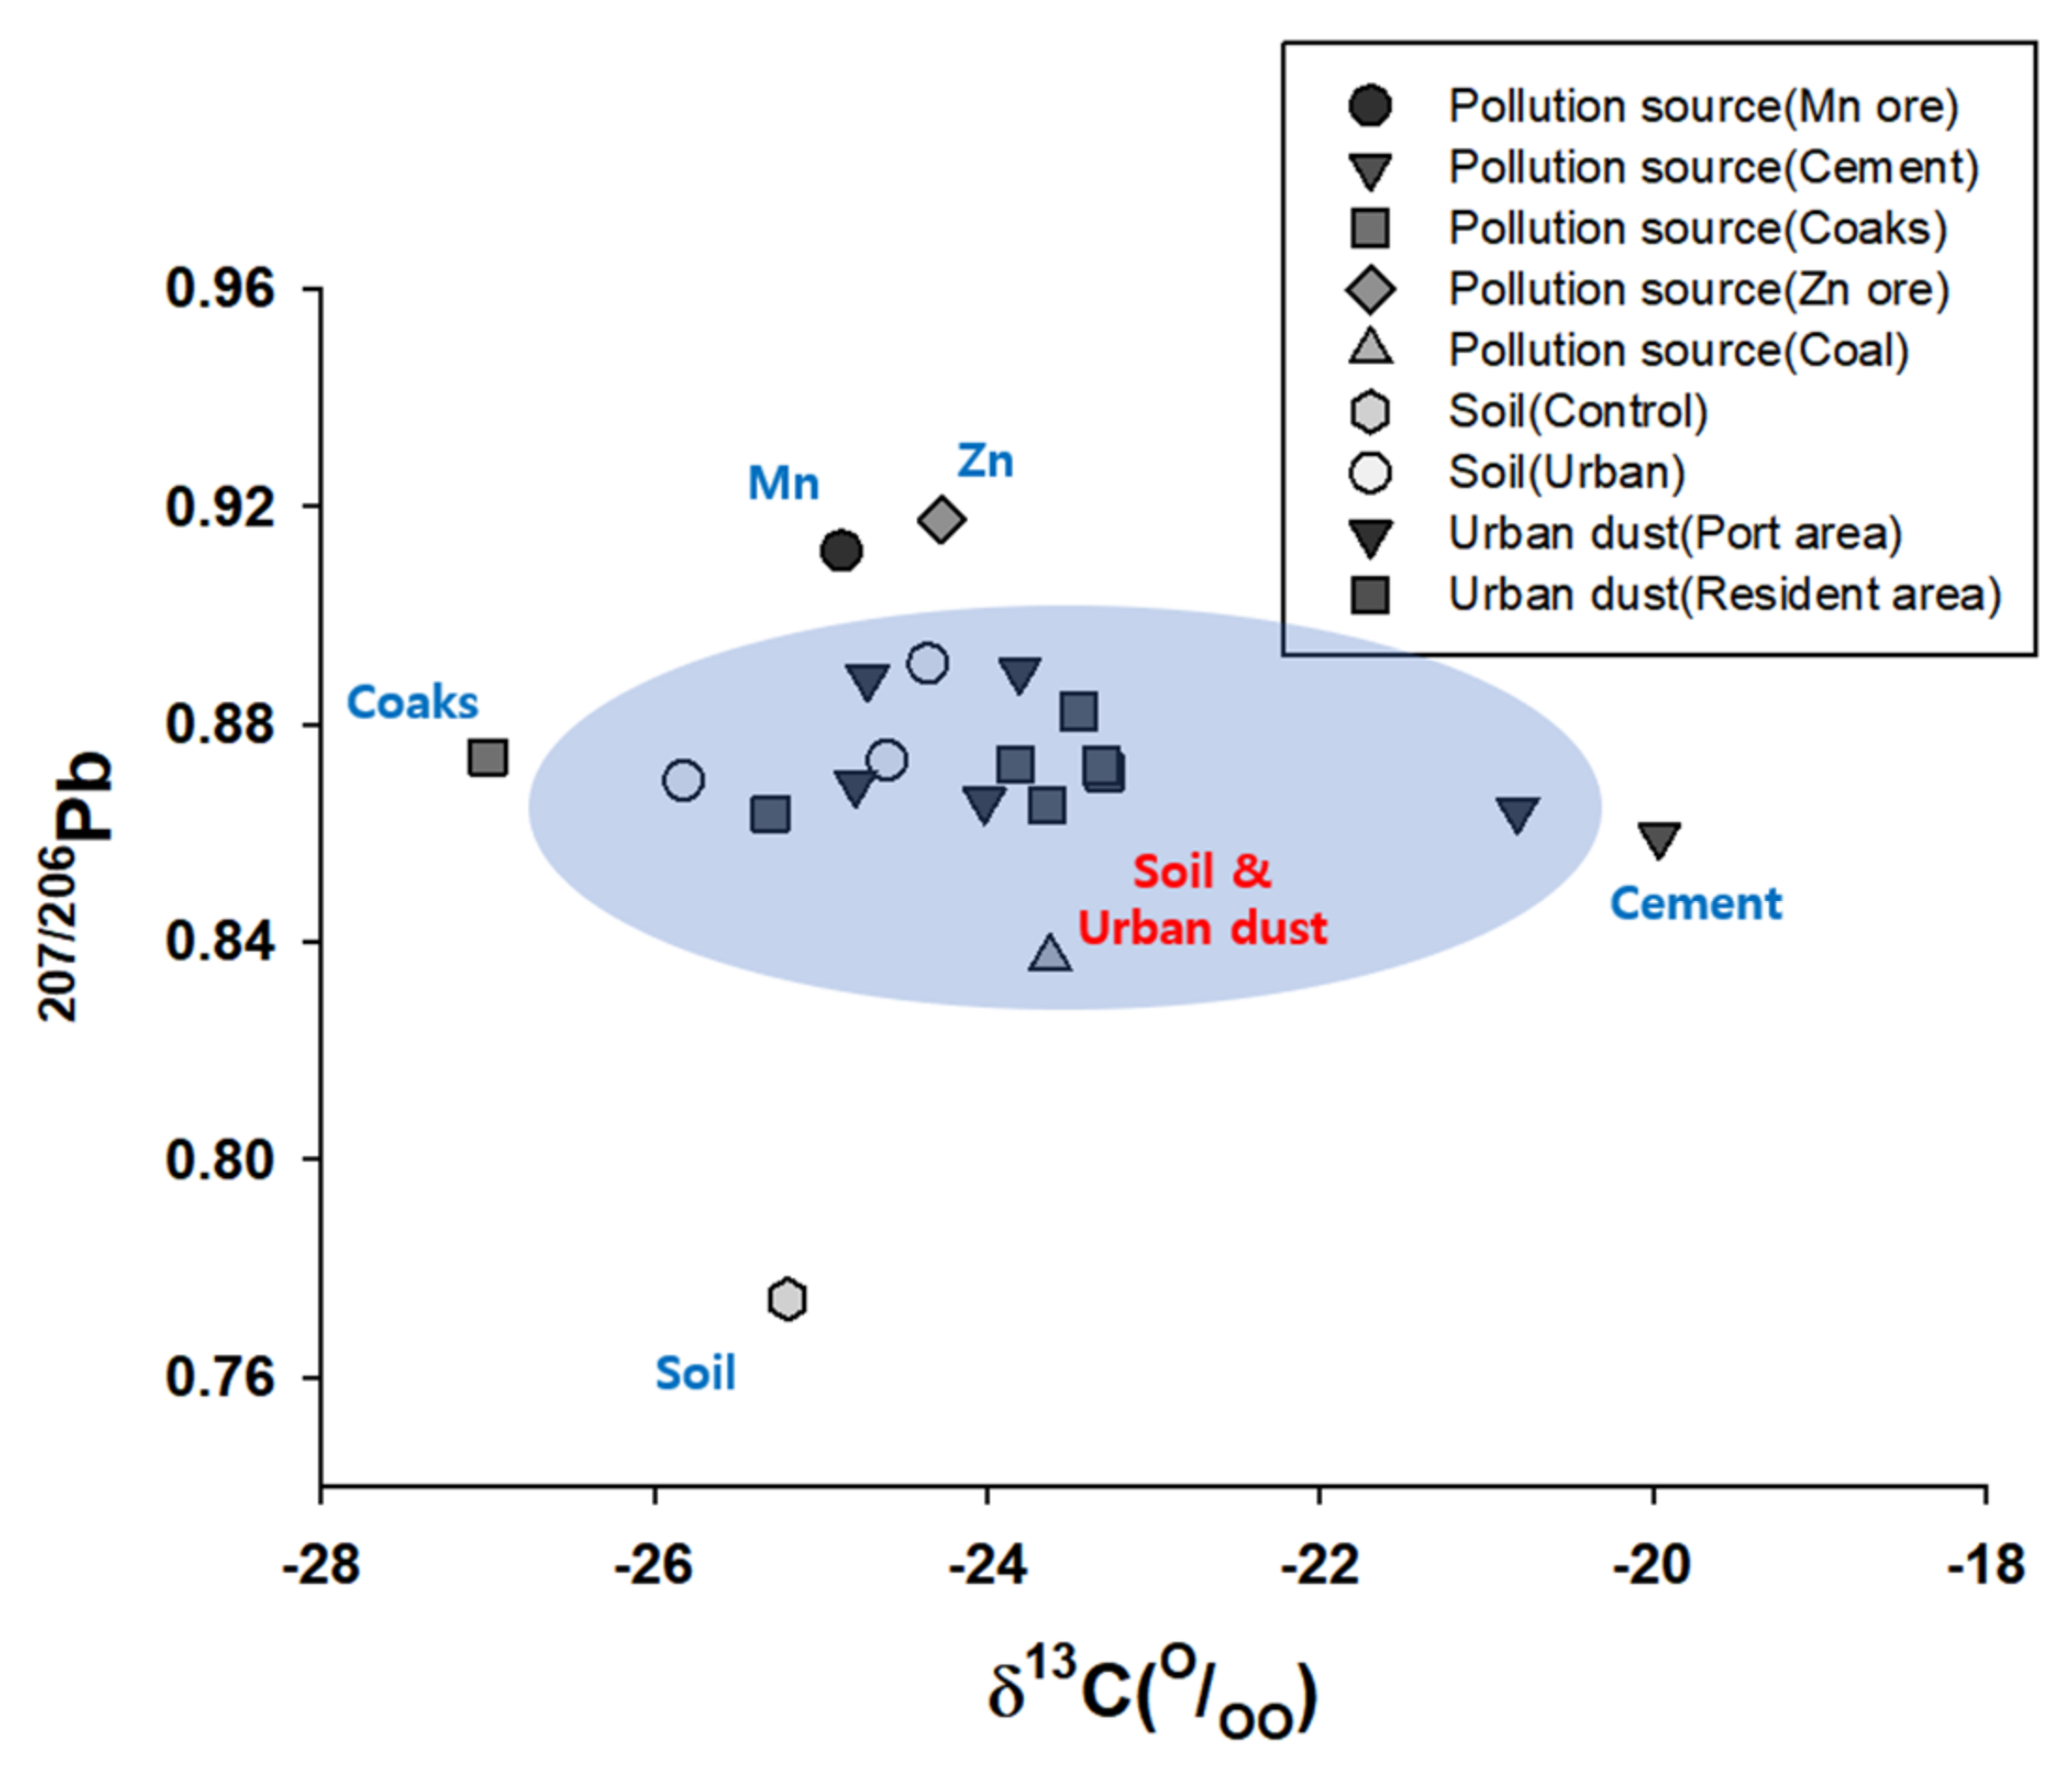
3.5. Application of Multi-Isotope Techniques as a Useful Indicator to Trace Pollutant Sources

This research combined the analysis of metal concentration with carbon and lead isotopes to characterize sources and source contributions for urban dust and soil in industrial complex areas near a port. Our results suggest that a stockpile of raw material and the operation of a steel factory in the Donghae port significantly influence the concentration levels of Mn, Zn, Cd, and Pb in the surrounding soil and urban dust. In this context, this study demonstrated that carbon and lead isotopes, combined with the analysis of metal concentrations, could more effectively trace the effects of anthropogenic pollutants related to urbanization on urban dust than the analysis of heavy metals alone.
Previous studies have developed numerous methods, such as metal concentration, metal ratios of some crustal elements, statistical analyses, and clustering analysis, to trace various types of environmental pollutions that are often difficult to identify. These methods are easy to use, but typically only offer general information on the source. In addition, this approach is restricted in its efficacy for determining the specific sources of pollutants and discriminating among them. In our results, when carbon or lead isotopes were used alone, it was difficult to distinguish between pollutants (Figure 3 and Figure 4), but when carbon and lead were used together, pollutants could be distinguished (Figure 6). The source contribution analysis carry out herein shows that metal concentrations as well as C and Pb isotopes could be united to helpful quantify source contributions and supply a basis for pollution prevention. Furthermore, the application of an additional novel multi-isotope approach, such as Cd, Cu, and Zn as environmental tracers, could be important to identifying pollution sources, as well as for understanding the behavior or environmental pollution and contribution of urban dust in various environments. Finally, the establishment of a database on multi-isotopic composition would remarkably contribute to the identification and management of individual sources of heavy metal pollution.

3.6. Implications for Environmental Management and Human Health

New ports are being built or existing ports are being expanded throughout the world to meet the increasing demands of the population and the requirements of industries [91]. This port activity has the potential to cause serious pollution problem for decades, over a large area. Port activities can have a negative effect of air quality in the surrounding areas due to various activities such as loading, transporting, and storing cargo. The particles derived from port and industrial activities are composed of a complex mixture of particles, among which the fine fraction may be resuspended by wind and thus cause a respiratory risk to human health [5,113]. This dust is highly bioaccessible through gastric and respiratory exposure pathways, leading to lethal disease. Hence, for the monitoring of pollution levels, identification of pollution sources, control of waste from point and non-point sources and estimation of pollution levels for future, regular observation and evaluation are required throughout the entire operation and construction phase of a port.
Urban and road dust runoff discharge into the ocean may also transfer a fairly large amount of nutrients. The availability of these nutrients beyond coastal ecosystem is also an important factor for algal blooms. Recently, such events have been reported in the world [114]. The local authorities in Donghae port are now investing significant efforts and resources in monitoring the local environment. Our results should help them design a more effective environmental management of air pollution in Donghae port.

4. Conclusions

The heavy metal pollution of urban dust in ports and residential areas was evaluated to obtain the relative contribution to pollution source. Most of the heavy metals in the study area were found in the range of variation of those reported in industrial complex areas, but some heavy metal such as Mn, Zn, Cd, and Pb presented 85~112-fold higher levels (EF > 100) than those of the control area, indicating significant contributions of these elements from anthropogenic sources. As a result of calculating the contribution of six major pollutant sources by Iso-source model, it was seen that Mn and Zn ore stockpiles contribute to more than 40% of urban dust. This suggests that both a stockpile of raw material and the operation of a steel factory in the Donghae port significantly influence the concentration levels of Mn, Zn, Cd, and Pb in the surrounding soil and urban dust. For the first time, C and Pb stable isotope ratios in urban dust were assessed to trace pollution sources in an industrial complex port area. This study provides appropriate guidance for further assessing the contributions of pollution sources in the study area, and could help to establish environmental strategies for the improvement of air quality and ecosystem. All of the above can be utilized by public health authorities and policymakers in Donghae port and in other areas with similar geo-environmental conditions.

Author Contributions

M.-S.K., conceptualization, resources, data curation, writing—original draft, and writing—review and editing; J.-Y.K., conceptualization; J.P. and S.-H.Y., formal analysis; S.S. and J.C., resources. All authors have read and agreed to the published version of the manuscript.

Funding

This study was supported by the National Institute of Environment Research (NIER, RP2016-167).

Conflicts of Interest

The authors declare no conflict of interest.

References

  1. Kim, B.M.; Park, J.-S.; Kim, S.W.; Kim, H.; Jeon, H.; Cho, C.; Kim, J.-H.; Hong, S.; Rupakheti, M.; Panday, A.K.; et al. Source apportionment of PM10 mass and particulate carbon in the Kathmandu Valley, Nepal. Atmos. Environ. 2015, 123, 190–199. [Google Scholar] [CrossRef] [Green Version]
  2. Squizzato, S.; Cazzaro, M.; Innocente, E.; Visin, F.; Hopke, P.K.; Rampazzo, G. Urban air quality in a mid-size city—PM2.5 composition, sources and identification of impact areas: From local to long range contributions. Atmos. Res. 2017, 186, 51–62. [Google Scholar] [CrossRef] [Green Version]
  3. Li, F.; Jinxu, Y.; Shao, L.; Zhang, G.; Wang, J.; Jin, Z. Delineating the origin of Pb and Cd in the urban dust through elemental and stable isotopic ratio: A study from Hangzhou City, China. Chemosphere 2018, 211, 674–683. [Google Scholar] [CrossRef] [PubMed]
  4. Jeong, H.; Choi, J.Y.; Lee, J.; Lim, J.; Ra, K. Heavy metal pollution by road-deposited sediments and its contribution to total suspended solids in rainfall runoff from intensive industrial areas. Environ. Pollut. 2020, 265, 115028. [Google Scholar] [CrossRef]
  5. Davis, A.P.; Shokouhian, M.; Ni, S. Loading estimates of lead, copper, cadmium, and zinc in urban runoff from specific sources. Chemosphere 2001, 44, 997–1009. [Google Scholar] [CrossRef]
  6. Lau, S.; Han, Y.; Kang, J.; Kayhanian, M.; Stenstrom, M.K. Characteristics of highway stormwater runoff in Los Angeles: Metals and polycyclic aromatic hydrocarbons. Water Environ. Res. 2009, 81, 308–318. [Google Scholar] [CrossRef]
  7. Egodawatta, P.; Ziyath, A.M.; Goonetilleke, A. Characterising metal build-up on urban road surfaces. Environ. Pollut. 2013, 176, 87–91. [Google Scholar] [CrossRef] [Green Version]
  8. Yu, Y.; Li, Y.; Li, B.; Shen, Z.; Stenstrom, M.K. Metal enrichment and lead isotope analysis for source apportionment in the urban dust and rural surface soil. Environ. Pollut. 2016, 216, 764–772. [Google Scholar] [CrossRef] [Green Version]
  9. Harvey, P.J.; Rouillon, M.; Dong, C.; Ettler, V.; Handley, H.K.; Taylor, M.P.; Tyson, E.; Tennant, P.; Telfer, V.; Trinh, R. Geochemical sources, forms and phases of soil contamination in an industrial city. Sci. Total Environ. 2017, 584−585, 505–514. [Google Scholar] [CrossRef]
  10. Gelly, R.; Fekiacova, Z.; Guihou, A.; Doelsch, E.; Deschamps, P.; Keller, C. Lead, zinc and copper redistributions in soils along deposition gradient from emissions of Pb-Ag smelter decommissioned 100 years ago. Sci. Total Environ. 2019, 665, 502–512. [Google Scholar] [CrossRef] [Green Version]
  11. Kelepertzis, E.; Argyraki, A.; Chrastny, V.; Botsou, F.; Skordas, K.; Komarek, M.; Fouskas, A. Metal(loid) and isotopic tracing of Pb in soils, road and house dusts from the industrial area of Volos (central Greece). Sci. Total Environ. 2020, 725, 138300. [Google Scholar] [CrossRef]
  12. Jeong, H.; Chio, J.Y.; Lee, J.; Ra, K. Investigations of Pb and Cu isotopes to trace contamination sources from the artificial Shihwa Lake in Korea. J. Coast. Res. 2020, 95, 1122–1127. [Google Scholar] [CrossRef]
  13. Wong, C.S.C.; Li, X.; Thornton, I. Urban environmental geochemistry of trace metals. Environ. Pollut. 2006, 142, 1–16. [Google Scholar] [CrossRef] [Green Version]
  14. Ali, M.U.; Liu, G.; Yousaf, B.; Ullah, H.; Abbas, Q.M.; Munir, M.A.M. A systematic review on global pollution status of particulate matter-associated potential toxic elements and health perspectives in urban environment. Environ. Geochem. Health 2019, 41, 1131–1162. [Google Scholar] [CrossRef]
  15. Jeong, H.; Choi, J.Y.; Lim, J.; Shim, W.J.; Kim, Y.O. Characterization of the contribution of road deposited sediments to the contamination of the close marine environment with trace metals: Case of the port city of Busan (South Korea). Mar. Pollut. Bull. 2020, 161, 111717. [Google Scholar] [CrossRef]
  16. Dytolw, S.; Gorka-Kostrubiec, B. Concentration of heavy metals in street dust: An implication of using different geochemical background data in estimating the level of heavy metal pollution. Environ. Geochem. Health 2021, 43, 521–535. [Google Scholar] [CrossRef]
  17. McConnell, R.; Berhane, K.; Gilliand, F.; Molitor, J.; Thomas, D.; Lurmann, F.; Avol, E.; Gauderman, W.J.; Peters, J.M. Prospective study of air pollution and bronchitic symptoms in children with asthma. Am. J. Respir. Crit. Care Med. 2003, 168, 790–797. [Google Scholar] [CrossRef]
  18. Pope, C.A.; Dockery, D.W. Health effects of fine particulate air pollution: Lines that connect. J. Air Waste Manag. Assoc. 2006, 56, 709–742. [Google Scholar] [CrossRef]
  19. Dockery, D.W.; Stone, P.H. Cardiovascular risks from fine particulate air pollution. N. Engl. J. Med. 2007, 3, 511–513. [Google Scholar] [CrossRef] [Green Version]
  20. Kumar, R.; Nagar, J.K.; Kumar, H.; Kushwah, A.S.; Meena, M.; Kumar, P.; Raj, N.; Singhal, M.K.; Gaur, S.N. Association of indoor and outdoor air pollutant level with respiratory problems among children in an industrial area of Delhi, India. Arch. Environ. Occup. Health 2007, 62, 75–80. [Google Scholar] [CrossRef]
  21. Zhou, J.; Zhang, R.; Cao, J.; Chow, J.C.; Watson, J.G. Carbonaceous and ionic components of atmospheric fine particles in Beijing and their impact on atmospheric visibility. Aerosol. Air. Qual. Res. 2012, 12, 492–502. [Google Scholar] [CrossRef]
  22. WHO. Health Effects of Particulate Matter. WHO Regional Office for Europe, Copenhagen. Available online: https://www.euro.who.int/__data/assets/pdf_file/0006/189051/Health-effects-of-particulate-matter-final-Eng.pdf (accessed on 10 June 2021).
  23. WHO. WHO|WHO Releases Country Estimates on Air Pollution Exposure and Health Impact. Available online: https://www.who.int/news/item/27-09-2016-who-releases-country-estimates-on-air-pollution-exposure-and-health-impact (accessed on 10 June 2021).
  24. Zahran, S.; Mielke, H.W.; McElmurry, S.P.; Filippelli, G.M.; Laidlaw, M.A.S.; Taylor, M.P. Determining the relative importance of soil sample locations to predict risk of child lead exposure. Environ. Int. 2013, 60, 7–14. [Google Scholar] [CrossRef]
  25. Morera-Gomez, Y.; Santamaria, J.M.; Elustondo, D.; Lasheras, E.; Alonso-Hernandez, C.M. Determination and source apportionment of major and trace elements in atmospheric bulk deposition in a Caribbean rural area. Atmos. Environ. 2019, 202, 93–104. [Google Scholar] [CrossRef]
  26. Li, H.-B.; Chen, K.; Juhasz, A.L.; Huang, L.; Ma, L.Q. Childhood lead exposure in an industrial town in China: Coupling stable isotope ratios with bioaccessible lead. Environ. Sci. Technol. 2015, 49, 5080–5087. [Google Scholar] [CrossRef]
  27. Varrica, D.; Dongarrà, G.; Alaimo, M.G.; Monna, F.; Losno, R.; Sanna, E.; De Giudici, G.; Tamburo, E. Lead isotopic fingerprint in human scalp hair: The case study of Iglesias mining district (Sardinia, Italy). Sci. Total Environ. 2018, 613–614, 456–461. [Google Scholar] [CrossRef]
  28. Franco-Uría, A.; López-Mateo, C.; Roca, E.; Fernández-Marcos, M.L. Source identification of heavy metals in pastureland by multivariate analysis in NW Spain. J. Hazard. Mater. 2009, 165, 1008–1015. [Google Scholar] [CrossRef]
  29. Lu, X.; Wang, L.; Li, L.Y.; Lei, K.; Huang, L.; Kang, D. Multivariate statistical analysis of heavy metals in street dust of Baoji, NW China. J. Hazard. Mater. 2010, 173, 744–749. [Google Scholar] [CrossRef]
  30. Sudheer, A.K.; Rengarajan, R. Atmospheric mineral dust and trace metals over urban environment in Western India during winter. Aerosol. Air Qual. Res. 2012, 12, 923–933. [Google Scholar] [CrossRef] [Green Version]
  31. Zhao, H.; Li, X. Risk assessment of metals in road-deposited sediment along an urban-rural gradient. Environ. Pollut. 2013, 174, 297–304. [Google Scholar] [CrossRef] [PubMed]
  32. Qiu, K.; Xing, W.; Scheckel, K.G.; Cheng, Y.; Zhao, Z.; Ruan, X.; Li, L. Temporal and seasonal variations of As, Cd and Pb atmospheric deposition flux in the vicinity of lead smelters in Jiyuan. China. Atmos. Pollut. Res. 2016, 7, 170–179. [Google Scholar] [CrossRef]
  33. Zglobicki, W.; Telecka, M. Heavy metals in urban street dust: Health risk assessment (Lublin City, E Poland). Appl. Sci. 2021, 11, 4092. [Google Scholar] [CrossRef]
  34. Ichu, C.R.; Ume, J.I.; Opara, A.I.; Ibe, F.C. Ecological risk assessment and pollution models of trace metal concentrations in road dust in parts of Enugu, Southeastern Nigeria. J. Chem. Health Risks 2021, 11, 135–151. [Google Scholar]
  35. Al-Shidi, H.K.; Al-Reasi, H.A.; Sulaiman, H. Heayv metals levels in road dust from Muscat, Oman: Relationship with traffic voulmes, and ecological and health risk assessments. Int. J. Environ. Health Res. 2020, 13, 1–13. [Google Scholar]
  36. Jeong, H.; Choi, J.Y.; Ra, K. Potentially toxic elements pollution in road deposited sediments around the active smelting industry of Korea. Sci. Rep. 2021, 11, 7238. [Google Scholar] [CrossRef]
  37. Jeong, H.; Choi, J.Y.; Lim, J.; Ra, K. Pollution caused by potentially toxic elements present in road dust from indusrial areas in Korea. Atmosphere 2020, 11, 1366. [Google Scholar] [CrossRef]
  38. Ma, S.X.; Peng, P.A.; Song, J.Z.; Zhao, J.P.; He, L.L.; Sheng, G.Y.; Fu, J.M. Stable carbon isotopic compositions of organic acids in total suspended particles and dusts from Guangzhou. China Atmos. Res. 2010, 98, 176–182. [Google Scholar] [CrossRef]
  39. Masalaite, A.; Remeikis, V.; Garbaras, A.; Dudoitis, V.; Ulevicius, V.; Ceburnis, D. Elucidating carbonaceous aerosol sources by the stable carbon δ13CTC ratio in sizesegregated particles. Atmos. Res. 2015, 158–159, 1–12. [Google Scholar] [CrossRef]
  40. Guo, Z.; Jiang, W.; Chen, S.; Sun, D.; Shi, L.; Zeng, G.; Rui, M. Stable isotopic compositions of elemental carbon in PM1.1 in north suburb of Nanjing Region, China. Atmos. Res. 2016, 168, 105–111. [Google Scholar] [CrossRef]
  41. Dong, S.; Gonzalez, R.O.; Harrison, R.M.; Green, D.; North, R.; Fowler, G.; Weiss, D. Isotopic signatures suggest important contributions from recycled gasoline, road dust and non-exhaust traffic sources for copper, zinc and lead in PM10 in London, United Kingdom. Atmos. Environ. 2017, 165, 88–98. [Google Scholar] [CrossRef] [Green Version]
  42. Morera-Gomez, Y.; Santamaria, J.M.; Elustondo, D.; Alonso-Hernandez, C.M.; Widory, D. Carbon and nitrogen isotopes unravels sources of aerosol contamination at Caribbean rural and urban coastal sites. Sci. Total Environ. 2018, 642, 723–732. [Google Scholar] [CrossRef]
  43. Jung, C.C.; Chou, C.C.K.; Lin, C.Y.; Shen, C.C.; Lin, Y.C.; Huang, Y.T.; Tsai, C.Y.; Yao, P.H.; Huang, C.R.; Huang, W.R.; et al. C-Sr, Pb isotopic characteristics of PM2.5 transported on the East-Asian continental outflows. Atmos. Res. 2019, 223, 88–97. [Google Scholar] [CrossRef]
  44. Gorka, M.; Zwolinska, E.; Malkiewicz, M.; Lewicka-Szczebak, D.; Jedrysek, M.O. Carbon and nitrogen isotope analyses coupled with palynological data of PM10 in Wroclawcity (SWPoland)-assessment of anthropogenic impact. Isot. Environ. Health Stud. 2012, 48, 327–344. [Google Scholar] [CrossRef] [PubMed]
  45. Guo, Q.J.; Strauss, H.; Chen, T.B.; Zhu, G.X.; Yang, J.; Yang, J.X.; Lei, M.; Zhou, X.Y.; Petersa, M.; Xie, Y.F.; et al. Tracing the source of Beijing soil organic carbon: A carbon isotope approach. Environ. Pollut. 2013, 176, 208–214. [Google Scholar] [CrossRef] [PubMed]
  46. Musa Bandowe, B.A.; Nkansah, M.A.; Leimer, S.; Fischer, D.; Lammel, G.; Han, Y. Cheimcal(C, N, S, black carbon, soot) and char and stable carbon isotope composition of street dusts from a major West African metropolis: Implication for source apportionment and exposure. Sci. Total Environ. 2019, 655, 1468–1478. [Google Scholar] [CrossRef]
  47. Ault, W.U.; Senechal, R.G.; Erlebach, W.E. Isotopic composition as a natural tracer of lead in the environment. Environ. Sci. Technol. 1970, 4, 305–313. [Google Scholar] [CrossRef]
  48. Komárek, M.; Ettler, V.; Chrastný, V.; Mihaljevič, M. Lead isotopes in environmental sciences: A review. Environ. Int. 2008, 34, 562–577. [Google Scholar] [CrossRef]
  49. Kelepertzis, E.; Komárek, M.; Argyraki, A.; Šillerová, H. Metal(loid) Distribution and Pb Isotopic Signatures in the Urban Environment of Athens, Greece. Environ. Pollut. 2016, 213, 420–431. [Google Scholar] [CrossRef]
  50. Han, L.F.; Gao, B.; Wei, X.; Xu, D.Y.; Gao, L. Spatial distribution, health risk assessment, and isotopic composition of lead contamination of street dusts in different functional areas of Beijing, China. Environ. Sci. Pollut. Res. 2016, 23, 3247–3255. [Google Scholar] [CrossRef]
  51. Kumar, M.; Furumai, H.; Kurisu, F.; Kasuga, I. Tracing source and distribution of heavy metals in road dust, soil and soakaway sediment through speciation and isotopic fingerprinting. Geoderma 2013, 211, 8–17. [Google Scholar] [CrossRef]
  52. Souto-Oliveira, C.E.; Babinski, M.; Araujo, D.F.; Andrade, M.F. Multi-isotopic fingerprints(Pb, Zn, Cu) applied for urban aerosol source apportionment and discrimination. Sci. Total Envion. 2018, 626, 1350–1366. [Google Scholar] [CrossRef]
  53. Liu, Y.; Liu, G.; Yousaf, B.; Zhou, C.; Shen, X. Identification of the featured-element in fine road dust of cities with coal contamination by geochemical investigation and isotopic monitoring. Environ. Int. 2021, 152, 106499. [Google Scholar] [CrossRef]
  54. Song, J.S.; Park, Y.G. Health Effect Survey among Residents nearby Dong-Hae Harbor; National Institute Environmental Research: Incheon, Korea, 2016; pp. 1–9. ISBN 11-1480523-002542-01.
  55. EPA (1999) Determination of Trace Metals in Ambient Particulate Matter Using Inductively Coupled Plasma Mass Spectrometry (ICP/MS). Compendium of methods IO-3.5, EPA/625/R-96/010a. Available online: https://www.epa.gov/sites/production/files/2019-11/documents/mthd-3-5.pdf (accessed on 10 June 2021).
  56. Kim, M.S.; Lee, W.S.; Kumar, K.S.; Shin, K.H.; Robarge, W.; Kim, M.S.; Lee, S.R. Effects of HCl pretreatment, drying, and storage on the stable isotope ratios of soil and sediment samples. Rapid Commun. Mass Spectrom. 2016, 30, 1575–1597. [Google Scholar] [CrossRef]
  57. Rudnick, R.I.; Gao, S. Composition of the continental crust. In The Crust; Rudnick, R.L., Ed.; Elsevier: Amsterdam, The Netherlands, 2003; pp. 1–64. [Google Scholar]
  58. Saeedi, M.; Li, L.Y.; Salmanzadeh, M. Heavy metals and polycyclic aromatic hydrocarbons: Pollution and ecological risk assessment in street dust of Tehran. J. Hazard. Mater. 2012, 227–228, 9–17. [Google Scholar] [CrossRef]
  59. Yang, J.; Teng, Y.; Song, L.; Zuo, R. Tracing soures and contamination assessments of heavy metals in road and foliar dusts in a typical mining city, China. PLoS ONE 2016, 11, e0168528. [Google Scholar] [CrossRef] [Green Version]
  60. Sutherland, R.A.; Tolosa, C.A. Multi-element analysis of road-deposited sediment in an urban drainage basin, Honolulu, Hawaii. Environ. Pollut. 2000, 110, 483–495. [Google Scholar] [CrossRef]
  61. Yongming, H.; Peixuan, D.; Junji, C.; Posmentier, E.S. Multivariate analysis of heavy metal contamination in urban dusts of Xi’an, Cent, China. Sci. Total Environ. 2006, 355, 176–186. [Google Scholar] [CrossRef]
  62. Stock, B.C.; Jackson, A.L.; Ward, E.J.; Parnell, A.C.; Phillips, D.L.; Semmens, B.X. Analyzing mixing systems using a new generation of Bayesian tracer mixing models. PeerJ 2018, 6, e5096. [Google Scholar] [CrossRef]
  63. Seo, Y.H. Development of road dust source profile by a detailed chemical composition analysis of road dust. J. Korean Soc. Environ. Admin. 2010, 16, 43–52. [Google Scholar]
  64. Duong, T.; Lee, B.K. Determining contamination level of heavy metals in road dust from busy traffic areas with different characteristics. J. Environ. Manag. 2011, 92, 554–562. [Google Scholar] [CrossRef]
  65. Dietrich, M.; Wolfe, A.; Burke, M.; Krekeler, M.P.S. The first pollution investigation of road sediment in Gary, Indiana: Anthropogenic metals and possible health implications for a socieconomically disadvantaged area. Environ. Int. 2019, 128, 175–192. [Google Scholar] [CrossRef]
  66. Argyraki, A. Garden soil and house dust as exposure media for lead uptake in the mining village of Stratoni, Greece. Environ. Geochem. Health 2014, 36, 677–692. [Google Scholar] [CrossRef] [PubMed]
  67. Yu, S.M.; Kim, H.; Park, Y.M.; Park, K.W.; Park, J.J.; Kim, J.Y.; Seok, K.S.; Kim, Y.H. Characterization of lead pollution near zinc smelter facility in south Korea using lead stable isotopes. J. Kor. Soc. Environ. Anal. 2016, 19, 163–170. [Google Scholar]
  68. Zhang, Z.; Song, X.; Wang, Q.; Lu, X. Cd and Pb contents in soil, plants, and grasshoppers along a pollution gradient in Huludao City, Northeast China. Biol. Trace Elem. Res. 2011, 145, 403–410. [Google Scholar] [CrossRef] [PubMed]
  69. Meza-Figueroa, D.; O-Villanueva, M.; Parra, M.L. Heavy metal distribution in dusft from elementary schools in Hermosillo, Sonora, Mexico. Atmos. Environ. 2007, 41, 276–288. [Google Scholar] [CrossRef]
  70. Yeung, Z.L.L.; Kwok, R.C.W.; Yu, K.N. Determination of multi-element profiles of street dust using energy dispersive X-ray fluorescenece (EDXRF). Appl. Radiat. Isot. 2003, 58, 339–346. [Google Scholar] [CrossRef] [Green Version]
  71. Flett, L.; Krekeler, M.P.S.; Burke, M. Investigation of road sediment in an industrial corridor near low-income housing in Hamilton, Ohio. Environ. Earth Sci. 2016, 75, 1156–1166. [Google Scholar] [CrossRef]
  72. Okorie, A.; Entwistle, J.; Dean, J.R. Estimation of daily intake of potentially toxic elements from urban street dust and the role of oral bioaccessibility testing. Chemosphere 2012, 86, 460–467. [Google Scholar] [CrossRef]
  73. Hameed, A.; Al Mashhady, A. Heavy metal contaminations in Urban soil within Baghdad City, Iraq. J. Environ. Prot. 2013, 4, 73–82. [Google Scholar]
  74. Hong, M.H.; Kang, D.G.; Paik, D.J.; Hwang, H.S.; Park, S.H. Effect of added magnesium on the coating properties of galvanized steel sheets. Korean J. Met. Mater. 2016, 54, 723–731. [Google Scholar] [CrossRef]
  75. Yoon, S.Y.; Kim, U.J.; Kim, M.S.; Kim, M.S.; Park, J.M.; Shin, S.J. The analysis of inorganic compounds and water soluble ions in paper mill sludges from newspaper and printed paper. J. Korean Tappi. 2014, 46, 30–34. [Google Scholar]
  76. Adachi, K.; Yoshiaki, T. Characterization of heavy metal particle embedded in tire dust. Environ. Int. 2004, 30, 1009–1017. [Google Scholar] [CrossRef]
  77. Acharya, C.; Kar, R.N.; Sukla, L.B. Studies on reaction mechanism of bioleaching of manganese ore. Miner. Eng. 2003, 16, 1027–1030. [Google Scholar] [CrossRef]
  78. Hariprasad, D.; Dash, B.; Ghosh, M.K.; Anand, S. Mn recovery from medium grade ore using a waste cellulosic reductant. Indian. J. Chem. Technol. 2009, 16, 322–327. [Google Scholar]
  79. Das, A.; Ghosh, S.; Mohanty, S.; Sukla, L.B. Advances in Manganese Pollution and Its Bioremediation. In Environmental Microbial Biotechnology; Springer: Berlin/Heidelberg, Germany, 2015; pp. 15–16. [Google Scholar]
  80. Seiler, H.G.; Sigel, A.; Sigel, H. Handbook on Metals in Clinical and Analytical Chemistry; Marcell Dekker Inc.: New York, NY, USA, 1994. [Google Scholar]
  81. Raj, S.P.; Ram, P.A. Determination and contamination assessment of Pb, Cd and Hg in roadside dust along Kathmandu-Bhaktapur road section of Arniko Highway, Nepa. Res. J. Chem. Sci. 2013, 3, 18–25. [Google Scholar]
  82. Kushwaha, A.; Sanjay Kumar, N.H.; Rani, R. A critical review on speciation, mobilization and toxicity of lead in soil-microbe-plant system and bioremediation strategies. Ecotoxicol. Environ. Saf. 2018, 147, 1035–1045. [Google Scholar] [CrossRef]
  83. Ullah, H.; Liu, G.; Yousaf, B.; Ubaid, M.; Abbas, Q. Combustion characteristics and retention-emission of selenium during co-firing of torrefied biomass and its blends with high ash coal. Bioresour. Technol. 2017, 245, 73–80. [Google Scholar] [CrossRef]
  84. Yousaf, B.; Liu, G.; Abbas, Q.; Wang, R.; Imtiaz, M.; Zia-ur-Rehman, M. Investigating the uptake and acquisition of potentially toxic elements in plants and health risks associated with the addition of fresh biowaste amendments to industrially contaminated soil. Land. Degrad. Dev. 2017, 28, 2596–2607. [Google Scholar] [CrossRef]
  85. Yuan, C.S.; Cheng, S.W.; Hung, C.H.; Yu, T.Y. Influence of operating parameters on the collection efficiency and size distribution of street dust during street scrubbing. Aerosol Air. Qual. Res. 2003, 3, 75–86. [Google Scholar] [CrossRef] [Green Version]
  86. Patra, A.; Colvile, R.; Arnold, S.; Bowen, E.; Shallcross, D.; Martin, D.; Price, C.; Tate, J.; ApSimon, H.; Robins, A. On street observation of particulate matter movement and dispersion due to traffic on an urban road. Atmos. Environ. 2008, 42, 3911–3926. [Google Scholar] [CrossRef]
  87. Kupiainen, K. Road dust from pavement wear and traction sanding. In Monograph of Boreal Environment Research; Finnish Environment Institute: Helsinki, Finland, 2007; p. 26. [Google Scholar]
  88. Pacyna, J.M. Trace Element Emission from Anthropogenic Sources in Europe; Technical Report. 10/82; Norsk Institutt for Luftforskning: Kjeller, Norway, 1983; Volume 24781, p. 107. [Google Scholar]
  89. Kowalczyk, G.S.; Gordon, G.E.; Rheingrover, S.W. Identification of atmospheric particulate sources in Washington, D.C., using chemical element balances. Environ. Sci. Technol. 1982, 16, 79–90. [Google Scholar] [CrossRef]
  90. Wadge, A.; Hutton, M.; Peterson, P.J. The concentrations and particle size relationships of selected trace elements in fly ashes from U.K. coal-fired power plants and a refuse incinerator. Sci. Total Environ. 1986, 13–27. [Google Scholar] [CrossRef]
  91. Wan, D.; Han, Z.; Yang, J.; Yang, G.; Liu, X. Heavy metal pollution in settled dust associated with different urban functional areas in a heavily air polluted city I North Chin. Int. J. Environ. Res. Public Health 2016, 13, 1119. [Google Scholar] [CrossRef] [Green Version]
  92. Varrica, D.; Bardelli, F.; Dongarra, G.; Tamburo, E. Speciation of Sb in airborne particulate matter, vehiclebbrake linings, and brake pad wear residues. Atmos. Environ. 2013, 64, 18–24. [Google Scholar] [CrossRef]
  93. Victoria, A.; Cobbian, S.J.; Dampare, S.B.; Duwiejuah, A.B. Heavy metals concentration in road dust in the Bolgatanga Municiplaith, Ghana. J. Environ. Pollut. Hum. Health 2014, 2, 74–80. [Google Scholar]
  94. Kanu, M.O.; Meludu, O.C.; Oniku, S.A. Evaluation of heavy metal contents in road dust of Jalingo, Taraba State, Nigeria. Jordan J. Earth Environ. Sci. 2015, 7, 65–70. [Google Scholar]
  95. Kartal, Ş.; Aydın, Z.; Tokalıoğlu, Ş. Fractionation of metals in street sediment samples by using the BCR sequential extraction procedure and multivariate statistical elucidation. J. Hazard. Mater. 2006, 132, 80–89. [Google Scholar] [CrossRef] [PubMed]
  96. Pagotto, C.; Remy, N.; Legret, M.; Le Cloirec, P. Heavy metal pollution of road dust and roadside soil near a major rural highway. Environ. Technol. 2001, 22, 307–319. [Google Scholar] [CrossRef] [PubMed]
  97. Jose, J.; Srimuruganandam, B. Investigation of road dust characteristics and its associated health risks from an urban environment. Environ. Geochem. Health 2020, 42, 2819–2840. [Google Scholar] [CrossRef]
  98. Plum, L.M.; Rink, L.; Haase, H. The essential toxin: Impact of Zinc on human health. Int. J. Environ. Res. Public Health 2010, 7, 1342–1365. [Google Scholar] [CrossRef] [Green Version]
  99. O’Neal, S.L.; Zheng, W. Manganese toxicity upon overexposure: A decade in review. Curr. Environ. Health Rep. 2015, 2, 315–328. [Google Scholar] [CrossRef] [Green Version]
  100. Huff, J.; Lunn, R.M.; Waalkers, M.P.; Tomatis, L.; Infante, P.F. Cadmium-induced cancers in animals and in humans. Int. J. Occup. Environ. Health 2007, 13, 202–212. [Google Scholar] [CrossRef] [Green Version]
  101. Yousaf, B.; Amina, L.G.; Wang, R.; Imtiaz, M.; Rizwan, M.S.; Zia-ur-Rehman, M.; Qadir, A.; Si, Y. The importance of evaluating metal exposure and predicting human health risks in urban-periurban environments influenced by emerging industry. Chemosphere 2016, 150, 79–89. [Google Scholar] [CrossRef]
  102. Yousaf, B.; Liu, G.; Wang, R.; Imtiaz, M.; Zia-ur-Rehman, M.; Munir, M.A.M.; Niu, Z. Bioavailability evaluation, uptake of heavy metals and potential health risks via dietary exposure in urban-industrial areas. Environ. Sci. Pollut. Res. 2016, 23, 22443–22453. [Google Scholar] [CrossRef]
  103. O’Leary, M.H. Carbon isotopes in photosynthesis. BioScience 1988, 38, 328–336. [Google Scholar] [CrossRef]
  104. López-Veneroni, D. The stable carbon isotope composition of PM2.5 and PM10 in Mexico City Metropolitan Area air. Atmos. Environ. 2009, 43, 4491–4502. [Google Scholar] [CrossRef]
  105. Kawashima, H.; Haneishi, Y. Effects of combustion emissions from the Eurasian continent in winter on seasonal δ13C of elemental carbon in aerosols in Japan. Atmos. Environ. 2012, 46, 568–579. [Google Scholar] [CrossRef]
  106. Widory, D. Combustibles, fuels and their combustion products: A view through carbon isotopes. Combust. Theory Model. 2006, 10, 831–841. [Google Scholar] [CrossRef]
  107. Martinelli, L.A.; Camargo, P.B.; Lara, L.B.L.S.; Victoria, R.L.; Artaxo, P. Stable carbon and nitrogen isotopic composition of bulk aerosol particles in a C4 plant landscape of southeast Brazil. Atmos. Environ. 2002, 36, 2427–2432. [Google Scholar] [CrossRef]
  108. Moura, J.M.S.; Martens, C.S.; Moreira, M.Z.; Lima, R.L.; Sampaio, I.C.G.; Mendlovitz, H.P.; Menton, M.C. Spatial and seasonal variations in the stable carbon isotopic composition of methane in stream sediments of eastern Amazonia. Tellus 2008, 60B, 21–31. [Google Scholar] [CrossRef]
  109. Cao, J.J.; Chow, J.C.; Tao, J.; Lee, S.C.; Watson, J.G.; Ho, K.F.; Wang, G.H.; Zhu, C.S.; Han, Y.M. Stable carbon isotopes in aerosols from Chinese cities: Influence of fossil fuels. Atmos. Environ. 2011, 45, 1359–1363. [Google Scholar] [CrossRef]
  110. Tanner, R.L.; Miguel, A.H. Carbonaceous aerosol sources in Rio de Janeiro. Aerosol Sci. Technol. 1989, 10, 213–223. [Google Scholar] [CrossRef] [Green Version]
  111. Grassi, C.; Campigli, V.; Dallai, L.; Nottoli, S.; Tognotti, L.; Guidi, M. PM characterization by carbon isotope. In Proceedings of the European Aerosol Conference, Salzburg, Austria, 9–14 September 2007. [Google Scholar]
  112. Widory, D.; Roy, S.; Le Moullec, G.; Cocherie, A.; Guerrot, C. The origin of atmospheric particles in Paris: A view through carbon and lead isotopes. Atmos. Environ. 2004, 38, 953–961. [Google Scholar] [CrossRef]
  113. Gupta, A.K.; Gupta, S.K.; Patil, R.S. Environmental management plan for port and harbour projects. Clean. Technol. Environ. Policy 2005, 7, 133–141. [Google Scholar] [CrossRef]
  114. Moreira González, A.; Abilio Comas, A.; Valle Pombrol, A.; Seisdedo, M. Bloom of Vulcanodinium rugosum linked to skin lesions in Cienfuegos Bay, Cuba. Harmful Algae News 2016, 55, 10–11. [Google Scholar]
Figure 1. Map showing the location of the sampling sites in Donghae port, Korea.
Atmosphere 12 00840 g001
Figure 2. Spatial distribution of (A) Mn, (B) Zn, (C) Cd, and (D) Pb in topsoil and urban dust in Donghae port.
Atmosphere 12 00840 g002
Figure 3. Comparison of δ13C values between this study and literature reports, including coal-combustion [106], biomass burning from C3 and C4 plants [107,108] and various urban region: Kumasi, Ghana [46]; Mexico city, Mexico [104]; Akita, Japan [105]; several major cities in China [109]; Rio de Janeiro, Brazil [110]; Tuscany, Italy [111]; and Paris, France [112]).
Atmosphere 12 00840 g003
Figure 4. Relationship between 208Pb/206Pb and 207Pb/206Pb of soil and urban dust in Donghae port.
Atmosphere 12 00840 g004
Figure 5. Average contribution of the different sources determined by Iso-source R to the soil and urban dust sample.
Atmosphere 12 00840 g005
Figure 6. Scatter plot δ13C vs. 207Pb/206Pb of soil and urban dust in Donghae port.
Atmosphere 12 00840 g006
Table 2. The concentration of metal ion of PM10 samples in the study area.
LocationType Metal Ion (ng/m3)
CrMnCoNiCuZnAsCdPbSrBa
Donghae, KoreaPM10
(Urban area, n = 15)
Minimum48.3136.31.99.711.797.611.90.815.143.5386.5
Maximum54.3781.42.412.9902.5360.014.32.038.057.0539.1
Mean50.6452.62.111.1222.7161.613.31.021.350.7456.3
Median2.7253.10.21.2381.8111.51.00.59.54.957.5
SD49.4379.22.211.251.9120.613.50.816.951.0461.8
PM10
(Control area, n = 3)
Minimum20.053.81.47.96.675.69.80.611.70.6284.8
Maximum58.872.32.711.513.3167.621.50.720.70.7502.4
Mean43.864.31.99.49.8112.713.90.715.70.7358.3
Median20.99.50.81.83.348.56.60.14.60.1124.9
SD52.766.81.48.89.495.010.40.714.80.7287.6
Publisher’s Note: MDPI stays neutral with regard to jurisdictional claims in published maps and institutional affiliations.

