Article

Spatial Variability of Glaciochemistry along a Transect from Zhongshan Station to LGB69, Antarctica

1
Key Laboratory of Polar Science, MNR, Polar Research Institute of China, Shanghai 200136, China
2
School of Energy and Power Engineering, Wuhan University of Technology, Wuhan 430063, China
3
British Antarctic Survey, High Cross, Madingley Road, Cambridge CB3 0ET, UK
4
State Key Laboratory of Land Surface Processes and Resource Ecology, Beijing Normal University, Beijing 100875, China
*
Author to whom correspondence should be addressed.
Atmosphere 2021, 12(3), 393; https://doi.org/10.3390/atmos12030393
Submission received: 20 January 2021 / Revised: 1 March 2021 / Accepted: 12 March 2021 / Published: 17 March 2021
(This article belongs to the Special Issue Interactions between the Cryosphere and Climate (Change))

Abstract

:
The spatial glaciochemical variability of snow samples collected along a transect from Zhongshan Station to Lambert Glacier Basin 69 (LGB69) in Antarctica was investigated. Sea-salt ion concentrations exponentially decreased with increasing distance from the coast and/or altitude. The observed high sea-salt ion concentrations within 20.6 km of the coast may be related to preferential wet or dry deposition of sea-salt aerosols. Methanesulfonic acid (MSA), non-sea-salt sulfate (nssSO42−), and calcium (Ca2+) concentrations decreased along the transect. The mean MSA/nssSO42− value of the surface snow samples (0.34 ± 0.08) indicates that coastal sea areas are their likely source regions. The non-sea-salt Ca2+ (nssCa2+)/Ca2+ percentages of the surface snow and LGB69 snow pit samples reveal that continental dust is the primary Ca2+ source. The δD and δ18O values decreased from the coast inland. The variation of deuterium excess (d-excess) along the transect was stable and d-excess values in the two snow pit samples were low and similar, which indicates that the moisture source region between Zhongshan Station and LGB69 is a coastal sea area. These results reveal the spatial distribution patterns and sources of ions and stable isotopes, as well as factors that influence the deposition of ions and the composition of stable isotopes, which provide important insight for further studies of ice cores drilled in Antarctic coastal regions.

1. Introduction

The ionic and isotopic compositions of Antarctic snow can serve as important indicators of environmental and climatic information [1]. These indicators include sea-salt ions, sulfur components, and stable isotopes. Sea-salt ions (mainly Cl, Na+, and Mg2+) come from sea ice and/or sea water [2,3], which are strongly influenced by sea-ice extent and meteorological conditions [4,5]. Marine sulfur components (non-sea-salt sulfate (nssSO42−) and methanesulfonic acid (MSA)) can be attributed to marine biogenic activity via dimethyl sulfide (DMS) oxidation [6]. DMS is the only source of MSA, and thus MSA is the best alternative indicator for DMS [7,8,9]. In contrast, nssSO42− has various sources, such as volcanic eruptions, anthropogenic emissions, and crustal erosion [10]. The nssSO42− from volcanic eruptions can be used to date ice cores [10,11] based on the eruption history [12,13,14]. Stable isotopes (δD and δ18O) reflect climate variations over time and space and are commonly used to quantify changes of air temperature in past environments. Deuterium excess (d-excess) is a second-order parameter used to identify moisture source regions [15,16,17].
High-resolution climate records are often obtained from ice cores drilled at sites with high annual accumulation rates. These data are used to interpret temporal variations of chemical ions and isotopes on different scales and can reveal important information regarding past oceanic and atmospheric environment changes [18,19,20]. To comprehensively interpret the temporal variations of chemical ions and isotopes from ice cores drilled at a given site, it is necessary to understand the spatial distribution patterns, sources, and factors that influence the deposition of chemical components in the snow in the same region [21].
The Chinese National Antarctic Research Expedition (CHINARE) involved travel inland along a transect from Zhongshan Station to Dome A [11,22,23,24,25,26,27,28] (Figure 1). The spatial variability of ions in snow samples from Zhongshan station to Dome A has been systematically studied. These results suggested that sea-salt ion concentrations decreased with increasing distance from the coast and altitude, and that the spatial variations are related to different sources, transport, and depositional processes. Similar trends of sea-salt ions were also observed in other transects from the Antarctic coast inland [21,29,30,31]. Cl/Na+ ratios increased with increasing distance from the coast and altitude owing to other Cl sources and post-depositional effects in the interior region of the transect. The MSA/nssSO42− ratio in coastal areas was higher than that in inland areas because of different source regions and transport pathways [27,28].
Previous investigations of stable isotopes from surface snow samples along the transect from Zhongshan Station to Dome A showed that δD and δ18O values negatively correlated with distance from the coast and altitude and that the δD/δ18O ratio was lower than that of the Global Meteoric Water Line (GMWL) and the mean value for Antarctica (7.75) [24,26]. This implies that more intense kinetic fractionation processes occur during snow formation in the interior region of the transect [26,27]. Previous studies indicated a significant increase of Antarctic d-excess values at altitudes near or above 2000 m owing to different moisture origins [15,32]. The d-excess values along the transect from Zhongshan Station to Dome A exhibited a positive trend in the inland direction, with a step change as a function of either distance to the coast or latitude characterized by higher values for elevations above ~2750 m. It has been speculated that a specific transport path brings moisture toward Dome A either from warm, distant moisture sources, or from sea-ice edge areas [17,26,27].
Ding et al. [33] showed that the coastal region (68–202 km) of the transect from Zhongshan Station to Dome A is characterized by a relatively high average annual accumulation rate (157 kg m−2 a−1), which indicates the ice cores drilled in the coastal region of the transect can provide high-resolution chemical ion and isotope records [34]. Moreover, the transect from Zhongshan Station to Dome A covers a distance of 1256 km and a wide range of environments. Different regions of the transect have diverse environments (e.g., the coast region has high accumulation rate, whereas very low accumulation rate is observed in the inland region [33]), which cause various distribution characteristics of chemical components [27]. Thus, it is necessary to collect more data and study each region individually. At present, some investigations have been carried out to reveal the spatial patterns of ions and stable isotopes along the entire transect from Zhongshan Station to Dome A [24,26,27]. However, due to limited snow chemistry data of coastal region in the past, there have only been a few systematic studies on the spatial distribution, sources, and factors that influence the deposition of the chemical components in the coastal region of the transect from Zhongshan Station to Dome A [24,26,27].
In this study, the spatial variability of the ionic and isotopic compositions of samples from surface snow and two snow pits obtained along a transect from Zhongshan Station to LGB69 was analyzed. In particular, surface snow and snow pit samples were collected in the steep coastal escarpment region within 20.6 km distance from Zhongshan Station, which were less documented in previous research [24,26,27]. The results provide a detailed illustration of the spatial distribution patterns and sources of the ions and stable isotopes, as well as factors that influence the deposition of ions and the composition of stable isotopes. This study not only fills in a gap of snow chemistry investigation within 20.6 km distance from the coast along the transect from Zhongshan Station to Dome A, but also contributes to the interpretation of long-term chemical records obtained from ice cores drilled in the coastal regions of Princess Elizabeth Land.

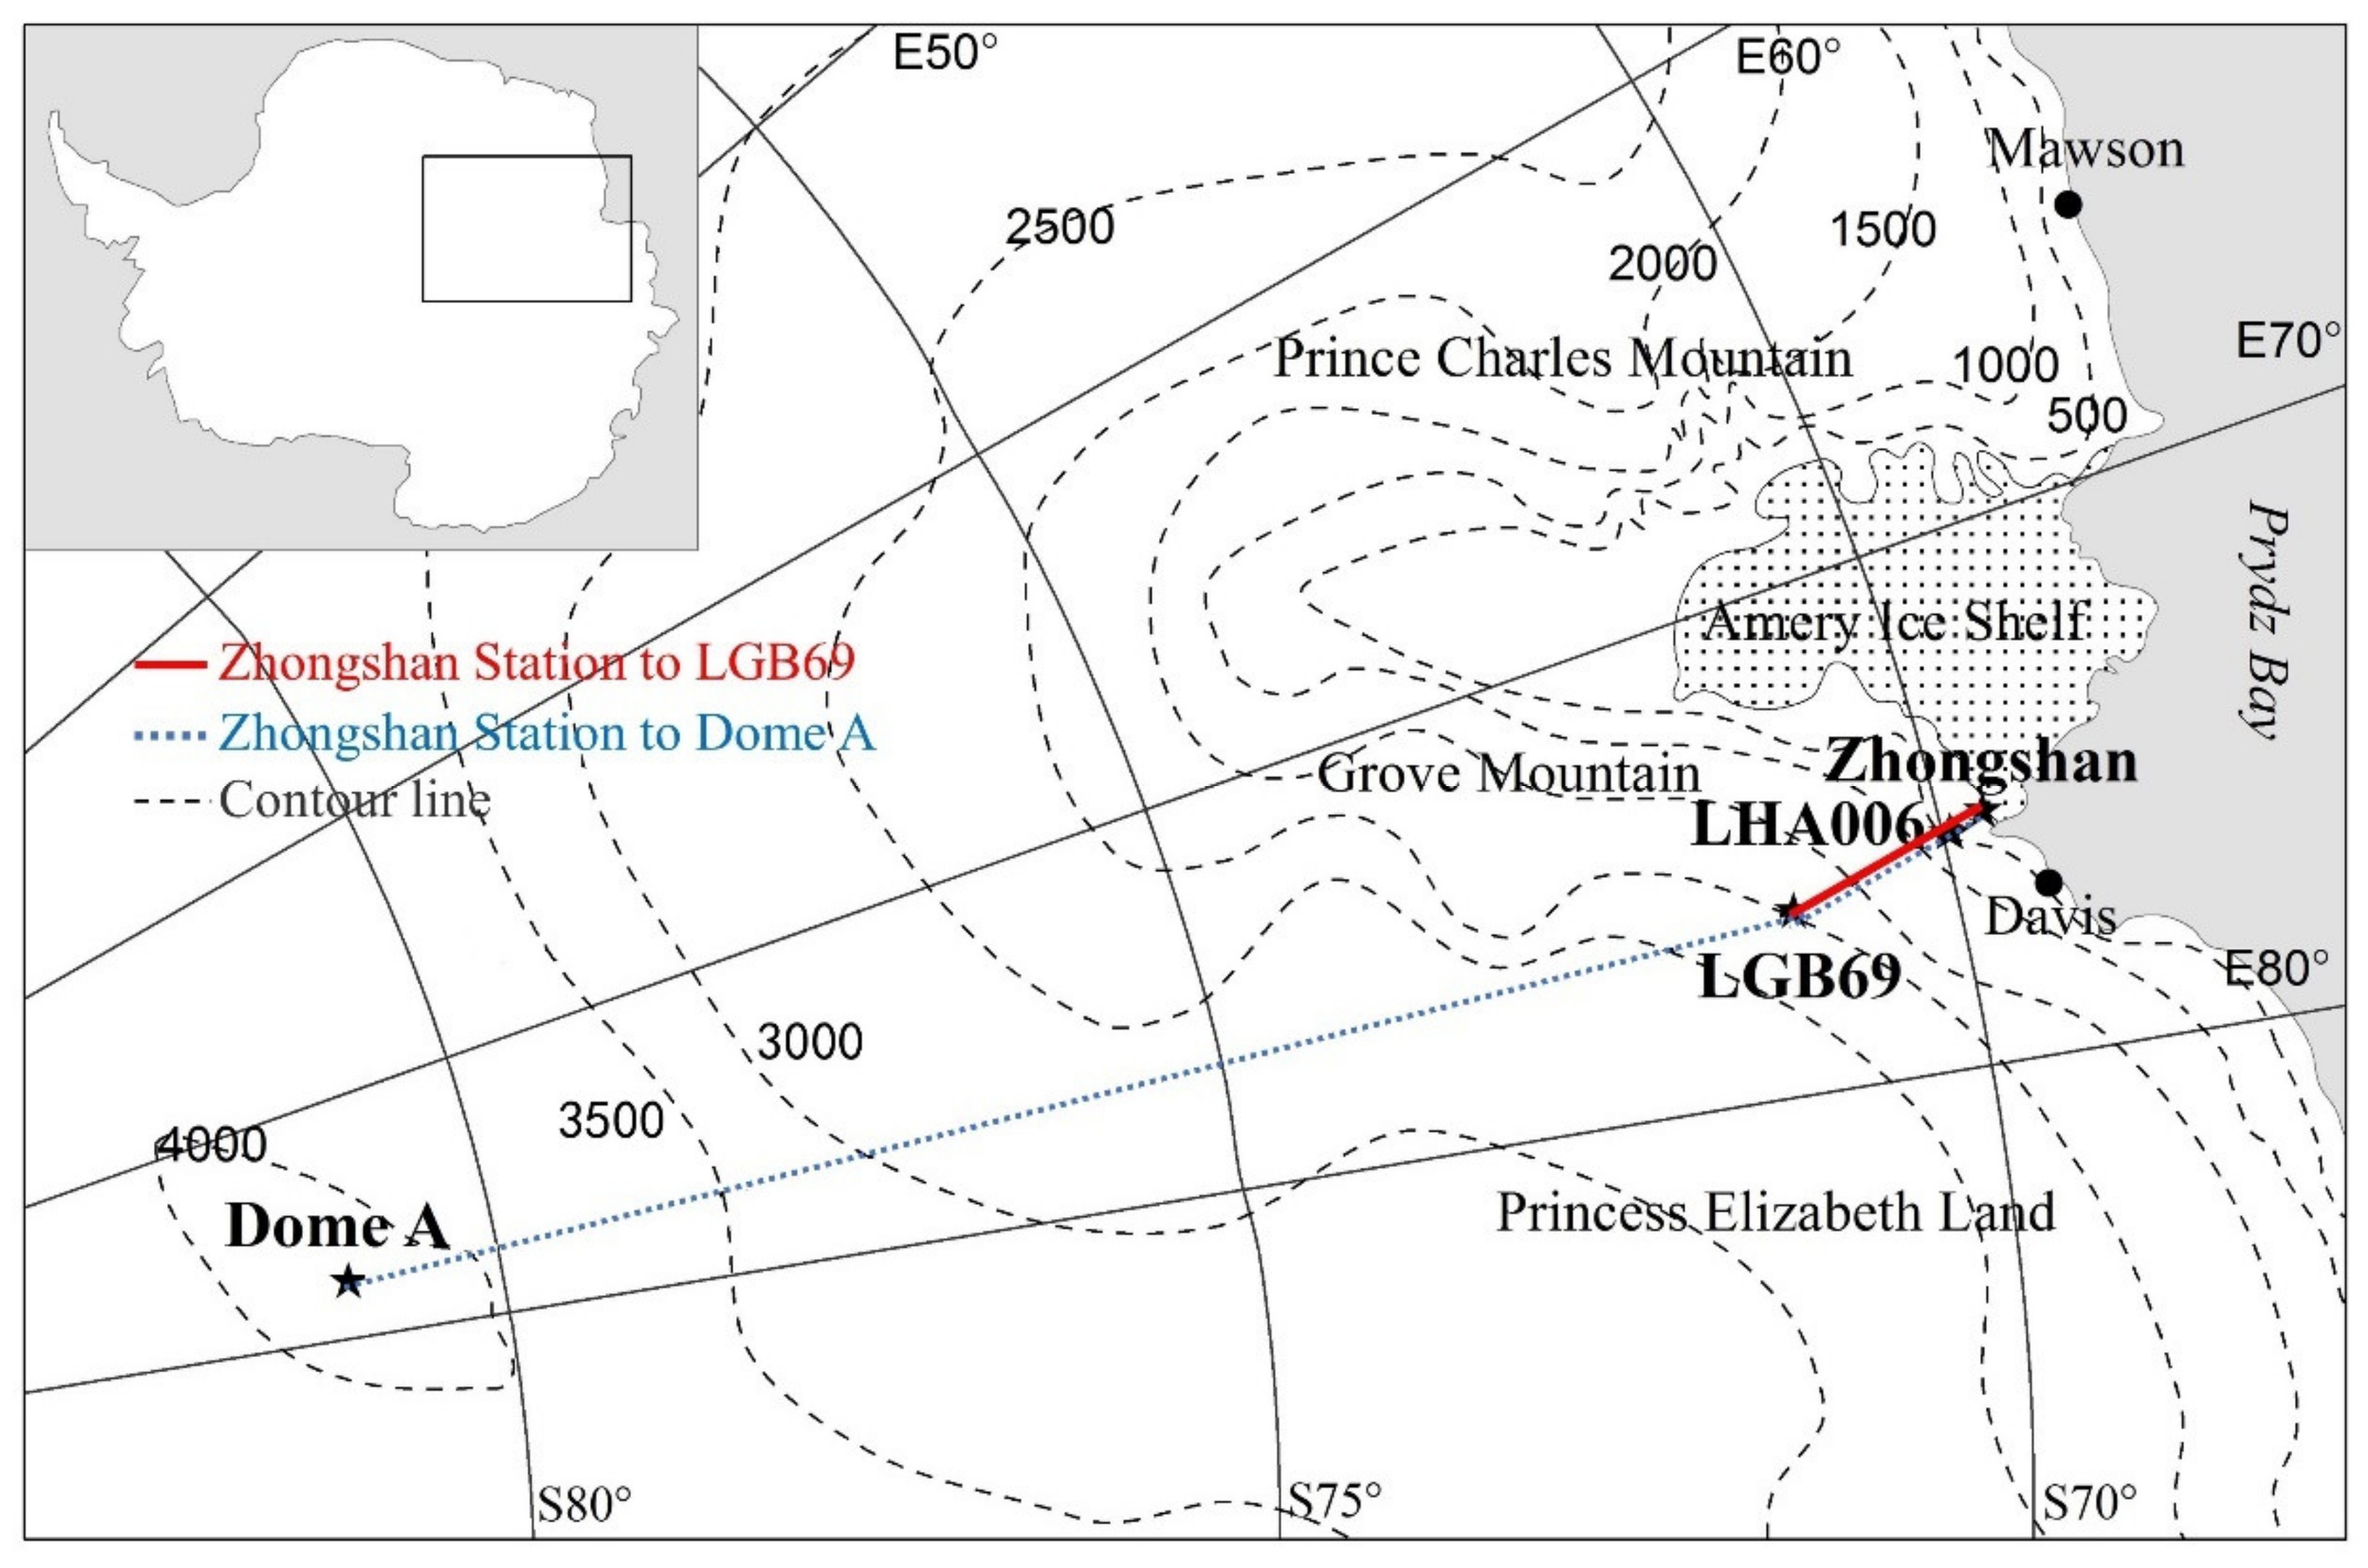
2. Sampling and Laboratory Analysis

2.1. Sample Collection

Seventeen surface snow samples and two snow pit samples were collected along the transect from Zhongshan Station to LGB69 during the austral summer of the 18th CHINARE (2001–2002) (Figure 1). The end site LGB69 is located at 70°50′06″ S and 77°04′29″ E in Princess Elizabeth Land of East Antarctica, approximately 172 km (route distance) from Zhongshan Station, at an altitude of 1860 m. The annual accumulation rate at LGB69 is as high as 255 kg m−2 a−1 based on snow pit dating and water equivalent depth. The transect from Zhongshan Station to LGB69 shows a clear difference in altitude changes between the coast and the inland region. Within 20.6 km (distance from the coast, unless otherwise mentioned), the altitude increases rapidly from 0 to 586 m, indicating a steep coastal escarpment region. Beyond 20.6 km, the altitude rises gradually from 586 to 1852 m (Table 1). The slope was calculated as the altitude change/distance change between the two sites. Figure 2 shows the slope variation from the coast inland, as listed in Table 1. The steep coastal escarpment region within 20.6 km has an average slope of 28.4 m km−1, whereas the interior region between 20.6 and 170 km has an average slope of 8.4 m km−1.
Surface snow samples were collected at approximately 10-km intervals along the transect from Zhongshan Station to LGB69. One surface snow sample was collected at each site. In total, 17 surface snow samples were obtained to analyze the spatial variability of their ionic and isotopic compositions. Table 1 provides the geographical information of the surface snow samples.
Two sites were selected for the snow pit sampling: LHA006 near the coast and LGB69 located inland. The snow pit samples were collected at 2-cm intervals to determine their ionic and isotopic compositions. Samples from two snow pits were also collected to assess the spatial variability of their ionic and isotopic compositions. Table 2 lists the geographical and sampling information of the two snow pits.

2.2. Sample Analysis

The chemical samples were measured in the 100-class clean laboratory of the British Antarctic Survey. Anions and cations were analyzed simultaneously and a selection of chemical concentrations (F, Cl, NO3, SO42−, MSA, Na+, K+, Ca2+, and Mg2+) was obtained using two Dionex ion chromatographs (DX 500, Autosampler, Chromeleon 6.6 chromatograph data system). Strict anti-contamination measures were adopted during the entire process of sample cutting, melting, and analysis. 18.2 MΩ·cm ELGA UHP water was used to clean the sample processing equipment and containers and to prepare blank samples and working standards. Analytical columns (AS18 and CS12A) and guard columns (AG18 and CG12A) were respectively used in the anion and cation measurements using an injection volume of 200 μL. The eluent conditions were chosen to result in similar run length of 12 min for both cations and anions, to allow simultaneous injection from the same autosampler vial. For the anions, isocratic elution used a 20 mM potassium hydroxide eluent at a flow rate of 1.0 mL per minute, while the cations were eluted isochratically with 20 mM methane sulphonic acid eluent at a flow rate of 1.0 mL per minute. Five multi-ion standards were prepared to bracket the range of concentrations measured in the traverse samples. The blank samples were regularly monitored during the analysis and the main chemical components of all blank samples were lower than the detection limit.
The stable isotope samples were measured on the liquid water isotope analyzer (DLT-100, Los Gatos Research, Inc., Mountain View, CA, USA) at the British Antarctic Survey. Hydrogen and oxygen isotopes were simultaneously analyzed. The DLT-100 was calibrated using working standards that bracketed the transect samples which had been prepared and calibrated against primary V-SMOW (Vienna Standard Mean Ocean Water) and V-SLAP (Vienna Standard Antarctic Precipitation) standards by the NERC Isotope Geosciences Laboratory (Keyworth, UK) using an Isoprime Isotope Ratio Mass Spectrometer. The accuracy of the δD or δ18O analysis (±0.8‰ and ±0.1‰, respectively) is comparable to that of traditional stable isotope mass spectrometry [35]. Some comparison samples were measured on the Isoprime mass spectrometers and the results are in good agreement with those obtained using the DLT-100.

3. Results and Discussion

3.1. Spatial Variability of Ionic Compositions

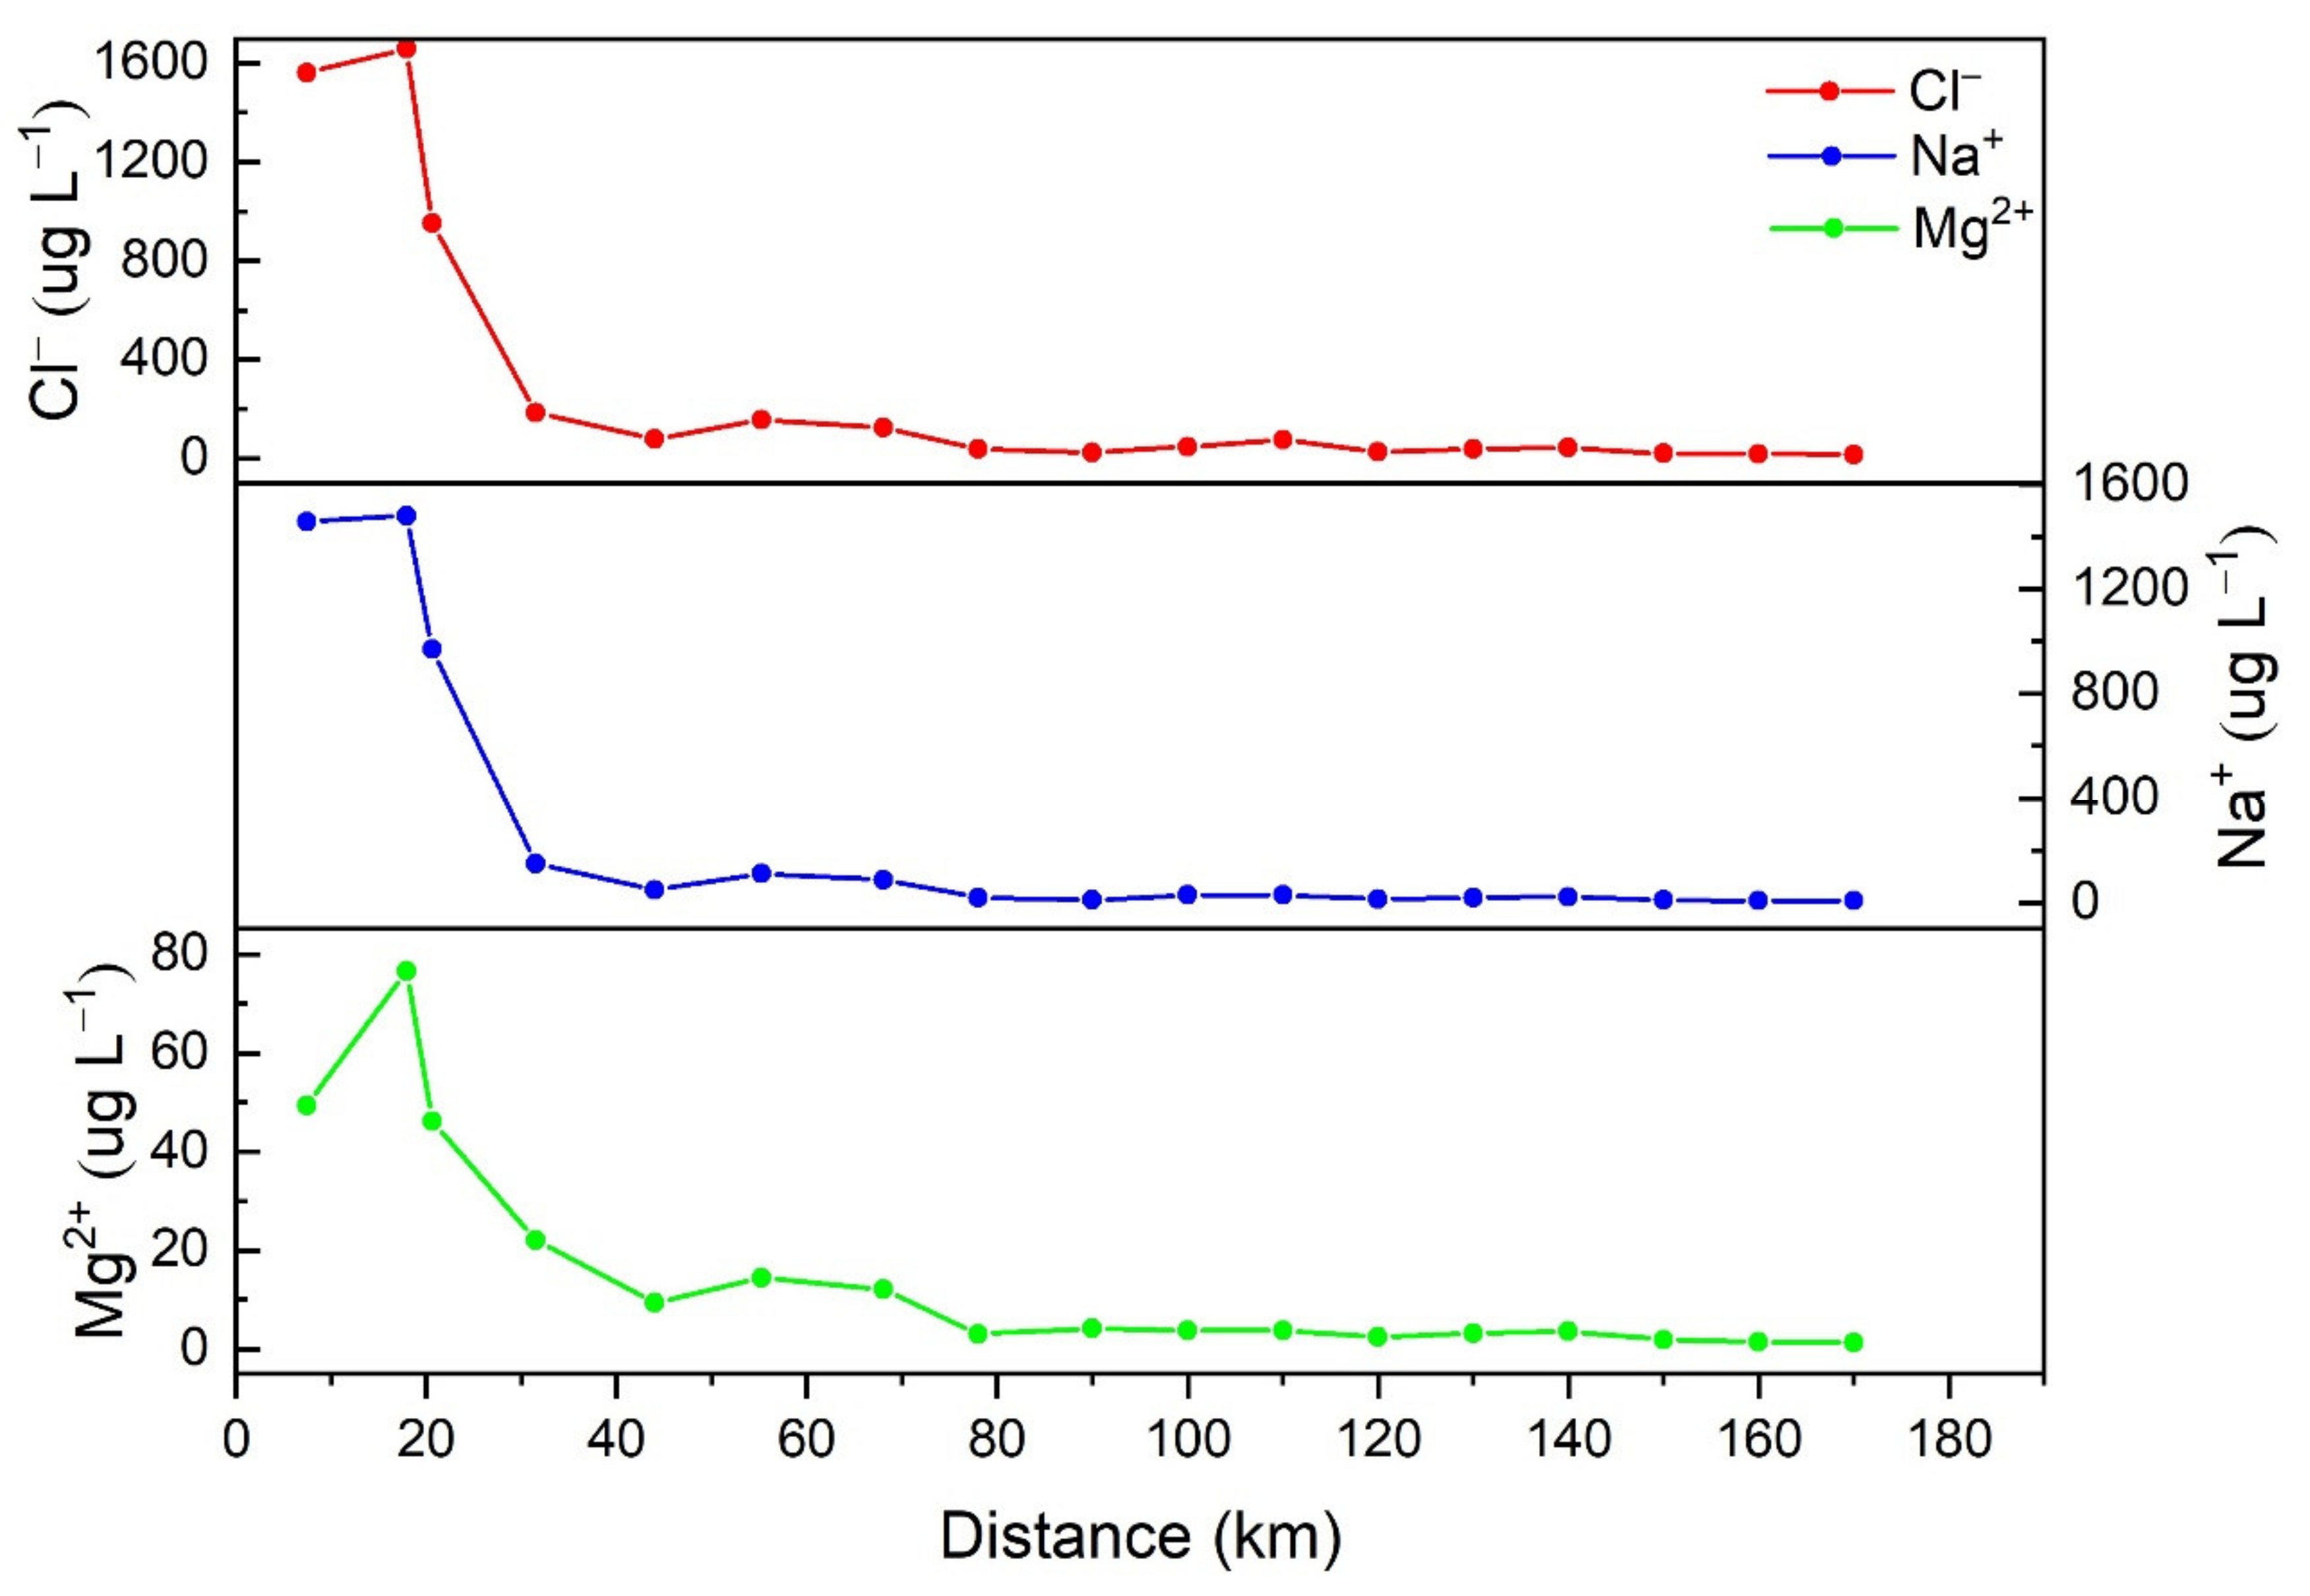
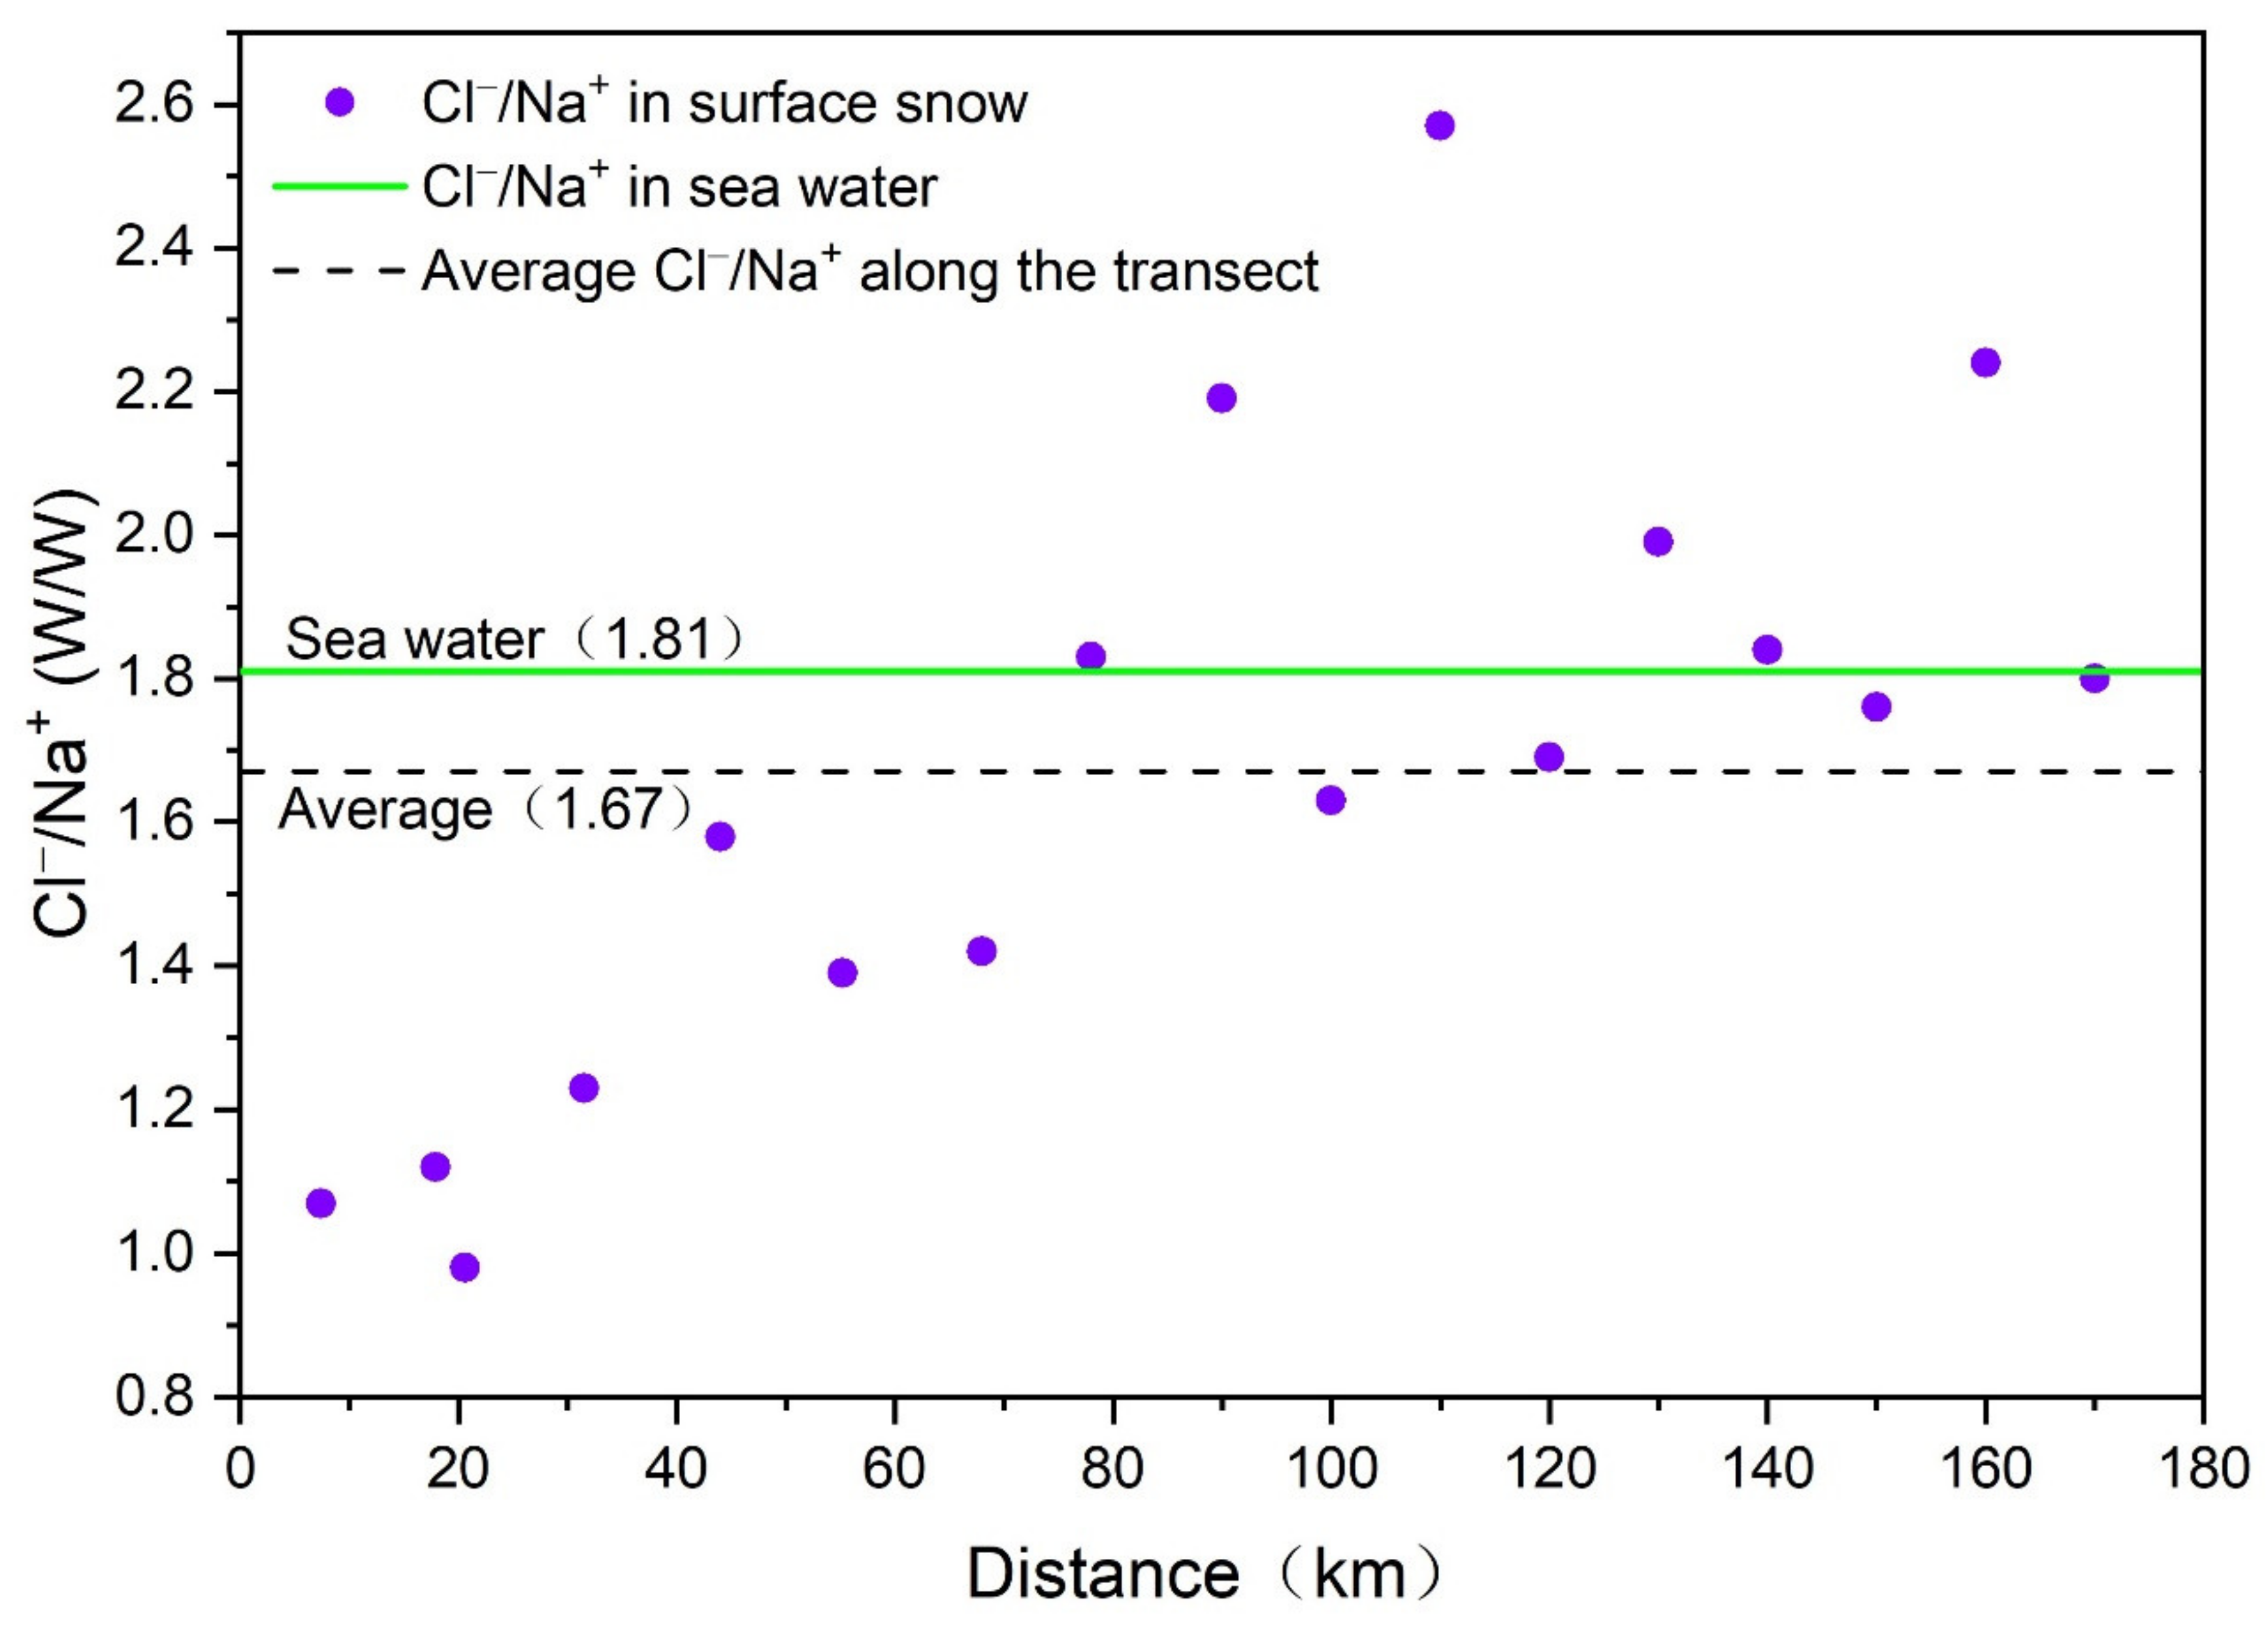
3.1.1. Sea-Salt Ions

The concentrations of Cl, Na+, and Mg2+ were high in the surface snow samples, ranging from 952.48 to 1659.08, 970.78 to 1480.13, and 46.22 to 76.56 µg L−1, respectively, between 7.4 and 20.6 km (285–586 m altitude). However, these concentrations exponentially decreased with increasing distance from the coast and altitude. The relatively low concentrations of Cl, Na+, and Mg2+ (ranged from 14.67 to 184.64, 7.93 to 150.00, and 1.37 to 22.05 µg L−1, respectively) were observed between 31.5 and 170 km (737–1852 m altitude) (Figure 3). The detailed Cl, Na+, and Mg2+ concentrations of the surface snow samples along the transect from Zhongshan Station to LGB69 are shown in Table 3. Moreover, because of significant correlation between distance from coast and altitude (R = 0.991, p <0.01), the variation trends of ions and stable isotopes with altitude are similar to those with distance from coast and not shown in the figures.
High Cl, Na+, and Mg2+ concentrations occurred specifically in the steep coastal escarpment region within 20.6 km (Figure 3). This may be related to the preferential wet or dry deposition of sea-salt aerosols. Sea-salt aerosols can be scavenged from the atmosphere by wet or dry deposition depending on the meteorological conditions. Most sea-salt aerosols can be deposited by snow precipitation in regions with high annual accumulation rates. High relative humidity conditions (60–70%) are conducive to the wet deposition of sea-salt aerosols [36]. In the present study, high accumulation rates and high relative humidity conditions (>60%) exist in the steep coastal escarpment region [33,37], leading to the preferential wet deposition of sea-salt aerosols. Alternatively, when local meteorological conditions are inadequate for wet deposition, the steep faces of the coastal escarpment can intercept the maritime air mass with abundant sea-salt aerosols. Katabatic winds are highly unidirectional and persistent and prevail in the steep coastal escarpment regions of Antarctica [37,38,39]. The intercepted maritime air masses interact strongly with the katabatic winds over the steep coastal escarpments, which leads to turbulence, thereby inducing the dry deposition of sea-salt aerosols [36]. Consequently, high Cl, Na+, and Mg2+ concentrations were found specifically in the steep coastal escarpment region within 20.6 km, which may be because of the preferential wet or dry deposition of sea-salt aerosols.
Cl, Na+, and Mg2+ were also typically strongly positively correlated with one another (Table 4), which indicates they are from the same source. The sea-salt ions exhibited significant negative correlations with distance from the coast or altitude (Table 4), suggesting that the spatial distributions of sea-salt ions from Zhongshan Station to LGB69 are mainly affected by distance from the coast and/or altitude.
Cl/Na+ ratios in the surface snow samples have been used to determine the effects of sources or post-depositional processes on the deposition of sea-salt components [5,40]. In the present study, Cl/Na+ ratios were calculated from all of the surface snow samples, yielding an average ratio of 1.67 ± 0.44 from Zhongshan Station to LGB69, which was close to the ratio of sea water (1.81, W/W [41]). This suggests that sea salt is the main source of Cl and Na+ along the transect. Figure 4 shows the variation of Cl/Na+ ratios from the coast inland. However, a few low Cl/Na+ ratios occurred in the steep coastal escarpment region within 20.6 km. The lowest Cl/Na+ ratio (0.98) was recorded at site L156 at 20.6 km (586 m altitude), followed by 1.07 from site LH9601 at 7.4 km (285 m altitude), and the average of Cl/Na+ ratios was 1.06 ± 0.07 between 7.4 and 20.6 km. Beyond 20.6 km, the Cl/Na+ ratios ranged from 1.23 to 2.57 with an average of 1.80 ± 0.36, which was almost equal to that of the sea water ratio (Table 5). Previous studies at coastal Antarctic sites suggested that at relatively low accumulation rates (<40 kg m−2 a−1), the post-depositional loss of HCl becomes significant and reduces the Cl concentrations in snow, resulting in a reduced Cl/Na+ ratio [5,42]. However, the present study region is characterized by a relatively high average snow accumulation rate (157 kg m−2 a−1) [33]. For example, the Cl/Na+ ratio of LHA006 at 17.9 km was only 1.12 (Table 5), whereas its annual accumulation rate reached as high as 200 kg m−2 a−1 (Table 2). The post-depositional loss of HCl can therefore not account for the low Cl/Na+ ratios at these sites. Alternatively, Cl depletion may also be related to the reaction of sea-salt aerosols (mainly NaCl) with atmospheric acids (mainly HNO3 and H2SO4). This reaction leads to the formation of gas-phase HCl, which lowers the initial Cl/Na+ ratios of sea-salt aerosols [5,42]. However, there was no low Cl/Na+ ratio occurred beyond 20.6 km. Thus, the reaction between sea-salt aerosols and atmospheric acids cannot be used to explain the low Cl/Na+ ratios that only occurred in the steep coastal escarpment region within 20.6 km.
In the present surface snow samples, the observed low Cl/Na+ ratios within 20.6 km may be related to the steep slopes of the coastal escarpment. The variations of surface slope of the Antarctic ice sheet have a strong impact on the wind speed and direction [43]. The steep slopes of the coastal escarpment can lead to wind redistribution, inducing snow redistribution. In the process of snow redistribution by wind scouring, the Na+ concentrations can be increased by the continuous input of sea-salt aerosols. However, unlike Na+, Cl is depleted owing to the reaction between sea-salt aerosols and atmospheric acids during wind redistribution. The steep slopes of the coastal escarpment thus result in wind redistribution-induced snow redistribution, leading to an increase of Na+ concentrations, thereby lowering the Cl/Na+ ratios [36]. Consequently, the low Cl/Na+ ratios within 20.6 km can be attributed to the steep slopes of the coastal escarpment.
The spatial distributions of sea-salt ions in the two snow pits were also analyzed. The concentrations of Cl, Na+, and Mg2+ of the LHA006 snow pit ranged from 262.10 to 2660.70, 182.40 to 2205.96, and 27.66 to 223.38 µg L−1, respectively, whereas those of the LGB69 snow pit ranged from 5.90 to 268.10, 2.02 to 195.51, and 0.53 to 28.75 µg L−1, respectively (Table 6). Given that LHA006 is located in the steep coastal escarpment region, the mean concentrations of these three sea-salt ions were considerably higher at LHA006 than at LGB69, which can be attributed to the preferential wet or dry deposition of sea-salt aerosols.
The snow pit results showed a clear difference in the mean Cl/Na+ ratios between LHA006 (1.18) and LGB69 (1.79). As with the Cl/Na+ ratio in the surface snow sample at LHA006, the mean Cl/Na+ ratio of the LHA006 snow pit samples was also low and lower than that of the LGB69 snow pit samples. Thus, the low mean Cl/Na+ ratio of the LHA006 snow pit samples may also be related to the increased Na+ concentrations driven by the steep slopes of the coastal escarpment.

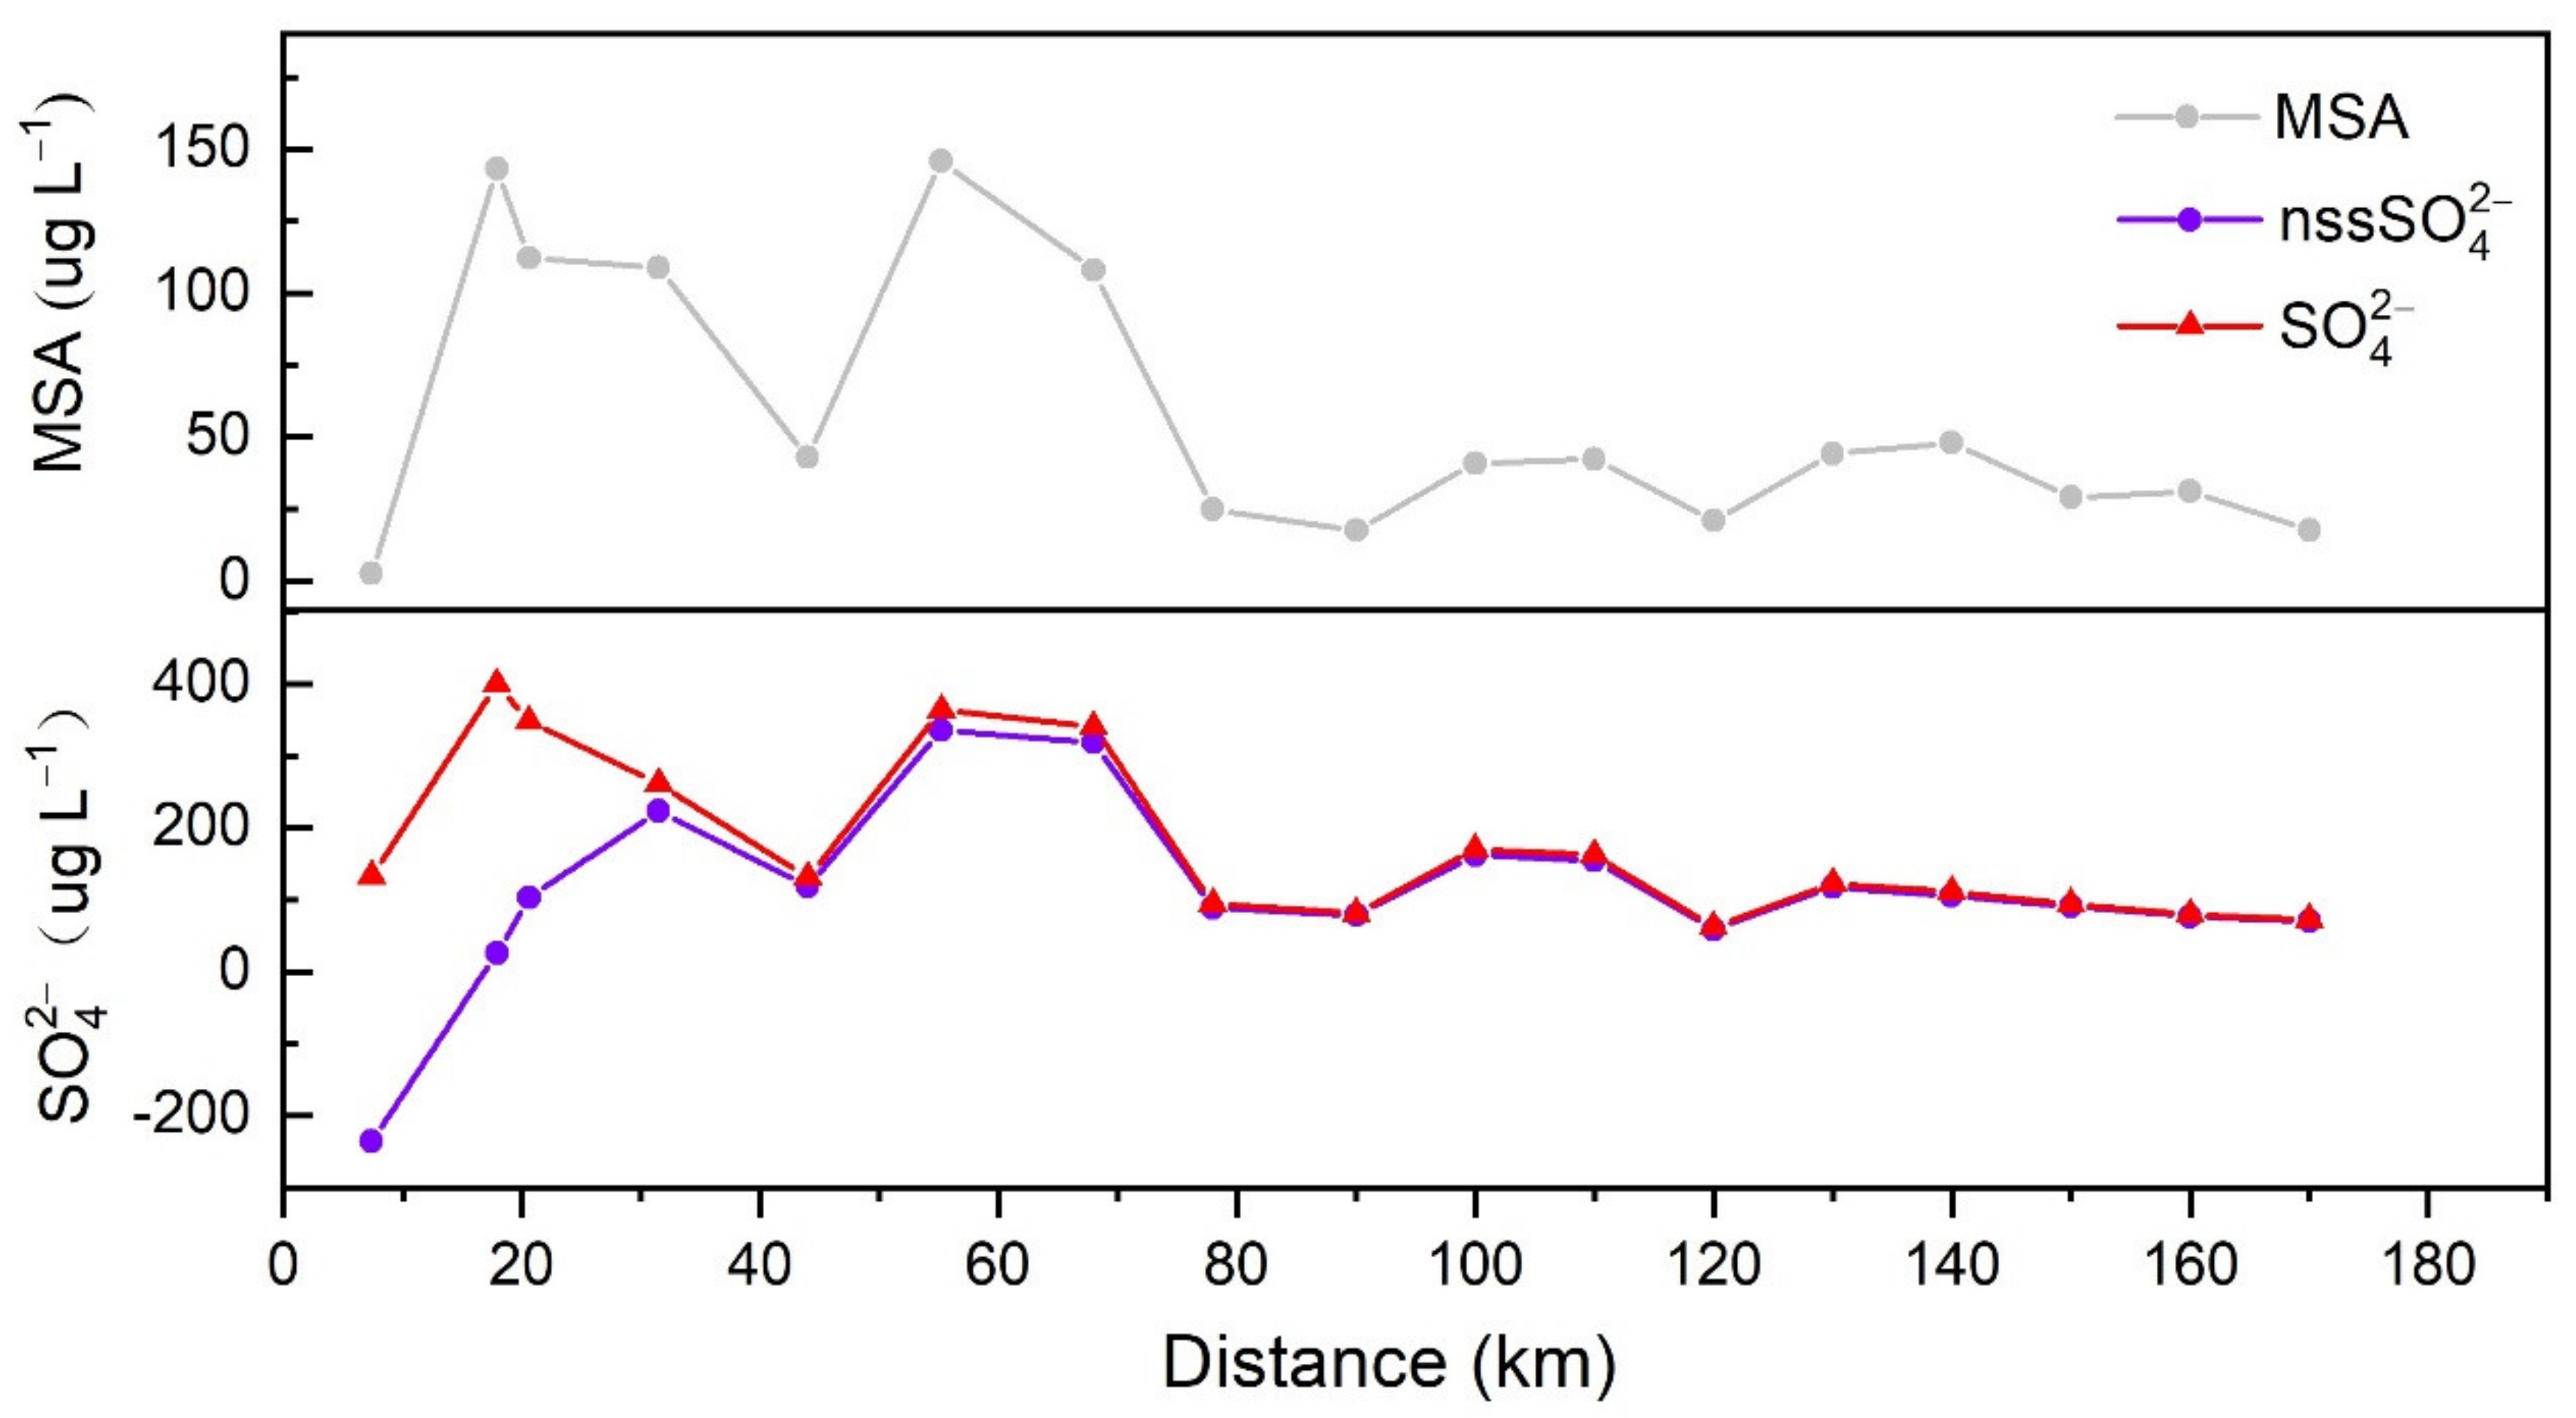
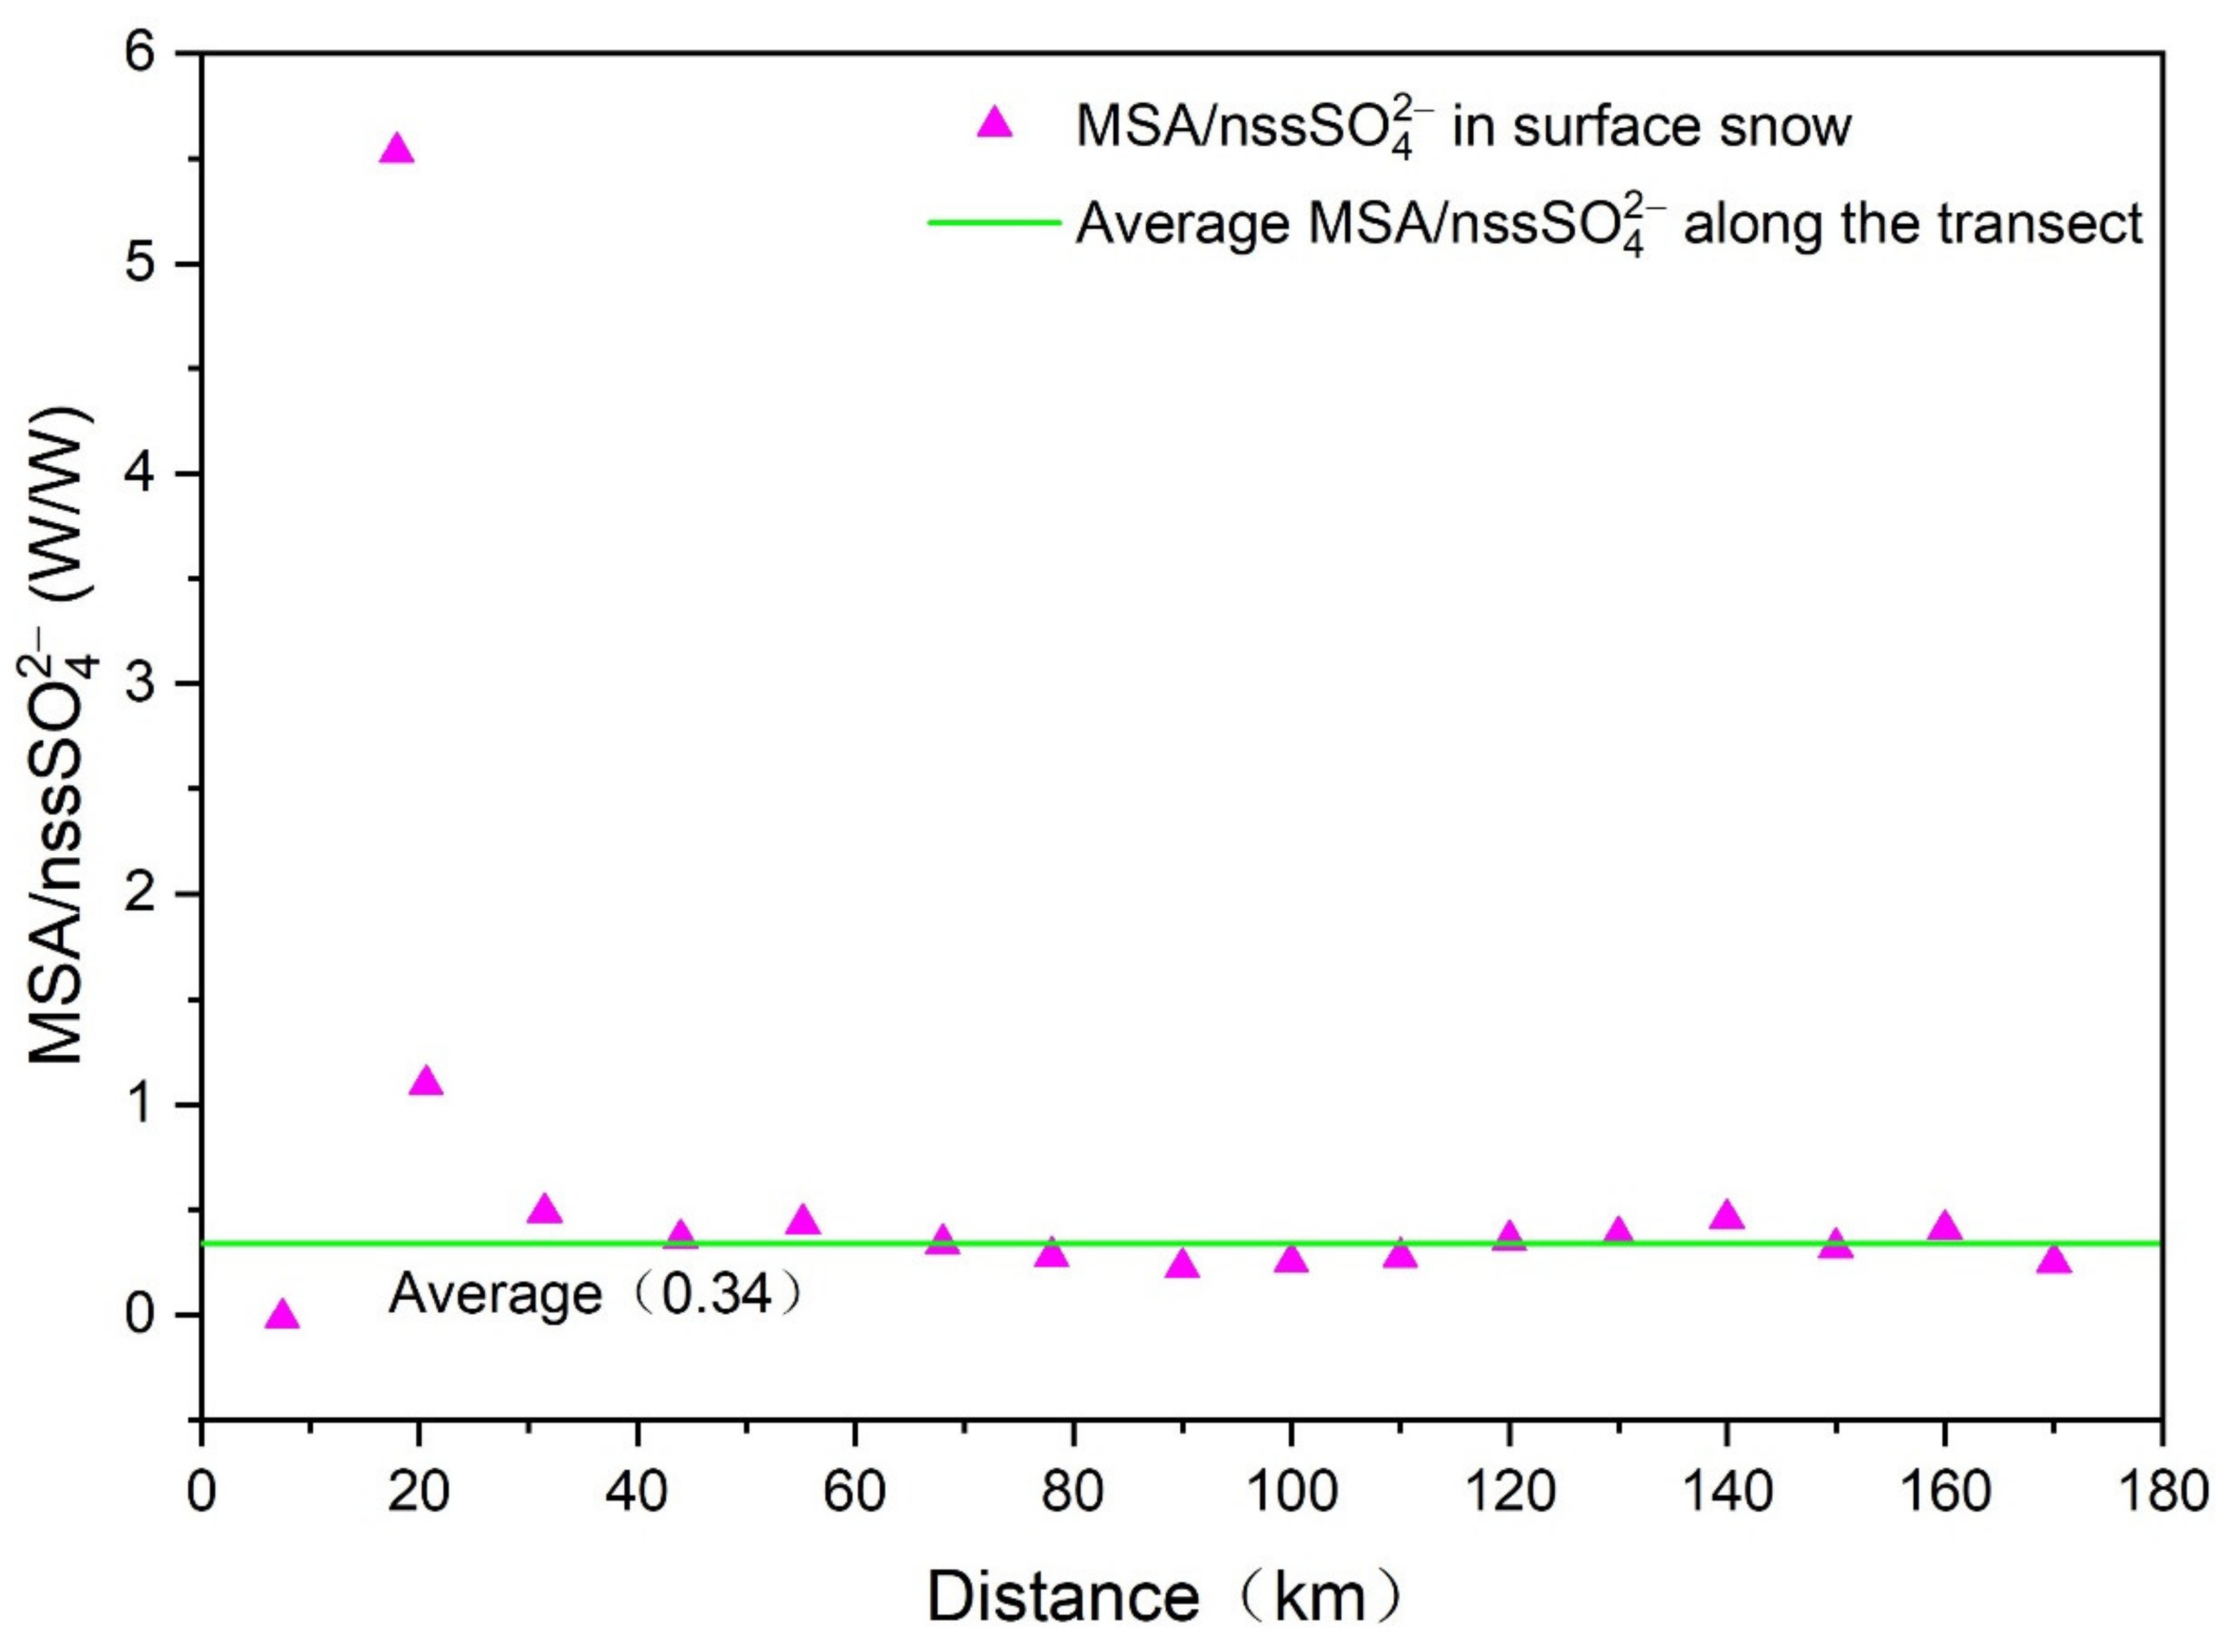
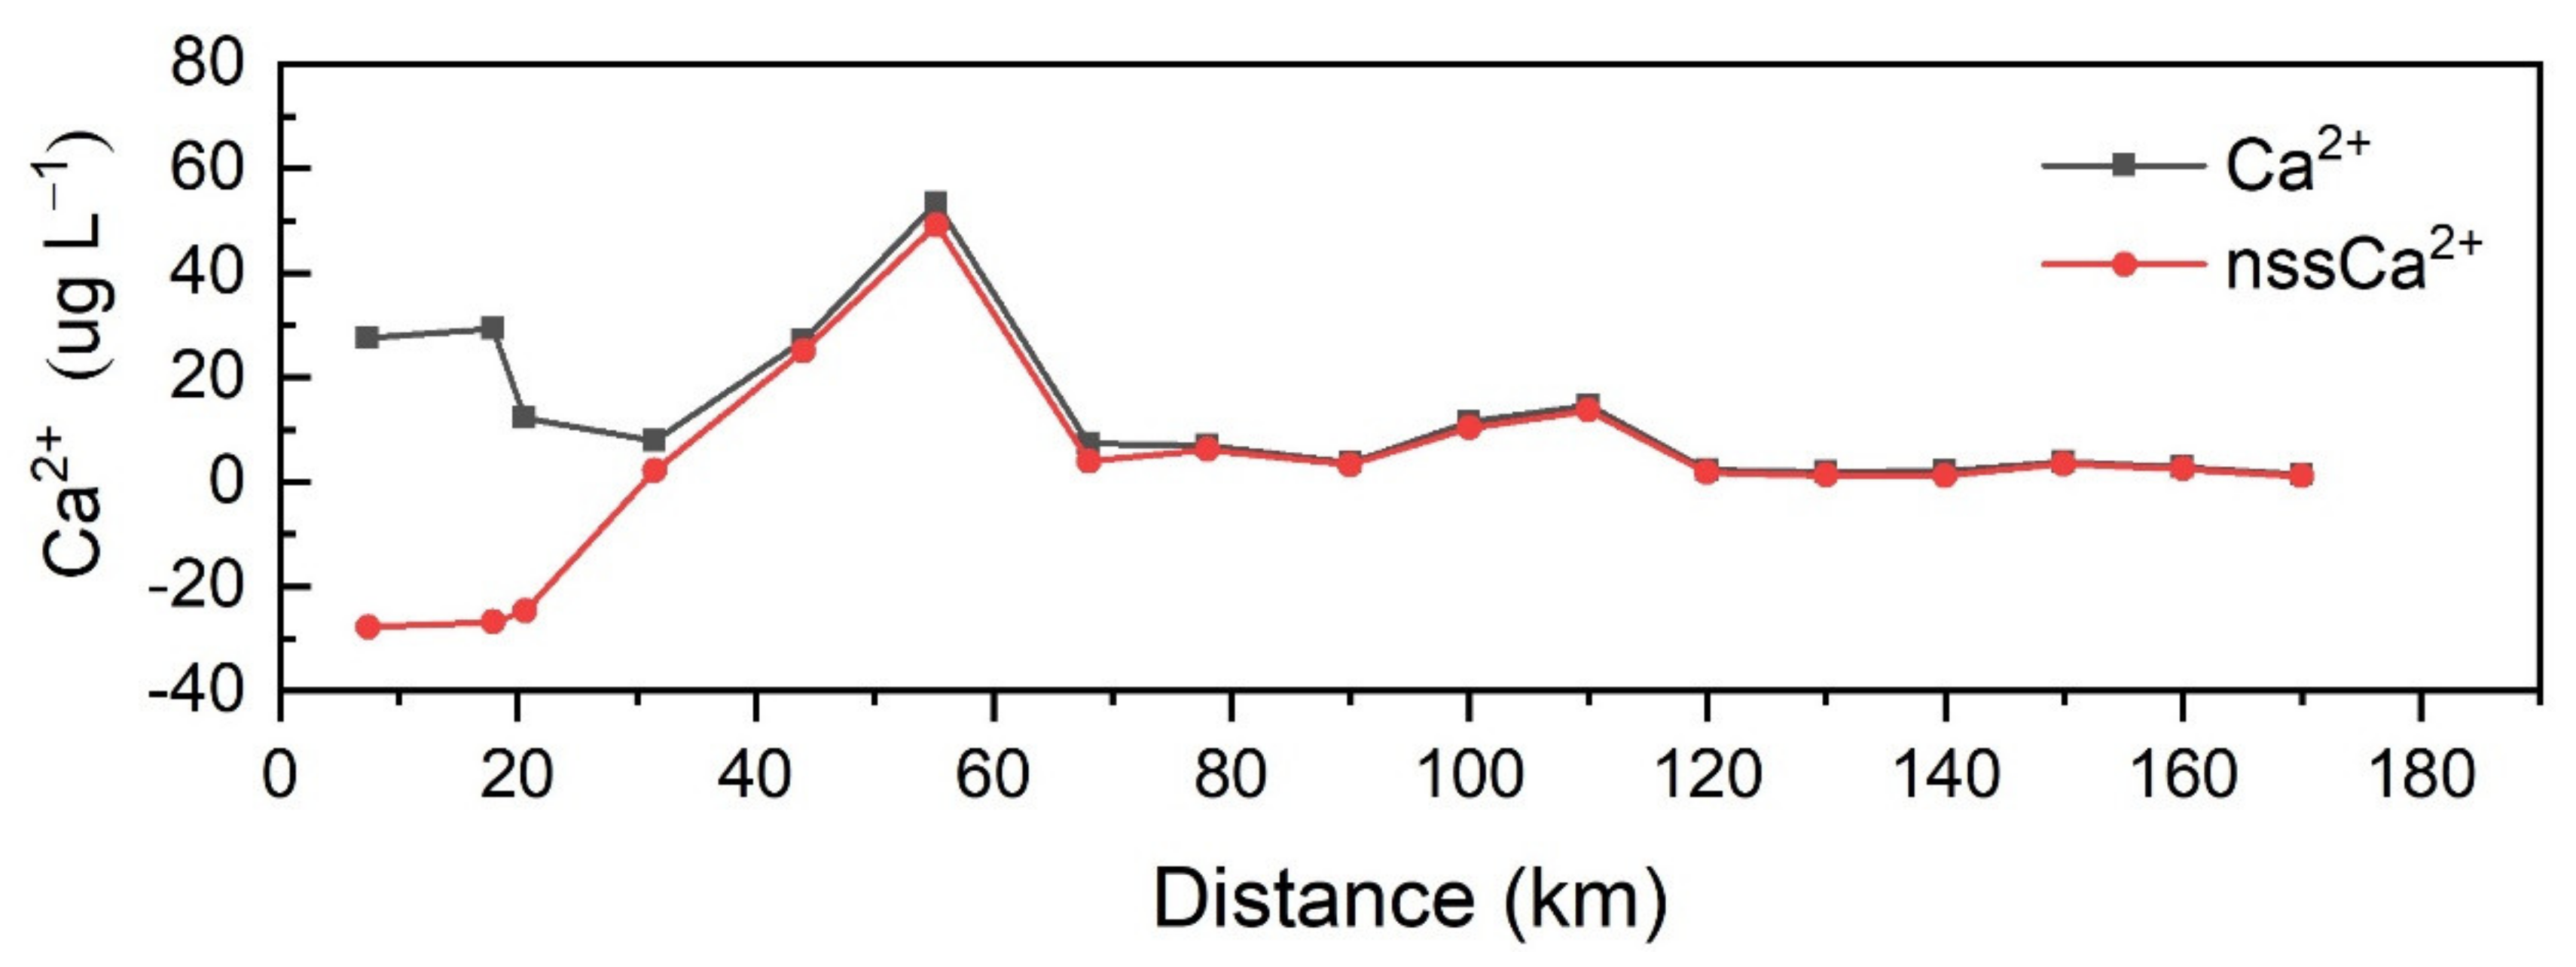
3.1.2. Non-Sea-Salt Ions

The mass concentrations of nssSO42− and nssCa2+ were calculated using the following equations and Na+ was considered to be only provided by sea water:
nssSO42− = SO42− − Na+ × 0.2525,
nssCa2+ = Ca2+ − Na+ × 0.038,
where 0.2525 and 0.038 are the mass concentration ratios of (SO42−)/(Na+) and (Ca2+)/(Na+) in sea water, respectively [44,45,46].
The MSA concentrations showed an overall decreasing trend with increasing distance from the coast and/or altitude. High MSA concentrations obtained between 7.4 and 68 km (285–1041 m altitude) ranged between 2.77 and 145.82 µg L−1. However, the data from the interior region (78–170 km or 1157–1852 m altitude) showed relatively low MSA concentrations (ranged from 17.60 to 48.09 µg L−1) (Figure 5). The detailed MSA concentrations of the surface snow samples along the transect are shown in Table 3. The MSA concentrations showed a significant relationship with distance from the coast or altitude (Table 4). This implies that distance from the coast and/or altitude are the main factors that affect the spatial distribution of MSA.
The variation of nssSO42− concentrations was similar to that of the MSA concentrations (Figure 5). However, a few surface snow samples with negative and low nssSO42−/SO42− percentages were observed in the steep coastal escarpment region within 20.6 km (Table 5), as discussed later. The nssSO42− concentrations showed high values (ranged from 118.45 to 335.38 µg L−1) between 31.5 and 68 km (737–1041 m altitude). The relatively low nssSO42− concentrations (ranged from 58.48 to 162.24 µg L−1) were obtained from 78 to 170 km (1157–1852 m altitude) (Figure 5). Table 3 shows the detailed nssSO42− concentrations of the surface snow samples along the transect. When the surface snow samples with negative and low nssSO42−/SO42− percentages within 20.6 km were excluded, the nssSO42− concentrations exhibited a significant negative correlation with distance from the coast (R = −0.624, p < 0.05) or altitude (R = −0.642, p < 0.05), implying that the variation of nssSO42− is dependent both on distance from the coast and/or altitude. Moreover, the high concentrations of MSA and nssSO42− occurred between 7.4 and 68 km, whereas those of sea-salt ions appeared only between 7.4 and 20.6 km. This is because super-micrometric sea-salt aerosol particles have relatively shorter atmospheric residence times and undergo more efficient atmospheric scavenging process than sub-micrometric MSA and nssSO42− aerosol particles in the coastal regions [5,47,48]. The nssSO42− concentrations exhibited a significant correlation with MSA concentration (Table 4), which suggests that both of them are from the atmospheric oxidation of DMS, which is produced by phytoplankton activity in the ocean.
In general, nssSO42− contributes mostly to the sulfate budget [27,30]. However, in the present study, the spatial distribution pattern of nssSO42−/SO42− ratios was characterized by their gradual increase and stabilization from the coast inland, and a few negative and low ratios of nssSO42−/SO42− were observed in the steep coastal escarpment region within 20.6 km (Table 5). Two main mechanisms have been proposed for the negative and low nssSO42−/SO42− percentages in coastal Antarctica. First, negative and low nssSO42−/SO42− percentages have been speculated to both originate from the underestimation of nssSO42−. This implies that their sea-salt ions are likely from fractionated sea-salt aerosols produced by salty frost flowers on the sea ice surface at coastal Antarctica sites [2,19,49,50,51]. The SO42−/Na+ ratio of salty frost flowers is lower than that of sea water owing to the brine fractionation processes on the sea ice surface, which occur when the ice temperature decreases. Mirabilite (Na2SO4·10 H2O) begins to precipitate at −8 °C but NaCl precipitation only begins at −26 °C. Thus, the use of original SO42−/Na+ ratio from sea water in the nssSO42− calculations may cause the negative and low concentrations of nssSO42− in the snow samples. The low nssSO42−/SO42− percentages can also be attributed to the atmospheric scavenging of sea-salt aerosol particles by wet and dry removal processes. Super-micrometric ssSO42− aerosol particles have relatively shorter atmospheric residence times and undergo more efficient atmospheric scavenging process than sub-micrometric biogenic nssSO42− aerosol particles in the coastal regions [5,47,48].
In the present study, it is unlikely that the effects of salty frost flower fractionation can be used to explain the negative and low nssSO42−/SO42− percentages that occurred only in the steep coastal escarpment region within 20.6 km. Given that the nssSO42− calculation was based on Na+, the increase of Na+ concentrations driven by the steep slopes can affect the nssSO42− calculations, resulting in negative or low nssSO42− concentrations. Therefore, the negative and low nssSO42−/SO42− percentages in the steep coastal escarpment region within 20.6 km can be attributed to the increased Na+ concentrations driven by the steep slopes of the coastal escarpment and the effects of atmospheric scavenging processes.
An inverse relationship has been reported between site temperature and MSA/nssSO42− ratios in the marine atmospheric boundary layer of the southern hemisphere [52]. Higher MSA/nssSO42− ratios (0.15–0.93, W/W) in the marine atmospheric boundary layer in summer were observed near coastal Antarctica, whereas lower MSA/nssSO42− ratios (0.0024–0.12, W/W) were observed at mid and low latitudes [53]. Thus, the MSA/nssSO42− ratios in snow samples from Antarctica can be used as a tracer of the latitudes of marine source regions of MSA and nssSO42− at a given location, i.e., high MSA/nssSO42− ratios in snow samples suggest that they are from a high-latitude marine source [54].
In the present study, a few abnormally negative and high MSA/nssSO42− ratios were observed in the steep coastal escarpment region within 20.6 km. A negative MSA/nssSO42− ratio (−0.01) was recorded at the LH9601 site at 7.4 km (285 m altitude). The highest MSA/nssSO42− ratio (5.53) was recorded at the LHA006 site at 17.9 km (520 m altitude), followed by 1.09 at the L156 site at 20.6 km (586 m altitude) (Figure 6 and Table 5). As mentioned previously, the increased Na+ concentrations driven by the steep slopes of the coastal escarpment can result in negative and low nssSO42− concentrations. Consequently, abnormally negative and high MSA/nssSO42− ratios occurred in the steep coastal escarpment region within 20.6 km. When the abnormally negative and high MSA/nssSO42− ratios within 20.6 km were removed, the mean MSA/nssSO42− value of the surface snow samples from Zhongshan Station to LGB69 was 0.34 ± 0.08 (Figure 6), which was in agreement with the MSA/nssSO42− ratios observed in the marine atmospheric boundary layer near coastal Antarctica, implying that the source regions of the MSA and nssSO42− from Zhongshan Station to LGB69 are likely coastal sea areas.
Ca2+ concentrations also showed an overall decreasing trend with increasing distance from the coast and/or altitude. High Ca2+ concentrations (ranged from 7.85 to 53.40 µg L−1) were measured between 7.4 and 55.2 km (285–955 m altitude). However, the data from the interior region between 68 and 170 km (1041–1852 m altitude) exhibited relatively low Ca2+ concentrations (ranged from 1.44 to 14.76 µg L−1) (Figure 7). The detailed Ca2+ concentrations of the surface snow samples along the transect are shown in Table 3. The Ca2+ concentrations showed a significant correlation with distance from the coast or altitude (Table 4), implying that the spatial distribution of Ca2+ from Zhongshan Station to LGB69 is also mainly affected by distance from the coast and/or altitude.
The main sources of Ca2+ in Antarctic snow are continental dust and sea spray [55]. In the present study, the calculated nssCa2+/Ca2+ percentages in the surface snow samples from Zhongshan Station to LGB69 (Table 5) suggest that continental dust is the primary source for Ca2+ and the contribution from sea spray is relatively minor. However, similar to nssSO42−, negative nssCa2+ concentrations were also observed in the steep coastal escarpment region within 20.6 km (Table 3), which may also be because of the increased Na+ concentrations driven by the steep slopes of the coastal escarpment.
The spatial distributions of non-sea-salt ions in the two snow pits were also simultaneously analyzed. The concentrations of nssSO42− and MSA of the LHA006 snow pit ranged from −301.69 to 580.68 and 1.36 to 345.86 µg L−1, respectively, and those of the LGB69 snow pit ranged from 2.24 to 96.27 and 0 to 18.08 µg L−1, respectively (Table 6). However, the mean nssSO42−/SO42− percentage in the LHA006 snow pit (14%) was substantially lower than the LGB69 snow pit value (76%), which was similar to that at Hercules Névé (75%) [5] and lower than that at Talos Dome (88%) [4]. Moreover, the mean MSA/nssSO42− ratio in the LHA006 snow pit (1.38) was considerably higher than that of the LGB69 snow pit (0.22). These large differences in the mean nssSO42−/SO42− percentage and mean MSA/nssSO42− ratio between the LHA006 and LGB69 snow pits can be explained by the increased Na+ concentrations driven by the steep slopes of the coastal escarpment and effects of atmospheric scavenging processes.
The concentrations of Ca2+ of the LHA006 snow pit ranged from 8.87 to 110.00 µg L−1, whereas those of the LGB69 snow pit ranged from 2.13 to 101.53 µg L−1 (Table 6). However, the calculated mean concentration of nssCa2+ showed a negative value (−1.46 ± 17.20 µg L−1) in the LHA006 snow pit samples (Table 6). As with the negative nssCa2+ concentration in the surface snow sample at LHA006, the negative mean concentration of nssCa2+ in the LHA006 snow pit samples can also be attributed to the increased Na+ concentrations driven by the steep slopes of the coastal escarpment. The mean nssCa2+/Ca2+ percentage of the LGB69 snow pit samples (88%) shows that the nssCa2+ contributes mostly to the total Ca2+.

3.2. Spatial Variability of Isotopic Compositions

The spatial distributions of δD, δ18O, and d-excess from in the surface snow samples were analyzed. The second-order parameter d-excess was calculated following [56]:
d-excess = δD − 8 × δ18O,
Both the δD and δ18O values in the surface snow samples decreased with increasing distance from the coast and/or altitude (Figure 8), exhibiting significant negative correlations (Table 7). The detailed δD and δ18O values in the surface snow samples along the transect are shown in Table 3. The lapse rates of δD and δ18O with distance from the coast were respectively −54.17‰/100 km and −6.84‰/100 km (Table 8). The topographic features were revealed by the contour lines in Figure 1 and showed that the slope from Zhongshan Station to LGB69 was steeper than that between LGB69 and Dome A, causing the rapid decreases of δD and δ18O values. The lapse rates of δD and δ18O with distance from the coast along the transect from Zhongshan Station to LGB69 were therefore considerably larger than those along the transect from Zhongshan Station to Dome A. The lapse rates of δD and δ18O with altitude from Zhongshan Station to LGB69 were respectively −5.99‰/100 m and −0.75‰/100 m, and lower than those from Zhongshan Station to Dome A (Table 8). This can still be attributed to the topographic difference between the transect from Zhongshan Station to LGB69 and that from LGB69 to Dome A.
The relationship between δD and δ18O values in the surface snow samples is given as
δD = (7.90 ± 0.17) δ18O − (0.09 ± 3.33) (R2 = 0.99, n = 17),
The slope between δD and δ18O was 7.90 ± 0.17 and lower than that of GMWL, but higher than the values reported by Li et al. (7.78 ± 0.04) [27] and Xiao et al. (7.50 ± 0.1) [26]. This indicates that more intense kinetic fractionation processes occur during snow formation in the inland between LGB69 and Dome A
The d-excess values did not show a significant relationship with distance from the coast (R = 0.111, p = 0.67) or altitude (R = 0.064, p = 0.80) (Table 7), indicating that the spatial distribution of d-excess from Zhongshan Station to LGB69 is mainly affected by the moisture source region. The gradients of d-excess with distance from the coast and altitude were 0.53‰/100 km and 0.03‰/100 m, respectively, which were substantially lower than values reported by Xiao et al. 26 (Table 8). The d-excess varied from −4.47‰ to 4.97‰ (Table 8), a considerably smaller range than those reported by Li et al. [27] and Xiao et al. [26], from Zhongshan Station to Dome A. The variation of d-excess was stable, which suggests that the transect from Zhongshan Station to LGB69 has the same moisture source region.
The mean values of δD, δ18O, and d-excess in the snow pit samples were simultaneously analyzed. The δD and δ18O values at LHA006 ranged from −178.19 to −121.15‰ and −23.26 to −15.04‰, respectively, whereas those at LGB69 ranged from −302.09 to −200.27‰ and −37.96 to −25.04‰, respectively (Table 9). The d-excess values at LHA006 ranged between −1.25 and 10.88‰ with a mean value of 3.32 ± 2.53‰. The d-excess values at LGB69 ranged between −6.64 and 9.33‰ with a mean value of 2.56 ± 3.59‰ (Table 9). Previous studies noted that the d-excess values in Antarctica are low (~5‰) and stable below 2000 m altitude, which implies that the moisture source regions are coastal sea areas [32,57]. In our study, the altitudes of both LHA006 and LGB69 are below 2000 m. Furthermore, the mean d-excess values in the LHA006 and LGB69 snow pits were low and similar, indicating that the precipitation at both LHA006 and LGB69 originates from the same moisture source region (i.e., coastal sea area).

4. Conclusions

This study reports the spatial distribution patterns and sources of ions and stable isotopes as well as factors that influence the deposition of major ions and the composition of stable isotopes in surface snow and snow pit samples obtained along a transect from Zhongshan Station to LGB69, East Antarctica.
The spatial distributions of sea-salt ions (Cl, Na+, and Mg2+) along the transect showed that sea-salt ions exponentially decreased with increasing distance from the coast or altitude. The distance from the coast and/or altitude are the two major factors that influence the spatial distributions of sea-salt ions. High Cl, Na+, and Mg2+ concentrations that occurred specifically in the steep coastal escarpment region within 20.6 km can be attributed to the preferential wet or dry deposition of sea-salt aerosols. The average Cl/Na+ ratio of the surface snow samples from Zhongshan Station to LGB69 was 1.67 ± 0.44, which suggests that sea salt is the main source of Cl and Na+ along the transect. However, the steep slopes of the coastal escarpment can result in wind redistribution-induced snow redistribution, leading to increased Na+ concentrations. Thus, the Cl/Na+ ratios, nssSO42−, MSA/nssSO42− ratios, and nssCa2+ values calculated based on Na+ showed a few abnormal values in the steep coastal escarpment region within 20.6 km. MSA, nssSO42−, and Ca2+ concentrations showed overall decreasing trends with increasing distance from the coast and/or altitude. The distance from the coast and/or altitude are the major influencing factors of the spatial distributions of MSA, nssSO42−, and Ca2+. The similar spatial variation and significant correlation between MSA and nssSO42− in the surface snow indicate their common source, i.e., biogenic activity. When the abnormally negative and high MSA/nssSO42− ratios within 20.6 km were removed, the mean MSA/nssSO42− value of surface snow samples was 0.34 ± 0.08, which suggests that their source regions are likely coastal sea areas. The nssCa2+/Ca2+ percentages in the surface snow and LGB69 snow pit samples indicated that continental dust is the primary source for Ca2+ along the transect from Zhongshan Station to LGB69.
In addition, δD and δ18O values decreased from the coast inland. Both δD and δ18O in the surface snow exhibited significant negative correlations with distance from the coast and/or altitude. The lapse rates of δD and δ18O from Zhongshan Station to LGB69 were larger than those from Zhongshan Station to Dome A because of the steeper slope of the former transect. The d-excess values did not show a significant relationship with distance from the coast or altitude, indicating that the moisture source region is the major factor that affected the spatial distribution of d-excess from Zhongshan Station to LGB69. The variation of d-excess in the surface snow samples was stable and the mean d-excess values in the LHA006 and LGB69 snow pits were low and similar (3.32 ± 2.53‰ and 2.56 ± 3.59‰, respectively), which indicates that the moisture source region between Zhongshan Station and LGB69 is the coastal sea area.
The glaciochemistry results of the surface snow and snow pit samples along the transect from Zhongshan Station to LGB69 suggest that the ionic and moisture source region is the coastal sea area, which will be useful for interpreting the temporal variability of chemical ions and isotopes from ice cores drilled in the coastal regions of Princess Elizabeth Land.

Author Contributions

Conceptualization, W.H. and M.Y.; Data curation, M.Y. and R.M.; Formal analysis, W.H., M.Y., L.L., C.A. and Y.Z.; Funding acquisition, M.Y. and Z.Q.; Investigation, M.Y. and C.X.; Methodology, W.H., M.Y. and R.M.; Project administration, M.Y.; Supervision, M.Y.; Validation, W.H., Z.Q., L.L., C.A. and Y.Z.; Writing—original draft, W.H.; Writing—review and editing, W.H. and M.Y. All authors have read and agreed to the published version of the manuscript.

Funding

This research was supported by the National Natural Science Foundation of China (41676192; 51676144).

Institutional Review Board Statement

Not applicable.

Informed Consent Statement

Not applicable.

Data Availability Statement

The data that support the findings of this study are available from the corresponding author, upon reasonable request.

Acknowledgments

We thank Susan Foord and Jack Triest of the British Antarctic Survey for their help with cutting of the ice cores, and Louise Gemma Thilthorpe of the British Antarctic Survey for assistance with ion chromatography analysis of snow and ice samples.

Conflicts of Interest

The authors declare no conflict of interest.

References

  1. Delmas, R.J. Environmental information from ice cores. Rev. Geophys. 1992, 30, 1–21. [Google Scholar] [CrossRef]
  2. Wolff, E.W.; Rankin, A.M.; Röthlisberger, R. An ice core indicator of Antarctic sea ice production? Geophys. Res. Lett. 2003, 30, 2158. [Google Scholar] [CrossRef]
  3. Abram, N.J.; Mulvaney, R.; Wolff, E.W.; Mudelsee, M. Ice core records as sea ice proxies: An evaluation from the Weddell Searegion of Antarctica. J. Geophys. Res. Atmos. 2007, 112, D15101. [Google Scholar] [CrossRef] [Green Version]
  4. Becagli, S.; Benassai, S.; Castellano, E.; Largiuni, O.; Migliori, A.; Traversi, R.; Flora, O.; Udisti, R. Chemical characterization of the last 250 years of snow deposition at Talos Dome (East Antarctica). Int. J. Environ. Anal. Chem. 2004, 84, 523–536. [Google Scholar] [CrossRef]
  5. Traversi, R.; Becagli, S.; Castellano, E.; Largiuni, O.; Migliori, A.; Severi, M.; Frezzotti, M.; Udisti, R. Spatial and temporal distribution of environmental markers from Coastal to Plateau areas in Antarctica by firn core chemical analysis. Int. J. Environ. Anal. Chem. 2004, 84, 457–470. [Google Scholar] [CrossRef]
  6. Saltzman, E.S. Ocean/Atmosphere Cycling of Dimethylsulfide. In Ice Core Studies of Global Biogeochemical Cycles. NATO ASI Series (Series I: Global Environmental Change); Delmas, R.J., Ed.; Springer: Berlin/Heidelberg, Germany, 1995; Volume 30, pp. 65–89. [Google Scholar] [CrossRef]
  7. Saigne, C.; Legrand, M. Measurements of methanesulphonic acid in Antarctic ice. Nature 1987, 330, 240–242. [Google Scholar] [CrossRef]
  8. Legrand, M.; Feniet-Saigne, C. Methanesulfonic acid in south polar snow layers: A record of strong El Niño? Geophys. Res. Lett. 1991, 18, 187–190. [Google Scholar] [CrossRef]
  9. Castebrunet, H.; Martinerie, P.; Genthon, C.; Cosme, E. A three-dimensional model study of methanesulphonic acid to non sea salt sulphate ratio at mid and high-southern latitudes. Atmos. Chem. Phys. Atmos. 2009, 9, 9449–9469. [Google Scholar] [CrossRef] [Green Version]
  10. Cole-Dai, J.; Mosley-Thompson, E.; Wight, S.P.; Thompson, L.G. A 4100-year record of explosive volcanism from an East Antarctica ice core. J. Geophys. Res. Atmos. 2000, 105, 24431–24441. [Google Scholar] [CrossRef]
  11. Ren, J.; Li, C.; Hou, S.; Xiao, C.; Qin, D.; Li, Y.; Ding, M. A 2680 year volcanic record from the DT-401 East Antarctic ice core. J. Geophys. Res. Atmos. 2010, 115, 11301. [Google Scholar] [CrossRef] [Green Version]
  12. Hammer, C.U. Initial direct current in the buildup of space charges and the acidity of ice cores. J. Phys. Chem. 1983, 87, 4099–4103. [Google Scholar] [CrossRef]
  13. Hammer, C.U. Acidity of polar ice cores in relation to absolute dating, past volcanism, and Radio-Echoes. J. Glaciol. 1980, 25, 359–372. [Google Scholar] [CrossRef] [Green Version]
  14. Legrand, M.; Delmas, R.J. A 220-year continuous record of volcanic H2SO4 in the Antarctic ice sheet. Nature 1987, 327, 671–676. [Google Scholar] [CrossRef]
  15. Masson-Delmotte, V.; Hou, S.; Ekaykin, A.; Jouzel, J.; Aristarain, A.; Bernardo, R.T.; Bromwich, D.; Cattani, O.; Delmotte, M.; Falourd, S.; et al. A Review of Antarctic Surface Snow Isotopic Composition: Observations, Atmospheric Circulation, and Isotopic Modeling*. J. Clim. 2008, 21, 3359–3387. [Google Scholar] [CrossRef] [Green Version]
  16. Kurita, N. Origin of Arctic water vapor during the ice-growth season. Geophys. Res. Lett. 2011, 38, L02709. [Google Scholar] [CrossRef]
  17. Wang, Y.; Sodemann, H.; Hou, S.; Masson-Delmotte, V.; Jouzel, J.; Pang, H. Snow accumulation and its moisture origin over Dome Argus, Antarctica. Clim. Dyn. 2013, 40, 731–742. [Google Scholar] [CrossRef]
  18. Vance, T.R.; Roberts, J.L.; Moy, A.D.; Curran, M.A.J.; Tozer, C.R.; Gallant, A.J.E.; Abram, N.J.; van Ommen, T.D.; Young, D.A.; Grima, C.; et al. Optimal site selection for a high-resolution ice core record in East Antarctica. Clim. Past 2016, 12, 595–610. [Google Scholar] [CrossRef] [Green Version]
  19. Vega, C.P.; Isaksson, E.; Schlosser, E.; Divine, D.; Martma, T.; Mulvaney, R.; Eichler, A.; Schwikowski-Gigar, M. Variability of sea salts in ice and firn cores from Fimbul Ice Shelf, Dronning Maud Land, Antarctica. Cryosphere 2018, 12, 1681–1697. [Google Scholar] [CrossRef] [Green Version]
  20. Nyamgerel, Y.; Han, Y.; Kim, S.; Hong, S.-B.; Lee, J.; Hur, S.D. Chronological characteristics for snow accumulation on Styx Glacier in northern Victoria Land, Antarctica. J. Glaciol. 2020. [Google Scholar] [CrossRef]
  21. Kärkäs, E.; Teinilä, K.; Virkkula, A.; Aurela, M. Spatial variations of surface snow chemistry during two austral summers in western Dronning Maud Land, Antarctica. Atmos. Environ. 2005, 39, 1405–1416. [Google Scholar] [CrossRef]
  22. Zhang, M.J.; Li, Z.Q.; Xiao, C.D.; Ren, J.W.; Qin, D.H.; Kang, J.C.; Li, J. Decreasing trend of temperature in Princess Elizabeth Land, Antarctica in the past 150 years. Chin. Sci. Bull. 2002, 47, 1474–1478. [Google Scholar] [CrossRef]
  23. Hou, S.; Li, Y.; Xiao, C.; Pang, H.; Xu, J. Preliminary results of the close-off depth and the stable isotopic records along a 109.91 m ice core from Dome A, Antarctica. Sci. China Ser. D Earth Sci. 2009, 52, 1502–1509. [Google Scholar] [CrossRef]
  24. Ding, M.; Xiao, C.; Jin, B.; Ren, J.; Qin, D.; Sun, W. Distribution of δ18O in surface snow along a transect from Zhongshan Station to Dome A, East Antarctica. Chin. Sci. Bull. 2010, 55, 2709–2714. [Google Scholar] [CrossRef]
  25. Ren, J.W.; Sun, J.Y.; Qin, D.H. Preliminary results of ionic concentrations in snow pits along the Zhongshan–Dome A traverse route, Antarctica. Ann. Glaciol. 2004, 39, 155–160. [Google Scholar] [CrossRef]
  26. Xiao, C.; Ding, M.; Masson-Delmotte, V.; Zhang, R.; Jin, B.; Ren, J.; Li, C.; Werner, M.; Wang, Y.; Cui, X.; et al. Stable isotopes in surface snow along a traverse route from Zhongshan station to Dome A, East Antarctica. Clim. Dyn. 2013, 41, 2427–2438. [Google Scholar] [CrossRef]
  27. Li, C.; Xiao, C.; Shi, G.; Ding, M.; Qin, D.; Ren, J. Spatial and temporal variability of marine-origin matter along a transect from Zhongshan Station to Dome A, Eastern Antarctica. J. Environ. Sci. 2016, 46, 190–202. [Google Scholar] [CrossRef]
  28. Li, C.; Qin, X.; Ding, M.; Guo, R.; Xiao, C.; Hou, S.; Bian, L.; Qin, D.; Ren, J. Temporal variations in marine chemical concentrations in coastal areas of eastern Antarctica and associated climatic causes. Quat. Int. 2014, 352, 16–25. [Google Scholar] [CrossRef]
  29. Mulvaney, R.; Wolff, E.W. Spatial variability of the major chemistry of the Antarctic ice sheet. Ann. Glaciol. 1994, 20, 440–447. [Google Scholar] [CrossRef]
  30. Khodzher, T.V.; Golobokova, L.P.; Osipov, E.Y.; Shibaev, Y.A.; Lipenkov, V.Y.; Osipova, O.P.; Petit, J.R. Spatial-temporal dynamics of chemical composition of surface snow in East Antarctica along the Progress station-Vostok station transect. Cryosphere 2014, 8, 931–939. [Google Scholar] [CrossRef] [Green Version]
  31. Minikin, A.; Wagenbach, D.; Graf, W.; Kipfstuhl, J. Spatial and seasonal variations of the snow chemistry at the central Filchner-Ronne Ice Shelf, Antarctica. Ann. Glaciol. 1994, 20, 283–290. [Google Scholar] [CrossRef]
  32. Ren, J.W.; Qin, D.H. Distribution of deuterium excess in surface snow of the Antarctic ice sheet. Chin. Sci. Bull. 1995, 40, 1629–1633. [Google Scholar]
  33. Ding, M.; Xiao, C.; Li, Y.; Ren, J.; Hou, S.; Jin, B.; Sun, B. Spatial variability of surface mass balance along a traverse route from Zhongshan station to Dome A, Antarctica. J. Glaciol. 2011, 57, 658–666. [Google Scholar] [CrossRef] [Green Version]
  34. Li, R.; Xiao, C.; Sneed, S.; Yan, M. A continuous 293-year record of volcanic events in an ice core from Lambert Glacier basin, East Antarctica. Antarct. Sci. 2012, 24, 293–298. [Google Scholar] [CrossRef]
  35. Lis, G.; Wassenaar, L.I.; Hendry, M.J. High-Precision Laser Spectroscopy D/H and 18O/16O Measurements of Microliter Natural Water Samples. Anal. Chem. 2008, 80, 287–293. [Google Scholar] [CrossRef] [PubMed]
  36. Mahalinganathan, K.; Thamban, M.; Laluraj, C.M.; Redkar, B.L. Relation between surface topography and sea-salt snow chemistry from Princess Elizabeth Land, East Antarctica. Cryosphere 2012, 6, 505–515. [Google Scholar] [CrossRef] [Green Version]
  37. Ma, Y.F.; Bian, L.G.; Xiao, C.D.; Allison, I.; Zhou, X.J. Near surface climate of the traverse route from Zhongshan Station to Dome A, East Antarctica. Antarct. Sci. 2010, 22, 443–459. [Google Scholar] [CrossRef]
  38. Bintanja, R.; Severijns, C.; Haarsma, R.; Hazeleger, W. The future if Antarctica’s surface wings simulated by a high-resolution global climate model: 1. Model description and validation. J. Geophys. Res. Atmos. 2014, 119, 7136–7159. [Google Scholar] [CrossRef]
  39. King, J.C.; Turner, J. Antarctic Meteorology and Climatology; Cambridge University Press (CUP): Cambridge, UK, 1997. [Google Scholar]
  40. Suzuki, T.; Iizuka, Y.; Matsuoka, K.; Furukawa, T.; Kamiyama, K.; Watanabe, O. Distribution of sea salt components in snow cover along the traverse route from the coast to Dome Fuji station 1000 km inland at east Dronning Maud Land, Antarctica. Tellus B 2002, 54, 407–411. [Google Scholar] [CrossRef]
  41. Broecker, W.S.; Peng, T.H. Tracers in the sea. In Lamont-Doherty Geological Observatory; Eldigio Press: New York, NY, USA, 1982. [Google Scholar]
  42. Röthlisberger, R.; Mulvaney, R.; Wolff, E.W.; Hutterli, M.A.; Bigler, M.; De Angelis, M.; Hansson, M.E.; Steffensen, J.P.; Udisti, R. Limited dechlorination of sea-salt aerosols during the last glacial period: Evidence from the European Project for Ice Coring in Antarctica (EPICA) Dome C ice core. J. Geophys. Res. Atmos. 2003, 108, 4526. [Google Scholar] [CrossRef]
  43. Frezzotti, M.; Gandolfi, S.; Urbini, S. Snow megadunes in Antarctica: Sedimentary structure and genesis. J. Geophys. Res. Atmos. 2002, 107, ACL 1-1. [Google Scholar] [CrossRef]
  44. Holland, H.D. The Chemistry of the Atmosphere and Oceans; Wiley: New York, NY, USA, 1978; p. 351. [Google Scholar]
  45. De Angelis, M.; Steffensen, J.P.; Legrand, M.; Clausen, H.; Hammer, C. Primary aerosol (sea salt and soil dust) deposited in Greenland ice during the last climatic cycle: Comparison with east Antarctic records. J. Geophys. Res. Oceans 1997, 102, 26681–26698. [Google Scholar] [CrossRef]
  46. Summerhayes, C.P.; Thorpe, S.A. Oceanography: An Illustrated Guide; Wiley: New York, NY, USA, 1996; Chapter 11; pp. 165–181. [Google Scholar]
  47. Becagli, S.; Proposito, M.; Benassai, S.; Gragnani, R.; Magand, O.; Traversi, R.; Udisti, R. Spatial distribution of biogenic sulphur compounds (MSA, nssSO42−) in the northern Victoria Land–Dome C–Wilkes Land area, East Antarctica. Ann. Glaciol. 2005, 41, 23–31. [Google Scholar] [CrossRef] [Green Version]
  48. Benassai, S.; Becagli, S.; Gragnani, R.; Magand, O.; Proposito, M.; Fattori, I.; Traversi, R.; Udisti, R. Sea-spray deposition in Antarctic coastal and plateau areas from ITASE traverses. Ann. Glaciol. 2005, 41, 32–40. [Google Scholar] [CrossRef] [Green Version]
  49. Rankin, A.M.; Auld, V.; Wolff, E.W. Frost flowers as a source of fractionated sea salt aerosol in the polar regions. Geophys. Res. Lett. 2000, 27, 3469–3472. [Google Scholar] [CrossRef] [Green Version]
  50. Rankin, A.M.; Wolff, E.W.; Martin, S. Frost flowers: Implications for tropospheric chemistry and ice core interpretation. J. Geophys. Res. Atmos. 2002, 107, AAC-4. [Google Scholar] [CrossRef]
  51. Abram, N.J.; Wolff, E.W.; Curran, M.A.J. A review of sea ice proxy information from polar ice cores. Quat. Sci. Rev. 2013, 79, 168–183. [Google Scholar] [CrossRef]
  52. Bates, T.S.; Calhoun, J.A.; Quinn, P.K. Variations in the Methanesulphonate to Sulphate Molar Ratio in Submicrometer Marine Aerosol Particles over the South Pacific Ocean. J. Geophys. Res. Atmos. 1992, 97, 9859–9865. [Google Scholar] [CrossRef]
  53. Chen, L.; Wang, J.; Gao, Y.; Xu, G.; Yang, X.; Lin, Q.; Zhang, Y. Latitudinal distributions of atmospheric MSA and MSA/nss-SO42− ratios in summer over the high latitude regions of the Southern and Northern Hemispheres. J. Geophys. Res. Atmos. 2012, 117. [Google Scholar] [CrossRef]
  54. Legrand, M.; Feniet-Saigne, C.; Saltzman, E.S.; Germain, C. Spatial and temporal variations of methanesulfonic acid and non sea salt sulfate in Antarctic ice. J. Atmos. Chem. 1992, 14, 245–260. [Google Scholar] [CrossRef] [Green Version]
  55. Legrand, M.; Mayewski, P. Glaciochemistry of polar ice cores: A review. Rev. Geophys. 1997, 35, 219–243. [Google Scholar] [CrossRef] [Green Version]
  56. Dansgaard, W. Stable isotopes in precipitation. Tellus 1964, 16, 436–468. [Google Scholar] [CrossRef]
  57. Petit, J.R.; White, J.W.C.; Young, N.W.; Jouzel, J.; Korotkevich, Y.S. Deuterium excess in recent Antarctic snow. J. Geophys. Res. Atmos. 1991, 96, 5113–5122. [Google Scholar] [CrossRef]
Figure 1. Sampling location. The red line indicates the transect from Zhongshan Station to LGB69 in this study; The blue dash indicates the entire transect from Zhongshan Station to Dome A; The black dash indicates contour line.
Atmosphere 12 00393 g001
Figure 2. Slope variation along the transect.
Atmosphere 12 00393 g002
Figure 3. Concentration variations of Cl, Na+, and Mg2+ with increasing distance from the coast. Each point represents the value of one surface snow sample for each site, unless otherwise mentioned.
Atmosphere 12 00393 g003
Figure 4. Variation of Cl/Na+ ratios in the surface snow samples from the coast inland.
Atmosphere 12 00393 g004
Figure 5. Concentration variations of MSA, nssSO42−, and SO42− with increasing distance from the coast.
Atmosphere 12 00393 g005
Figure 6. Variation of MSA/nssSO42− ratios in the surface snow samples from coast to inland.
Atmosphere 12 00393 g006
Figure 7. Concentration variations of Ca2+ and nssCa2+ with increasing distance from the coast.
Atmosphere 12 00393 g007
Figure 8. Variations of δD, δ18O, and d-excess of the surface snow samples as a function of distance from the coast.
Atmosphere 12 00393 g008
Table 1. Geographical information of the surface snow samples.
SiteLocationSlope
(m km−1)
Altitude
(m)
Route Distance from Zhongshan Station
(km)
LH960169° 26′ 01″ S
76° 20′ 00″ E
38.5285 7.4
LHA00669°31′13.6″ S
76° 17′ 36″ E
22.4520 17.9
L15669° 33′ 57.2″ S
76° 16′ 05.7″ E
24.4586 20.6
LH40469° 36′ 32″ S
76° 25′ 15.3″ E
13.9737 31.5
LH39769° 42′37.3″ S
76° 28′ 29.6″ E
9.0849 44.0
LH38669° 48′ 30.8″ S
76° 28′ 41.7″ E
9.5955 55.2
LGB7269° 55′ 16.9″ S
76° 29′ 22.7″ E
6.71041 68.0
LT98770° 00′ 31.5″ S
76° 32′ 03.5″ E
11.61157 78.0
LT98170° 06′ 52″ S
76° 35′ 33″ E
11.11290 90.0
LT97670° 12′ 00.6″ S
76° 38′ 14″ E
5.31343 100.0
LT97170° 17′ 29.3″ S
76° 41′ 57″ E
7.41417 110.0
LT96670° 22′ 52″ S
76° 45′ 11″ E
10.31520 120.0
LT96170° 28′ 07″ S
76° 47′ 51.5″ E
4.51565 130.0
LT95670° 33′23.4″ S
76° 51′ 15.2″ E
9.21657 140.0
LT95170° 38′ 37.7″ S
76° 55′ 24″ E
7.21729 150.0
LT94670° 43′ 48.8″ S
76° 59′ 36.5″ E
5.71786 160.0
LT94170° 49′ 02″ S
77° 03′ 40.6″ E
6.61852 170.0
Table 2. Geographical and sampling information of the two snow pits.
SiteLHA006LGB69
Depth (m)1.01.8
Sample number5090
Altitude (m)5201860
Slope (m km−1)22.44.0
Distance from the coast (km)17.9172
Annual accumulation rate * (kg m−2 a−1)200255
* Calculation of the accumulation rate based on snow pit dating and water equivalent depths.
Table 3. Concentrations of major ions and values of stable isotopes of the surface snow samples from coast to inland.
SiteNa+Mg2+Ca2+ClMSASO42−nssSO42− nssCa2+δDδ18Od-Excess
µg L−1
LH96011458.9249.3227.631561.712.77132.44−235.93−27.81−123.57−16.034.70
LHA0061480.1376.5629.421659.08143.02399.6025.86−26.83−83.82−10.641.27
L156970.7846.2212.17952.48112.22347.64102.52−24.72−111.84−14.463.86
LH404150.0022.057.85184.64108.93260.93223.062.15−128.96−16.432.47
LH39749.259.4026.9977.9942.89130.89118.4525.12−144.86−18.462.78
LH386111.6214.4853.40155.51145.82363.56335.3849.16−139.09−16.83−4.47
LGB7288.3412.077.37125.56108.09340.76318.464.02−154.95−18.99−3.01
LT98720.373.076.9337.3424.8993.7988.656.16−163.55−20.530.73
LT98110.884.163.6623.8517.6780.8778.123.25−164.42−20.912.83
LT97629.353.7711.5147.7140.92169.65162.2410.40−174.39−22.001.64
LT97129.273.8214.7675.3642.51161.71154.3113.64−169.00−21.583.63
LT96614.812.442.3725.0820.9362.2258.481.81−168.83−21.734.97
LT96119.513.222.0138.7244.25122.28117.351.27−180.78−22.700.78
LT95623.053.592.0442.5048.09110.53104.711.17−183.75−23.272.44
LT95110.981.893.8519.3629.1693.9991.223.44−184.92−23.321.66
LT9467.931.402.8317.8031.2178.7976.792.53−193.52−24.764.53
LT9418.131.371.4414.6717.6072.4970.431.14−193.06−24.392.04
Table 4. Correlation matrix of the major ions and δ18O values of surface snow samples along with distance from the coast and altitude.
Na+Mg2+Ca2+ClMSAnssSO42−δ18ODistanceAltitude
Na+10.959 *0.4270.998 *0.309−0.576 0.789 *−0.692 *−0.768 *
Mg2+ 10.4800.963 *0.530 −0.3700.900 *−0.762 *−0.813 *
Ca2+ 10.4460.533 0.1060.639 *−0.620 *−0.619 *
Cl 10.320−0.567 0.796 *−0.693 *−0.768 *
MSA 10.574 0.699 *−0.533−0.493
nssSO42− 1−0.0670.0890.188
δ18O 1−0.929 *−0.929 *
Distance 10.991 *
Altitude 1
* Data are significantly correlated at p < 0.01; Data are significantly correlated at p < 0.05.
Table 5. Detailed values of Cl/Na+, nssSO42−/SO42−, MSA/nssSO42−, and nssCa2+/Ca2+ in the surface snow samples from coast to inland.
SiteCl/Na+nssSO42−/SO42− MSA/nssSO42−nssCa2+/Ca2+
(W/W)(%)(W/W)(%)
LH96011.07−178 −0.01−101
LHA0061.126 5.53−91
L1560.9829 1.09−203
LH4041.2385 0.4927
LH3971.5890 0.3693
LH3861.3992 0.4392
LGB721.4293 0.3455
LT9871.8395 0.2889
LT9812.1997 0.2389
LT9761.6396 0.2590
LT9712.5795 0.2892
LT9661.6994 0.3676
LT9611.9996 0.3863
LT9561.8495 0.4657
LT9511.7697 0.3289
LT9462.2497 0.4189
LT9411.8097 0.2579
Table 6. Mean, maximum, minimum, and standard deviation (σ) of major ion concentrations in the LHA006 and LGB69 snow pits.
SiteLHA006LGB69
MeanMaximumMinimumσMeanMaximumMinimumσ
(µg L−1)
MSA48.68345.861.3664.936.4218.080.004.57
Cl1046.182660.70262.10716.0666.47268.105.9051.22
SO42−258.181126.74121.17170.5038.80104.0811.8520.84
nssSO42−35.19580.68−301.69140.2529.4496.272.2420.26
Na+883.132205.96182.40585.1237.08195.512.0234.24
Mg2+93.07223.3827.6658.517.2528.750.536.01
Ca2+32.10110.008.8721.5811.49101.532.1314.26
nssCa2+−1.4687.11−23.7917.2010.08100.970.5214.32
Table 7. Correlation matrix of the stable isotope values of the surface snow samples along with distance from the coast and altitude.
δDδ18Od-ExcessDistanceAltitude
δD10.997 *−0.077−0.929 *−0.933 *
δ18O 1−0.157−0.929 *−0.929 *
d-excess 10.1110.064
Distance 10.991 *
Altitude 1
* The data are significantly correlated at p < 0.01.
Table 8. Gradients of the stable isotope values with distance from the coast and altitude along the transect from Zhongshan Station to LGB69 or to Dome A.
This StudyLi et al. [27]Xiao et al. [26]
transectZhongshan Station-LGB69Zhongshan Station-Dome AZhongshan Station-Dome A
date2001/20022012/20132007/2008
δD-distance−54.17‰/100 km−18.15‰/100 km−16.3‰/100 km
δD-altitude−5.99‰/100 m−7.14‰/100 m−8.5‰/100 m
δ18O-distance−6.84‰/100 km−2.37‰/100 km−2.20‰/100 km
δ18O- altitude−0.75‰/100 m−0.93‰/100 m−1.1‰/100 m
d-excess-distance0.53‰/100 km-1.31‰/100 km
d-excess-altitude0.03‰/100 m-0.6‰/100 m
d-excess variation range−4.47‰–4.97‰−3.38‰–15.12‰2.47‰–39.74‰
Table 9. Mean, maximum, minimum, and standard deviation (σ) of δD, δ18O, and d-excess values in the LHA006 and LGB69 snow pits.
SiteLHA006LGB69
MeanMaximumMinimumσMeanMaximumMinimumσ
(‰)
δD−143.36−121.15−178.1916.47−244.71−200.27−302.0927.22
δ18O−18.33−15.04−23.262.10−30.91−25.04−37.963.22
d-excess3.3210.88−1.252.532.569.33−6.643.59
Sample number49 *89 *
* One sample was lost from the LHA006 and LGB69 snow pits.
Publisher’s Note: MDPI stays neutral with regard to jurisdictional claims in published maps and institutional affiliations.

