
The Impact of Atmospheric Pollutants on Human Health and Economic Loss Assessment
by

Houli Zhang
1, 
Shibing You
1,*,
Miao Zhang
1,
Difei Liu
1,
Xuyan Wang
2,
Jingru Ren
3 and
Chuanhua Yu
4,* 1
Economics and Management School, Wuhan University, Wuhan 430072, China
2
Union Hospital, Tongji Medical College, Huazhong University of Science and Technology, Wuhan 430022, China
3
Shenzhen Institute of Information Technology, Shenzhen 518172, China
4
Department of Epidemiology and Health Statistics, School of Health Sciences, Wuhan University, Wuhan 430071, China
*
Authors to whom correspondence should be addressed.
Atmosphere 2021, 12(12), 1628; https://doi.org/10.3390/atmos12121628
Submission received: 28 September 2021
/
Revised: 1 December 2021
/
Accepted: 3 December 2021
/
Published: 6 December 2021
(This article belongs to the Special Issue Advanced Climate Simulation and Observation)
Abstract
:The impact of air pollution on human health is becoming increasingly severe, and economic losses are a significant impediment to economic and social development. This paper investigates the impact of air pollutants on the respiratory system and its action mechanism by using information on inpatients with respiratory diseases from two IIIA (highest) hospitals in Wuhan from 2015 to 2019, information on air pollutants, and meteorological data, as well as relevant demographic and economic data in China. This paper describes the specific conditions of air pollutant concentrations and respiratory diseases, quantifies the degree of correlation between the two, and then provides a more comprehensive assessment of the economic losses using descriptive statistical methods, the generalized additive model (GAM), cost of illness approach (COI), and scenario analysis. According to the findings, the economic losses caused by PM2.5, PM10, SO2, NO2, and CO exposure are USD 103.17 million, USD 70.54 million, USD 98.02 million, USD 40.35 million, and USD 142.38 million, for a total of USD 454.46 billion, or approximately 0.20% of Wuhan’s GDP in 2019. If the government tightens control of major air pollutants and meets the WHO-recommended criterion values, the annual evitable economic losses would be approximately USD 69.4 million or approximately 0.03% of Wuhan’s GDP in 2019. As a result, the relevant government departments must strengthen air pollution control to mitigate the impact of air pollution on population health and the associated economic losses.
1. Introduction
Air pollution, also known as atmospheric pollution, is defined by the International Standardization Organization (ISO) as the entry of certain substances into the atmosphere as a result of human activities or natural processes that present a sufficient concentration for a sufficient period and, thus, endanger human comfort, health, and welfare and the environment. The primary sources of air pollutants are industrial production, home furnaces, heating boilers, transportation, and smoke from forest fires. The six common categories of pollutants are fine particulate matter (PM2.5), inhalable particulate matter (PM10), sulfur dioxide (SO2), nitrogen dioxide (NO2), ozone (O3) and carbon monoxide (CO). These six significant pollutants are known as “criteria pollutants”. National ambient air quality standards have been set. Air quality is often evaluated using the Air Quality Index (AQI), a dimensionless index describing the overall condition of urban ambient air quality. The AQI takes into account the pollution levels of the six air pollutants, namely, PM2.5, PM10, SO2, NO2, O3, and CO, as specified in the “Technical Regulation on Ambient Air Quality Index (on trial) (HJ633-2012)” [1], with larger AQI values indicating heavier pollution levels. In recent years, health problems caused by air pollution have become increasingly severe and seriously endanger public health, with the burden of disease caused by it rising every year, especially in low-income and middle-income countries. It is estimated that outdoor air pollution exposure caused approximately 4.9 million deaths worldwide in 2017, an increase of 5.8% compared to 2007 [2]. Among the effects on human health, the correlation between air pollution and respiratory diseases is the strongest, with numerous epidemiological and toxicological findings showing that short-term exposure to lowly concentrated air pollutants, continuous exposure to lowly concentrated air pollutants, and acute exposure to highly concentrated air pollutants can cause damage to the respiratory system [3,4,5,6].
Respiratory disease is a common and frequently occurring disease mainly in the trachea, bronchi, lungs, and thorax, with coughing, chest pain, and affected breathing in mild cases and respiratory distress, hypoxia, and even respiratory failure in severe cases. According to a study conducted by the University of Washington’s Institute for Health Metrics and Evaluation (IHME), an estimated 545 million people worldwide suffered from chronic respiratory disease in 2017, a 39.8% increase from 1900, and approximately 3,914,200 people died as a result of chronic respiratory diseases. Chronic respiratory diseases accounted for 7.0% of all deaths worldwide, ranking third after cardiovascular diseases (31.8%) and tumors (17.1%) [5]. According to the analysis of disease burden, the global growth rate of disability-adjusted life years (DALYs) due to chronic respiratory diseases was 14.5% from 2007 to 2017, with 112 million DALYs in 2017, with chronic obstructive pulmonary disease (COPD) as one of the top five leading causes of DALYs worldwide, rising from eighth place in 2007 to fifth place in 2017 [6]. According to data from the China Statistical Yearbook (2021), the mortality rate from respiratory diseases ranked fourth among the major disease mortality rates for both urban and rural residents in China in 2020, at 55.36 per 100,000 residents and 63.64 per 100,000 residents, respectively [7].
Previous studies have demonstrated a strong association between air pollutant exposure and respiratory disease, with air pollutant exposure leading to an increased incidence of respiratory disease and mortality. Studies have demonstrated an increased risk of respiratory disease hospital visits when air concentrations of PM2.5, PM10, SO2, NO2, and CO are elevated [8], and a significant increase in hospital admissions for respiratory disease in children (0–14 years) [9]. Air pollutants have also been associated with respiratory disease deaths, with 25,600, 252,000, 22,300, 57,300, 31,600, and 45,700 deaths attributable to PM2.5, PM2.5-10, SO2, NO2, CO, and O3, respectively, in China [10], and other countries, such as Mexico [11], India [12], and South Korea [13], have also found a link between air pollution and deaths from respiratory diseases. In terms of specific diseases, the more affected respiratory diseases include COPD, asthma, pulmonary infections, and pulmonary tuberculosis. Long-term inhalation of air pollutants reduces pulmonary function in COPD patients, leading to disease progression, more hospital admissions, and higher mortality [14]. For every 10 μg/m3 rise in PM2.5 concentration, years of life lost (YLLs) in COPD increase by 0.91 person-years [15]. Furthermore, COPD visits increased when PM2.5 and PM2.5-10 concentrations increased [16], and there was a substantial positive association between COPD hospital admissions and SO2, NO2, O3, and CO concentrations in the air [17,18]. Air pollution is one of the most important factors contributing to the exacerbation of childhood asthma, especially in Europe and the Caribbean, where the prevalence of asthma is high [19,20]. A prospective cohort study carried out in ten European cities found a link between the onset of asthma symptoms and short-term PM2.5 and PM10 exposure [21]. A strong positive relationship has also been shown between airborne CO concentrations and the number of asthma outpatient visits [22], and NO2 and O3 exposure can influence asthma development and increase the likelihood of hospitalization for asthma [23,24]. When PM2.5 and PM2.5-10 concentrations increased by 10 μg/m3, the excess relative risk (ERR) for upper respiratory infections (URI) and pneumonia increased by 5.40% and 6.37%, respectively, according to a study conducted in China [16]. Most bronchiectasis exacerbations are assumed to be caused by pathogenic infections. However, pathogens can be challenging to identify, and studies have shown that air pollution is a substantial risk factor for bronchiectasis. A study of 432 patients with a clinical diagnosis of bronchiectasis after high-resolution computed tomography (HRCT) found that when PM10 and NO2 concentrations increased by 10 μg/m3, the chance of exacerbation increased by 4.5% and 3.2%, respectively [25]; when CO concentrations increased, the number of outpatient visits for bronchiectasis increased [22]; and when SO2 concentrations increased, it caused an increase in hospital admissions for bronchiectasis [26]. There is also a correlation between air quality and the pathogenesis of pulmonary tuberculosis, with studies linking PM2.5, PM10, NO2, and SO2 exposure to the likelihood of acquiring active pulmonary tuberculosis [27,28], and Korean research found a 1.20-fold rise in tuberculosis detection rates with a substantial delayed effect when PM10 concentrations increased by one standard deviation (5.63 μg/m3) [29].
The available literature has primarily concentrated on studies of air pollution’s health effects on the respiratory system (e.g., mortality, morbidity, and hospital admissions), with little research on air pollution’s economic losses. Therefore, we take the strong association between air pollutant exposure and respiratory disease recognized by the literature mentioned above as the hypothesis of this research. Considering geographical, air pollutant, and climatic characteristics of Wuhan city, based on data from monitoring sites of six major air pollutants and inpatients with respiratory diseases from two IIIA (highest) hospitals in Wuhan, this study assesses the health effects and economic losses attributable to PM2.5, PM10, SO2, NO2, O3, and CO in the population. The study provides a reference for the future assessment of the health effects of air pollution and cost–benefit evaluation for the development of environmental management policies.
2. Materials and Methods
2.1. Sampling Sites and Sample Collection
The city of Wuhan is chosen as the study area in this paper. Wuhan is the largest and only sub-provincial city in central China and the capital of Hubei Province. It has an area of 8494 square kilometers and is located in the eastern half of the Jianghan Plain at longitude 113°41′115°05′ E and latitude 29°58′31°22′ N. With the rapid growth of the economy in recent years, the Wuhan industry scale has expanded, and industrial production not only consumes energy but also emits a large number of pollutants, including particulate matter (PM), sulfur oxides (SO), nitrogen oxides (NO), carbon monoxide (CO), and hydrocarbons; combined with a large number of vehicle emissions, air pollution in Wuhan is more severe and has caused adverse effects on the population’s health.
Three types of data are used in this study to examine the impact of air pollution on the number of hospital admissions for respiratory diseases. The first type is data from the Hospital Information System (HIS) on hospital admissions for respiratory diseases; the second type is data from ambient air pollutant monitoring; and the third type is some meteorological data.
The hospitalization data for respiratory diseases are obtained from the HIS of two IIIA (highest) hospitals in Wuhan, China. This study gathers inpatient cases with respiratory disease between 1 January 2015 and 31 December 2019. The inpatient’s gender, age, date of admission, date of discharge, disease diagnosis, length of stay, and inpatient expenditure are all included in the case information. According to the 10th edition of the International Classification of Diseases (ICD-10), ICD-10 codes for respiratory diseases are J00~J99, J12~J18 for pneumonia, and J40~J99 for chronic obstructive pulmonary disease (COPD). Furthermore, the research object is divided into three age groups: 0–14 years, 15–64 years, and 65+ years, and the cold and warm seasons were divided based on the month of inpatient admission, with the warm season lasting from April to October and the cold season lasting from November to March [30].
The Department of Ecology and Environment of Hubei Province provides data on air pollutant concentrations [31]. This paper collects data on air pollution monitoring in Wuhan City from 1 January 2015 to 31 December 2019, including the concentrations of six major air pollutants: PM2.5, PM10, SO2, NO2, O3, and CO. Except O3, which has a daily maximum 8 h average concentration, PM2.5, PM10, SO2, NO2, and CO are all 24 h average concentrations.
Meteorological information is obtained from the China Meteorological Data website [32]. This article collects data on Wuhan’s average temperature (°C) and relative humidity (%) from 1 January 2015 to 31 December 2019.
2.2. Sample Analysis
2.2.1. Statistical Descriptive Analysis
From 1 January 2015 to 31 December 2019, the daily number of hospital admissions for respiratory diseases, inpatient expenditure, length of stay, and air pollutant concentrations are presented as ; extremum and the percentile are statistically described for the pneumology department of these two IIIA (highest) hospitals. Furthermore, hospital admissions for respiratory diseases are statistically described using frequencies and percentages based on disease subgroups, gender groups, age groups, and season groups.
2.2.2. Time Series Analysis
The data for each period in the time series are the combined result of multiple elements. In this study, the additive model in the time series decomposition method is used to analyze the daily hospital admissions for respiratory diseases and each air pollutant concentration from 1 January 2015 to 31 December 2019, including the long-term trend and seasonal trend and random fluctuation elements. The long-term trend element represents the long-term trend characteristics of the time series, which can be characterized as a continuous upward, continuous downward, or smooth trend during the study period. The seasonal trend element is a cyclical fluctuation influenced by seasonal changes, characterized as a recurring cyclical change every year during the study period; random events usually cause the random fluctuation, and its changes are generally irregular. The expression is shown in Equation (1):
In Equation (1), is the time series, represents the long-term trend, is the seasonal trend, and is the random fluctuation.
2.2.3. Generalized Additive Model
The generalized additive model (GAM) extends the generalized linear model (GLM) and explains the complex non-linear correlation between the independent and dependent variables. GAM is widely used in environmental epidemiology to explore the correlation between air pollutant exposure and disease mortality or morbidity. The occurrence of hospital admission for respiratory disease is a small probability event for the total number of people in an area, and its distribution approximately follows the Poisson distribution. Since the daily hospital admissions for respiratory diseases are tested to have overdispersion, a GAM based on a quasi-Poisson distribution is developed to analyze the effect of six major air pollutants—PM2.5, PM10, SO2, NO2, O3, and CO—on changes in the number of hospital admissions for respiratory diseases. Assuming a log-linear distribution of pollutants and diseases, we use the number of daily hospitalization events as the outcome and the daily average pollutant concentration as the predictor, and we smooth the time trend and meteorological elements, correcting for the weekend effect and the holiday effect. The model is shown in Equation (2):
In Equation (2), represents the expected value of the number of hospital admissions for respiratory diseases on the i-th day, and represents the average concentration of air pollutants on the i-th day. The regression coefficient is calculated using the model. Time is the date variable; MT is the daily mean temperature; RH is the daily mean relative humidity; DOW is the weekend effect (0 = working day, 1 = weekend); and Holiday is the holiday effect (0 = non-statutory holiday and 1 = statutory holiday, both of which are incorporated as factor variables into the model). ns is the natural smooth spline function, and df is its degree of freedom, which was selected to be 4 for the Time variable [17] and 3 for the MT and RH variables [33]. is the intercept.
Previous research has shown that there is a considerable hysteresis effect of ambient air pollutant exposure on population health, which means that daily air pollutant exposure may still impact population health after several days. As a result, the effect on the admission day (Lag0) and the hysteresis effects on the first day (Lag1), second day (Lag2), third day (Lag3), fourth day (Lag4), fifth day (Lag5), sixth day (Lag6), and seventh day (Lag7) are examined. In addition, separate models are developed based on gender groups, age groups (0–14 year group, 15–64 year group, and 65+ year group), season groups (cold season, warm season), and disease subgroups (pneumonia, COPD) to examine the associations between each air pollutant and the number of hospital admissions for respiratory diseases on the admission day and lag days.
The following Equation (3) is used to calculate the percentage change (PC) in the number of hospital admissions for respiratory diseases and its 95% confidence interval (CI) for each 10 g/m3 increment in air pollutant concentration:
In Equation (3), refers to the regression coefficient of each air pollutant derived from Equation (2).
2.3. Methodology of Economic Loss Assessment—Attributable Risk and Cost of Illness Approach
Attributable fraction (AF) and attributable number (AN) are the fundamental indicators of attributable risk (AR). In this study, AN represents the number of excessive hospital admissions due to air pollutant exposure; AF represents the proportion of excessive hospital admissions due to air pollutant exposure to the total number of hospital admissions. It may alternatively be understood as the proportion of the equivalent reduction in hospital admissions to the overall number of hospital admissions if the population is exposed to air pollution concentrations below a health-affecting threshold level [7]. Both are computed using past research, as indicated in Equations (4) and (5).
In Equation (4), AF refers to attributable fraction; is the regression coefficient of each air pollutant derived from Equation (2); is the average concentration of each air pollutant on the i-th day; refers to a threshold concentration of each air pollutant. Existing studies do not provide evidence for a defined threshold concentration in the exposure–response relationship between air pollutant concentrations and health effects [9]. Threshold concentrations for the acute health effects of O3, PM10, SO2, and NO2 exposure have also not been determined. As a result, a threshold concentration of 0 is used for each air pollutant in this investigation.
In Equation (5), AN refers to the attributable number; is the annual resident population in Wuhan from 2015 to 2019, which is 10,607,700, 10,767,200, 10,892,900, 11,081,100, and 12,210,000, respectively. refers to the hospital admission rate for respiratory diseases. Because the data particular to Wuhan are unavailable, the 2017 hospital admission rate for respiratory diseases in China is utilized universally, which is 810.22 per 100,000 people [10].
According to Kennelly and Zhang’s relevant research [34,35], the cost of illness (COI) approach is used to assess the economic losses of hospital admission for respiratory diseases caused by air pollutant exposure. COI considers the direct inpatient expenditure for hospital admissions (the direct cost of the illness) and the losses of productivity caused by hospital admissions (indirect cost of the illness). Daily per capita gross domestic product (PGDP) is utilized in Wuhan instead of the daily per capita productivity losses [35]. Economic losses are calculated using Equations (6) and (7):
In Equation (6), is the economic losses of an individual inpatient with respiratory disease. The term refers to the average inpatient expenditure for respiratory disease. The term refers to the daily GDP per capita of Wuhan city. The daily GDP per capita in Wuhan in 2015, 2016, 2017, 2018, and 2019 is USD 56.61, USD 53.51, USD 55.24, USD 59.18, USD 57.46, respectively, using the 2019 Gross Domestic Product (GDP) index as the base period and deflating the daily GDP per capita from 2015 to 2018 (see Table 1). In Equation (7), is the overall economic losses, and AN is the attributable number of inpatients.
The GDP indicator is a relative number reflecting the trend and extent of changes in GDP over a certain period of time. The GDP indicator is calculated at constant prices, and this paper uses 1978 as the basic period to calculate the GDP indicator for 2015–2019. Based on the GDP indicator, we calculate the GDP deflator for 2015–2019 with 2019 as the price basic period and adjust nominal GDP to real GDP for the corresponding year, which eliminates the effect of price volatility on GDP per capita.
Furthermore, it is assumed that air pollutant concentrations could be kept reasonably low during the research period, and the evitable economic losses are calculated using Equations (4)–(7).
3. Results
3.1. Statistical Description of Admission Data for Respiratory Diseases and Air Pollution Concentrations
A total of 45,699 inpatients with respiratory diseases were included in the study, that is, 27,725 male inpatients (60.67%) and 17,974 female inpatients (39.33%). According to the analysis of the number of respiratory inpatients in different age groups, nearly half of the inpatients were aged 65 and above, accounting for 44.42% (20,285 cases), while the inpatients in the 0–14 years old and 15–64 years old groups accounted for 18.26% (8340 cases) and 37.39% (17,074 cases), respectively. In the patients with respiratory diseases, pneumonia and chronic obstructive pulmonary disease (COPD) were the majority, among which 10,724 patients with pneumonia (23.47%) and 11,517 patients with COPD (25.20%) were hospitalized. The total proportion of the two was 48.67%. Table 2 shows the results.
According to the gender and age distribution of inpatient hospital admissions with respiratory diseases, the findings of this paper show that males predominate among inpatients with pneumonia and COPD, accounting for 56.13% and 70.83%, respectively; when the age groups are examined, more inpatients with pneumonia are aged 0–14 years and 65+ years, accounting for 32.94% and 39.08%, respectively. See Table 3 for further information.
3.1.1. Characteristics of Numbers of Hospital Admissions for Respiratory Diseases
An analysis of the daily number of hospital admissions for respiratory diseases in this article indicates that the average daily number of hospital admissions is 25.05 people; when particular types of diseases are examined, the average daily number of hospital admissions is 5.87 people for pneumonia and 6.31 people for COPD. Males have a greater average daily number of hospital admissions than females, with 15.18 people for the former and 9.84 people for the latter. The average daily number of hospital admissions rises with age. The 65+ age group has the greatest average daily number of hospital admissions (11.11 people), followed by the 15–64 age group (9.41 people) and the 0–14 age group (4.62 people). According to a season analysis, the average daily hospital admissions in the warm and cold seasons are 25.58 and 24.52, respectively. Table 4 shows the results.
A time series decomposition analysis of hospital admissions from 2015 to 2019 indicates an increasing tendency in the number of day-to-day hospital admissions for respiratory diseases, with significant seasonal fluctuations, with more admissions in winter and spring and fewer in summer and fall. Long-term trends and seasonal fluctuations in the number of daily hospital admissions for pneumonia and COPD are broadly consistent with the patterns observed in the disease-specific analysis for all respiratory diseases.
3.1.2. Characteristics of Inpatient Expenditure for Respiratory Diseases
In order to eliminate the impact of price fluctuations on the inpatient expenditures of respiratory diseases, the price deflator is applied to the inpatient expenditures from 2015 to 2018 based on the Consumer Price Index (CPI) published on the official website of the National Bureau of Statistics [36], using the CPI of 2019 as the base period. The CPI deflators for 2015–2019 are calculated to be 1.089, 1.067, 1.051, 1.029, and 1.000, respectively.
This study looked at the inpatient expenditures for respiratory diseases and discovered that the median of inpatient expenditures is USD 1334.18. When particular disease categories were examined, inpatient expenditures for pneumonia were lower than those for COPD, with the former having a median of USD 1131.18 and the latter having a median of USD 1486.65. Males had greater inpatient expenditures than that of females, with a median of USD 1488 and USD 1162.77, respectively. The higher the age, the higher the inpatient expenditures. The 65+ age group had the greatest inpatient expenditures, with a median of USD 1843.32, followed by the 15–64 age group, with a median of USD 1296.84, and the 0–14 age group, with a median of USD 622.33. The examination of inpatient expenditures by season revealed that the median was greater for inpatients in the cold season than for those in the warm season, with the former costing USD 2200.55 and the latter costing USD 1613.34. See Table 5 for further information.
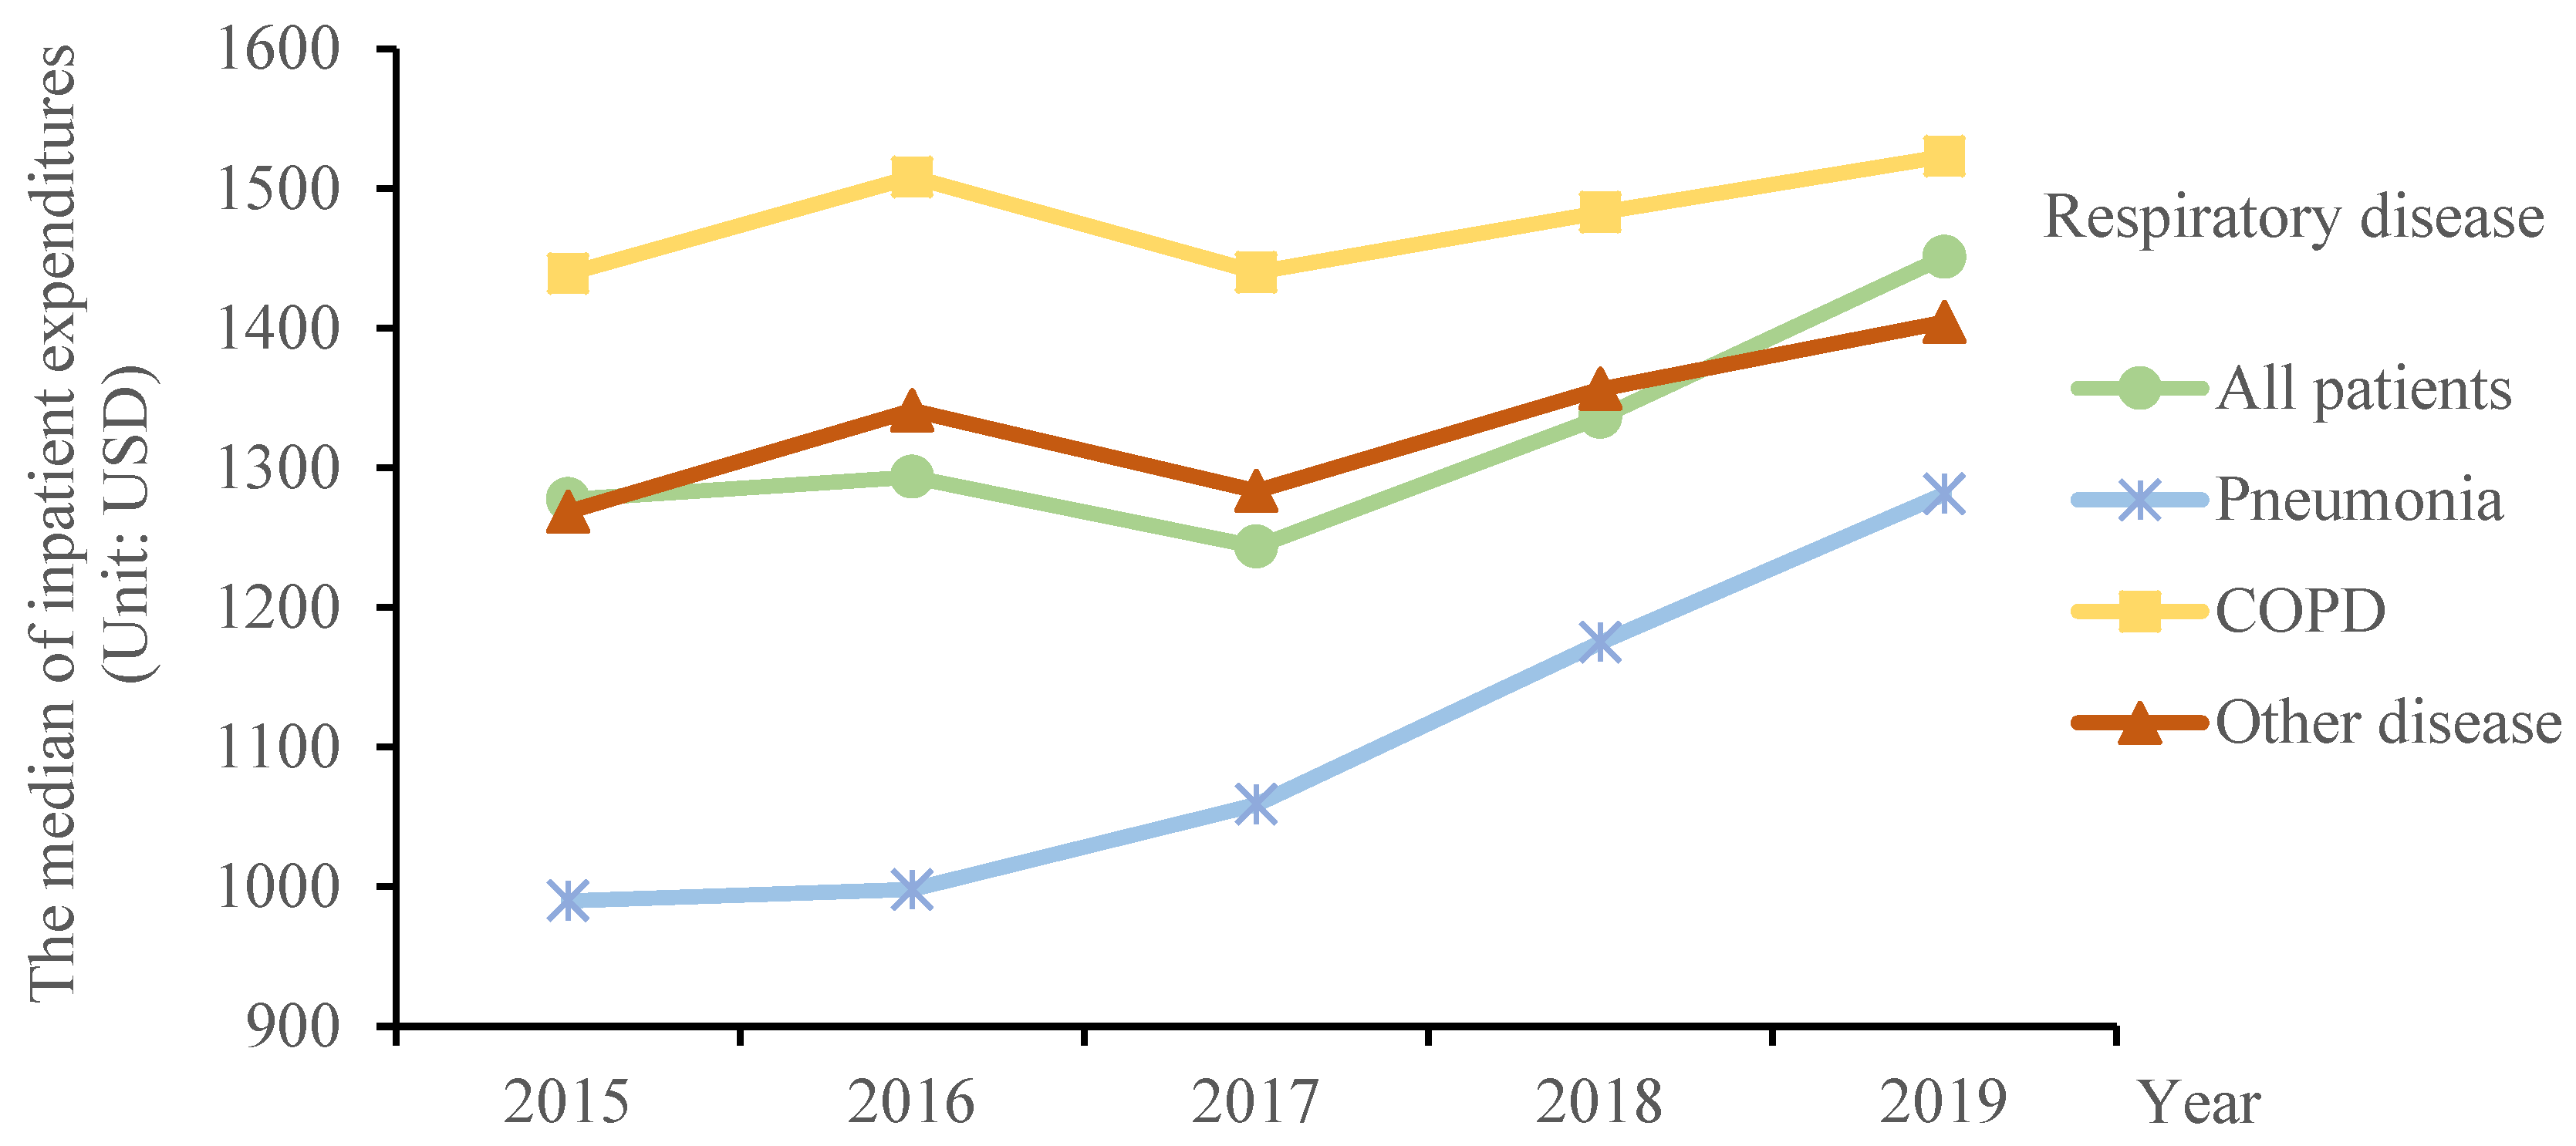
An examination of inpatient expenditures by year from 2015 to 2019 reveals an upward trend for inpatients with respiratory diseases, with the greatest inpatient expenditure in 2019 at a median of USD 1451.05 and the lowest inpatient expenditure in 2015 at a median of USD 1277.43. Analysis of specific diseases revealed an upward trend in inpatient expenditures for inpatients suffering from pneumonia and COPD, with the median for pneumonia inpatients rising from USD 989.86 in 2015 to USD 1281.29 in 2019, and the median for COPD inpatients rising from USD 1439.08 in 2015 to USD 1523.13 in 2019. Figure 1 shows one example of this.
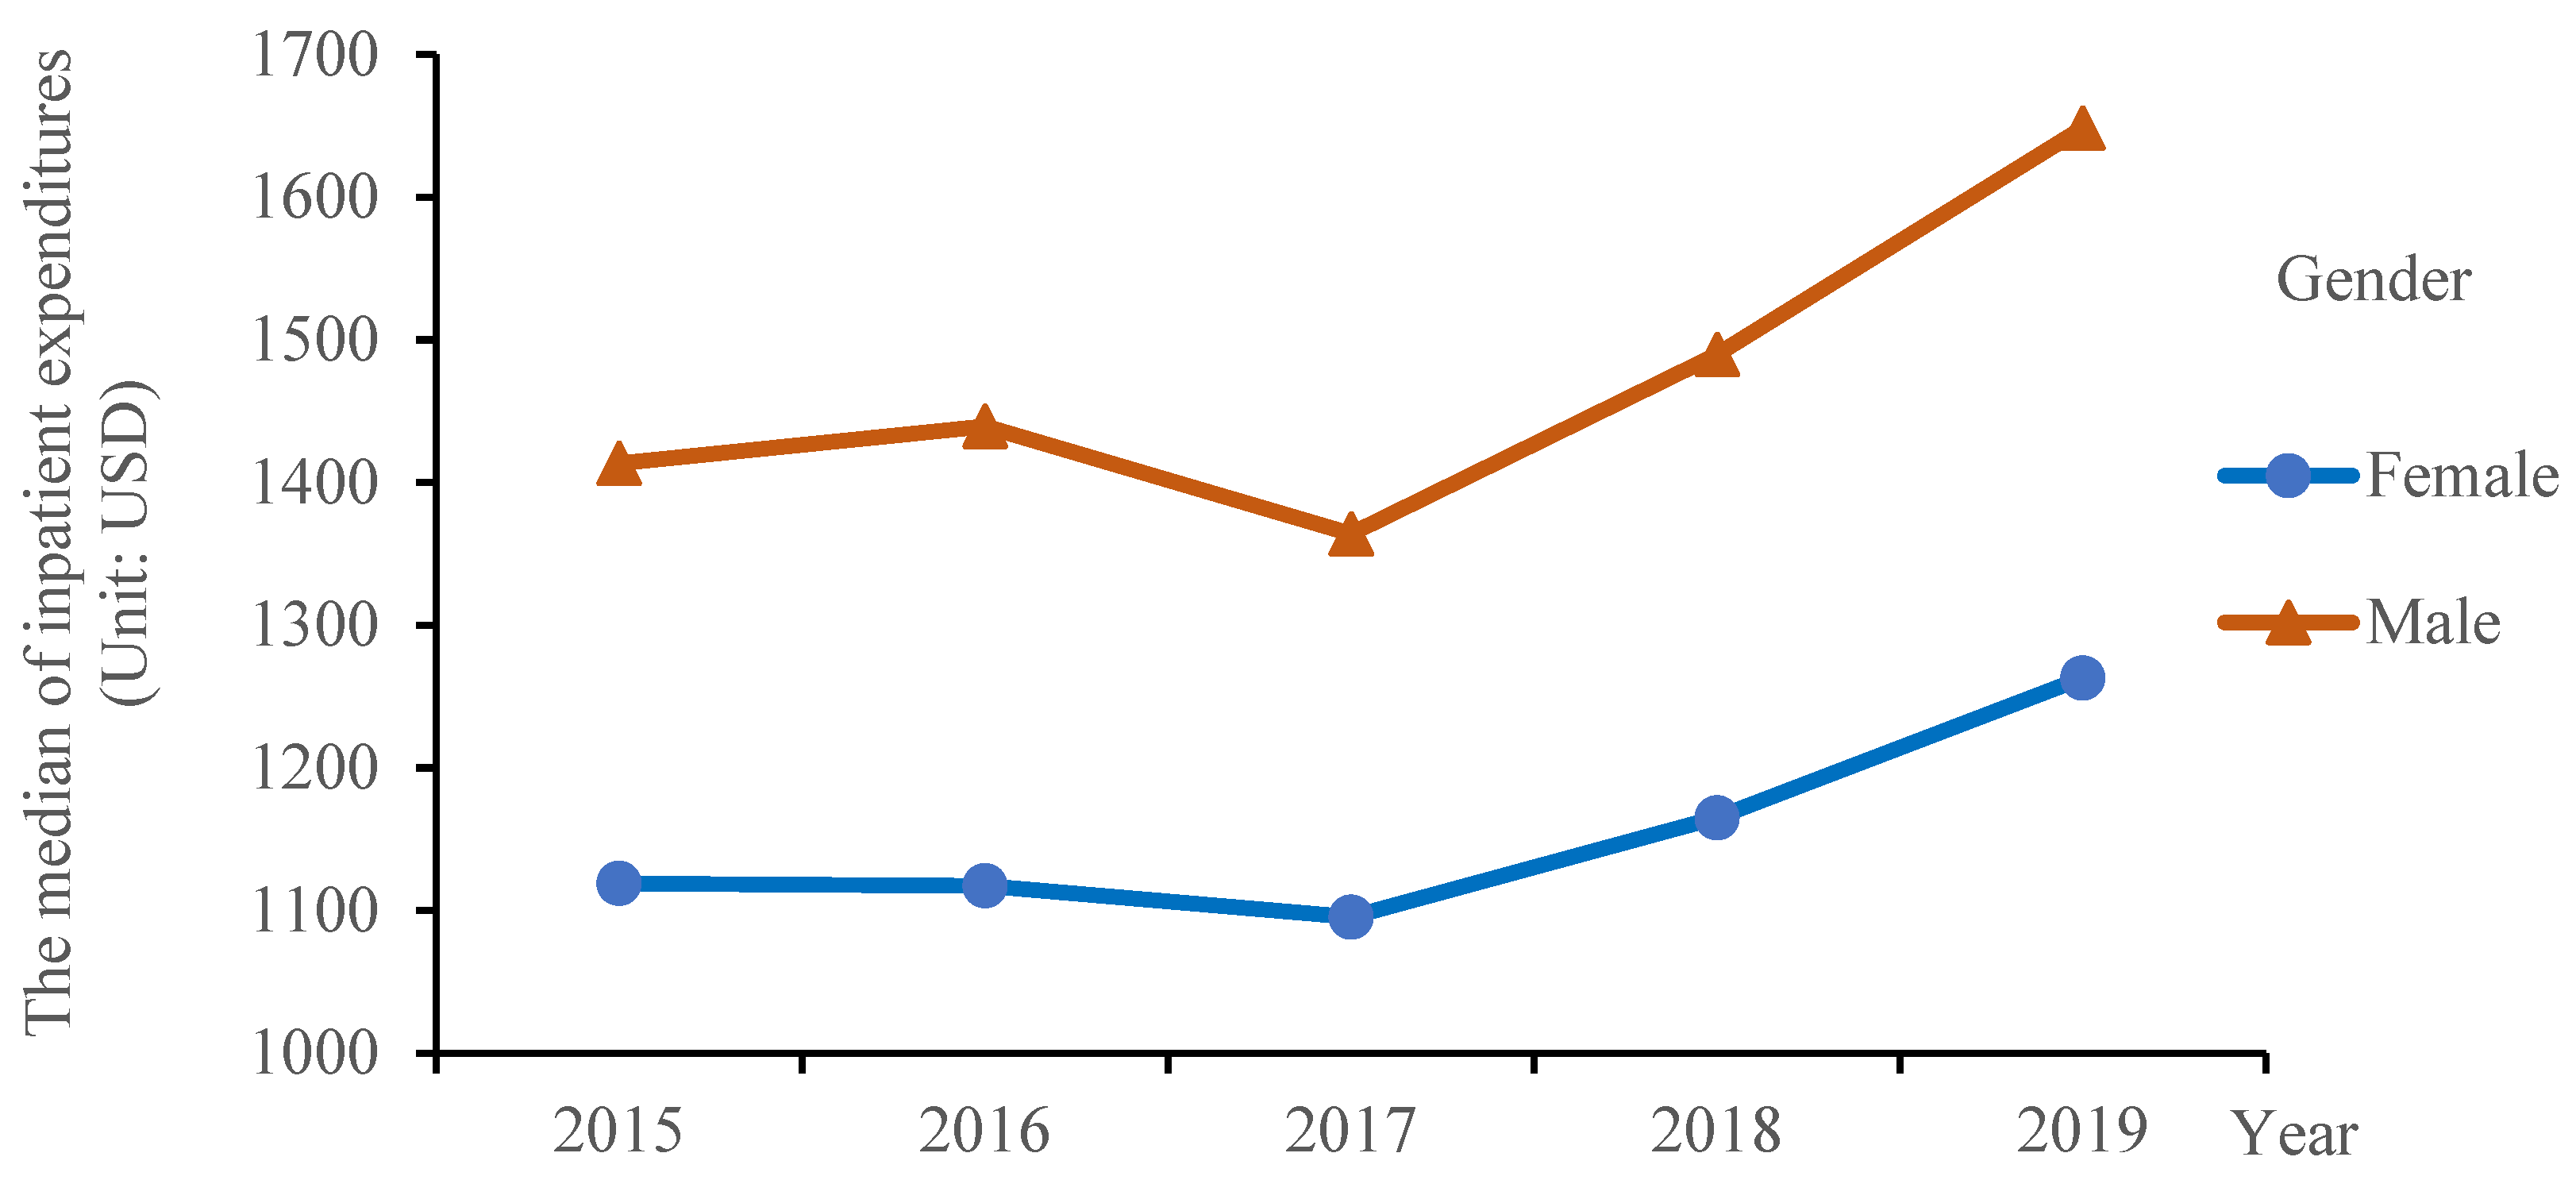
We analyze inpatient expenditure trends by gender from 2015 to 2019 and reveal an upward tendency for both male and female inpatients. Male inpatients’ median of inpatient expenditure trend grows from USD 1413.52 in 2015 to USD 1648.57 in 2019; female inpatients’ median of inpatient expenditure increases from USD 1119.02 in 2015 to USD 1263.08 in 2019. Figure 2 shows an example of this.
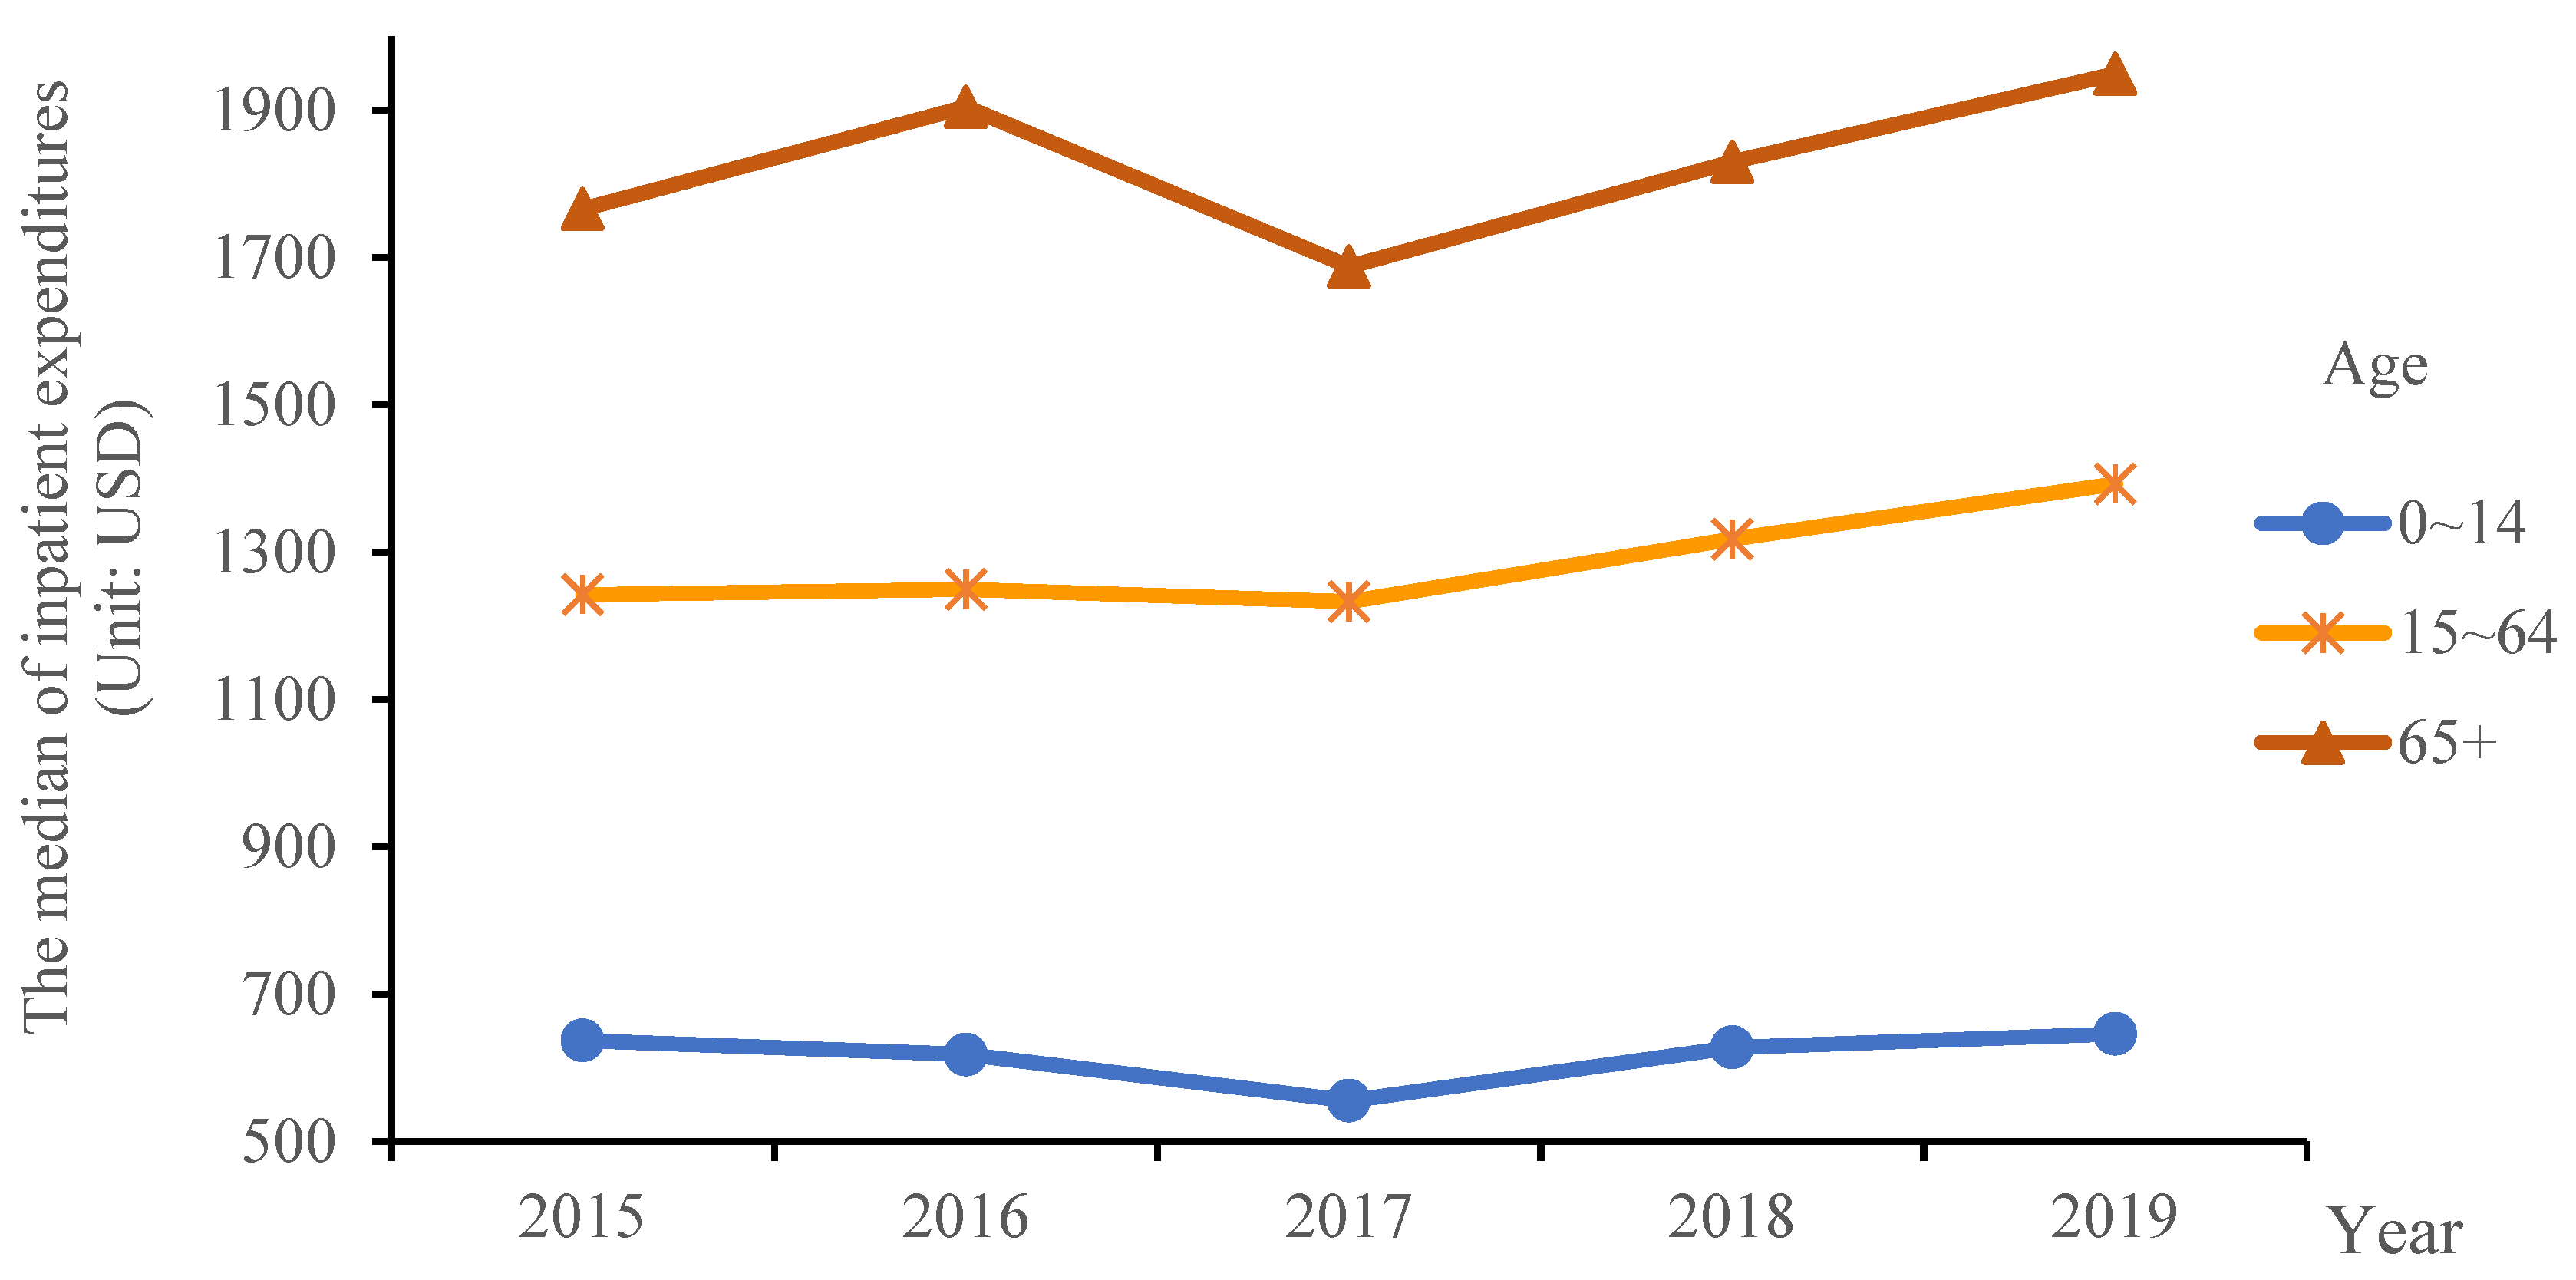
The analysis of the trend of inpatient expenditures by age from 2015 to 2019 revealed that the trend of inpatient expenditure for the 0–14 year group is insignificant during the study period; inpatient expenditure for the 15–64 year group shows an increasing trend, with the median expenditure increasing from USD 1242.28 in 2015 to USD 1392.6 in 2019. In contrast, expenditure for the 65+ age group varies, the median remains continuously over USD 1500, reaching a low of USD 1765.87 in 2015 and climbing to USD 1829.59 and USD 1949.25 in 2018 and 2019, respectively. Figure 3 shows an example of this.
3.1.3. Characteristics of Length of Stay for Respiratory Diseases
A study of the length of stay in hospital of inpatients with respiratory illnesses reveals a median of 9 days. In the disease-specific study, COPD patients have a greater median number of hospital days (10 days) than that of pneumonia inpatients (8 days). Males spend more time in the hospital than females, with a median stay of 9 days for the former and 8 days for the latter. The median number of hospital days increases with age, with the 65+ age group having the most, with a median of 11 days, and the 15–64 and 0–14 age groups having a median of 8 days and 5 days, respectively. According to an analysis of the length of stay by season, the median number of length of stay for inpatients hospitalized in both the cold and hot seasons is 9 days. Table 6 shows the detailed information.
3.1.4. Characteristics of Changes in Air Pollutants
The average concentrations of pollutants in Wuhan from 2015 to 2019 are as follows: PM2.5, 54.07 μg/m3; PM10, 87.32 μg/m3; SO2, 11.24 μg/m3; NO2, 44.97 μg/m3; O3, 92.83 μg/m3; and CO, 1.020 mg/m3, with SO2, O3, and CO meeting the national level one standard (the annual average concentration of SO2: 15 μg/m3; the maximum daily 8 h average concentration of O3: 100 μg/m3; and the 24 h average concentration of CO: 4 mg/m3), while PM2.5, PM10, and NO2 exceeded the national level two standard (annual average concentration of PM2.5: 35 μg/m3; the annual average concentration of PM10: 70 μg/m3; the annual average concentration of NO2: 40 μg/m3) (see Table 7). The country has set corresponding ambient air quality standards for these six categories of air pollutants. According to the revised Ambient Air Quality Standards (GB3095-2012) in 2012, the annual average values of the primary air quality standards for PM2.5, PM10, SO2, NO2, O3, and CO, are 15 μg/m3, 40 μg/m3, 20 μg/m3, 40 μg/m3, 100 μg/m3, and 4 mg/m3, respectively, where higher levels indicate higher pollution levels as shown in Table 8. The number of days in Wuhan when the daily average concentration of pollutants did not meet the national level one standard accounted for 65.93% for PM2.5, 77.60% for PM10, 5.70% for NO2, and 35.21% for O3, and the number of days when the daily average concentration of pollutants did not meet the national level two standard accounted for 19.82% for PM2.5, 9.20% for PM10, 5.70% for NO2, 13.53% for O3 of the total.
3.2. Quantitative Analysis of the Impact of Air Pollutants on Hospital Admissions for Respiratory Diseases
In this study, a generalized additive model (GAM) is developed for each air pollutant and the number of hospital admissions for respiratory diseases. Except for O3, the results show that the daily average concentrations of PM2.5, PM10, SO2, NO2, and CO have an association with hospital admissions for respiratory disease, with PM2.5, PM10, SO2, and CO all having the strongest hysteresis effect on the seventh day (Lag7), while NO2 has the strongest hysteresis effect at Lag6. For PM2.5, PM10, SO2, and CO concentration rises by 10 μg/m3, the number of hospital admissions for respiratory disease increases by 0.90% (95% CI: 0.47, 1.32), 0.60% (0.18, 1.02), 0.49% (0.07, 0.90), 0.47% (0.05, 0.88), 0.98% (0.56, 1.39), and 1.71% (1.29, 2.12).
PM10 only has a hysteresis effect on hospital admissions for respiratory disease at Lag7. This shows that hospital admissions with an increase of 0.71% (0.45, 0.97) are associated with each 10 μg/m3 increment of PM10 concentration. With each 10 μg/m3 increment of SO2 concentration at Lag1, Lag2, Lag3, Lag4, Lag6, and Lag7, hospital admissions for respiratory diseases increase by 5.80% (3.33, 8.33), 6.86% (4.39, 9.40), and 7.80% (5.30, 10.36). At Lag6 and Lag7, NO2 and CO have a hysteresis effect on the number of hospital admissions for respiratory disease. This shows that hospital admissions with an increase of 0.76% (0.13, 1.40) and 0.74% (0.10, 1.39) are associated with each 10 μg/m3 increment of NO2 concentration, and hospital admissions with an increase of 0.07% (0.08, 0.19) and 0.13% (0.08, 0.19) are associated with each 10 μg/m3 increment of CO concentration.
Inpatients are divided into two groups based on whether they have pneumonia or COPD, and there is a difference in the association of hospitalization due to air pollutants between the two groups. Inpatients with pneumonia are more susceptible to PM2.5, PM10, SO2, NO2, and O3, in addition to CO. The average daily concentrations of PM2.5, PM10, SO2, NO2, and O3 have a correlation with pneumonia hospital admissions, with PM2.5 having an influence on pneumonia hospital admissions at Lag1, Lag2, Lag5, Lag6, and Lag7, with the biggest hysteresis effect at Lag7.
With each 10 μg/m3 increment of PM2.5 concentration, hospital admission increases by 2.11% (1.23, 2.98). SO2 influences pneumonia hospital admissions at Lag1, Lag3, Lag4, Lag6, and Lag7, with the biggest hysteresis effect at Lag7. With each 10 μg/m3 increment of SO2 concentration, hospital admission increases by 13.33% (7.78, 19.16). NO2 influences the pneumonia hospital admissions at Lag6 and Lag7, with the biggest hysteresis effect at Lag6. With each 10 μg/m3 increment of NO2 concentration, hospital admissions increase by 2.0% (0.69, 3.33). PM10 and O3 only have a hysteresis effect on pneumonia hospital admissions at a single lag day. With each 10 μg/m3 increment of PM10 concentration at Lag7, hospital admissions increase by 0.82% (0.30, 1.35). With each 10 μg/m3 increment of O3 concentration at Lag1, hospital admissions increase by 0.78% (0.04, 1.52). The analysis result of COPD shows that only the average daily concentrations of PM2.5, SO2, and CO have a relationship with COPD hospital admissions. PM2.5 influences the COPD hospital admissions at Lag1 and Lag7, with the biggest hysteresis effect at Lag7. With each 10 μg/m3 increment of PM2.5 concentration, hospital admission increases by 1.9% (1.12, 2.69). SO2 influences the COPD hospital admissions at Lag1, Lag2, and Lag7, with the biggest hysteresis effect at Lag1. With each 10 μg/m3 increment of SO2 concentration, hospital admission increases by 6.50% (1.93, 11.27). CO only influences the COPD hospital admissions at Lag7. With each 10 μg/m3 increment of CO concentration, hospital admission increases by 0.19% (0.08, 0.30).
Similar to the categorization of disease type, this research develops the GAM of each air pollutant and the number of hospital admission for respiratory disease by gender, age, and season. The analysis results reveal gender disparities in the risk of hospital admissions for respiratory disease due to air pollutants, with males bearing a more significant effect; i.e., the percentage change in the number of hospital admissions for respiratory disease due to air pollution is more significant for males. There were age differences in the risk of hospital admissions for respiratory diseases caused by air pollutants, with PM2.5, PM10, SO2, and NO2 having a more significant effect on people aged 0–14 years, while O3 and CO had a more significant effect on people aged 65+ years. The risk of hospitalization for respiratory diseases caused by air pollution was seasonally related, with PM2.5, PM10, O3, and CO having a sizable effect during the summer.
3.3. Assessment of Economic Losses
3.3.1. Analysis Results of Attributable Risk
To make the results easier to understand, attributable analysis is applied for each air pollutant to determine the lag day with the greatest hysteresis effect (i.e., the biggest regression coefficient calculated by the GAM) on hospital admissions for respiratory disease. Table 9 shows the lag days with the greatest hysteresis effect of each air pollutant, as well as their regression coefficients (). Lag1–Lag7 in the table represent the hysteresis effects of each air pollutant on the first day (Lag1), second day (Lag2), third day (Lag3), fourth day (Lag4), fifth day (Lag5), sixth day (Lag6), and seventh day (Lag7) of hospital admissions.
Air pollutant exposure has a negative impact on the population’s respiratory health. Our research shows the attributable fractions, which represent the proportion of excessive hospital admissions due to air pollutant (PM2.5, PM10, SO2, NO2, and CO) exposure to the total number of hospital admissions, are 8.50%, 5.81%, 8.80%, 3.33%, and 11.73%, respectively. Based on the attributable fraction, further estimation shows that the number of hospital admissions for respiratory diseases attributable to PM2.5, PM10, SO2, NO2, and CO exposure is 37,600, 25,700, 35,700, 14,700, and 51,800, respectively. The attributable risk differed by disease subgroups, gender groups, and age groups; for example, more males than females are hospitalized for respiratory disease due to PM2.5, 22,800 for the former and 14,800 for the latter with attributable fractions of 9.70% and 6.50%, respectively. The number of hospital admissions for respiratory diseases due to PM10 rose with age, with 5700 cases (ages 0–14), 7500 cases (15–64), and 12,600 cases (65+) with attributable fractions of 6.98%, 4.55%, and 6.40%, respectively. SO2 caused more hospital admissions for pneumonia (12,300 cases) than COPD (7600 cases), with attributable fractions of 11.84% and 6.81%, respectively. See Table 10 for details.
3.3.2. Results of Economic Loss Assessment
Hospital admission for respiratory diseases due to air pollutant exposure causes economic losses to both society and individuals. According to the analysis in this paper, the per capita economic losses of inpatient expenditure is approximately USD 2746.35, and the economic losses attributable to PM2.5, PM10, SO2, NO2, and CO exposure are USD 103.17 million, USD 70.54 million, USD 98.02 million, USD 40.35 million, and USD 142.38 million, respectively, accounting for approximately 0.20% of Wuhan’s GDP in 2019. As demonstrated in Table 11, the economic losses from hospital admissions due to air pollution differed by disease subgroups, gender groups, and age groups.
4. Discussion and Conclusions
The main conclusions and discussion from the study and analysis are as follows:
The frequency of respiratory hospitalizations in Wuhan has increased in recent years, and there is a link between changes in respiratory hospitalizations and exposure to the air pollutants PM2.5, PM10, SO2, NO2, O3, and CO, particularly in those with pneumonia, males, and those aged 0–14 years. Furthermore, respiratory hospitalization caused by air pollution results in certain economic losses and burdens society and individuals financially. As a result, relevant government departments should be urged to improve air pollution management to reduce the impact of air pollution on population health and associated economic losses, hence improving health benefits and economic advantages.
Based on the quantitative analysis of the impact on hospital admissions for respiratory diseases due to air pollution, this paper found that the total economic losses on hospital admission for respiratory disease due to air pollution in Wuhan during the study period were USD 454.46 million, accounting for approximately 0.20% of Wuhan’s GDP in 2019. PM2.5, SO2, and CO generate far greater economic losses than PM10, NO2, and O3. As a result, the government should step up its prevention and control measures for PM2.5, SO2, and CO.
We may examine the essential scenario analysis of the economic losses of the impact of air pollution on human health based on the aforementioned findings. Assuming that the daily concentrations of PM2.5, PM10, SO2, NO2, O3, and CO are at a relatively low level in Wuhan from 2015 to 2019, four scenarios are presented for keeping these six types of air pollutants at relatively low levels, and the evitable economic losses under different scenarios are further assessed. The scenario analysis findings are presented in the table below. In the best-case scenario, assuming that PM2.5 and PM10 concentrations during the study period are within the WHO-recommended criterion values (annual average PM2.5 concentration: 10 μg/m3, and annual average PM10 concentration: 20 μg/m3), the annual evitable economic losses would be USD 16.88 million and USD 10.88, respectively. If the average SO2 concentration limits are 4 μg/m3, 6 μg/m3, 8 μg/m3, and 10 μg/m3 over the research period, the annual evitable economic losses would be USD 12.45 million, USD 8.73 million, USD 5.01 million, and USD 1.14 million, respectively. If the average NO2 concentration limits are 10 μg/m3, 20 μg/m3, 30 μg/m3, and 40 μg/m3 over the research period, the annual evitable economic losses would be USD 6.3 million, USD 4.44 million, USD 2.72 million, and USD 0.86 million, respectively. The study revealed a significant association between O3 exposure and hospital admissions for pneumonia inpatients, male inpatients, and inpatients aged 65+ years with respiratory disease, with O3 having the highest impact on hospital admissions for male respiratory inpatients. If the average O3 concentration limits are 20 μg/m3, 40 μg/m3, 60 μg/m3, and 80 μg/m3 over the research period, the annual evitable economic losses would be USD 4.87 million, USD 3.43 million, USD 2 million, and USD 0.57 million, respectively. If the average CO concentration limits are 0.25 μg/m3, 0.50 μg/m3, 0.75 μg/m3, and 1.00 μg/m3 over the research period, the annual evitable economic losses would be USD 21.75 million, USD 14.74 million, USD 7.58 million, and USD 0.14 million, respectively. Table 12 shows the detailed findings of the study for the different disease subgroups, gender groups, and age groups for the four scenarios for each pollutant.
Based on the preceding scenario analysis and discussion, it is evident that the health and economic returns of improved air pollution control are considerable to some extent.
This paper’s research methodology is relatively generalizable. When examining the influences of air pollution on human health and calculating economic losses, this research takes Wuhan as an example. As a result, by understanding the number of hospital admissions for respiratory diseases, inpatient expenditure, length of stay, and the general situation and temporal trends of air pollutant concentrations in a given region, it is possible to quantitatively assess the effects of air pollutants on the number of hospital admissions for respiratory diseases and the associated economic losses in that region, which can serve as a benchmark for assessing the health effects of air pollution.
The data for this study came from two IIIA (highest) hospitals in Wuhan, where the hospital information system is well established, ensuring data accuracy. Furthermore, in order to study the respiratory health effects of air pollutants, this study uses the COI to estimate the economic losses associated with air pollution, making the findings more relevant for policy guidance and providing a reference for cost–benefit analysis in formulating air pollution control policies. However, there are several limitations to this research. The study relies on air pollutant concentration data from fixed location monitoring stations rather than individual air pollutant exposure, and it excludes other personal data, such as lifestyle, socioeconomic status, and comorbidities, which could give bias to effect estimation. Future studies should focus on obtaining individual exposure data and incorporating questionnaires to obtain more personal information to assess the respiratory impacts of air pollution more accurately. Second, data from hospitals on respiratory inpatients include both unintentional and purposeful admissions. In the future, more data on patient hospitalization should be collected, with some planned inpatients eliminated and only the number of unintentional inpatients included for model fitting, resulting in more scientifically valid findings.
Author Contributions
Conceptualization, S.Y. and H.Z.; methodology, S.Y. and C.Y.; software, X.W. and J.R.; validation, H.Z.; formal analysis, M.Z.; investigation, C.Y.; resources, H.Z. and D.L.; data curation, D.L.; writing—original draft preparation, H.Z. and M.Z.; writing—review and editing, M.Z.; visualization, H.Z. and M.Z.; supervision, S.Y.; project administration, S.Y. All authors have read and agreed to the published version of the manuscript.
Funding
This research received no external funding.
Institutional Review Board Statement
Not applicable.
Informed Consent Statement
Not applicable.
Data Availability Statement
The data on respiratory hospital admissions in the study were obtained from the HIS of two tertiary hospitals in Wuhan. Air pollutant concentration data were obtained from the Hubei Provincial Department of Ecology and Environment.
Conflicts of Interest
The authors declare no conflict of interest.
References
- Technical Regulation on Ambient Air Quality Index (on Trial) (HJ 633—2012). Available online: https://www.mee.gov.cn/ywgz/fgbz/bz/bzwb/jcffbz/201203/t20120302_224166.shtml (accessed on 20 November 2021).
- Stanaway, J.D.; Afshin, A.; Gakidou, E.; Lim, S.S.; Abate, D.; Abate, K.H.; Abbafati, C.; Abbasi, H.; Abbastabar, H.; Abd-Allah, F.; et al. Global, regional, and national comparative risk assessment of 84 behavioural, environmental and occupational, and metabolic risks or clusters of risks for 195 countries and territories, 1990–2017: A systematic analysis for the Global Burden of Disease Study 2017. Lancet 2018, 392, 1923–1994. [Google Scholar] [CrossRef] [Green Version]
- Lamichhane, D.K.; Kim, H.C.; Choi, C.M.; Shin, M.H.; Shim, Y.M.; Leem, J.H.; Ryu, J.S.; Nam, H.S.; Park, S.M. Lung Cancer Risk Resid. Expo. To air pollution: A Korean population-based case-control study. Yonsei Med. J. 2017, 58, 1111–1118. [Google Scholar] [CrossRef]
- Abdo, N.; Khader, Y.S.; Abdelrahman, M.; Graboski-Bauetr, A.; Malkawi, M.; Al-Sharif, M.; Elbetieha, A.M. Respiratory health outcomes and air pollution in the Eastern Mediterranean Region: A systematic review. Rev. Environ. Health 2016, 31, 259–280. [Google Scholar] [CrossRef] [PubMed]
- Soriano, J.B.; Kendrick, P.J.; Paulson, K.R.; Gupta, V.; Abrams, E.M.; Adedoyin, R.A.; Adhikari, T.B.; Advani, S.M.; Agrawal, A.; Ahmadian, E.; et al. Prevalence and attributable health burden of chronic respiratory diseases 1990–2017: A systematic analysis for the Global Burden of Disease Study 2017. Lancet Respir. Med. 2020, 8, 585–596. [Google Scholar] [CrossRef]
- Kyu, H.H.; Abate, D.; Abate, K.H.; Abay, S.M.; Abbafati, C.; Abbasi, N.; Abbastabar, H.; Abd-Allah, F.; Abdela, J.; Abdelalim, A.; et al. Global, regional, and national disability-adjusted life-years (DALYs) for 359 diseases and injuries and healthy life expectancy (HALE) for 195 countries and territories, 1990-2017: A systematic analysis for the Global Burden of Disease Study 2017. Lancet 2018, 392, 1859–1922. [Google Scholar] [CrossRef] [Green Version]
- China Statistic Yearbook 2021. Available online: http://www.stats.gov.cn/tjsj/ndsj/2021/indexch.htm (accessed on 15 September 2021).
- Ma, Y.; Xiao, B.; Liu, C.; Zhao, Y.; Zheng, X. Association between ambient air pollution and emergency room visits for respiratory diseases in spring dust storm season in Lanzhou, China. Int. J. Environ. Res. Public Health 2016, 13, 613. [Google Scholar] [CrossRef]
- Dong, J.; Liu, Y.; Bao, H. Revalue associations of short-term exposure to air pollution with respiratory hospital admissions in Lanzhou, China after the control and treatment of current pollution. Int. J. Hyg. Environ. Health 2021, 231, 113658. [Google Scholar] [CrossRef] [PubMed]
- Yao, M.; Wu, G.; Zhao, X.; Zhang, J. Estimating health burden and economic loss attributable to short-term exposure to multiple air pollutants in China. Environ. Res. 2020, 183, 109184. [Google Scholar] [CrossRef]
- Mamkhezri, J.; Bohara, A.K.; Camargo, A.I. Air pollution and daily mortality in Mexico city Metropolitan area. Atmosfera 2019, 33, 249–267. [Google Scholar] [CrossRef]
- Afghan, F.R.; Patidar, S.K. Health impacts assessment due to PM2.5, PM10 and NO2 exposure in National Capital Territory (NCT). Pollution 2020, 6, 115–126. [Google Scholar] [CrossRef]
- Hwang, J.; Kwon, J.; Yi, H.; Bae, H.-J.; Jang, M.; Kim, N. Association between long-term exposure to air pollutants and cardiopulmonary mortality rates in South Korea. BMC Public Health 2020, 20, 1402–1410. [Google Scholar] [CrossRef]
- Hansel, N.N.; Paulin, L.M.; Gassett, A.J.; Peng, R.D.; Alexis, N.; Fan, V.S.; Bleecker, E.; Bowler, R.; Comellas, A.P.; Dransfield, M.; et al. Design of the Subpopulations and Intermediate Outcome Measures in COPD (SPIROMICS) AIR Study. BMJ Open Respir. Res. 2017, 4, e186. [Google Scholar] [CrossRef]
- Li, G.; Huang, J.; Xu, G.; Pan, X.; Qian, X.; Xu, J.; Zhao, Y.; Zhang, T.; Liu, Q.; Guo, X.; et al. The short-term burden of ambient fine particulate matter on chronic obstructive pulmonary disease in Ningbo, China. Environ. Health 2017, 16, 54. [Google Scholar] [CrossRef] [PubMed] [Green Version]
- Zhang, Z.; Chai, P.; Wang, J.; Ye, Z.; Shen, P.; Lu, H.; Jin, M.; Gu, M.; Li, D.; Lin, H.; et al. Association of particulate matter air pollution and hospital visits for respiratory diseases: A time-series study from China. Environ. Sci. Pollut. Res. Int. 2019, 26, 12280–12287. [Google Scholar] [CrossRef]
- Luo, L.; Zhang, Y.; Jiang, J.; Luan, H.; Yu, C.; Nan, P.; Luo, B.; You, M. Short-Term effects of ambient air pollution on hospitalization for respiratory disease in Taiyuan, China: A time-series analysis. Int. J. Environ. Res. Public Health 2018, 15, 2160. [Google Scholar] [CrossRef] [PubMed] [Green Version]
- Yang, Q.; Chen, Y.; Krewski, D.; Burnett, R.T.; Shi, Y.; McGrail, K.M. Effect of short-term exposure to low levels of gaseous pollutants on chronic obstructive pulmonary disease hospitalizations. Environ. Res. 2005, 99, 99–105. [Google Scholar] [CrossRef]
- Cadelis, G.; Tourres, R.; Molinie, J. Short-Term effects of the particulate pollutants contained in saharan dust on the visits of children to the emergency department due to asthmatic conditions in guadeloupe (French archipelago of the Caribbean). PLoS ONE 2014, 9, e91136. [Google Scholar] [CrossRef] [Green Version]
- Akpinar-Elci, M.; Martin, F.E.; Behr, J.G.; Diaz, R. Saharan dust, climate variability, and asthma in Grenada, the Caribbean. Int. J. Biometeorol. 2015, 59, 1667–1671. [Google Scholar] [CrossRef]
- Guarnieri, M.; Balmes, J.R. Outdoor air pollution and asthma. Lancet 2014, 383, 1581–1592. [Google Scholar] [CrossRef] [Green Version]
- Zhao, Y.; Hu, J.; Tan, Z.; Liu, T.; Zeng, W.; Li, X.; Huang, C.; Wang, S.; Huang, Z.; Ma, W. Ambient carbon monoxide and increased risk of daily hospital outpatient visits for respiratory diseases in Dongguan, China. Sci. Total Environ. 2019, 668, 254–260. [Google Scholar] [CrossRef]
- Moore, K.; Neugebauer, R.; Lurmann, F.; Hall, J.; Brajer, V.; Alcorn, S.; Tager, I. Ambient ozone concentrations cause increased hospitalizations for asthma in children: An 18-year study in southern California. Environ. Health Perspect. 2008, 116, 1063–1070. [Google Scholar] [CrossRef] [Green Version]
- Clark, N.A.; Demers, P.A.; Karr, C.J.; Koehoorn, M.; Lencar, C.; Tamburic, L.; Brauer, M. Effect of early life exposure to air pollution on development of childhood asthma. Environ. Health Perspect. 2010, 118, 284–290. [Google Scholar] [CrossRef] [PubMed] [Green Version]
- Wang, H.; Gao, Z.; Ren, J.; Chang, L.T.-C.; Cheung, K.; Feng, Y.; Li, Y. An urban-rural and sex differences in cancer incidence and mortality and the relationship with PM2.5 exposure: An ecological study in the southeastern side of Hu line. Chemosphere 2019, 216, 766–773. [Google Scholar] [CrossRef] [PubMed]
- Katanoda, K.; Sobue, T.; Satoh, H.; Tajima, K.; Suzuki, T.; Nakatsuka, H.; Takezaki, T.; Nakayama, T.; Nitta, H.; Tanabe, K.; et al. An Association between long-term exposure to ambient air pollution and mortality from lung cancer and respiratory diseases in Japan. J. Epidemiol. 2011, 21, 132–143. [Google Scholar] [CrossRef] [Green Version]
- Nyberg, F.; Gustavsson, P.; Järup, L.; Bellander, T.; Berglind, N.; Jakobsson, R.; Pershagen, G. Urban air pollution and lung cancer in Stockholm. Epidemiology 2000, 11, 487–495. [Google Scholar] [CrossRef]
- Nsoh, M.; Mankollo, B.O.Y.; Ebongue, M.; Cyprien, K.N.; Likeng, J.L.N.; Islam, S.M.S.; Collier, A.; Tsoka-Gwegweni, J.M.; Cumber, S.N. Acute respiratory infection related to air pollution in Bamenda, North West Region of Cameroon. Pan. Afr. Med. J. 2019, 32, 1–8. [Google Scholar] [CrossRef]
- Zheng, P.W.; Wang, J.B.; Zhang, Z.Y.; Shen, P.; Chai, P.-F.; Li, D.; Jin, M.-J.; Tang, M.-L.; Lu, H.-C.; Lin, H.-B.; et al. Air pollution and hospital visits for acute upper and lower respiratory infections among children in Ningbo, China: A time-series analysis. Environ. Sci. Pollut. Res. 2017, 24 (Suppl. 4), 1–10. [Google Scholar] [CrossRef]
- Nhung, N.T.T.; Schindler, C.; Dien, T.M.; Probst-Hensch, N.; Künzli, N. Association of ambient air pollution with lengths of hospital stay for hanoi children with acute lower-respiratory infection, 2007–2016. Environ. Pollut. 2019, 247, 752–762. [Google Scholar] [CrossRef]
- Department of Ecology and Environment of Hubei Province. Available online: http://sthjt.hubei.gov.cn (accessed on 5 September 2021).
- China Meteorological Data Sharing Service System. Available online: http://data.cma.cn (accessed on 8 September 2021).
- Wu, Z.; Chen, X.; Li, G.; Tian, L.; Wang, Z.; Xiong, X.; Yang, C.; Zhou, Z.; Pan, X. Attributable risk and economic cost of hospital admissions for mental disorders due to PM2.5 in Beijing. Sci. Total Environ. 2020, 718, 137274. [Google Scholar] [CrossRef]
- Kennelly, B. How should cost-of-illness studies be interpreted? Lancet Psychiatry 2017, 4, 735–736. [Google Scholar] [CrossRef] [Green Version]
- Zhang, P.; Zhou, X. Health and economic impacts of particulate matter pollution on hospital admissions for mental disorders in Chengdu, Southwestern China. Sci. Total Environ. 2020, 733, 139114. [Google Scholar] [CrossRef] [PubMed]
- National Bureau of Statistics. Available online: http://www.stats.gov.cn/ (accessed on 10 September 2021).
Figure 1.
Trends in inpatient expenditure for respiratory diseases for 2015–2019.

Figure 2.
Trends in inpatient expenditure for different genders for respiratory diseases for 2015–2019.
Figure 2.
Trends in inpatient expenditure for different genders for respiratory diseases for 2015–2019.

Figure 3.
Trends in inpatient expenditure for different ages for respiratory diseases for 2015–2019.
Figure 3.
Trends in inpatient expenditure for different ages for respiratory diseases for 2015–2019.


Table 1.
GDP indicator and GDP deflator in China for 2015–2019.
| Year | GDP Indicator (1978 = 100) | GDP Deflator * |
|---|---|---|
| 2015 | 3035.9 | 1.294 |
| 2016 | 3243.5 | 1.211 |
| 2017 | 3468.8 | 1.133 |
| 2018 | 3703.0 | 1.061 |
| 2019 | 3929.2 | 1.000 |
Note: * The 2019 GDP indicator is used as the basic period.
Table 2.
Basic information for inpatients with respiratory diseases.
| Variable | n (%) |
|---|---|
| Gender | |
| Male | 27,725 (60.67) |
| Female | 17,974 (39.33) |
| Age (years) | |
| 0~14 | 8340 (18.26) |
| 15~64 | 17,074 (37.39) |
| 65+ | 20,285 (44.42) |
| Disease subgroups | |
| Pneumonia | 10,724 (23.47) |
| COPD | 11,517 (25.20) |
| Other diseases | 23,458 (51.33) |
Table 3.
Gender and age distribution of inpatients with respiratory diseases.
| Variable | Pneumonia (n = 10,724) | COPD (n = 11,517) | Others (n = 23,458) | |||
|---|---|---|---|---|---|---|
| Cases | Percentage (%) | Cases | Percentage (%) | Cases | Percentage (%) | |
| Gender | ||||||
| Male | 6019 | 56.13 | 8154 | 70.80 | 13,552 | 57.77 |
| Female | 4705 | 43.87 | 3363 | 29.20 | 9906 | 42.23 |
| Age (years) | ||||||
| 0~14 | 3532 | 32.94 | 0 | 0.00 | 4808 | 20.50 |
| 15~64 | 3001 | 27.98 | 3138 | 27.25 | 10,935 | 46.62 |
| 65+ | 4191 | 39.08 | 8379 | 72.75 | 7715 | 32.89 |
Table 4.
Basic information for the period of 2015–2019 on the number of daily hospital admissions for respiratory diseases.
Table 4.
Basic information for the period of 2015–2019 on the number of daily hospital admissions for respiratory diseases.
| Variable | Min 1 | P25 2 | P50 3 | P75 4 | Max 5 | |
|---|---|---|---|---|---|---|
| All inpatients | 25.05 ± 12.07 | 0 | 16 | 24 | 33 | 77 |
| Disease subgroups | ||||||
| Pneumonia | 5.87 ± 3.87 | 0 | 3 | 5 | 8 | 23 |
| COPD | 6.31 ± 3.57 | 0 | 4 | 6 | 8 | 30 |
| Gender | ||||||
| Male | 15.18 ± 7.84 | 0 | 10 | 15 | 20 | 49 |
| Female | 9.84 ± 5.29 | 0 | 6 | 9 | 13 | 36 |
| Age (years) | ||||||
| 0~14 | 4.62 ± 3.13 | 0 | 2 | 4 | 6 | 20 |
| 15~64 | 9.41 ± 5.34 | 0 | 5 | 8 | 13 | 32 |
| 65+ | 11.11 ± 6.08 | 0 | 7 | 10 | 15 | 53 |
| Season | ||||||
| Cold season | 24.52 ± 13.28 | 0 | 15 | 24 | 33 | 77 |
| Warm season | 25.58 ± 10.74 | 0 | 18 | 25 | 32 | 67 |
1 Minimum; 2 25th percentile; 3 50th percentile (median); 4 75th percentile; 5 maximum.
Table 5.
Basic information for the period of 2015–2019 on the inpatient expenditure for respiratory diseases (unit: USD).
Table 5.
Basic information for the period of 2015–2019 on the inpatient expenditure for respiratory diseases (unit: USD).
| Variable | Min 1 | P25 2 | P50 3 | P75 4 | Max 5 | |
|---|---|---|---|---|---|---|
| All inpatients | 2370.76 ± 967.37 | 1.29 | 774.49 | 1334.18 | 2489.42 | 142,717.11 |
| Disease subgroups | ||||||
| Pneumonia | 2286 ± 2230.45 | 12.04 | 705.73 | 1131.18 | 2258.07 | 98,337.68 |
| COPD | 2390.32 ± 1492.43 | 1.86 | 1045.09 | 1486.65 | 2538.34 | 79,745.31 |
| Gender | ||||||
| Male | 2655.08 ± 1374.98 | 1.29 | 825.82 | 1488.00 | 2818.49 | 142,717.11 |
| Female | 1930.95 ± 1261.26 | 1.29 | 723.32 | 1162.77 | 2019.55 | 93,152.57 |
| Age (years) | ||||||
| 0~14 | 680.03 ± 417.34 | 11.19 | 514.12 | 622.33 | 789.19 | 10,817.72 |
| 15~64 | 2121.07 ± 1560.15 | 1.86 | 830.85 | 1296.84 | 2173.50 | 92,695.38 |
| 65+ | 3234.6 ± 1912.49 | 1.29 | 1163.24 | 1843.32 | 3715.42 | 142,717.11 |
| Season | ||||||
| Cold season | 2364.84 ± 1024.72 | 2.48 | 1719.98 | 2200.55 | 2786.48 | 98,337.68 |
| Warm season | 1711.03 ± 929.33 | 1.29 | 1043.22 | 1613.34 | 2248.95 | 142,717.11 |
1 Minimum; 2 25th percentile; 3 50th percentile (median); 4 75th percentile; 5 maximum.
Table 6.
Basic information for the period of 2015–2019 for the length of stay for respiratory diseases.
Table 6.
Basic information for the period of 2015–2019 for the length of stay for respiratory diseases.
| Variable | Min 1 | P25 2 | P50 3 | P75 4 | Max 5 | |
|---|---|---|---|---|---|---|
| All inpatients | 9.31 ± 2.27 | 1 | 8 | 9 | 10 | 350 |
| Disease subgroups | ||||||
| Pneumonia | 8.68 ± 4.99 | 1 | 7 | 8 | 10 | 180 |
| COPD | 10.17 ± 3.57 | 1 | 8 | 10 | 12 | 130 |
| Gender | ||||||
| Male | 9.79 ± 3.17 | 1 | 8 | 9 | 11 | 76 |
| Female | 8.52 ± 2.73 | 1 | 7 | 8 | 10 | 39 |
| Age (years) | ||||||
| 0~14 | 4.63 ± 2.08 | 1 | 4 | 5 | 6 | 39 |
| 15~64 | 8.50 ± 4.63 | 1 | 7 | 8 | 9 | 350 |
| 65+ | 11.53 ± 3.39 | 1 | 10 | 11 | 13 | 197 |
| Season | ||||||
| Cold season | 9.38 ± 2.54 | 1 | 8 | 9 | 10 | 350 |
| Warm season | 9.26 ± 1.93 | 1 | 8 | 9 | 10 | 191 |
1 Minimum; 2 25th percentile; 3 50th percentile (median); 4 75th percentile; 5 maximum.
Table 7.
Basic Information for the period of 2015–2019 for air pollutants in Wuhan.
| Air Pollutants | Min 1 | P25 2 | P50 3 | P75 4 | Max 5 | |
|---|---|---|---|---|---|---|
| PM2.5 (μg/m3) | 54.07 ± 34.99 | 4 | 30 | 46 | 67 | 281 |
| PM10 (μg/m3) | 87.32 ± 47.75 | 3 | 53 | 81 | 112 | 618 |
| SO2 (μg/m3) | 11.24 ± 7.66 | 2 | 6 | 9 | 14 | 74 |
| NO2 (μg/m3) | 44.97 ± 18.94 | 11 | 30 | 42 | 56 | 119 |
| O3 (μg/m3) | 92.83 ± 53.51 | 4 | 53 | 85 | 122 | 281 |
| CO (mg/m3) | 1.020 ± 0.301 | 0.416 | 0.810 | 0.990 | 1.170 | 2.672 |
1 Minimum; 2 25th percentile; 3 50th percentile (median); 4 75th percentile; 5 maximum.
Table 8.
Ambient Air Quality Standards (GB 3095-2012) concentration value.
| Pollutants | Average Time | Concentration Value | Concentration Unit | |
|---|---|---|---|---|
| Level One | Level Two | |||
| PM2.5 | Annual average | 15 | 35 | μg/m3 |
| Daily average | 35 | 75 | ||
| PM10 | Annual average | 40 | 70 | |
| Daily average | 50 | 150 | ||
| SO2 | Annual average | 20 | 60 | |
| Daily average | 50 | 150 | ||
| NO2 | Annual average | 40 | 40 | |
| Daily average | 80 | 80 | ||
| O3 | Eight hour average | 100 | 160 | |
| CO | Daily average | 4 | 4 | mg/m3 |
Table 9.
The lag days with the greatest hysteresis effect of each air pollutant and regression coefficients ().
Table 9.
The lag days with the greatest hysteresis effect of each air pollutant and regression coefficients ().
| Variable | PM2.5 | PM10 | SO2 | NO2 | O3 | CO |
|---|---|---|---|---|---|---|
| All inpatients | Lag7 (0.0017) | Lag7 (0.0007) | Lag7 (0.0080) | Lag6 (0.0008) | - | Lag7 (0.0001) |
| Disease Subgroups | ||||||
| Pneumonia | Lag7 (0.0021) | Lag7 (0.0008) | Lag7 (0.0125) | Lag6 (0.0020) | Lag1 (0.0008) | - |
| COPD | Lag7 (0.0019) | - | Lag1 (0.0063) | - | - | Lag7 (0.0002) |
| Gender | ||||||
| Male | Lag7 (0.0020) | Lag7 (0.0009) | Lag7 (0.0100) | Lag7 (0.0011) | Lag6 (0.0005) | Lag7 (0.0001) |
| Female | Lag7 (0.0013) | Lag7 (0.0005) | Lag2 (0.0069) | - | - | Lag7 (0.0001) |
| Age (years) | ||||||
| 0~14 | Lag7 (0.0026) | Lag7 (0.0009) | Lag7 (0.0163) | Lag6 (0.0018) | - | - |
| 15~64 | Lag7 (0.0015) | Lag7 (0.0006) | Lag3 (0.0086) | - | - | Lag7 (0.0001) |
| 65+ | Lag7 (0.0014) | Lag7 (0.0008) | Lag7 (0.0074) | Lag7 (0.0011) | Lag4 (0.0006) | Lag7 (0.0002) |
Table 10.
Attributable analysis results of hospital admissions for respiratory diseases due to air pollutants.
Table 10.
Attributable analysis results of hospital admissions for respiratory diseases due to air pollutants.
| Variable | PM2.5 | PM10 | SO2 | NO2 | O3 | CO |
|---|---|---|---|---|---|---|
| Attributable Fraction (%, 95% CI) | ||||||
| All inpatients | 8.50 (6.54, 10.40) | 5.81 (3.73, 7.82) | 8.80 (5.80, 10.27) | 3.33 (0.57, 6.00) | - | 11.73 (3.42, 19.27) |
| Disease Subgroups | ||||||
| Pneumonia | 10.19 (6.18, 13.97) | 6.60 (2.47, 10.51) | 11.84 (7.35, 16.04) | 8.35 (3.01, 13.34) | 6.29 (0.34, 11.76) | - |
| COPD | 9.91 (6.05, 13.55) | - | 6.81 (2.15, 11.15) | - | - | 16.05 (8.01, 23.33) |
| Gender | ||||||
| Male | 9.70 (7.24, 12.07) | 7.10 (4.51, 9.60) | 9.95 (7.13, 12.66) | 4.83 (1.32, 8.20) | 4.29 (0.59, 7.80) | 12.76 (7.40, 17.79) |
| Female | 6.50 (3.22, 9.62) | 4.05 (0.59, 7.36) | 7.10 (3.36, 10.63) | - | - | 8.78 (1.68, 15.32) |
| Age (years) | ||||||
| 0~14 | 12.11 (7.79, 16.16) | 6.98 (2.34, 11.34) | 15.18 (10.22, 19.77) | 7.64 (1.47, 13.36) | - | - |
| 15~64 | 7.53 (4.21, 10.70) | 4.55 (0.99, 7.95) | 8.74 (4.94, 12.34) | - | - | 12.99 (6.05, 19.38) |
| 65+ | 7.42 (4.40, 10.32) | 6.40 (3.27, 9.41) | 7.75 (4.32, 11.01) | 4.82 (0.68, 8.76) | 4.95 (0.71, 8.94) | 9.79 (3.28, 15.83) |
| Attributable Number (1000 cases, 95% CI) | ||||||
| All inpatients | 37.6 (28.9, 46.) | 25.7 (16.5, 34.6) | 35.7 (25.7, 45.4) | 14.7 (2.5, 26.5) | - | 51.8 (15.1, 85.2) |
| Disease Subgroups | ||||||
| Pneumonia | 8.8 (6.4, 14.5) | 6.8 (2.6, 10.9) | 12.3 (7.6, 16.6) | 8.7 (3.1, 13.8) | 6.5 (0.4, 12.2) | - |
| COPD | 9.5 (6.7, 15.1) | - | 7.6 (2.4, 12.4) | - | - | 17.9 (8.9, 26.0) |
| Gender | ||||||
| Male | 22.8 (19.4, 32.4) | 19.0 (12.1, 25.8) | 26.7 (19.1, 33.9) | 13.0 (3.5, 22.) | 11.5 (1.6, 20.9) | 34.2 (19.8, 47.7) |
| Female | 14.8 (5.6, 16.7) | 7.0 (1, 12.8) | 12.3 (5.8, 18.5) | - | - | 15.3 (2.9, 26.6) |
| Age (years) | ||||||
| 0~14 | 6.9 (6.4, 13.2) | 5.7 (1.9, 9.2) | 12.4 (8.3, 16.1) | 6.2 (1.2, 10.9) | - | - |
| 15~64 | 14.0 (6.9, 17.6) | 7.5 (1.6, 13.1) | 14.4 (8.1, 20.2) | - | - | 21.3 (9.9, 31.8) |
| 65+ | 16.7 (8.6, 20.2) | 12.6 (6.4, 18.5) | 15.2 (8.5, 21.6) | 9.5 (1.3, 17.2) | 9.7 (1.4, 17.5) | 19.2 (6.4, 31.1) |
Table 11.
Economic losses of inpatients for respiratory disease due to air pollutants (95% CI) (unit: million USD).
Table 11.
Economic losses of inpatients for respiratory disease due to air pollutants (95% CI) (unit: million USD).
| Variable | PM2.5 | PM10 | SO2 | NO2 | O3 | CO |
|---|---|---|---|---|---|---|
| All inpatients | 103 (79, 126) | 71 (45, 95) | 98 (70, 125) | 40 (7, 73) | - | 142 (41, 234) |
| Disease subgroups | ||||||
| Pneumonia | 24 (18, 40) | 19 (7, 30) | 34 (21, 46) | 24 (9, 38) | 17 (1, 32) | - |
| COPD | 26 (18, 41) | - | 21 (7, 34) | - | - | 50 (25, 73) |
| Gender | ||||||
| Male | 63 (53, 89) | 52 (33, 71) | 73 (53, 93) | 36 (10, 60) | 35 (5, 64) | 104 (60, 145) |
| Female | 41 (15, 46) | 19 (3, 35) | 34 (16, 51) | - | - | 35 (7, 61) |
| Age (years) | ||||||
| 0~14 | 19 (17, 36) | 16 (5, 25) | 34 (23, 44) | 17 (3, 30) | - | - |
| 15~64 | 38 (19, 48) | 21 (4, 36) | 39 (22, 56) | - | - | 59 (27, 87) |
| 65+ | 46 (24, 56) | 34 (18, 51) | 42 (23, 59) | 26 (4, 47) | 36 (5, 65) | 53 (18, 85) |
Table 12.
Scenario analysis of evitable economic losses at relatively low levels of air pollutant concentrations in Wuhan.
Table 12.
Scenario analysis of evitable economic losses at relatively low levels of air pollutant concentrations in Wuhan.
| Air Pollutants | Annual Average Concentrations of Pollutants in the Air under Four Scenarios | Evitable Economic Losses under Different Scenarios of Decreasing Air Pollutant Concentrations (Million USD) | |||||||
|---|---|---|---|---|---|---|---|---|---|
| All Inpatients | Disease Subgroups | Gender Groups | Age Groups | ||||||
| Pneumonia | COPD | Male | Female | 0~14 | 15~64 | 65+ | |||
| PM2.5 | 10 μg/m3 | 16.88 | 4.72 | 5.01 | 11.73 | 5.01 | 4.44 | 5.58 | 6.58 |
| 20 μg/m3 | 13.02 | 3.58 | 4.01 | 9.01 | 3.86 | 3.29 | 4.29 | 5.15 | |
| 30 μg/m3 | 9.01 | 2.58 | 2.86 | 6.30 | 2.72 | 2.15 | 3.00 | 3.72 | |
| 40 μg/m3 | 5.01 | 1.29 | 1.72 | 3.43 | 1.57 | 1.14 | 1.72 | 2.15 | |
| PM10 | 20 μg/m3 | 10.88 | 2.86 | - | 8.01 | 3.00 | 2.43 | 3.15 | 5.29 |
| 40 μg/m3 | 7.58 | 2 | - | 5.58 | 2.00 | 1.57 | 2.15 | 3.72 | |
| 60 μg/m3 | 4.15 | 1 | - | 3.15 | 1.14 | 0.86 | 1.29 | 2.15 | |
| 80 μg/m3 | 0.86 | 0.14 | - | 0.57 | 0.29 | 0.14 | 0.29 | 0.57 | |
| SO2 | 4 μg/m3 | 12.45 | 4.15 | 2.72 | 9.30 | 4.29 | 4.29 | 5.01 | 5.29 |
| 6 μg/m3 | 8.73 | 2.86 | 2 | 6.44 | 3.00 | 2.86 | 3.58 | 3.86 | |
| 8 μg/m3 | 5.01 | 1.43 | 1.29 | 3.72 | 1.72 | 1.43 | 2.00 | 2.29 | |
| 10 μg/m3 | 1.14 | 0.43 | 0.72 | 0.43 | 0.00 | 0.43 | 0.72 | ||
| NO2 | 10 μg/m3 | 6.3 | 3.72 | - | 5.58 | - | 2.72 | - | 4.01 |
| 20 μg/m3 | 4.44 | 2.58 | - | 4.01 | - | 1.86 | - | 2.86 | |
| 30 μg/m3 | 2.72 | 1.57 | - | 2.29 | - | 1.14 | - | 1.72 | |
| 40 μg/m3 | 0.86 | 0.43 | - | 0.72 | - | 0.29 | - | 0.57 | |
| O3 | 20 μg/m3 | 4.87 | 2.72 | - | 4.87 | - | - | - | 4.15 |
| 40 μg/m3 | 3.43 | 1.86 | - | 3.43 | - | - | - | 2.86 | |
| 60 μg/m3 | 2.00 | 1 | - | 2.00 | - | - | - | 1.57 | |
| 80 μg/m3 | 0.57 | 0.14 | - | 0.57 | - | - | - | 0.43 | |
| CO | 0.25 mg/m3 | 21.75 | - | 7.58 | 14.31 | 6.44 | - | 9.01 | 8.01 |
| 0.50 mg/m3 | 14.74 | - | 5.29 | 9.73 | 4.29 | - | 6.01 | 5.58 | |
| 0.75 mg/m3 | 7.58 | - | 2.86 | 5.01 | 2.29 | - | 3.15 | 2.86 | |
| 1.00 mg/m3 | 0.14 | - | 0.29 | 0.14 | 0.14 | - | 0 | 0.14 | |
Publisher’s Note: MDPI stays neutral with regard to jurisdictional claims in published maps and institutional affiliations. |
© 2021 by the authors. Licensee MDPI, Basel, Switzerland. This article is an open access article distributed under the terms and conditions of the Creative Commons Attribution (CC BY) license (https://creativecommons.org/licenses/by/4.0/).
Share and Cite
MDPI and ACS Style
Zhang, H.; You, S.; Zhang, M.; Liu, D.; Wang, X.; Ren, J.; Yu, C. The Impact of Atmospheric Pollutants on Human Health and Economic Loss Assessment. Atmosphere 2021, 12, 1628. https://doi.org/10.3390/atmos12121628
AMA Style
Zhang H, You S, Zhang M, Liu D, Wang X, Ren J, Yu C. The Impact of Atmospheric Pollutants on Human Health and Economic Loss Assessment. Atmosphere. 2021; 12(12):1628. https://doi.org/10.3390/atmos12121628
Chicago/Turabian StyleZhang, Houli, Shibing You, Miao Zhang, Difei Liu, Xuyan Wang, Jingru Ren, and Chuanhua Yu. 2021. "The Impact of Atmospheric Pollutants on Human Health and Economic Loss Assessment" Atmosphere 12, no. 12: 1628. https://doi.org/10.3390/atmos12121628
Note that from the first issue of 2016, this journal uses article numbers instead of page numbers. See further details here.