
Diagnostic Analysis of the Generative Mechanism of Extratropical Cyclones in the Northwest Pacific and Northwest Atlantic


1
College of Oceanic and Atmospheric Sciences, Ocean University of China, Qingdao 266100, China
2
The First Institute of Oceanography, Ministry of Natural Resources, Qingdao 266061, China
*
Author to whom correspondence should be addressed.
Atmosphere 2021, 12(10), 1326; https://doi.org/10.3390/atmos12101326
Submission received: 5 August 2021
/
Revised: 22 September 2021
/
Accepted: 6 October 2021
/
Published: 11 October 2021
(This article belongs to the Special Issue Air-Sea Interaction and Ocean Dynamics)
Abstract
:We investigated the early-stage development of cyclones occurring in the strong baroclinic regions in the Northwest Pacific and the Northwest Atlantic based on European Center for Medium-range Weather Forecasts Re-Analysis-Interim (ERA-Interim) data. The composite background conditions corresponding to the cyclones on the onset day are characterized by upper troposphere divergence of westerly jet ahead of a trough, low troposphere convergence of westerly jet behind a trough, and strong meridional air temperature gradient (baroclinicity) both in the Northwest Pacific and the Northwest Atlantic, but with stronger baroclinicity in the Northwest Pacific. The composite velocity and temperature fields of the cyclone on the onset day show a clear horizontal front and a westward and northward vertical tilting of cyclonic circulation to the cold zone. The composite Northwest Pacific cyclone filed on the onset day has a warm core, whereas the composite Northwest Atlantic cyclone field has a cold core in the low troposphere. The leading adiabatic processes that contribute to the developing of the cold core cyclone in the Northwest Atlantic on the onset day is the temperature advection, while stronger vertical motion induces stronger adiabatic warming in the Northwest Pacific cyclones, which has a significant contribution to the development of warm core cyclones on the onset day.
1. Introduction
Extratropical cyclones are low-pressure vortices that are baroclinic in the middle and high latitudes of the northern and southern hemispheres [1]. Extratropical cyclones play an indispensable role in global atmospheric circulation. Most of the heat, water vapor and momentum that transfer between the tropics and the polar regions depend on the movement and development of extratropical cyclones. Asia, the east of North America, the North Pacific, the North Atlantic, and the Mediterranean are the regions that are greatly affected by extratropical cyclones, but the extratropical cyclones in the Mediterranean are usually sub-synoptic scale systems with a short duration and a weak intensity [2].
The study of extratropical cyclones is of great significance to the study of explosive cyclones. There are various factors that affect the occurrence and development of extratropical cyclones. Baroclinic instability, latent heat release, and the downward propagation of potential vortices in the upper stratosphere may cause the occurrence and explosive development of extratropical cyclones [3,4,5,6]. The evolution mechanism of extratropical cyclones has been studied extensively from the perspectives of vorticity and energy budgets, numerical sensitivity tests, and potential vorticity inversion.
From the perspective of vorticity and energy budgets, the potential height advection of ageostrophic wind, horizontal contraction caused by convergence, and vertical vorticity transport are important sources and sinks of vortex kinetic energy. The favorable baroclinic environment is an important condition for vortex development. The conversion from potential energy to kinetic energy causes vortex energy to increase, but the transformation from vertical to horizontal vorticity is an important factor that makes vortexes die out [7,8,9,10,11,12].
This study shows that the significant increase in the occurrence frequency of explosive cyclones in the Northwest Pacific is mainly due to the changes in humidity and evaporation related to the warming of the sea surface temperature, resulting in the enhancement of a low-level baroclinic area in eastern Japan. The high-frequency region of explosive cyclones is also the main baroclinic region, and the baroclinic region may be a prerequisite for the existence and development of general low-pressure and vortex systems [13].
In terms of diagnostic equations and atmospheric models, scholars have used different diagnostic equations and atmospheric models to diagnose and analyze cyclones in different regions in recent decades, including an improved vorticity budget equation, i.e., the Zwack–Okossi equation [14], for diagnostic analysis [15,16,17], quasi-geostrophic geopotential height for diagnostic analysis of extratropical cyclones [18,19], and a five-layer quasi-geostrophic model was used for diagnostic analysis [20]. The results show that vorticity advection [15], temperature advection [15], latent heat release [21,22,23], large-value vorticity downward propagation from high altitudes, a high-altitude jet, friction, and other factors play a leading role in the different stages of the occurrence and development of extratropical cyclones. Gyakum’s research indicates that the conditional instability of the second kind (CISK) mechanism plays a role in the development of extratropical cyclones [24]. By using the vorticity tendency equation to diagnose and analyze the cyclones entering the Yellow Sea and the Bohai Sea, it was concluded that the development of cyclones can be divided into three stages: the development of cyclones in the early stage starts from the lower level; after the cyclones enter the sea, the high trough moves to the low-value system in the development stage, and the vorticity advection strengthens, and in the mature stage, the two westerly troughs merge and strengthen.
For the diagnosis of extratropical cyclones, most scholars focus on the diagnosis of explosive cyclones in the North Pacific’s middle and high latitudes. The characteristics of ambient temperature, sea surface temperature and circulation in the middle latitudes are significantly different from those in the high latitudes. Most of the extratropical cyclones in the middle latitudes are shallow, and the characteristics of the cyclone structure and environment are significantly different from those in the high latitudes. In addition, there are obvious changes in the structural integrity and influencing factors of the cyclone generation day and the explosive development of the cyclone. Therefore, the analysis of the development mechanism of mid-latitude extratropical cyclones requires further study.
There are many studies on the explosive development of mid-latitude extratropical cyclones, but the cyclone structure and influencing factors on the first day of the generation of extratropical cyclones are still unclear. This article mainly uses composite analysis and diagnostic analysis to study the cyclone structure and influencing factors of mid-latitude extratropical cyclone generation, and determine the mechanism of mid-latitude extratropical cyclone generation.
This paper is organized as follows. In Section 2, we describe the data, methods, and area selection used in the study. Section 3 studies the background circulation characteristics when cyclones are generated in the Northwest Pacific and Northwest Atlantic, the cyclone structure on the first day of cyclone generation, the factors that affect the formation of cyclones, and the relative contributions of various factors to the formation of cyclones. Section 4 is the main conclusion of this article.
2. Data and Methods
The data used in this study are from the ERA-Interim reanalysis data provided by the European Center for Medium-range Weather Forecasts (ECMWF) from 1979 to 2017, including temperature, horizontal wind speed, vertical wind speed, geopotential height, 10 m wind speed data, 2 m temperature data, sea surface temperature, and sea level pressure. The temporal resolution was 6 h and the spatial resolution was 1° × 1°.
There were three methods used to identify the extratropical cyclone: the first was to identify the center of the extratropical cyclone by the minimum of the mean sea level pressure field, the second was to determine the center of the extratropical cyclone by the maximum vorticity field in the lower troposphere, and the third method was to determine the center of the extratropical cyclone by the minimum of the geopotential height field on the 1000 hPa isobaric surface. This paper takes the location of the lowest local sea level pressure as the center of the extratropical cyclone, according to the first method. Based on the method outlined by Halt and Simmonds [25], the computer objective identification is used to search for the extratropical cyclone that occurred in the Northern Hemisphere from 1979 to 2017, and to obtain its path, intensity and other information. The specific search conditions were as follows: (1) identification of a potential cyclone center: find the local minimum value of sea level pressure within 5° of latitude and longitude, and the pressure value should be lower than 1020 hPa; (2) the difference between the minimum and maximum pressure found within 5° of latitude and longitude should be greater than 2 hPa, and at this point the Laplace value of the air pressure is greater than 0.1 hPa/(°2). These two conditions ensure that the searched center is a low-pressure center with a certain strength. (3) Cyclone path search: assume that the site at time t was A, and the site at time t + 1 was B. When B was satisfied, the average speed of the cyclones between A and B was less than 50 m/s, the angle of the vector of AB and the vector at time t − 1 → t was less than the threshold [25], and B was the closest site to satisfy these conditions. AB was the same cyclone process. These three conditions were obtained from our predecessors [25], based on the statistical analysis of a large number of cyclones, aiming to connect the potential centers of adjacent times into a relatively reasonable cyclone path.
The baroclinic atmosphere is an important factor that affects the formation of extratropical cyclones, and thus is particularly important to determine. According to the baroclinic index of 850 hPa used by Iwao et al., the baroclinic property of the lower atmosphere is expressed by the following formula [13]:
where f is the Coriolis parameter, is the horizontal wind vector, p is the pressure, is the stability parameter of 850 hPa, R is the gas constant, cp is the specific heat at a constant pressure of dry air, and t is the air temperature of 850 hPa. In this paper, we used a BI of 850 hPa to represent the baroclinic properties of the lower atmosphere.
According to the above determination and tracking of extratropical cyclones, we have obtained the data set of the sources, path, pressure intensity and time of extratropical cyclones in the northern hemisphere from 1979 to 2017, and then count the number of cyclones generated on the first day in each 2.5° × 2.5° area to obtain the frequency distribution of cyclones in the northern hemisphere. The generation frequency and baroclinic distribution of winter extratropical cyclones in the northern hemisphere are shown in Figure 1. The main sources of winter extratropical cyclones in the northern hemisphere include the Northwest Pacific, the Northwest Atlantic, the Rocky Mountains, the Mediterranean, Mongolia, and Greenland. In the Northwest Pacific Ocean, the Northwest Atlantic Ocean, the Rocky Mountains and the Barents Sea, the baroclinic atmosphere of the cyclones was shown to be very strong. In the Mongolia region and the East Siberian Sea, although the baroclinic atmosphere was very weak, the number of cyclones generated was quite large. It is well-known that extratropical cyclones mainly occur and develop in the baroclinic atmosphere. The strong baroclinicity of the atmosphere provides baroclinic energy for extratropical cyclones, which is conducive to the generation and development of cyclones. However, in areas with a weak baroclinic atmosphere, there are also many cyclones, which indicates that baroclinicity of the atmosphere is not the only criterion for cyclogenesis.
It can be seen from Figure 1 that the largest sources of winter extratropical cyclones in the northern hemisphere were mainly distributed in the Northwest Pacific and the Northwest Atlantic Oceans. In order to better understand the generation mechanism and structure of winter extratropical cyclones in the northern hemisphere, we studied the conditions for the formation of extratropical cyclones in winter, from December to February 1979–2017. The cyclones generated in the Northwest Pacific and the Northwest Atlantic were selected according to the different frequencies of cyclones and atmospheric baroclinicity. The number of winter cyclones selected in the Northwest Pacific was 146, and the number in the Northwest Atlantic was 80. The selected regions are shown in Figure 2.
The occurrence and development of a cyclone is a response to the change of potential vorticity, which is related to a variety of mechanisms. These mechanisms can be divided into mechanisms related to dynamic factor, including the cyclonic vorticity advection in the upper layer, the relative position between the high- and low-level jets and the cyclone, the thermal effect, which includes the advection of warm air in the upper troposphere or lower stratosphere, the release of convective latent heat, the adiabatic heating caused by vertical motion, the reduction in surface energy flux and static stability. In addition, the development of cyclones is also affected by the topography.
The Z–O equation describes the geostrophic relative vorticity trend at the lower boundary of the dynamic and thermal forcing of the atmosphere, which was vertically integrated. Zwack and Okossi derived the quasi-geostrophic version [14], and Lupo et al. generalized and simplified the equation [15], which is called the “extended form”. It can be applied to diagnosis on the synoptic scale, and it ignores the friction term. The equation can be written as follows:
where pl is the pressure of the lower boundary, pt is the pressure of the upper boundary, ζgl is the geostrophic relative vorticity of the lower boundary, ζa is the absolute vorticity (ζa = ζ + f; ζ is relative vorticity), f is the Coriolis parameter, R is the gas constant of dry air, V is the horizontal wind, Q is the non-adiabatic heating and cooling rate, cp is the specific heat at constant pressure, S is the static stability (S = −(T/θ)(θ/p)), θ is potential temperature, ω is a vertical motion in an isobaric coordinate system (ω = dp/dt), and Pd = 1/(pl − pt).
The left side of the equation is the near-surface geostrophic vorticity trend. The first term on the right is VADV, which is the influence of dynamic forcing and horizontal absolute vorticity advection on the geostrophic relative vorticity trend of the lower boundary. The second term (TADV) represents the effect of horizontal temperature advection, and the third term (LATH) represents non-adiabatic heating and cooling. The fourth term (ADIA) is the effect of the adiabatic temperature change due to the vertical motion. The local term of 1000 hPa geostrophic vorticity was calculated using the time interpolation method. The spatial difference method was the second-order central difference. The horizontal and vertical derivatives were calculated by the second-order finite difference method. The vertical integration was estimated by the trapezoidal method. The Laplacian items produced noise, and in order to reduce sub-synchronous noise, the two-dimensional filtering method [26] proposed by Shapiro was used to smooth each term. The wave with a wavelength less than 500 km had less than 10% information, and the wave with a wavelength of more than 1000 km retained more than 83% of the information.
3. Results
3.1. Characteristics of Background Circulation
The characteristics of the background circulation often control the occurrence of cyclones on a macroscopic level. The specific background circulation is likely to produce factors that are conducive to the occurrence and development of the cyclones. Therefore, the circulation characteristics of the cyclones are necessary. In this paper, the synthetic background circulation fields were obtained by averaging all the circulation fields at the geographical coordinates when cyclones occur, as shown in Figure 3 and Figure 4.
The Northwest Pacific region is one of the main sources of East Asian cyclones. The westerly wind from the Eurasian continent converges in the Northwest Pacific and forms a low-pressure center at 850 hPa in the lower troposphere. With the decrease in air pressure, it inclines westward in the whole troposphere. In Figure 3, a high-value area of wind speed at 300 hPa in the upper troposphere is shown, which is the upper-level jet area, and the low-level jet area is at 850 hPa in the lower troposphere. The center of the surface cyclone is located on the north side of the entrance area of the high- and low-level jets. In the whole troposphere, the meridional temperature gradient of the cyclones is very strong, forming a strong baroclinic region. According to the characteristics of the background circulation in the Northwest Pacific, we predicted that the main factors affecting the formation of cyclones in the region included the dynamic effect of vorticity advection, the thermal effect of temperature advection, latent heat release and the forcing effect of high- and low-level jets.
Similar to the Northwest Pacific, the Northwest Atlantic is one of the main sources of extratropical cyclones. Figure 4 describes how there is a low-pressure trough inclined to the west in the whole troposphere. The surface cyclone is located in the high-level trough area. There are high-level and low-level jets at 300 and 850 hPa, respectively. The low-level jet is the warm and humid air from the cyclone source zone, and the high-level jet affects the occurrence and development of the cyclone through the dynamic factor. At 850 hPa, the cyclones are located on the north side of the low-level jet. At 300 hPa, the cyclones are located in the exit area of the jet axis, where the wind field diverges and is conducive to the formation of cyclones. The meridional temperature gradient shows that a strong baroclinic zone extends from the interior of North America and is in the position of the cyclone, mainly at 850 and 500 hPa in the lower troposphere, which is conducive to the formation of cyclones. According to the characteristics of the background circulation in the Northwest Atlantic, we predicted that the main factors affecting the cyclogenesis in the region include the dynamic effect of vorticity advection, the thermal effect of temperature advection and latent heat release, as well as force from high- and low-level jets.
The characteristics of the background circulation show that the source of the cyclone is usually located near the high-level trough area with different heights, and is accompanied by the influence of high- and low-level jets, and the source of the cyclone usually has greater baroclinicity in the middle and low troposphere. It also reflects that the low-level baroclinicity and the vorticity and temperature advection in the middle and upper layers related to the long- and short-wave troughs are favorable factors for the occurrence and development of cyclones.
3.2. Characteristics of Cyclone Structure
To investigate mesoscale structures and development mechanisms for each different source cyclone, another kind of composite analysis is conducted, in which each element to be analyzed is superimposed with its sea-level cyclone center as the coordinate center. The analysis area is within 15° of the latitude and longitude of the cyclone center, such as shown in Figure 5 and Figure 6.
There are obvious differences in the structures of cyclones in different source regions due to different factors. Figure 5a–c shows the structure of extratropical cyclones on the days when the cyclones were generated. The cyclone in the Northwest Pacific region shows an abnormal warming in temperature in the cyclone center at 850 hPa in the lower troposphere, and the air flow increases strongly in the cyclone center and on its east side. At 500 and 300 hPa, the center of the wind field shows that the cyclone inclines westward, which indicates that the cyclone in the Northwest Pacific region has a baroclinic structure. At 500 hPa, the center of the cyclone is an area of abnormal temperature cooling, while at 300 hPa, the center of the cyclone is an area of abnormal temperature warming. The air flow on the east side of the cyclone center rises, and on the west side it sinks. The phenomenon of abnormal warming and cooling in the whole troposphere is obvious in the middle and low troposphere.
The vertical cross sections reflect the vertical spatial structure of the whole cyclone. According to Figure 5d,e, the abnormal warming and cooling in temperature is obvious in the cyclone area below 400 hPa in the troposphere, while the abnormal change in temperature is not obvious above 400 hPa. The vertical velocity is the same as the latitude-longitude plots, which shows that the vertical movement is the strongest from 300 to 900 hPa in the upper troposphere, and there may be a large amount of convective latent heat release and adiabatic heating.
While the cyclone structure in the Northwest Pacific region shows the characteristics of a frontal cyclone, according to the whole spatial structure of the cyclone, it is a warm center cyclone with strong vertical motion. In addition, on the first day of the formation of the extratropical cyclone, it is affected by the strong cold advection in the middle troposphere, and the baroclinic energy gradually exerts an effect on the cyclone.
Figure 6a–c shows the cyclone structure in the Northwest Pacific region. The cyclone in the Northwest Atlantic region shows abnormal warming in the southeast of the cyclone center from 850 hPa in the lower troposphere to 500 hPa in the middle troposphere, with warm air flowing from south to north and forming a warm front; on the northwest side of the cyclone, the temperature is abnormally cold, and the cold air flows from north to south, forming a cold front. The phenomenon of overall warming and cooling is most obvious in the lower troposphere. The abnormal warming in the south and abnormal cooling in the north of cyclones at 300 hPa are weaker. The vertical velocity of the whole tropospheric cyclone shows that the southeast side of the cyclone is the rising area, and the northwest side of the cyclone is the sinking area. The whole wind field inclines to the northwest from 850 hPa to the high altitude, which indicates that the cyclone in the Northwest Atlantic region inclines to the northwest with a height increase and has obvious baroclinic characteristics.
The vertical cross sections shown in Figure 6d,e show that the abnormal cold and warm structures of the cyclone above and below 300 hPa in the troposphere are opposite. The temperature in the center and northwest side of the cyclone below 300 hPa becomes abnormally cold, and the temperature in the corresponding position above 300 hPa becomes abnormally warm. This is mainly due to the cold front in the lower troposphere catching up with the warm front, squeezing and lifting the cold air in the lower troposphere from the southeast side of the cyclone to the upper air. Similarly, the vertical velocity shows that the vertical motion is the strongest from 900 hPa in the lower layer to 400 hPa in the middle troposphere, where there may be a large amount of convective latent heat release and adiabatic heating.
The extratropical cyclones in the Northwest Atlantic region present a clear cold core structure of frontal cyclones, and the vertical scale occupies the whole troposphere and lower stratosphere, and has an obvious baroclinic structure. The center of the cyclone is in the abnormal cooling zone of temperature, which is a typical cold core extratropical frontal cyclone.
3.3. Analysis of Influencing Factors
There are many factors influencing the formation of an extratropical cyclone, including the vorticity advection at a high altitude, the low-altitude temperature advection, the condensation latent heat release, the adiabatic, the non-adiabatic, the topography and friction, etc. In the Z–O equation, the factors affecting the geostrophic vorticity include vorticity advection, temperature advection, non-adiabatic heating and cooling, adiabatic and friction. Although the non-adiabatic heating and cooling play a major role in promoting the formation of cyclones, and the friction is small, this paper only considers the contributions of vorticity advection, temperature advection and adiabatic changes to the formation of the cyclone on the day that the cyclone is generated.
3.3.1. Temperature Advection
Figure 7a–c shows that in the early stage of cyclogenesis, the TADV term in the upper troposphere is negative in the southeast of the cyclone source, which has no obvious contribution to the cyclogenesis, but is positive in the northwest of the cyclone source; it has a positive contribution to the generation of cyclones. Figure 7d,e shows that the cold air advection is mainly over the source area of the cyclone, so the temperature advection term can inhibit the occurrence of the cyclone in the Northwest Pacific region.
Figure 8a–c shows that, in the early stage of cyclogenesis, the TADV term in the upper troposphere is positive in the southeast of the cyclone source, which has a positive contribution to the cyclogenesis, but is negative in the northwest of the cyclone source, it has no obvious contribution to the generation of cyclones. Figure 8d,e shows that the warm air advection is mainly over the source of the cyclone, so the temperature advection is a promoting factor for the occurrence of the cyclone in the Northwest Atlantic region.
3.3.2. Vorticity Advection
Figure 9 shows the relative vorticities and contributions of VADV term to the surface vorticity tendency in the Northwest Pacific. The large cyclonic vorticities associated with the upper-level trough extends from the northwest to the cyclone center. The VADV term is negative in 850 hPa and in the northeast of 300 hPa, while it is positive in the southwest of 300 hPa. On the whole, the positive and negative values are equal, and VADV term has no obvious promoting effect on cyclone generation in the Northwest Pacific.
Figure 10 shows the relative vorticities and contributions of VADV term to the surface vorticity tendency in the Northwest Atlantic. The large cyclonic vorticities associated with the upper-level trough also extends from the northwest to the cyclone center. The VADV term is negative in the northeast of 300, 500, and 850 hPa, while it is positive in the southwest of 300, 500, and 850 hPa. On the whole, the positive and negative values are equal, and VADV term has no obvious promoting effect on cyclone generation in the Northwest Atlantic.
3.3.3. Adiabatic Temperature Variation
Figure 11 shows contributions of ADIA term to the surface vorticity tendency in the Northwest Pacific. ADIA term is negative at the cyclone center in the lower troposphere and positive around the cyclone. The integral of adiabatic temperature term of the whole vertical air column from the middle troposphere to the upper troposphere is positive in the northeast of the cyclone source and negative in the southwest of the cyclone source. Figure 11d,e shows that there are mainly positive adiabatic temperature changes over the source area of the cyclone, which indicates that the adiabatic temperature changes caused by the vertical motion have a positive effect on the generation of the cyclone in the Northwest Pacific region.
Figure 12 shows contributions of ADIA term to the surface vorticity tendency in the Northwest Atlantic region. ADIA term is positive at the center and around the cyclone in the lower troposphere of the cyclone. The integral of adiabatic temperature change term of the whole vertical air column from the middle troposphere to the upper troposphere is positive in the northeast of the cyclone source and negative in the southwest of the cyclone source. Figure 12d,e shows that there are mainly positive and negative adiabatic temperature changes above the cyclone source, which indicates that the adiabatic change in air temperature caused by vertical motion has little effect on the generation of the Northwest Atlantic region cyclone.
To estimate the contributions of above each term to cyclogenesis, correlations between TADV, VADV, and ADIA term and the surface vorticity tendency of the in Equation (2) are plotted in Figure 13 and Figure 14. The surface vorticity tendency is averaged within 10° around the cyclone center, 6 h before the cyclones generate. The gradient of the regression line is a measure of the degree of the contribution to the cyclone generation.
As shown in Figure 13, in the Northwest Pacific region, the main factor affecting cyclogenesis was ADIA term caused by the vertical movement of air. The release of condensation latent heat was not analyzed here. TADV and VADV term had no obvious effect on the generation of cyclones. Combined with the above analysis of the background field in the Northwest Pacific, the source of the cyclone was mainly located in the upper-level trough on the east side of the continent. The upper-level vorticity advection mainly promoted the generation of the cyclone on the south side of the cyclone, and suppressed the generation of the cyclone on the north side. The vorticity advection of the whole air column had no obvious effect on the cyclone. Due to the prevailing westerly air flow, the cold air from the continent passed over the source region of the cyclone, where the cold air advection mainly suppressed the generation of the cyclone. As the cyclones in the Northwest Pacific region are warm core cyclones, AIDA term caused by the vertical motion played a major role in promoting the generation of cyclones.
In the Northwest Atlantic region, the main factor affecting the generation of cyclones was TADV term; VADV and ADIA term had no obvious effect on the generation of cyclones, as shown in Figure 14. The release of condensation latent heat also was not analyzed here. Combined with the analysis of the background field of the Northwest Atlantic Ocean, the source of the cyclone was mainly located in the upper-level trough, and the upper-level vorticity advection mainly promotes the generation of cyclones at 300 hPa, while in the lower troposphere the vorticity advection is negative, which suppresses the generation of cyclones. The vorticity advection of the whole gas column is not as strong as the temperature advection. As the cyclone in the Northwest Atlantic is a typical cold core frontal cyclone, the ADIA term caused by the vertical motion can inhibit the generation of the cyclone, but it is less than the promotion of the temperature advection. There are also upper-level and lower-level jets in the Northwest Atlantic region, which bring warm air advection to the cyclones.
4. Conclusions
To better understand the generation of extratropical cyclones in the mid-latitude, generation, source, and atmospheric conditions were analyzed using the ERA-Interim reanalysis data provided by the European Center for Medium-range Weather Forecasts (ECMWF). Cyclones were classified two regions by source of cyclones and baroclinic characteristics of the lower atmosphere: cyclones in the Northwest Pacific and cyclones in the Northwest Atlantic. During the winters of 1979–2017, 146 extratropical cyclones in the Northwest Pacific region and 80 extratropical cyclones in the Northwest Atlantic region were selected for study.
The large-scale background circulation of the source of cyclones was studied by composite analysis. The cyclone in the Northwest Pacific region developed in the lower-level trough, and there was a jet in the northwest of the cyclone sources. The jet was in the subpolar westerlies and there was a strong baroclinic zone from lower-level to upper-level. The horizontal wind increased with the height, the warm air rose in the east of the cyclone, the cold air sank in the west of the cyclone, and the vertical convection was strong, developing to 200 hPa. The cyclone in the Northwest Atlantic region developed in a trough at the upper level. There was a jet region in the cyclone source. The cyclone was in the north of the outlet area of the upper-level jets, where the airflow diverged at upper-level, causing the generation of a cyclone at sea level, and there also was a strong baroclinic zone from lower-level to upper-level. Obviously, the cyclones in the Northwest Pacific and Northwest Atlantic regions developed under the conditions of upper-level troughs, jets, and strong baroclinic atmosphere.
Analysis of its development mechanism showed the extratropical cyclones in the study area were frontal cyclones with baroclinic structures. From the ground to the upper troposphere, the entire cyclones tilted towards the cold zone, that is, it tilted towards the deep system. In addition, the extratropical cyclones in the mid-latitude of northern hemisphere were not all cold core cyclones, and there were many warm core extratropical cyclones in the Northwest Pacific Ocean, so the factors causing the generation of warm core extratropical cyclones were also different from those of cold core extratropical cyclones. We found that without considering the release of condensation latent heat, due to the stronger low-level jet, the main factors for the generation of cold core cyclones in the Northwest Atlantic was temperature advection. The vorticity advection and adiabatic motion caused by vertical motion had no positive effect on the generation of cold core cyclones. Among the factors that caused warm core extratropical cyclones in the Northwest Pacific, due the stronger vertical motion and warm core, the adiabatic motion caused by vertical motion had a positive effect on the generation of warm core cyclones.
Author Contributions
Conceptualization, Q.G. and Y.D.; methodology, Q.G. and R.S.; software, Q.G. and R.S.; validation, Q.G. and Y.D.; formal analysis, Q.G.; investigation, Q.G. and Y.D.; resources, Y.D.; data curation, Q.G. and R.S.; writing—original draft preparation, Q.G.; writing—review and editing, Q.G., Y.D., X.X. and J.S.; visualization, Q.G.; supervision, Y.D., X.X. and J.S.; project administration, Y.D.; funding acquisition, Y.D. All authors have read and agreed to the published version of the manuscript.
Funding
This research was funded by National Key Basic Research Project of China (Grant 2019YFA0607002) and National Natural Science Foundation of China (Grant 42075025).
Institutional Review Board Statement
Not applicable.
Informed Consent Statement
Not applicable.
Data Availability Statement
Temperature, horizontal wind speed, vertical wind speed, geopotential heigh, 10 m wind speed data, 2 m temperature data, sea surface temperature and sea level pressure data obtained through the European Center for Medium-range Weather Forecasts Website (https://apps.ecmwf.int/datasets, accessed on 21 May 2019).
Conflicts of Interest
The authors declare no conflict of interest.
References
- Schultz, D.M.; Bosart, L.F.; Colle, B.A.; Davies, H.C.; Dearden, C.; Keyser, D.; Martius, O.; Roebber, P.J.; Steenburgh, W.J.; Volkert, H. Extratropical cyclones: A century of research on meteorology’s centerpiece. Meteorol. Monogr. 2019, 59, 16.1–16.56. [Google Scholar] [CrossRef]
- Maheras, P.; Flocas, H.; Patrikas, I.; Anagnostopoulou, C. A 40 year objective climatology of surface cyclones in the Mediterranean region: Spatial and temporal distribution. Int. J. Climatol. J. R. Meteorol. Soc. 2001, 21, 109–130. [Google Scholar] [CrossRef]
- Davis, C.A.; Grell, E.D.; Shapiro, M. The balanced dynamical nature of a rapidly intensifying oceanic cyclone. Mon. Weather. Rev. 1996, 124, 3–26. [Google Scholar] [CrossRef] [Green Version]
- Fu, S.; Sun, J.; Sun, J. Accelerating two-stage explosive development of an extratropical cyclone over the northwestern Pacific Ocean: A piecewise potential vorticity diagnosis. Tellus Ser. Dyn. Meteorol. Oceanogr. 2014, 66, 23210. [Google Scholar] [CrossRef] [Green Version]
- Kuwano-Yoshida, A.; Asuma, Y. Numerical study of explosively developing extratropical cyclones in the northwestern pacific region. Mon. Weather Rev. 2008, 136, 712–740. [Google Scholar] [CrossRef]
- Wu, L.; Martin, J.E.; Petty, G.W. Piecewise potential vorticity diagnosis of the development of a polar low over the Sea of Japan. Tellus Ser. Dyn. Meteorol. Oceanogr. 2011, 63, 198–211. [Google Scholar] [CrossRef] [Green Version]
- Brandes, E.A. Evolution and structure of the 6–7 May 1985 mesoscale convective system and associated vortex. Mon. Weather Rev. 1990, 118, 109–127. [Google Scholar] [CrossRef] [Green Version]
- Davis, C.A.; Galarneau, T.J., Jr. The Vertical Structure of Mesoscale Convective Vortices. J. Atmos. Sci. 2009, 66, 686–704. [Google Scholar] [CrossRef]
- Fu, S.; Yu, F.; Wang, D.; Xia, R. A comparison of two kinds of eastward-moving mesoscale vortices during the mei-yu period of 2010. Sci. China-Earth Sci. 2013, 56, 282–300. [Google Scholar] [CrossRef]
- Fu, S.-M.; Li, W.-L.; Ling, J. On the evolution of a long-lived mesoscale vortex over the Yangtze River Basin: Geometric features and interactions among systems of different scales. J. Geophys. Res.-Atmos. 2015, 120, 11889–11917. [Google Scholar] [CrossRef]
- Kirk, J.R. Comparing the dynamical development of two mesoscale convective vortices. Mon. Weather Rev. 2003, 131, 862–890. [Google Scholar] [CrossRef]
- Orlanski, I.; Katzfey, J. The life-cycle of a cyclone wave in the southern-hemisphere.1. eddy energy budget. J. Atmos. Sci. 1991, 48, 1972–1998. [Google Scholar] [CrossRef] [Green Version]
- Iwao, K.; Inatsu, M.; Kimoto, M. Recent Changes in Explosively Developing Extratropical Cyclones over the Winter Northwestern Pacific. J. Clim. 2012, 25, 7282–7296. [Google Scholar] [CrossRef]
- Zwack, P.; Okossi, B. A new method for solving the quasi-geostrophic omega equation by incorporating surface pressure tendency data. Mon. Weather Rev. 1986, 114, 655–666. [Google Scholar] [CrossRef]
- Lupo, A.R.; Smith, P.J.; Zwack, P. A diagnosis of the explosive development of 2 extratropical cyclones. Mon. Weather Rev. 1992, 120, 1490–1523. [Google Scholar] [CrossRef] [Green Version]
- Strahl, J.L.; Smith, P.J. A diagnostic study of an explosively developing extratropical cyclone and an associated 500-hPa trough merger. Mon. Weather Rev. 2001, 129, 2310–2328. [Google Scholar] [CrossRef]
- Yoshida, A.; Asuma, Y. Structures and environment of explosively developing extratropical cyclones in the northwestern Pacific region. Mon. Weather Rev. 2004, 132, 1121–1142. [Google Scholar] [CrossRef]
- Ruscher, P.H.; Condo, T.P. Development of a rapidly deepening extratropical cyclone over land. Part I: Kinematic aspects. Mon. Weather Rev. 1996, 124, 1609–1632. [Google Scholar] [CrossRef] [Green Version]
- Tsou, C.-H.; Smith, P.J.; Pauley, P.M. A comparison of adiabatic and diabatic forcing in an intense extratropical cyclone system. Mon. Weather Rev. 1987, 115, 763–786. [Google Scholar] [CrossRef] [Green Version]
- Hirschberg, P.A.; Fritsch, J.M. A study of the development of extratropical cyclones with an analytic model. Part II: Sensitivity to tropospheric structure and analysis of height tendency dynamics. Mon. Weather Rev. 1994, 122, 2312–2330. [Google Scholar] [CrossRef] [Green Version]
- Anthes, R.A.; Kuo, Y.-H.; Benjamin, S.G.; Li, Y.-F. The evolution of the mesoscale environment of severe local storms: Preliminary modeling results. Mon. Weather Rev. 1982, 110, 1187–1213. [Google Scholar] [CrossRef] [Green Version]
- Chen, S.-J.; Dell’Osso, L. A numerical case study of East Asian coastal cyclogenesis. Mon. Weather Rev. 1987, 115, 477–487. [Google Scholar] [CrossRef] [Green Version]
- Danard, M.B. On the influence of released latent heat on cyclone development. J. Appl. Meteorol. Climatol. 1964, 3, 27–37. [Google Scholar] [CrossRef] [Green Version]
- Gyakum, J.R. On the evolution of the QE II storm. II: Dynamic and thermodynamic structure. Mon. Weather Rev. 1983, 111, 1156–1173. [Google Scholar] [CrossRef]
- Hart, R.E. A cyclone phase space derived from thermal wind and thermal asymmetry. Mon. Weather Rev. 2003, 131, 585–616. [Google Scholar] [CrossRef]
- Shapiro, R. Smoothing, filtering, and boundary effects. Rev. Geophys. 1970, 8, 359–387. [Google Scholar] [CrossRef]
Figure 1.
Distributions of atmospheric baroclinic index (blue shading, unit: 1 × 10⁻⁶ m·K−1·s−2) and the number of the cyclone centers on the onset day (red dots) in the northern hemisphere in winters of the period 1979–2017. The size of the red dots denotes the number of the cyclones.
Figure 1.
Distributions of atmospheric baroclinic index (blue shading, unit: 1 × 10⁻⁶ m·K−1·s−2) and the number of the cyclone centers on the onset day (red dots) in the northern hemisphere in winters of the period 1979–2017. The size of the red dots denotes the number of the cyclones.
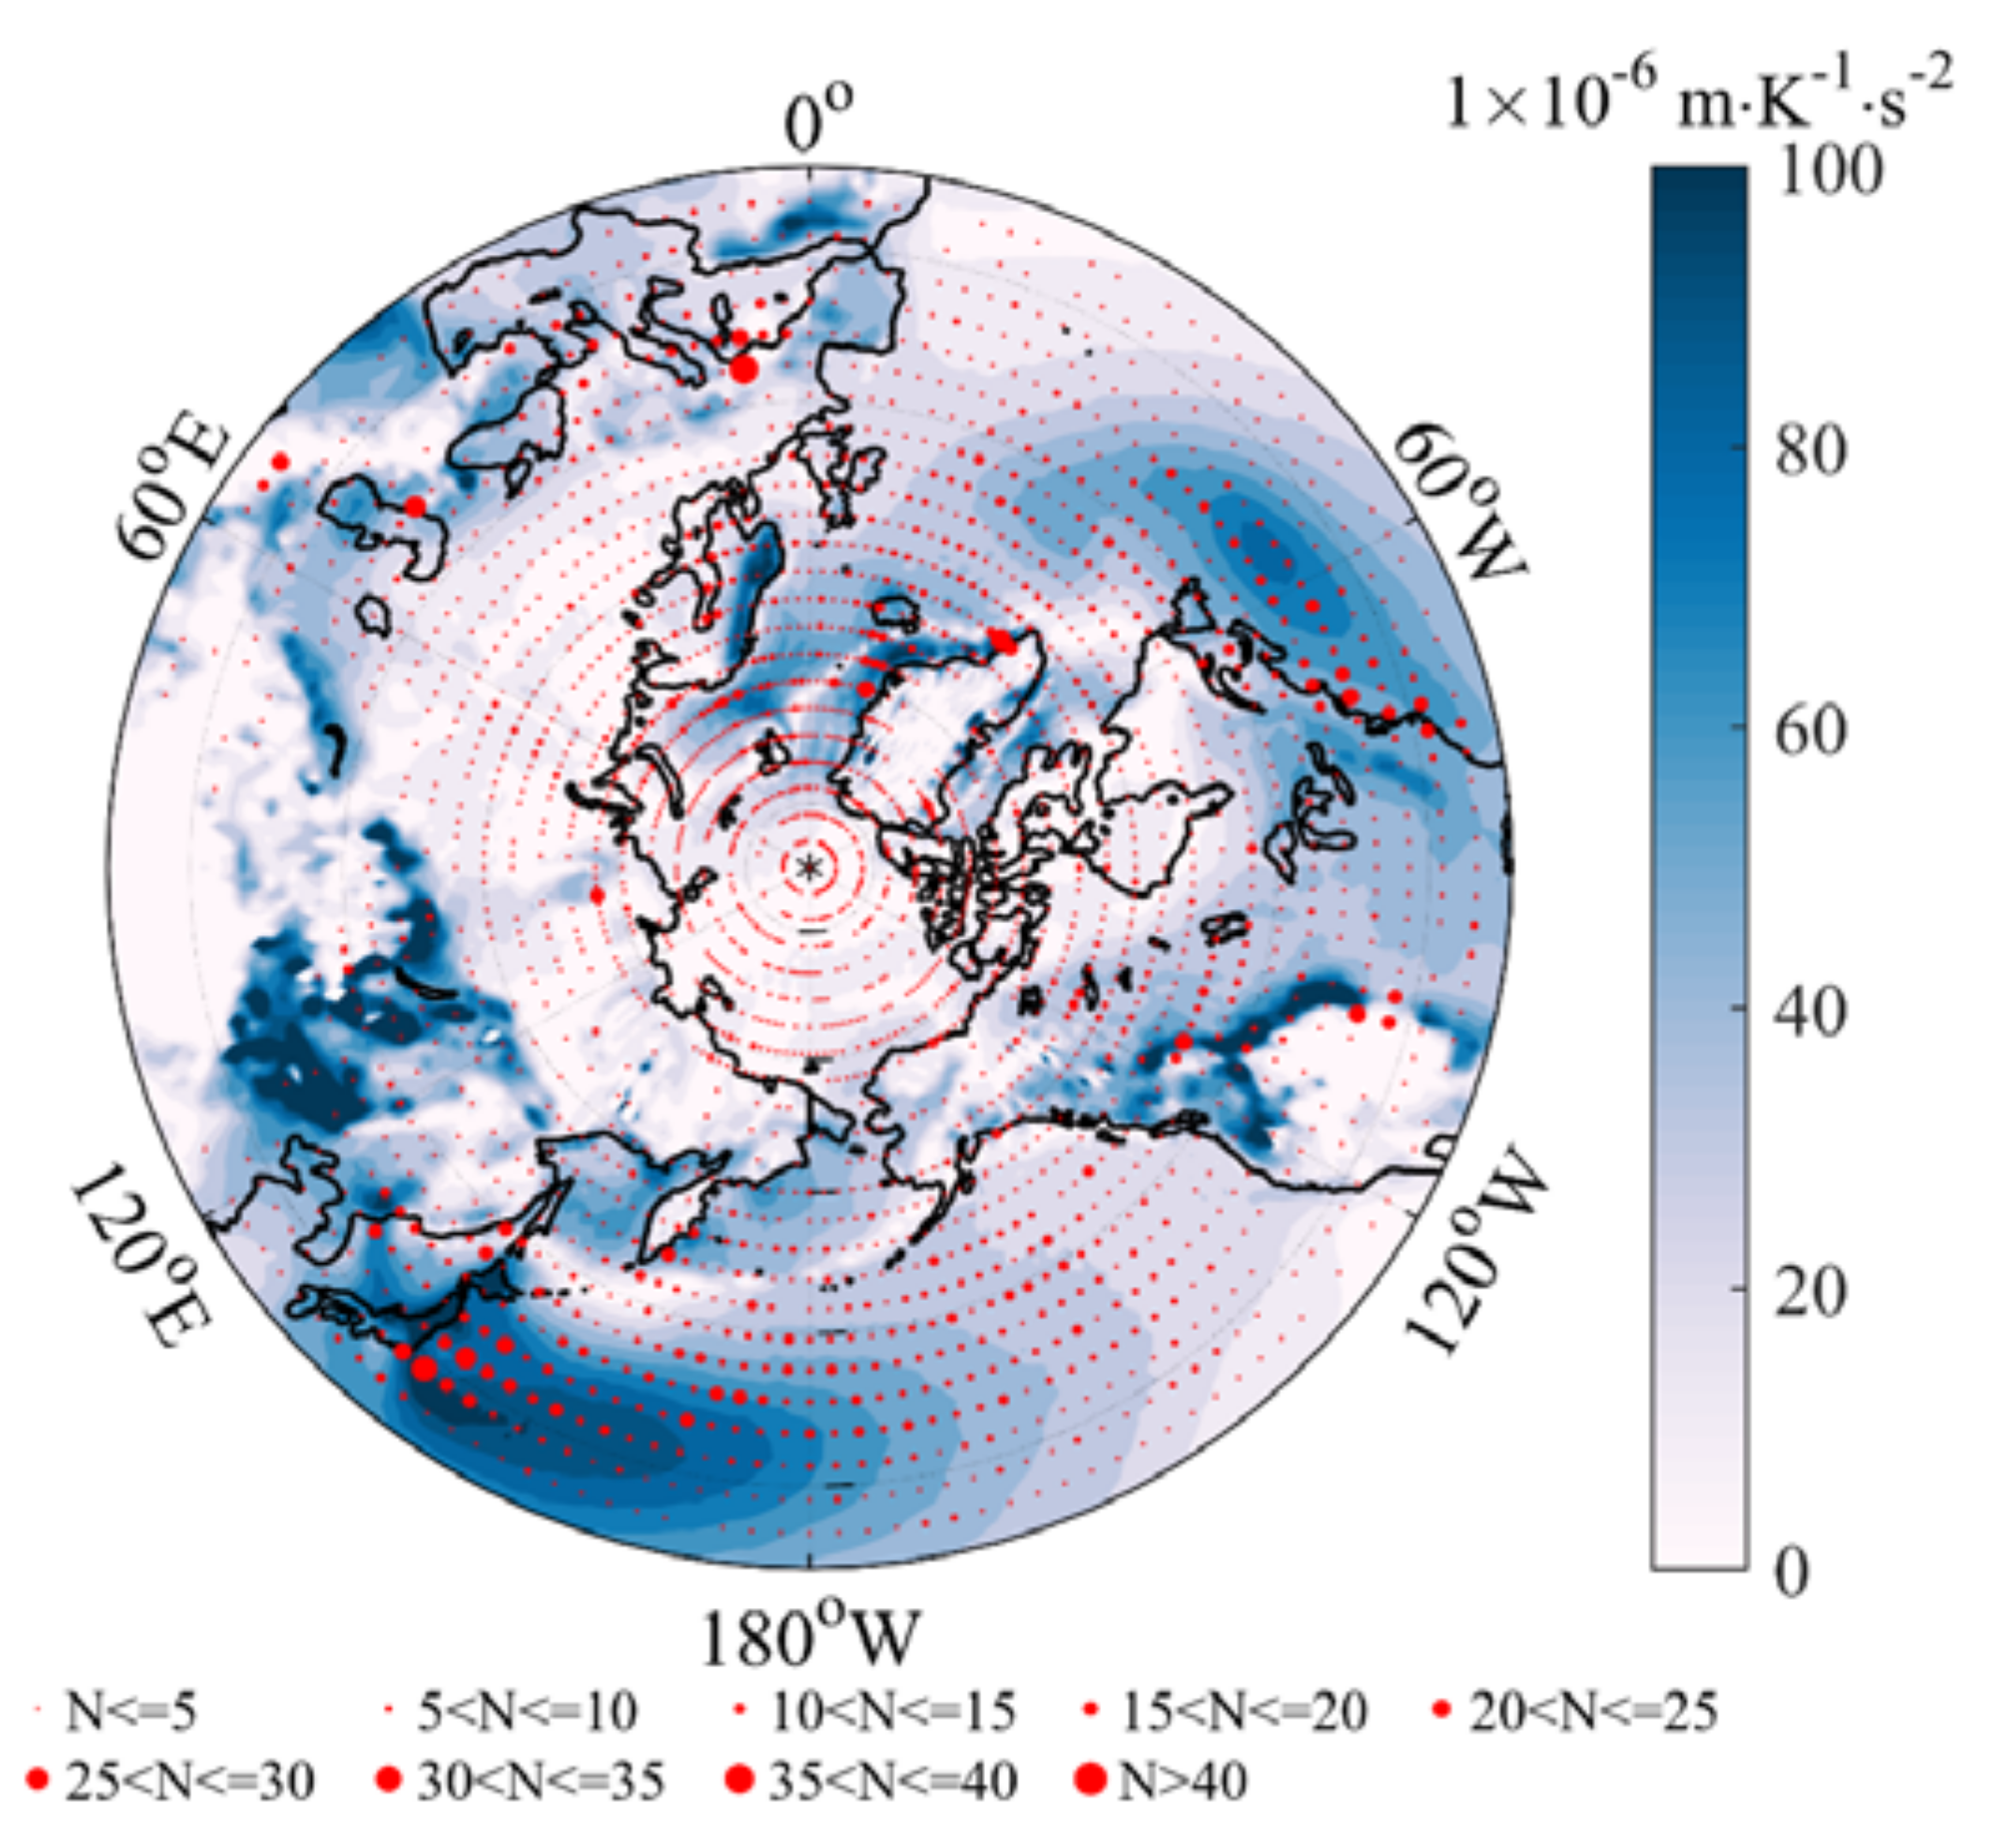
Figure 2.
The regions within which cyclones are selected for this study (the blue boxes), based on the distribution of the number of the cyclone centers (red dots).
Figure 2.
The regions within which cyclones are selected for this study (the blue boxes), based on the distribution of the number of the cyclone centers (red dots).
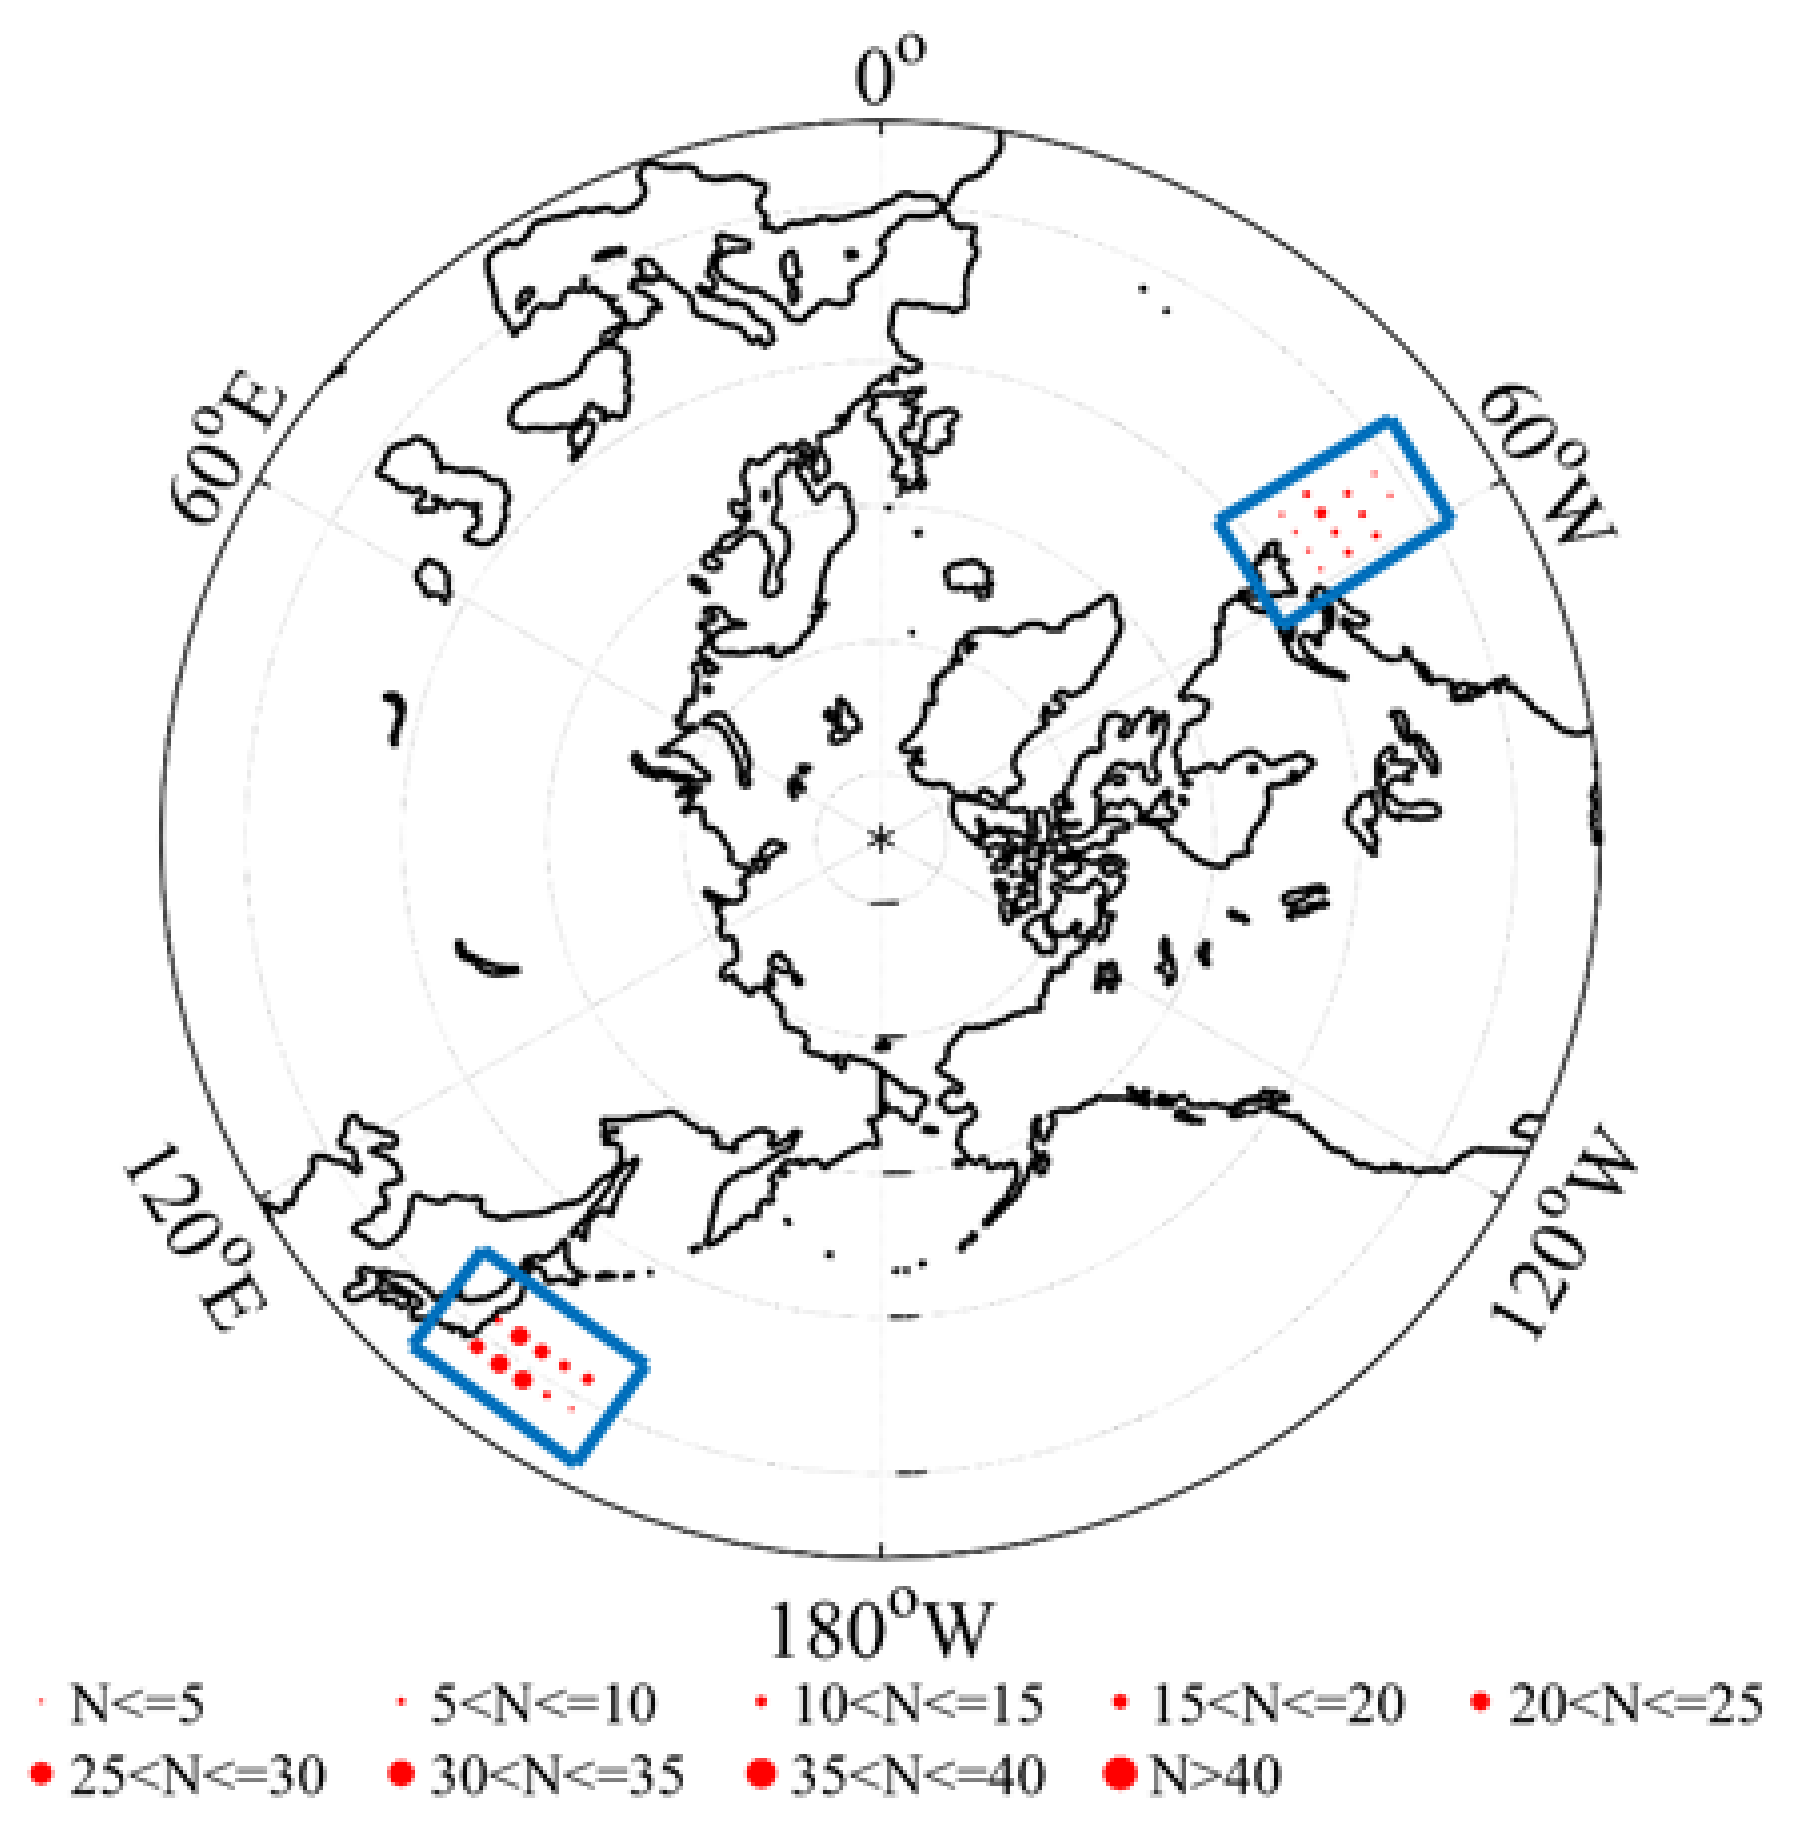
Figure 3.
Composite background geopotential height (black contour, contour interval: 120 gpm at 300 hPa, 60 gpm at 500 hPa and 40 gpm at 850 hPa), the wind vectors (dark gray arrows) and the wind speed (blue shading) at the 300 hPa (a), 500 hPa (c), and 850 hPa (e) levels, respectively, and the temperature (the black contours, contour interval: 4 K) and horizontal meridional temperature gradient (red shading, unit: K/100 km) at the 300 hPa (b), 500 hPa (d), and 850 hPa (f) levels, respectively, on the cyclone onset day, based on the cyclones in the Northwest Pacific. The black circled white balls indicate the center of the cyclone at the sea level.

Figure 4.
Composite background geopotential height (black contour, contour interval: 120 gpm at 300 hPa, 60 gpm at 500 hPa and 40 gpm at 850 hPa), the wind vectors (dark gray arrows) and the wind speed (blue shading) at the 300 hPa (a), 500 hPa (c), and 850 hPa (e) levels, respectively, and the temperature (the black contours, contour interval: 4 K) and horizontal meridional temperature gradient (red shading, unit: K/100 km) at the 300 hPa (b), 500 hPa (d), and 850 hPa (f) levels, respectively, on the cyclone onset day, based on the cyclones in the Northwest Atlantic. The black circled white balls indicate the center of the cyclone at the sea level.

Figure 5.
Composite horizontal distributions of wind vectors (black arrows, unit: m/s), wind speed (colored shading, unit: m/s), and temperature anomaly (black contours, unit: K) at the 300 hPa (a), 500 hPa (b) and 850 hPa (c), respectively, under the cyclone centered coordinate, and composite vertical sections of wind vectors (black arrows, horizontal speed unit: m/s; vertical speed unit: −1 hPa/s), vertical wind speed (color shading, unit: −1 hPa/s), and temperature anomaly (black contours, unit: K) along the 0° latitude (d) and 0° longitude (e) in the cyclone centered coordinate based on the selected cyclones in the Northwest Pacific. The red spot is the center of the extratropical cyclone at the sea level.
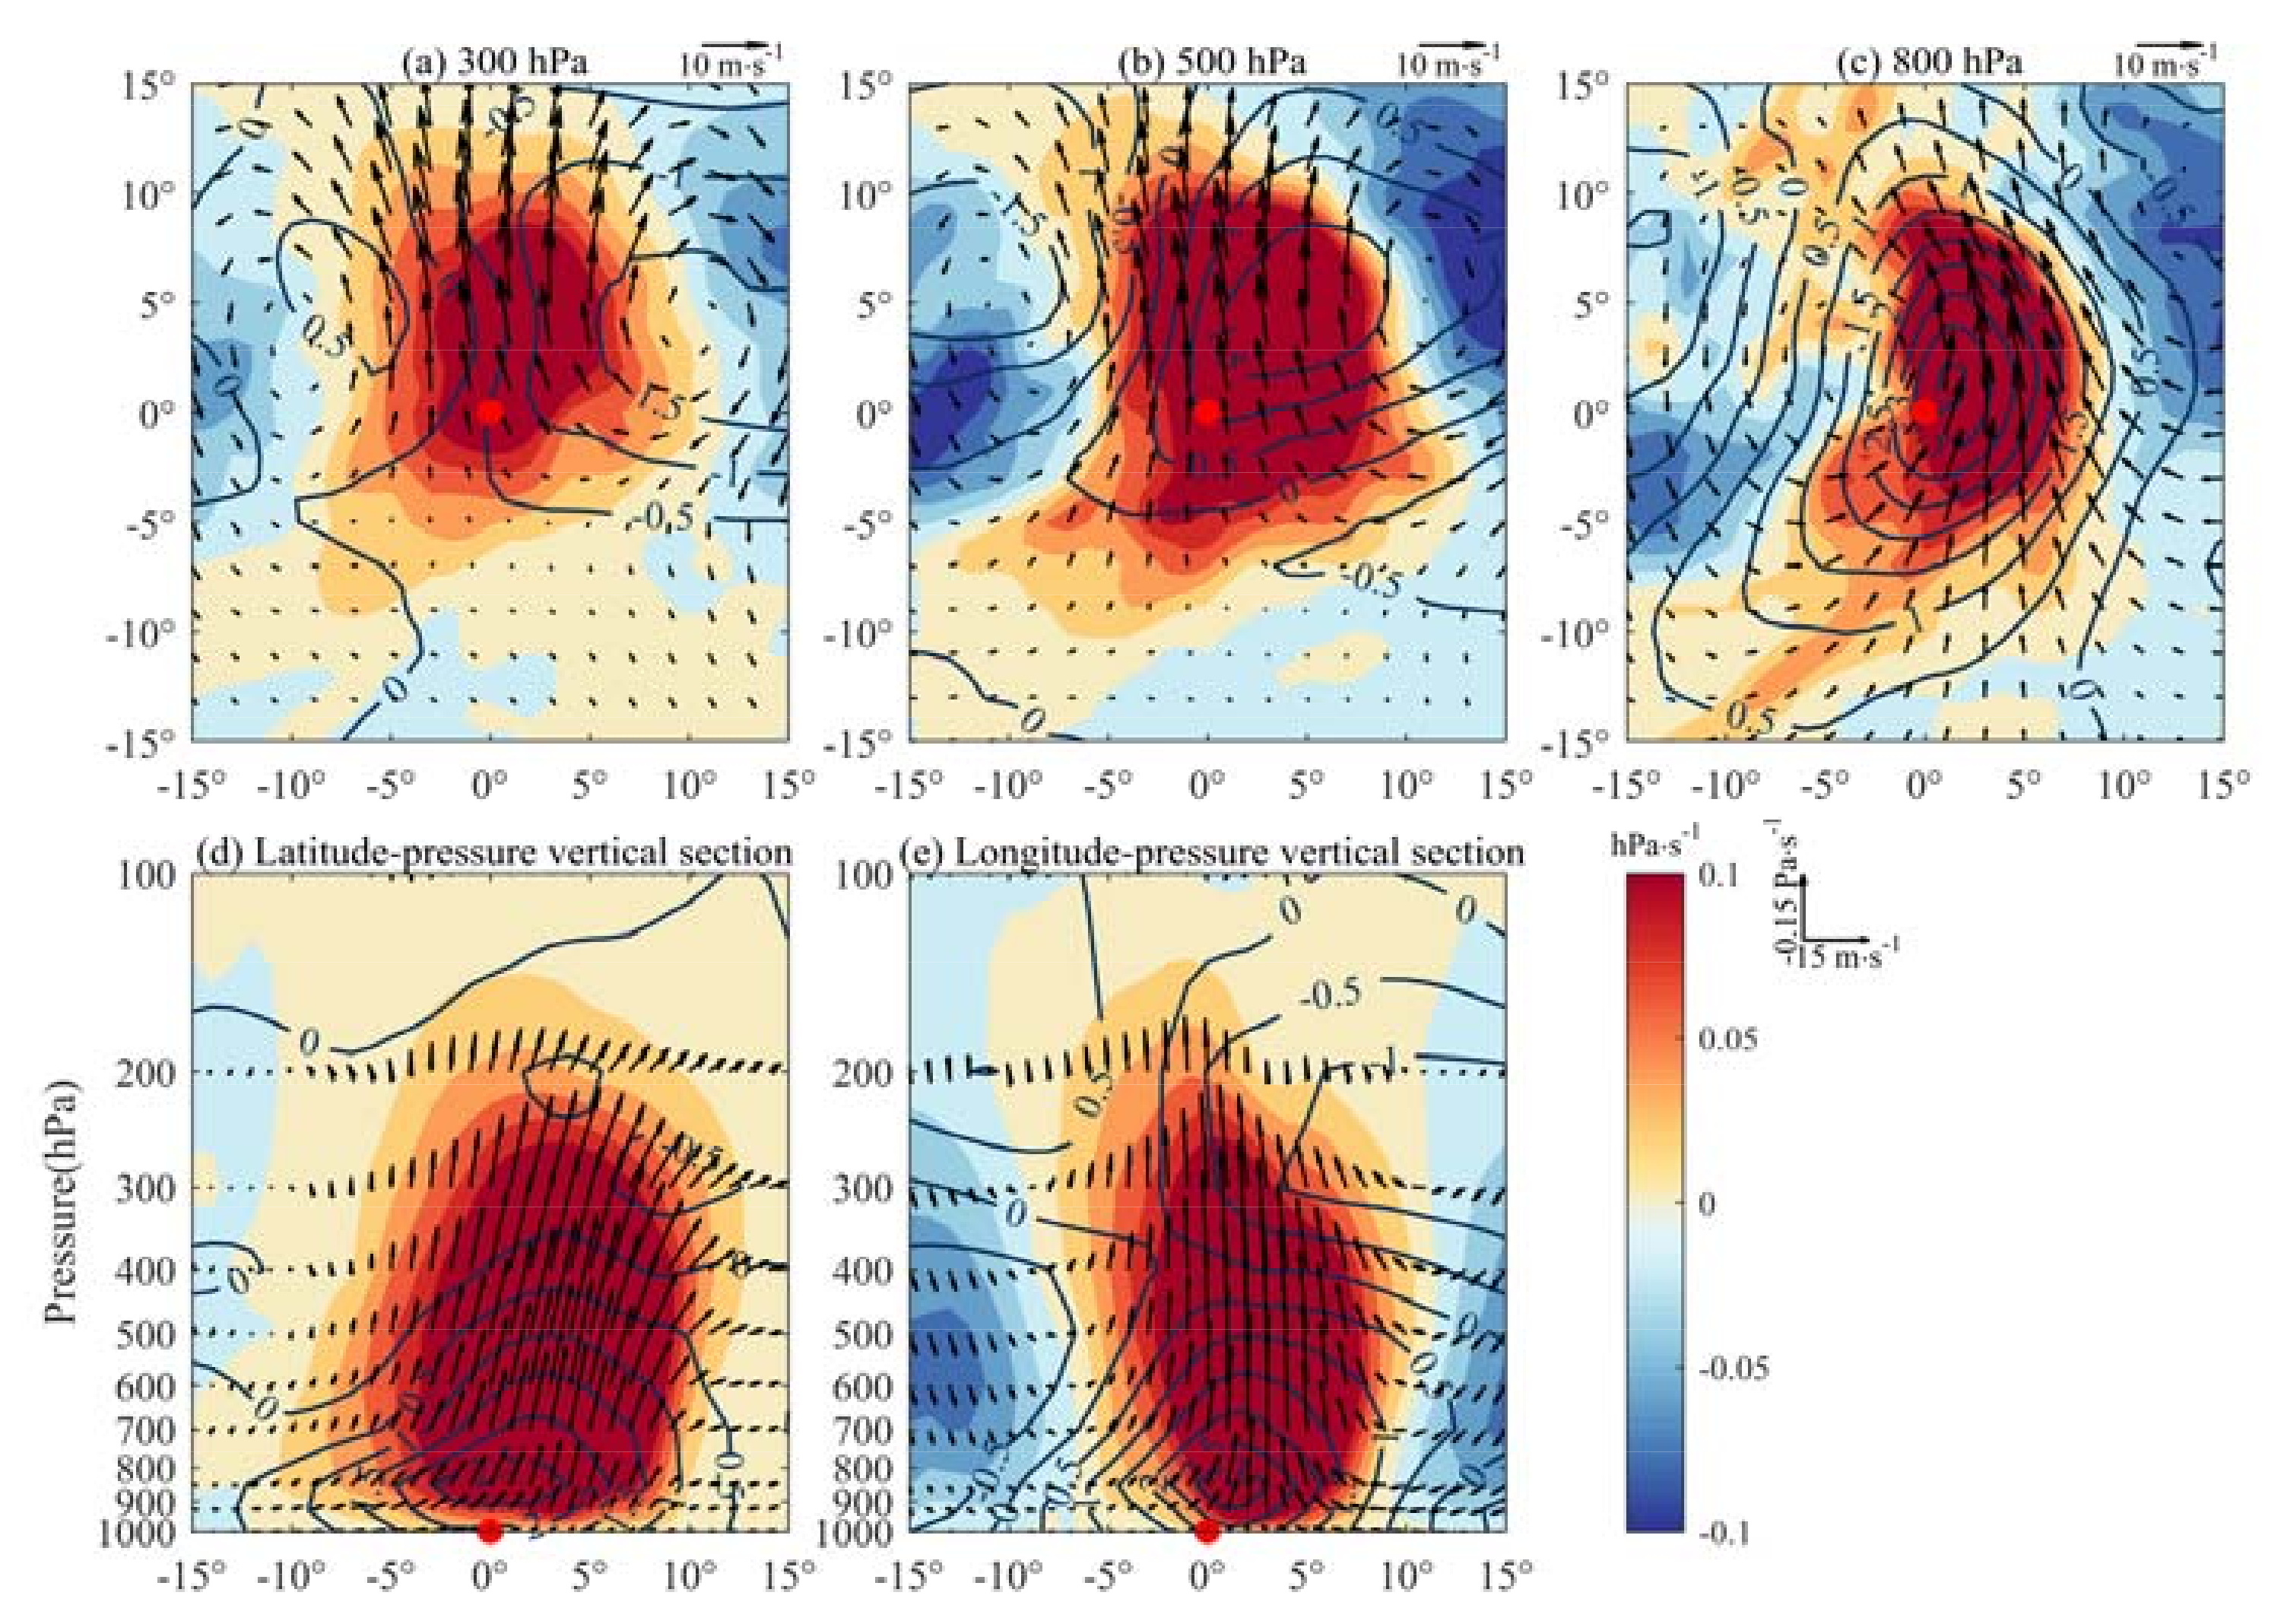
Figure 6.
Composite horizontal distributions of wind vectors (black arrows, unit: m/s), wind speed (colored shading, unit: m/s), and temperature anomaly (black contours, unit: K) at the 300 hPa (a), 500 hPa (b) and 850 hPa (c), respectively, under the cyclone centered coordinate, and composite vertical sections of wind vectors (black arrows, horizontal speed unit: m/s; vertical speed unit: −1 hPa/s), vertical wind speed (color shading, unit: −1 hPa/s), and temperature anomaly (black contours, unit: K) along the 0° latitude (d) and 0° longitude (e) in the cyclone centered coordinate based on the selected cyclones in the Northwest Atlantic. The red spot is the center of the extratropical cyclone at the sea level.

Figure 7.
Composite horizontal distribution of the meridional potential temperature gradient (black contours, unit: 10−6 K m−1), the temperature advection induced vorticity change (the TADV term, color shading, unit: 10−9 s−2) in the cyclone region at the 300 hPa (a), 500 hPa (b) and 850 hPa (c), respectively under the cyclone centered coordinate, and vertical sections of the vertical velocities (contours, unit: −1 hPa/s) and the temperature advection induced vorticity change (the TADV term, color shading, unit: 10−9 s−2) along the 0° latitude (d) and 0° longitude (e) in the cyclone centered coordinate based on the selected cyclones in the Northwest Pacific. The red spot is the center of the extratropical cyclone at the sea level.
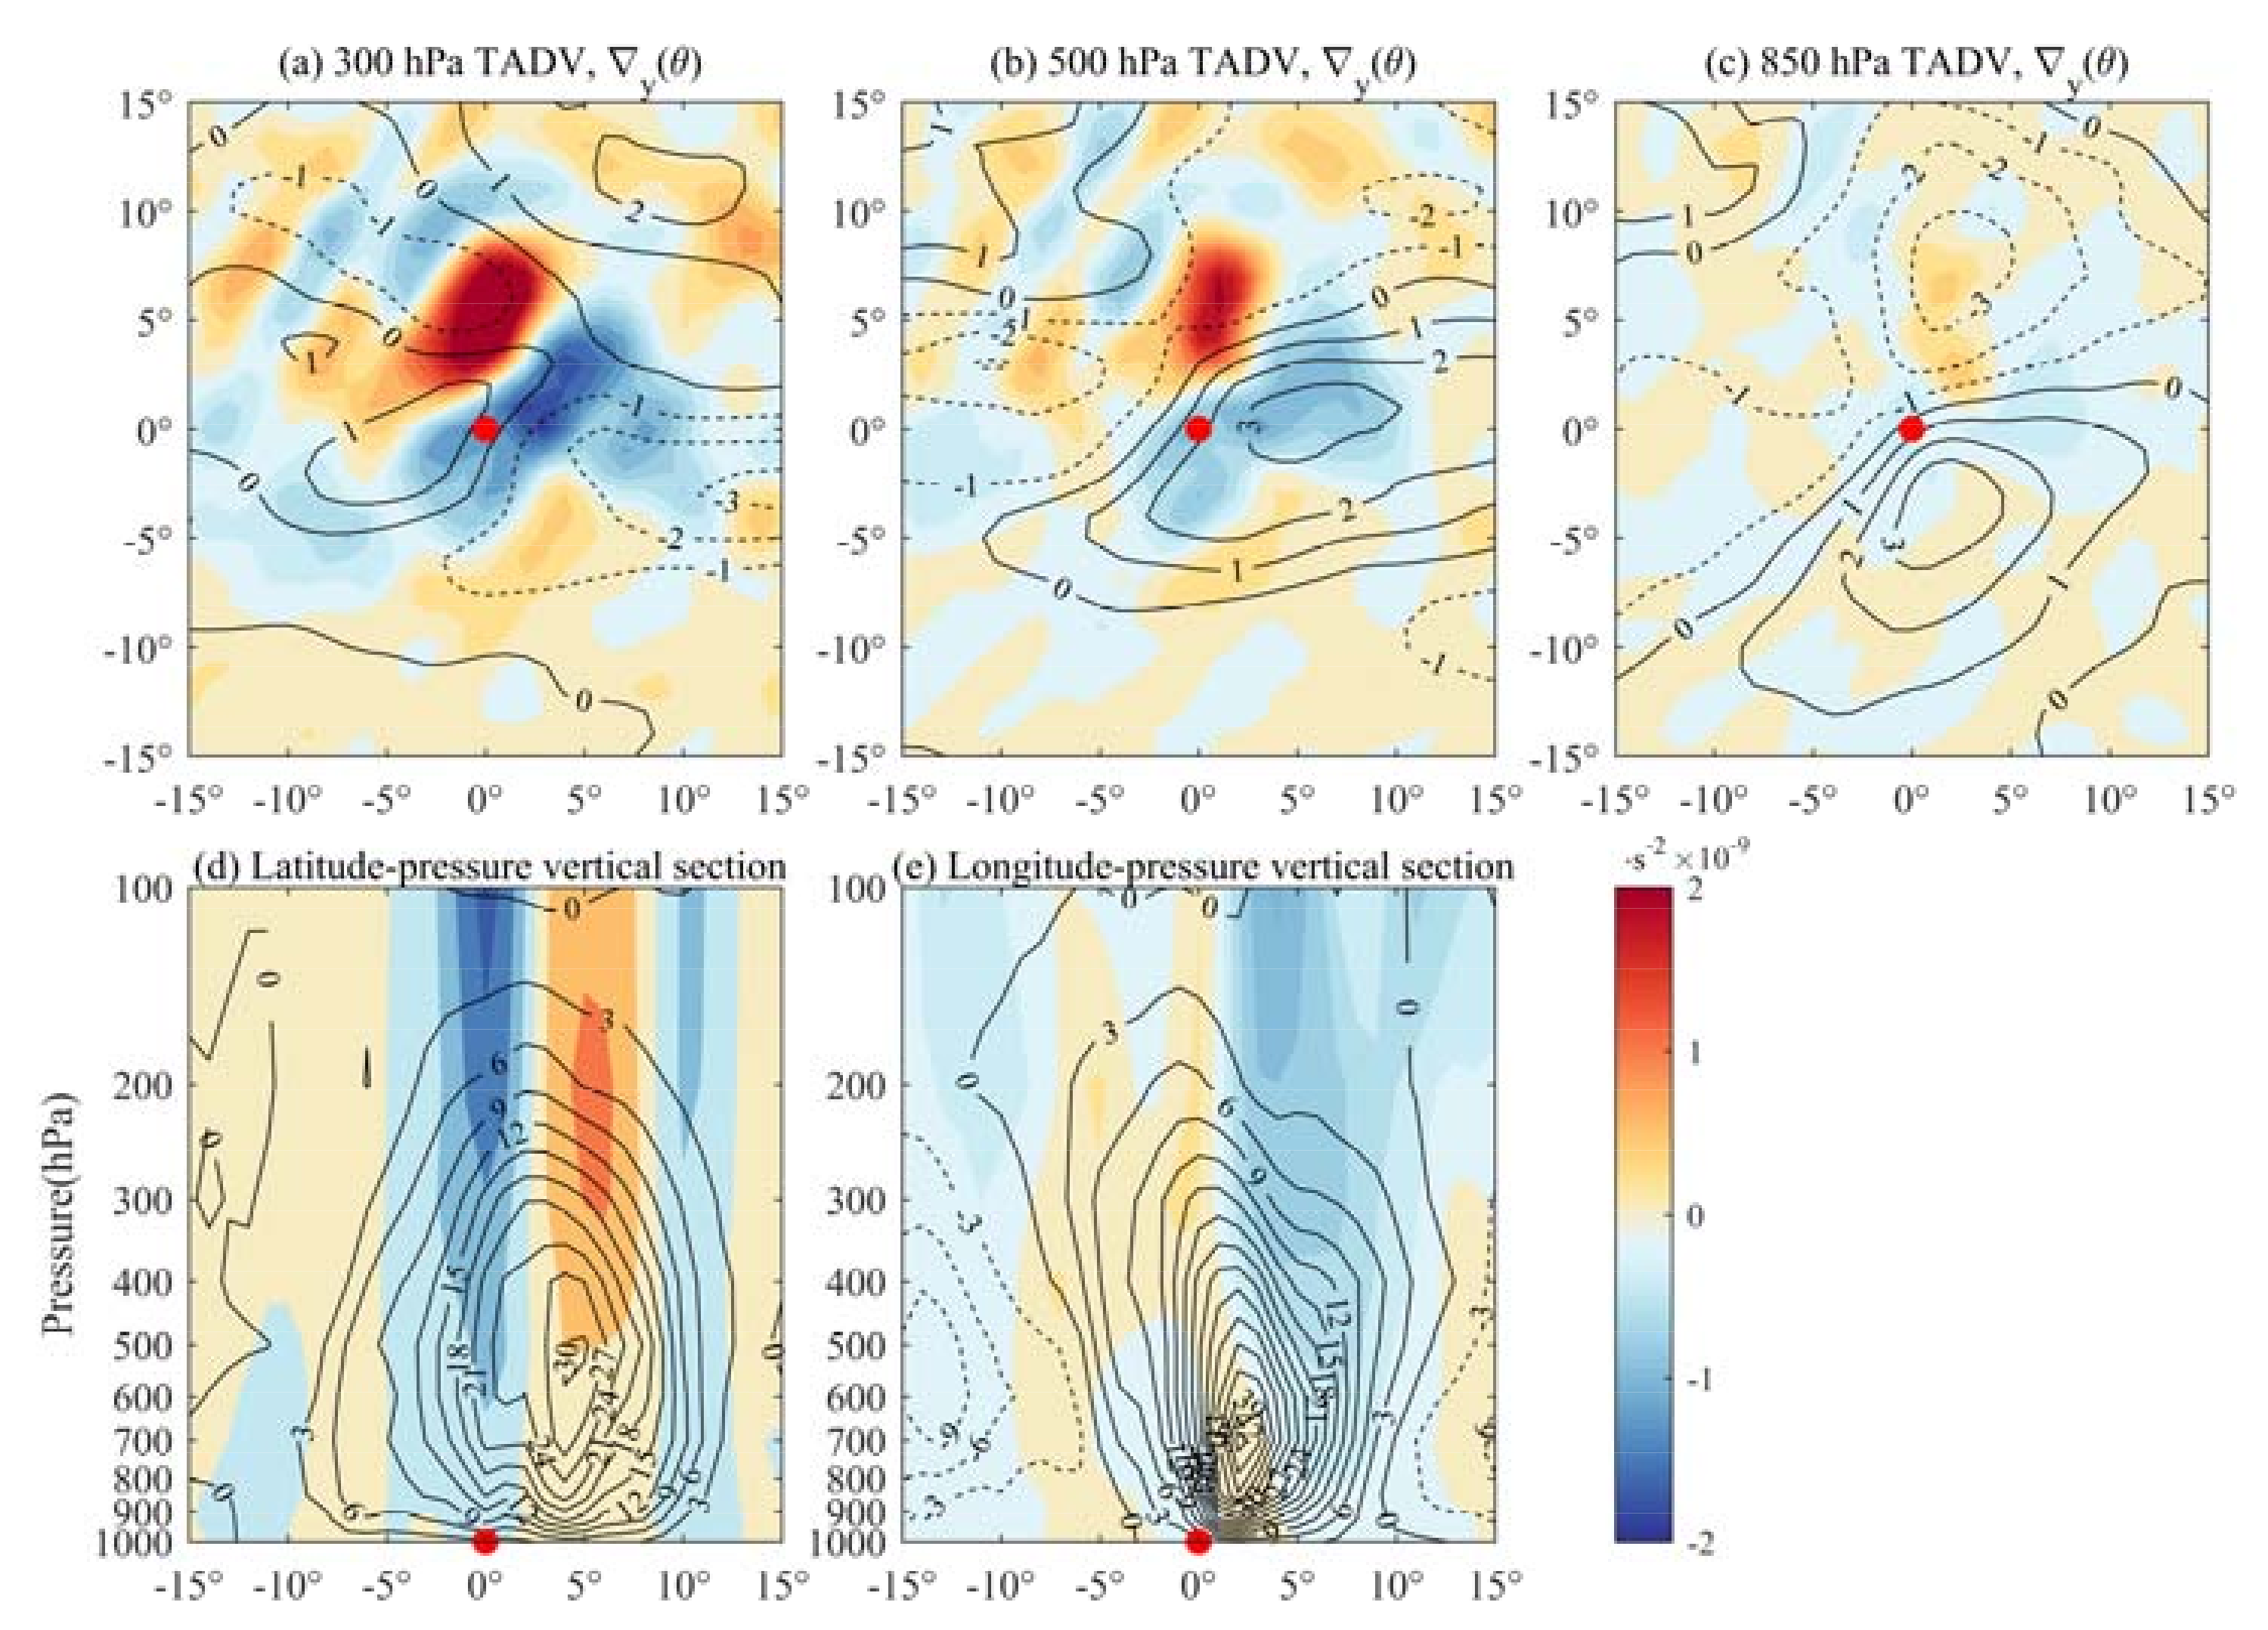
Figure 8.
Composite horizontal distribution of the meridional potential temperature gradient (black contours, unit: 10−6 K m−1), the temperature advection induced vorticity change (the TADV term, color shading, unit: 10−9 s−2) in the cyclone region at the 300 hPa (a), 500 hPa (b) and 850 hPa (c), respectively under the cyclone centered coordinate, and vertical sections of the vertical velocities (contours, unit: −1 hPa/s) and the temperature advection induced vorticity change (the TADV term, color shading, unit: 10−9 s−2) along the 0° latitude (d) and 0° longitude (e) in the cyclone centered coordinate based on the selected cyclones in the Northwest Atlantic. The red spot is the center of the extratropical cyclone at the sea level.

Figure 9.
Composite horizontal distribution of relative vorticities (contours, unit: 10−5 s−1) and the vorticity advection induced vorticity change (the VADV term, color shading, unit: 10−9 s−2) in the cyclone region at the 300 hPa (a), 500 hPa (b) and 850 hPa (c), respectively, under the cyclone centered coordinate, and vertical sections of the vertical velocities (contours, unit: −1 hPa/s) and the vorticity advection induced vorticity change (the VADV term, color shading, unit: 10−9 s−2) along the 0° latitude (d) and 0° longitude (e) in the cyclone centered coordinate, based on the selected cyclones in the Northwest Pacific. The red spot is the center of the extratropical cyclone at the sea level.

Figure 10.
Composite horizontal distribution of relative vorticities (contours, unit: 10−5 s−1) and the vorticity advection induced vorticity change (the VADV term, color shading, unit: 10−9 s−2) in the cyclone region at the 300 hPa (a), 500 hPa (b) and 850 hPa (c), respectively, under the cyclone centered coordinate, and vertical sections of the vertical velocities (contours, unit: −1 hPa/s) and the vorticity advection induced vorticity change (the VADV term, color shading, unit: 10−9 s−2) along the 0° latitude (d) and 0° longitude (e) in the cyclone centered coordinate, based on the selected cyclones in the Northwest Atlantic. The red spot is the center of the extratropical cyclone at the sea level.
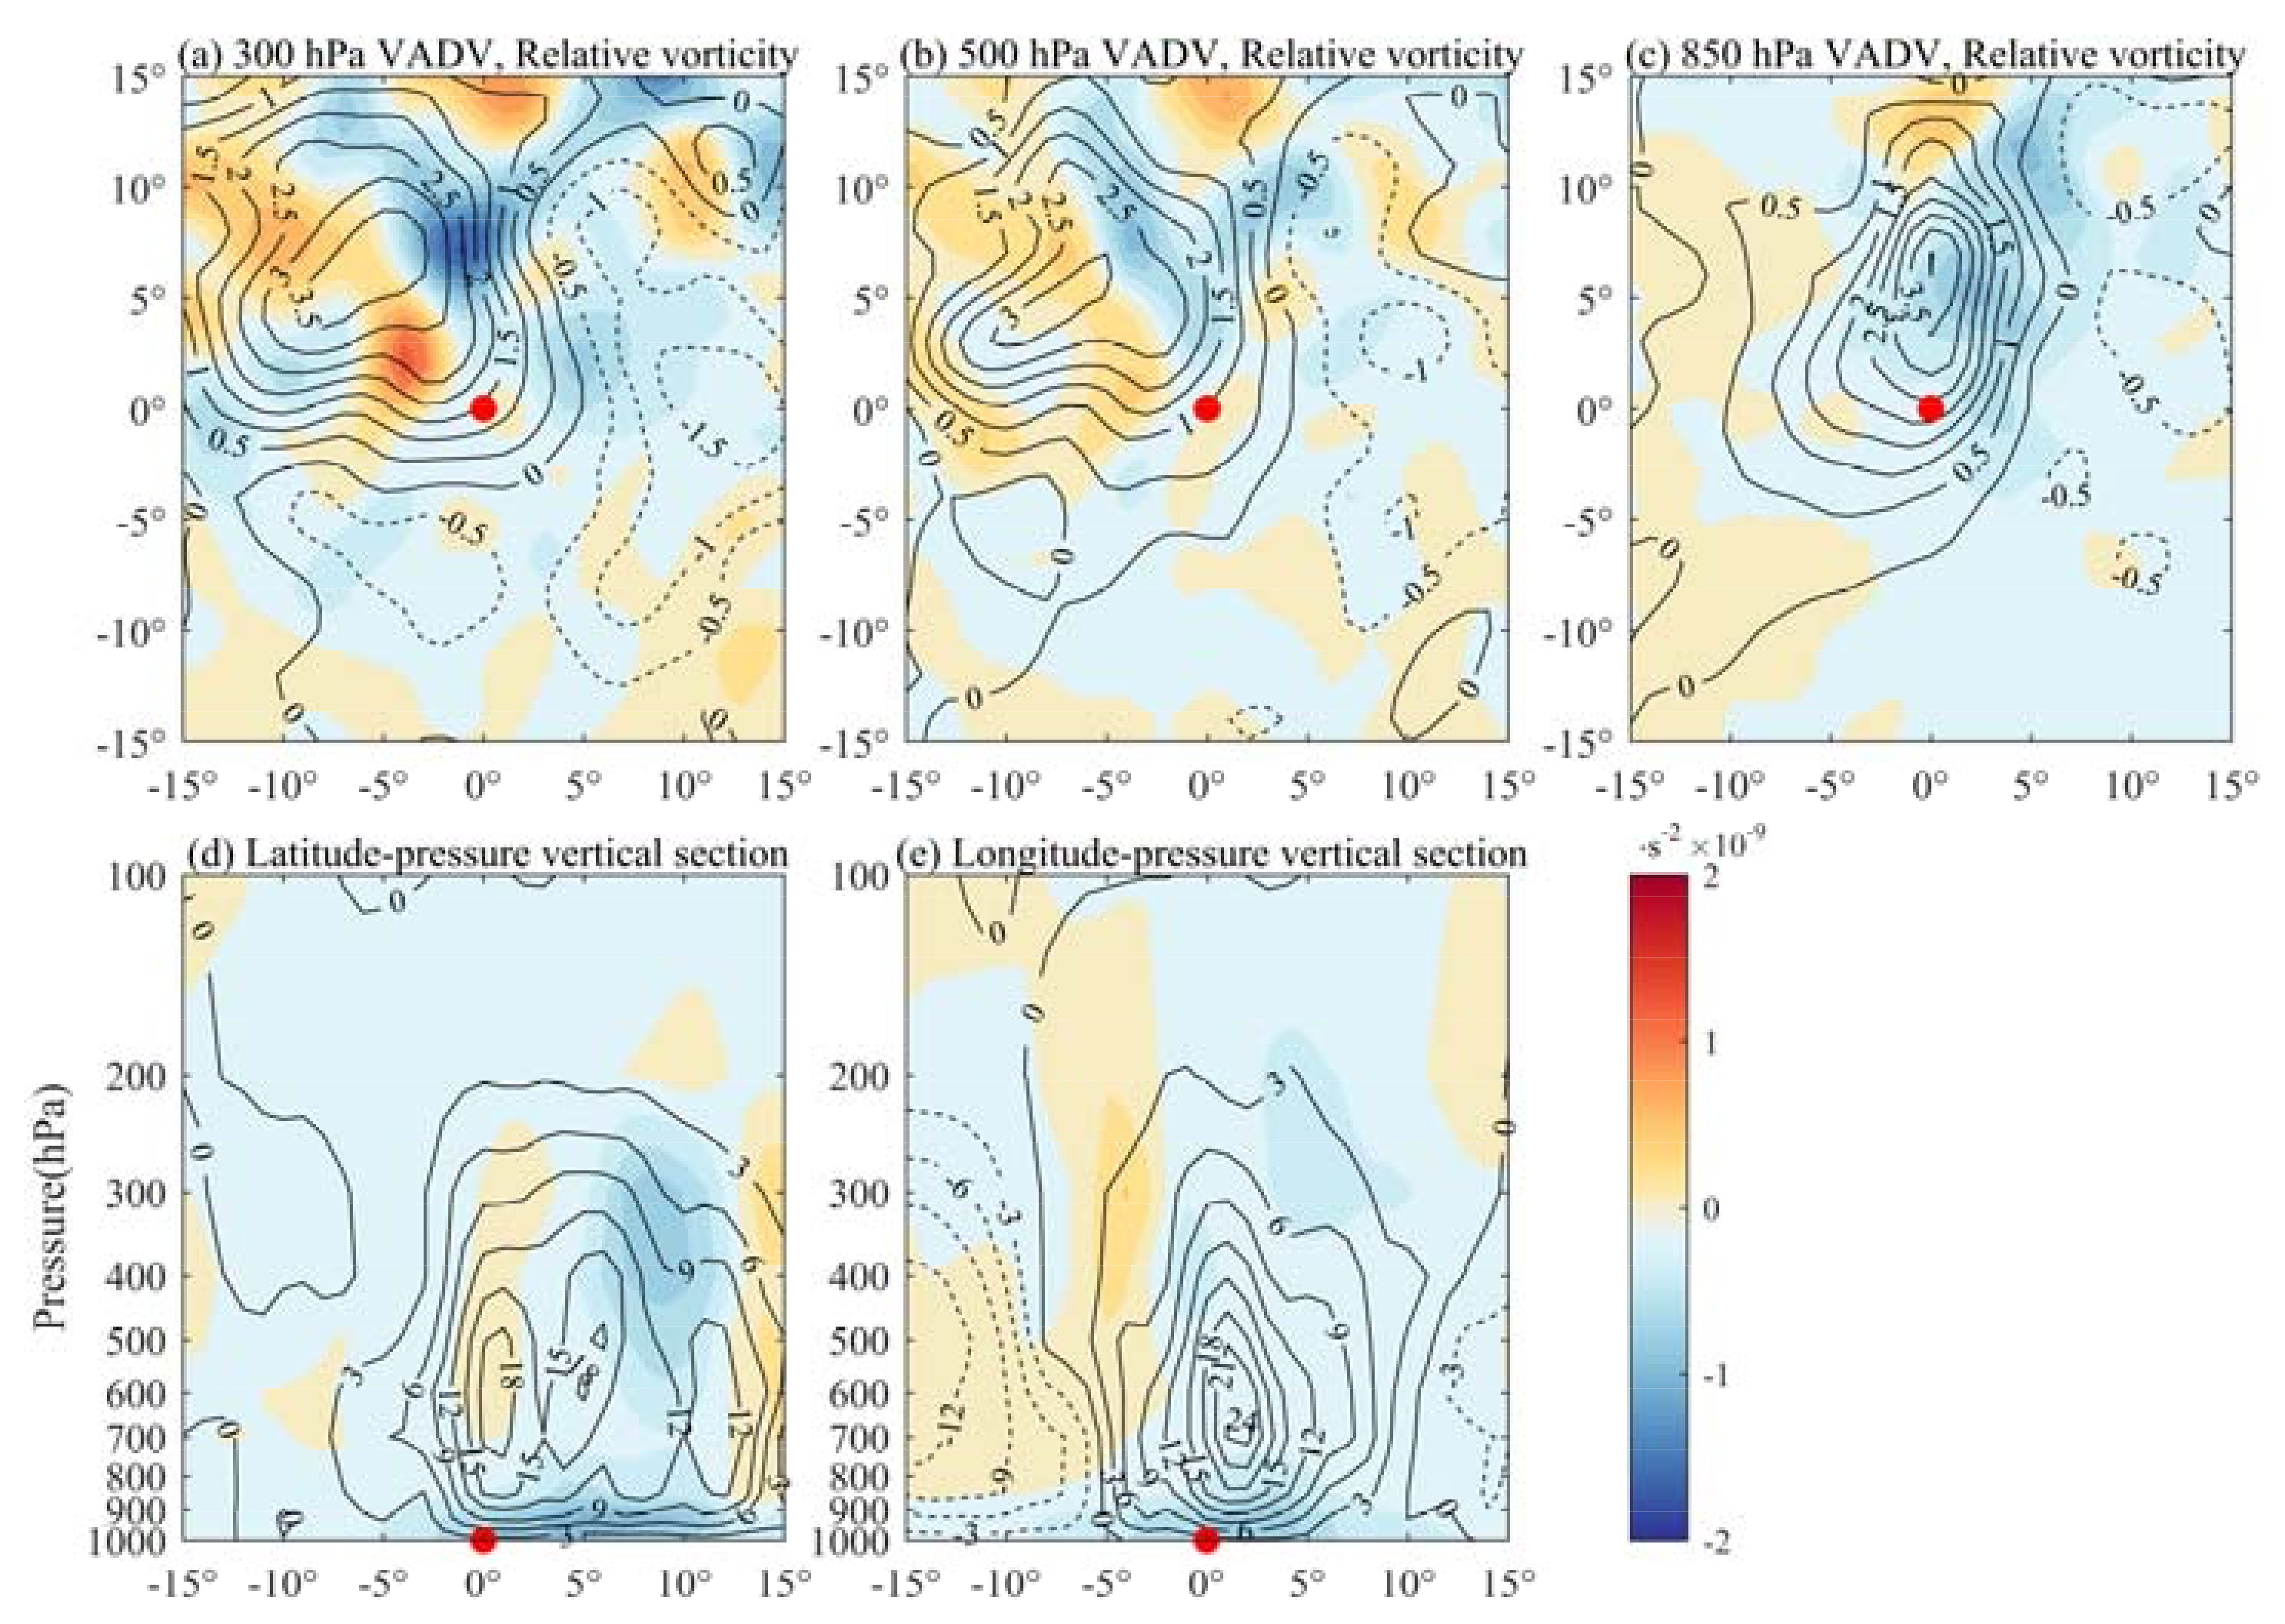
Figure 11.
Composite horizontal distribution of the vertical velocities (contours, unit: −1 hPa/s), and vertical motion induced vorticity change (the ADIA term, color shading, unit: 10−9 s−2) in the cyclone region at the 300 hPa (a), 500 hPa (b) and 850 hPa (c), respectively, in the cyclone centered coordinate, and vertical sections of the vertical velocities (contours, unit: −1 hPa/s) and vertical motion induced vorticity change (the ADIA term, color shading, unit: 10−9 s−2) along the 0° latitude (d) and 0° longitude (e) in the cyclone centered coordinate, based on the selected cyclones in the Northwest Pacific. The red spot is the center of the extratropical cyclone at the sea level.
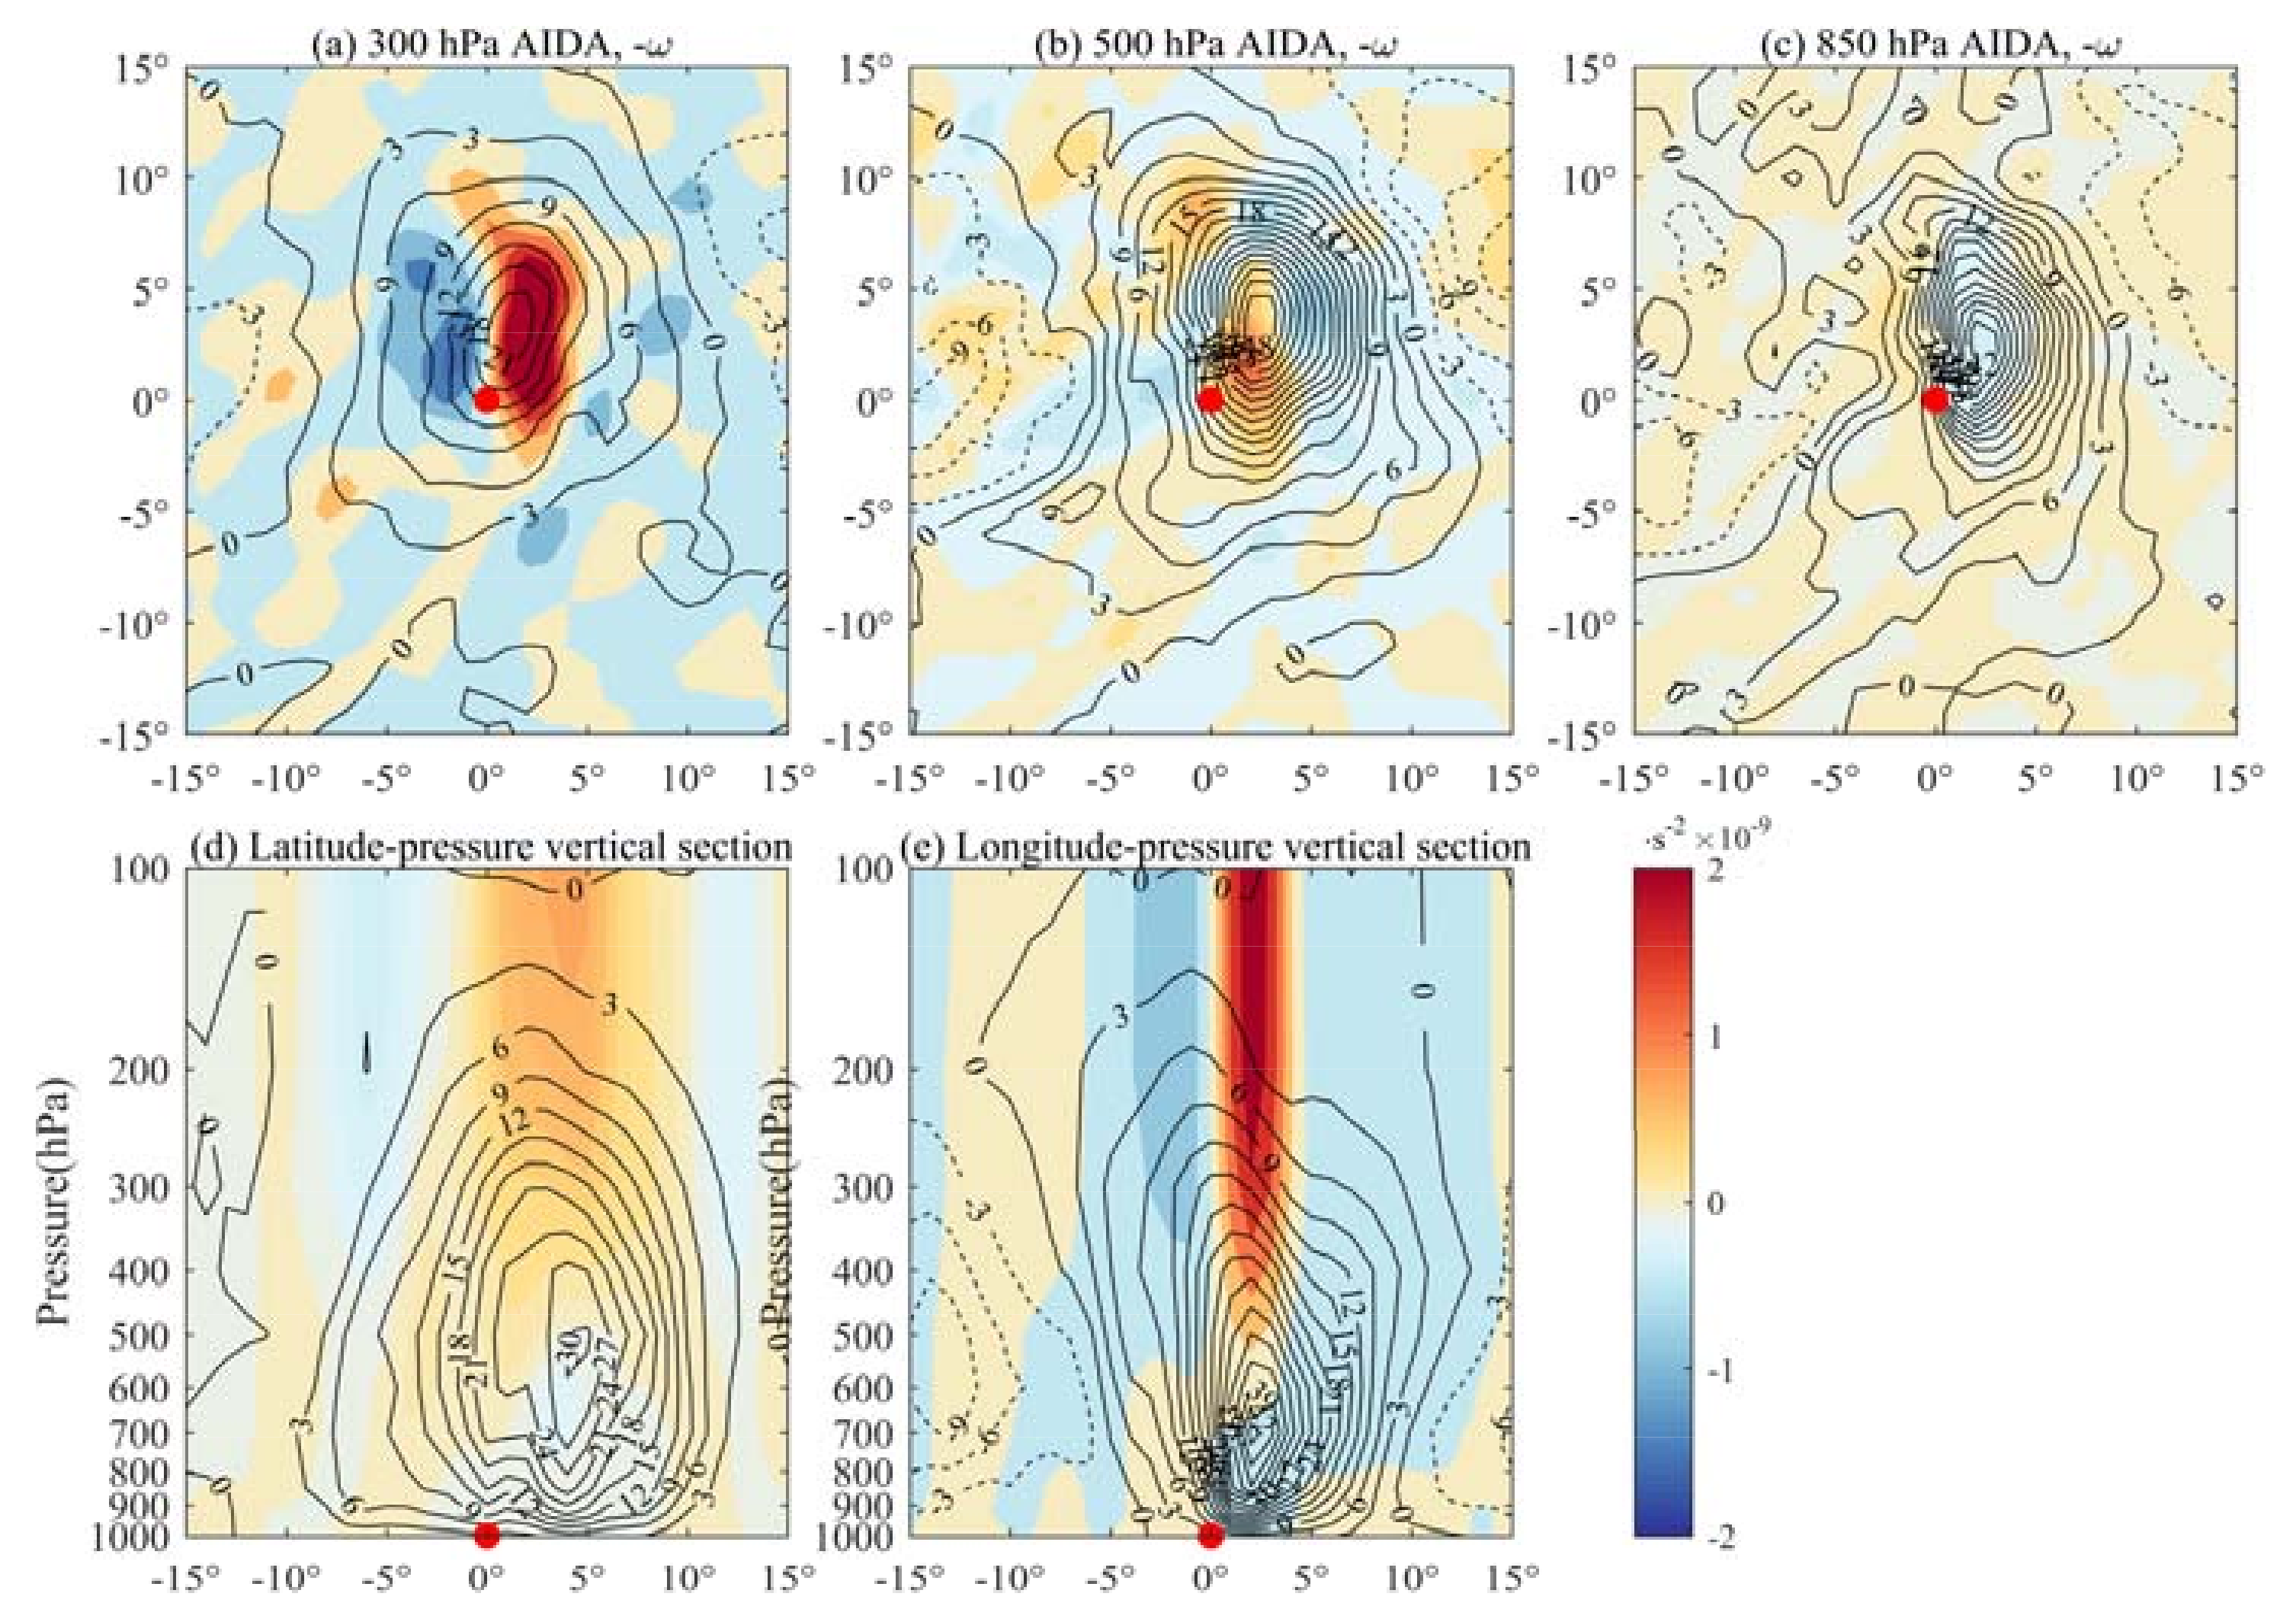
Figure 12.
Composite horizontal distribution of the vertical velocities (contours, unit: −1 hPa/s), and vertical motion induced vorticity change (the ADIA term, color shading, unit: 10−9 s−2) in the cyclone region at the 300 hPa (a), 500 hPa (b) and 850 hPa (c), respectively, in the cyclone centered coordinate, and vertical sections of the vertical velocities (contours, unit: −1 hPa/s) and vertical motion induced vorticity change (the ADIA term, color shading, unit: 10−9 s−2) along the 0° latitude (d) and 0° longitude (e) in the cyclone centered coordinate, based on the selected cyclones in the Northwest Atlantic. The red spot is the center of the extratropical cyclone at the sea level.

Figure 13.
Scatter plots of the TADV term and the vorticity tendency (black dots), the VADV term and the vorticity tendency (red dots), and the ADIA term and the vorticity tendency (blue dots) based on the cyclones in the Northwest Pacific. The solid lines are the linear regressions.
Figure 13.
Scatter plots of the TADV term and the vorticity tendency (black dots), the VADV term and the vorticity tendency (red dots), and the ADIA term and the vorticity tendency (blue dots) based on the cyclones in the Northwest Pacific. The solid lines are the linear regressions.

Figure 14.
As in Figure 11, but based on the cyclones in the Northwest Atlantic.
Figure 14.
As in Figure 11, but based on the cyclones in the Northwest Atlantic.

Publisher’s Note: MDPI stays neutral with regard to jurisdictional claims in published maps and institutional affiliations. |
© 2021 by the authors. Licensee MDPI, Basel, Switzerland. This article is an open access article distributed under the terms and conditions of the Creative Commons Attribution (CC BY) license (https://creativecommons.org/licenses/by/4.0/).
Share and Cite
MDPI and ACS Style
Gong, Q.; Diao, Y.; Sun, R.; Xiong, X.; Sun, J. Diagnostic Analysis of the Generative Mechanism of Extratropical Cyclones in the Northwest Pacific and Northwest Atlantic. Atmosphere 2021, 12, 1326. https://doi.org/10.3390/atmos12101326
AMA Style
Gong Q, Diao Y, Sun R, Xiong X, Sun J. Diagnostic Analysis of the Generative Mechanism of Extratropical Cyclones in the Northwest Pacific and Northwest Atlantic. Atmosphere. 2021; 12(10):1326. https://doi.org/10.3390/atmos12101326
Chicago/Turabian StyleGong, Qinglong, Yina Diao, Ruipeng Sun, Xuejun Xiong, and Jilin Sun. 2021. "Diagnostic Analysis of the Generative Mechanism of Extratropical Cyclones in the Northwest Pacific and Northwest Atlantic" Atmosphere 12, no. 10: 1326. https://doi.org/10.3390/atmos12101326
Note that from the first issue of 2016, this journal uses article numbers instead of page numbers. See further details here.