
Air Quality in Windsor (Canada) and Impact of Regional Scale Transport

Department of Civil and Environmental Engineering, University of Windsor, Windsor, ON N9B 3P4, Canada
*
Author to whom correspondence should be addressed.
Atmosphere 2021, 12(10), 1300; https://doi.org/10.3390/atmos12101300
Submission received: 10 September 2021
/
Revised: 2 October 2021
/
Accepted: 4 October 2021
/
Published: 6 October 2021
(This article belongs to the Special Issue Air Quality Management)
Abstract
:Air Quality Health Index (AQHI) is a scale designed in Canada to help residences understand the impact of air quality on health. This study investigated temporal variability of daily AQHI and impact of regional transport on AQHI in Windsor, Ontario, Canada from 2016 to 2019. The four-year average daily AQHI was 2.9, slightly below the upper limit of the low health risk level of 3. AQHI value decreased from 2.95 to 2.81 during the study period, indicating the improvement of air quality. Half of the days, AQHI were 3 regardless of season. AQHI was higher in the warm season (3.1) than in the cold season (2.6) due to more frequent moderate risk days (27%, AQHI = 4) in warm season and more frequent low risk days (42%, AQHI = 2) in the cold season. Among the three pollutants considered, O3 was the most frequently reported dominant contributor to daily AQHI (88% of days), followed by NO2 (12%), especially in the cold season, with small contribution from PM2.5 (<1%). Trajectory analysis found that AQHI ≤ 3 days were closely associated with air masses from the north and northwest, whereas AQHI > 3 days were closely associated with air masses from the west and southwest. This is because northerly flows brought in clear air mass owing to less industrial facilities. Polluted air masses were transported from the south of Windsor, where several industrial states of the US were located. Directional AQHI resembles O3 more than NO2 or PM2.5 concentrations do. Further improvement of AQHI in Windsor could be challenging because O3 concentrations have continued to increase in recent years. Thus, more effective control measures to mitigate O3 pollution are warranted to reduce its impact on human health and the environment.
1. Introduction
Air pollution is the biggest environmental risk to human health. Approximately 90% of the world population breathes air that does not meet the World Health Organization’s air quality guidelines [1]. In 2015, the estimated worldwide premature death attributable to air pollution was 8.8 million people [2]. Major health effects include respiratory and cardiovascular illness through both short-term and long-term exposure to air pollution. Recent studies have observed those adverse health effects occurring at low concentration levels, suggesting no safe exposure levels, even at the otherwise considered relatively clean areas [3].
To assess air quality, monitoring stations have been in operation all over the world. As outlined in an Ontario Ministry of the Environment, Conservation and Parks (MECP) report [4], six air pollutants were considered in air quality index (AQI) in Canada. They are fine particulate matter (PM2.5), ground-level ozone (O3), nitrogen dioxide (NO2), sulfur dioxides (SO2), carbon monoxide (CO) and total reduced sulfur compounds (TRS). The concentration of each pollutant was compared with its standard. The AQI is reported as the number corresponding to the concentration of a pollutant that is highest relative to its standard. When communicating with the public, the numeric AQI was classified into five descriptive categories: “very good”, “good”, “moderate”, “poor” and “very poor” [4,5]. The AQI categories are often accompanied by corresponding health advice [4,5,6]. There are three key weaknesses associated with the AQI: (1) the inability to capture the overall health effects of multiple pollutants due to reliance on the worst offending pollutant, (2) the inability to reflect the apparent no-threshold concentration-response relationship between air pollution and human health, and (3) a lack of well-developed health messages [3,5,7].
To overcome the limitations of AQI, Health Canada and Environment Canada have developed a numerical index called Air Quality Health Index (AQHI), which represents the local air quality and its health impact on residents’ health. The AQHI values are derived by drawing on two modes of assessment: (1) measuring the cumulative health effects of three pollutants—O3, PM2.5 and NO2 [3], and (2) observing short-term health effects in terms of mortality or morbidity using exposure-response relationship between air pollution and health from a time-series study of 12 major cities in Canada. These three pollutants were selected because they best represented health risks based on epidemiologic studies conducted in Canada [3]. In comparison with AQI, AQHI is readily understood by non-expert; therefore, it is easier to communicate the air pollution health risks to the public, especially presenting separate messages for the at risk and the general populations [5,7]. Researchers in other countries, including China [8,9] and Sweden [10], have explored the constructions of air quality health indexes using pollutant concentrations and risk-coefficients of different health outcomes obtained from local health datasets.
In Ontario, Canada, AQHI has been implemented since June 2015 to replace AQI [4]. While the incorporation of three contaminants—O3, PM2.5 and NO2—effectively captures the health impact of air pollution mixtures, the impact of regional transport on local air quality could be less apparent due to a strong influence of local emissions and a relatively short atmospheric lifetime of NO2 (approximately hours). The objective of this study is to evaluate the temporal variability of AQHI and the impact of regional transport on air quality in Windsor, Ontario, Canada during the period of 2016–2019 by using observed AQHI, O3, PM2.5 and NO2 concentrations and trajectory modeling. Windsor was selected as the study city because it is at the Canada-U.S. border. Transboundary sources contributed to over 80% of the annual PM2.5 concentrations and nearly 40% of ozone levels on high ozone concentration days [4].
2. Method
2.1. Data Source and General Statistics
There are two monitoring stations in Windsor: Windsor Downtown Station and Windsor West Station. The Windsor Downtown Station (Figure 1) was chosen because it is in a more densely populated area and therefore is more likely to have an impact on human life. Daily AQHI values from 2016 to 2019 were downloaded from Ontario’s AQHI Historical Data Archive [11]. The hourly index values were calculated using O3, PM2.5 and NO2 concentrations and rounded to the nearest non-zero integers. The AQHI value at 4 p.m. local time was designated as daily AQHI by Ontario MECP [12]. There are four AQHI categories: (1) values between 1–3 are considered low risk, (2) 4–6 are moderate risk, (3) 7–10 are high risk and (4) greater than 10 are very high risk [4,5,7]. Hourly concentrations of O3, PM2.5 and NO2 were downloaded from National Air Pollution Surveillance Program website [12]. Four-year, annual, warm (April to September) and cold (October to March) seasons average AQHI values were calculated. The number of days with different AQHI values from one to seven was counted.
2.2. Air Trajectory Simulation
The internet-based Hybrid Single Particle Lagrangian Integrated Trajectory (HYSPLIT) model [13] was used to simulate 24-h backward trajectory of each day with AQHI available from 2016 to 2019. HYSPLIT’s backward trajectory model simulates the air mass’s motion routes before they arrive at a particular start point [14,15]. The model has been widely employed to investigate regional transport of air pollutants [16,17,18,19].
The North American Mesoscale Forecast System (NAM) 12 km meteorological dataset was used because of its high spatial resolution. The start point is Windsor Downtown Station (42.316° N, 83.0437° W). The start time was set at 4:00 p.m. local time when daily AQHI was calculated. The start height of trajectory was half of the boundary layer height, and the run time of 24-h was selected to represent regional transport and take into consideration the relatively short atmospheric lifetimes of NO2 and O3. In addition to graphic trajectory files, outputs in Google Earth (kmz) format were saved.
2.3. Analysis of Trajectories
The trajectories were analyzed to investigate the association between air mass movement and air quality in Windsor during the cold season and the warm season from 2016 to 2019. Each trajectory was classified into four groups according to the AQHI value of that date: (1) AQHI < 3, (2) AQHI = 3, (3) AQHI = 4 and (4) AQHI = 5. Each group of trajectories were displayed on a Google Earth map to enable assessment of air mass origins and pathways, as well as comparison among the four AQHI groups.
The direction of each back trajectory was recorded by overlaying it on a compass with 36-bins in 10° intervals. When a 24-h trajectory passed through several 10-degree sectors, only the first segment (0–6 h) of the trajectory was used to determine the direction of the air mass. An example is shown in Figure S1. The 36 directional average AQHI and O3, PM2.5, and NO2 concentrations used to calculate the AQHI at 4 p.m. local time were computed, and the percentages of trajectories from different directions were calculated for each air mass direction. The 36 air mass directions were further classified into eight categories: (1) north (340–20°), (2) northeast (30–60°), (3) east (70–110°), (4) southeast (120–150°), (5) south (160–200°), (6) southwest (210–240°), (7) west (250–290°) and (8) northwest (300–330°).
3. Results and Discussion
3.1. General Assessment of Air Quality in Windsor
The four-year average AQHI was 2.9, slightly lower than the upper limit of the low health risk level of 3, indicating air quality in Windsor was fairly good with relatively low health risk. However, the AQHI value is likely higher compared with other stations in Ontario. Liang et al. [20] report that two regions registered the highest annual mean AQHI values (2.8–3.0) in Ontario in 2014: the central east region, which includes Toronto, and the southwest region, which includes Windsor. During 2016–2019, 1428 daily AQHIs were recorded in Windsor Downtown Station. Among those, the AQHIs were at the low health risk level (AQHI = 1, 2 or 3) in 82% of days, only a few days at high risk level (AQHI = 7), the rest were at moderate health risk level (AQHI = 4, 5, 6) (Figure 2a). This is consistent with data that the Ministry of the Environment and Climate Change collected in 2018, which suggests that low risk air quality hours occurred 93% of the time, followed by moderate risk hours (7%), with fewer high-risk hours (<1%) in Ontario [21]. The year-to-year variability was small with annual means decreasing from 2.95 in 2016 to 2.81 in 2019. AQHI was higher in the warm season than that during the cold season (3.1 vs. 2.6). This is because there were more moderate-risk days (27%, AQHI = 4) in the warm season and more frequent low-risk days (42%, AQHI = 2) in the cold season. This is attributable to two reasons, (1) O3 concentrations were higher in the warm season due to higher ambient temperature and intense solar radiation, and (2) O3 was the primary contributor to AQHI in Windsor (88% of days). Similar seasonal trends of AQHI have been reported by To et al. [22] using AQHI data at 42 stations in Ontario during 2003–2010 with higher AQHI values in spring (3.8 ± 1.1) and summer (3.73 ± 1.4) and lower AQHI in fall (3.0 ± 1.1) and winter (3.3 ± 1.0). As shown in Figure 2b,c, half of the days AQHI were 3 regardless of season. However, AQHI value of 2 were more frequent in the cold season, while the warm season recorded more days with AQHI = 4 and all days with AQHI = 5, 6 or 7.
3.2. Back Trajectories by AQHI Group
Days with AQHI values of 6 or 7 were excluded from further analysis due to the small sample size (N = 3). The percentages of air mass directions in each AQHI group are illustrated in Figure 3. Figure 4, Figure 5, Figure 6 and Figure 7 present back trajectory maps in each AQHI group. There were 453 back trajectories (green lines, Figure 4) with daily AQHI < 3, twice as much in the cold season than in the warm season (308 vs. 145). Air masses came from all directions, but more trajectories and their 24-h endpoints were located in the area between the north and northwest of Windsor (Figure 3). Thus, low AQHI days were associated with clean air masses that originated from north and northwest of Windsor.
Figure 5 depicts back trajectories (348 in the warm season and 364 in the cold season) with AQHI = 3. Days with AQHI = 3 were associated more with air masses from the northwest, west and southwest. Compared to the AQHI < 3 group, there were lower percentages of air masses from the northwest and higher percentages of air masses from the west and southwest (Figure 3), leading to slightly increased air pollution in Windsor, although AQHI = 3 is still a low-risk value. This is not unexpected because there are several industrial states of the US located in the south and southwest of Windsor (Figure 1); thus, regional transport of polluted air masses from these directions led to worse air quality [19,23].
Figure 6 illustrates air trajectories (pink lines) with AQHI = 4, denoting that there were fewer in the cold season than in the warm season (38 vs. 193). The air mass origins and pathways are mainly observed on the west and southwest of Windsor (Figure 3). This was not unexpected because air masses from west and southwest brought polluted and hot air masses, leading to higher O3 concentrations in Windsor [19] and thus higher AQHI values. The Commission for Environmental Cooperation (CEC) also confirmed that long-range transport contributed significantly to O3 in eastern North America, specifically, pollutants being transported from the upper Midwest US and the Ohio River Valley across the Southern Ontario and the northeastern US [24].
Figure 7 shows back trajectories with AQHI = 5, all in the cold season. Five trajectories were from the north, east and southeast of Windsor; the remaining 24 trajectories were from the west and southwest of Windsor (Figure 3). Thus, polluted air masses were mainly from the west and southwest of Windsor leading to a relatively high AQHI value of 5 in Windsor. Further, the lengths of the 24-h trajectories are significantly shorter than those with AQHI ≤ 4 (Figure 4, Figure 5 and Figure 6), indicating that slow moving air masses also contribute to polluted air due to weak dispersions. This is consistent with findings of a study of trans-boundary air pollution in Ontario. It was demonstrated that elevated O3 and PM2.5 are generally associated with slow-moving high-pressure systems in the lower Great Lakes area [23].
3.3. Directional Average AQHIs and Pollutant Concentrations
The prevailing air mass direction was southwest-west during the study period of 2016–2019 (Figure S2). Among the eight air mass directions, air masses from southeast, south, southwest and west directions (Figure 8) were more polluted, consequently, had a higher probability (28–33%) of moderate health risk days (AQHI ≥ 4) and a lower probability (17–20%) of low health risk days (AQHI ≤ 2) than all other directions (9–15% and 37–43%, respectively). Approximately half (45–55%) of the air masses were associated with AQHI = 3 regardless of directions. Consequently, AQHI = 3 could be considered the background levels. Since AQHI was 1 or 5 in few days (Figure 2), the directional average AQHI was controlled by the frequency of AQHI = 2 and AQHI = 4 days. This is consistent with directional O3 concentrations in Windsor, where higher O3 concentrations were associated with air masses from the south and west, whereas lower O3 concentrations were associated with air masses from the north [19].
The impact of air mass movement on Windsor air quality and AQHI is further demonstrated in Figure 9. PM2.5 concentrations were more sensitive to the air mass direction, with higher concentrations associated with air masses from the south to west direction. However, the distribution of AQHI closely resemble that of O3 concentrations. This is because, in 88.2% of days, O3 was the primary contributor to daily AQHI. There were 157 days (11.6% of all days) when NO2 was the primary contributor to AQHI, and 154 of them were in the cold season (22% of cold season days). PM2.5 was the primary contributor to AQHI in only two days, all in the cold season. The results of our analysis suggest that the daily AQHIs in Windsor reflect primarily the O3 concentrations and to a much lesser degree the NO2 concentrations in the cold season. Other evidence of daily AQHI being dictated by O3 concentrations include two patterns. First, the directional AQHI pattern (Figure 8) is consistent with directional O3 concentrations in Windsor presented by Zhang et al. [19], who found that lower O3 concentrations in Windsor were associated with air masses from the north, while higher O3 concentrations were associated with air masses from the south and southwest. Second, the seasonal AQHI pattern is in agreement with seasonal O3 concentrations reported by Xu et al. [25], who found that O3 concentrations were higher in summer and lower in winter. However, the strong dependency of PM2.5 concentrations on regional transport is not shown in directional AQHI. Compared with an analysis of AQHI data from 2003–2010 [5], the frequency of NO2 as the top contributor to daily AQHI has decreased substantially, from 51% to 12%, while that of O3 has increased substantially, from 49% to 88%. This is not unexpected because the annual mean NO2 had decreased significantly by 33%, while annual mean O3 concentration had increased significantly by 6.4% during 2009–2018 in Windsor [21]. Ontario experienced a 24% reduction in hourly AQHI value from 2003 to 2014 [20]. However, further improvement of AQHI in Windsor or other Ontario cities beyond the 2020 could be challenging. Using the AQHI formula in Stieb et al. [7], a 10% reduction of NO2 from 11 ppb (the annual mean in Ontario in 2018 [21]) combined with a 10% increment of O3 from 27 ppb (the annual mean in Ontario in 2018 [21]) lead to a 2.7% increase in AQHI.
4. Conclusions
The study investigated temporal variability of daily AQHI and the impact of regional transport on AQHI in Windsor from 2016 to 2019. The air quality was fairly good with a four-year average AQHI of 2.9, indicating relatively low health risk. Improving air quality was observed in Windsor, with the annual AQHI decreased from 2.95 in 2016 to 2.81 in 2019. Daily AQHI was higher in the warm season (3.1) and lower in the cold season (2.6) due to more frequent AQHI ≥ 4 days in the warm season (31% vs. 5%) and more AQHI ≤ 2 days in the cold season (43% vs. 20%). This trend is primary driven by two key factors: (1) the seasonal variability of ground-level O3 concentration with higher values in the warm season, and (2) O3 being the primary contributor to daily AQHI in Windsor in 88% of days.
Among the three pollutants considered, O3 was the dominant contributor to daily AQHI, followed by NO2 especially in the cold season, with small contribution from PM2.5. In the past two decades, NO2 concentrations had decreased significantly and O3 concentrations had increased, resulting in daily AQHI being less reliance on NO2 (from 51% of days being the primary contributor during 2003–2010 to 12% during 2016–2019) and more on O3 concentrations (49% to 88%).
HYSPLIT trajectories revealed daily AQHI was 3 in half of the days regardless of season or air mass direction. Air masses from west and southwest of Windsor had a higher probability (28–33%) of greater AQHI values (4 or 5) and lower probability (17–20%) of smaller AQHI values (≤ 2) than other directions (9–15% and 37–43%, respectively). In other words, Windsor’s air quality is strongly influenced by several industrial states of the US located in the west and southwest and polluted air masses are therefore being transported to Windsor through the prevailing wind direction. Further, the study hypothesis was accepted: The impact of regional transport on AQHI was less apparent. The strong dependency of PM2.5 concentrations on air mass direction was not reflected in the directional distribution of daily AQHI, which closely resembled that of O3 concentrations.
Overall, O3 concentrations dictate the daily AQHI values, the seasonal variability of AQHI, and the impact of regional transport on AQHI in Windsor. This makes further reductions of AQHI challenging because O3 concentrations will likely continue to increase as a result of weakened NO titration effect, which is a consequence of less consumption of O3 by NO [25] and more hot days because of climate change. The predominant and increasing contribution of O3 to AQHI calls for more effective control measures to mitigate O3 pollution and its impact on human health and the environment. Future studies should explore two important phenomena: (1) whether the seasonal trend of AQHI and the increasing reliance of AQHI on ambient O3 observed in Windsor have occurred in other Canadian cities, and (2) how the relative contributions of each AQHI related pollutant (NO2, PM2.5 and O3) have evolved over time and the driving forces causing those changes.
Supplementary Materials
The following are available online at https://www.mdpi.com/article/10.3390/atmos12101300/s1, Figure S1: Example of air trajectory direction measurement. The start is Windsor. The direction is recorded as 220 degrees, Figure S2: Wind rose at Windsor 2016–2019.
Author Contributions
Conceptualization, methodology, funding acquisition, supervision, project administration, X.X.; data curation and model simulations, Y.C., R.T.; writing—original draft preparation, review and editing, T.Z., X.X.; visualization, T.Z., Y.C. All authors have read and agreed to the published version of the manuscript.
Funding
This research was funded by the Natural Sciences and Engineering Research Council of Canada.
Data Availability Statement
Publicly available datasets were analyzed in this study. Daily AQHI values in Windsor, Ontario during 2016-2019 can be found at: http://www.airqualityontario.com/aqhi/search.php. Hourly O3, PM2.5, and NO2 concentrations in Windsor, Ontario during 2016-2019 can be found at: https://data.ec.gc.ca/data/air/monitor/national-air-pollution-surveillance-naps-program/Data-Donnees/?lang=en.
Acknowledgments
The authors gratefully acknowledge the NOAA Air Resources Laboratory (ARL) for the provision of the HYSPLIT transport and dispersion model and READY website (http://www.ready.noaa.gov, last accessed on 7 September 2021) used in this publication. The authors want to thank Jason Horn at University of Windsor for his assistance.
Conflicts of Interest
The authors declare no conflict of interest.
References
- World Health Organization (WHO). Air pollution in the Western Pacific. 2020. Available online: https://www.who.int/westernpacific/health-topics/air-pollution (accessed on 7 September 2021).
- Lelieveld, J.; Pozzer, A.; Pöschl, U.; Fnais, M.; Haines, A.; Münzel, T. Loss of life expectancy from air pollution compared to other risk factors: A worldwide perspective. Cardiovasc. Res. 2020, 116, 1910–1917. [Google Scholar] [CrossRef] [PubMed]
- Abelsohn, A.; Stieb, D.M. Health effects of outdoor air pollution: Approach to counseling patients using the Air Quality Health Index. Can. Fam. Physician 2011, 57, 881–887. [Google Scholar] [PubMed]
- Ontario Ministry of the Environment. Conservation and Parks (MECP), 2017–Air quality in Ontario 2015 Report. Available online: http://www.airqualityontario.com/downloads/AirQualityInOntarioReportAndAppendix2015.pdf (accessed on 7 September 2021).
- Chen, H.; Copes, R. Review of Air Quality Index and Air Quality Health Index, Environmental and Occupation Health, Public Health Ontario. 2013. Available online: https://www.publichealthontario.ca/-/media/documents/A/2013/air-quality-health-index.pdf (accessed on 7 September 2021).
- United States Environmental Protection Agency (USEPA). What Is the U.S. Air Quality Index (AQI)? 2021. Available online: https://www.airnow.gov/aqi/aqi-basics/ (accessed on 7 September 2021).
- Stieb, D.M.; Burnett, R.T.; Smith-Doiron, M.; Brion, O.; Shin, H.H.; Economou, V. A new multipollutant, no-threshold air quality health index based on short-term associations observed in daily time-series analyses. J. Air Waste Manag. Assoc. 2008, 58, 435–450. [Google Scholar] [CrossRef] [PubMed] [Green Version]
- Chen, R.; Wang, X.; Meng, X.; Hua, J.; Zhou, Z.; Chen, B.; Kan, H. Communicating air pollution-related health risks to the public: An application of the Air Quality Health Index in Shanghai, China. Environ. Int. 2013, 51, 168–173. [Google Scholar] [CrossRef] [PubMed]
- Du, X.; Chen, R.; Meng, X.; Liu, C.; Niu, Y.; Wang, W.; Li, S.; Kan, H.; Zhou, M. The establishment of national air quality health index in China. Environ. Int. 2020, 138, 105594. [Google Scholar] [CrossRef] [PubMed]
- Olstrup, H. An Air Quality Health Index (AQHI) with different health outcomes based on the air pollution concentrations in Stockholm during the period of 2015–2017. Atmosphere 2020, 11, 192. [Google Scholar] [CrossRef] [Green Version]
- Ontario Ministry of the Environment. Conservation and Parks (MECP). 2021–Air Quality Health Index (AQHI) Historical Search. Available online: http://www.airqualityontario.com/aqhi/search.php (accessed on 7 September 2021).
- National Air Pollution Surveillance Program (NAPS). Data-Donnees. 2021. Available online: https://data.ec.gc.ca/data/air/monitor/national-air-pollution-surveillance-naps-program/Data-Donnees/?lang=en (accessed on 7 September 2021).
- National Oceanic and Atmospheric Administration (NOAA). Air Resources Laboratory. 2021. Available online: https://www.ready.noaa.gov/HYSPLIT.php (accessed on 7 September 2021).
- Rolph, G.; Stein, A.; Stunder, B. Real-time Environmental Applications and Display system: READY. Environ. Model. Softw. 2017, 95, 210–228. [Google Scholar] [CrossRef]
- Stein, A.F.; Draxler, R.R.; Rolph, G.D.; Stunder, B.J.B.; Cohen, M.D.; Ngan, F. NOAA’s HYSPLIT atmospheric transport and dispersion modeling system. Bull. Amer. Meteor. Soc. 2015, 96, 2059–2077. [Google Scholar] [CrossRef]
- Jumbam, L.; Raffuse, S.M.; Wiedinmyer, C.; Larkin, N. Modeling Regional Air Quality Impacts from Indonesian Biomass Burning. In Proceedings of the AGU Fall Meeting, San Francisco, CA, USA, 3–7 December 2012; Volume 2012, p. A21A-0035. [Google Scholar]
- Miller, L.; Farhana, S.; Xu, X. Trans-boundary air pollution in Windsor, Ontario (Canada). Procedia Environ. Sci. 2010, 2, 585–594. [Google Scholar] [CrossRef] [Green Version]
- Shan, W.; Yin, Y.; Lu, H.; Liang, S.A. Meteorological analysis of ozone episodes using HYSPLIT model and surface data. Atmos. Res. 2009, 93, 767–776. [Google Scholar] [CrossRef]
- Zhang, T.; Xu, X.; Su, Y. Impacts of Regional Transport and Meteorology on Ground-Level Ozone in Windsor, Canada. Atmosphere 2020, 11, 1111. [Google Scholar] [CrossRef]
- Liang, S.; Zhu, J.; McGihon, R.; Terebessy, E.; Ge, E.; Su, Y.; Fong, I.; To, T. Visualizing and forecasting the association of air quality and health outcomes in Ontario, Canada. Can. Geogr. 2021, 65, 382–389. [Google Scholar] [CrossRef]
- Ontario Ministry of the Environment and Climate Change (MOECC). 2021–Air Quality in Ontario 2018 Report. Available online: https://www.ontario.ca/document/air-quality-ontario-2018-report (accessed on 7 September 2021).
- To, T.; Feldman, L.; Simatovic, J.; Gershon, A.S.; Dell, S.; Su, J.; Foty, R.; Licskai, C. Health risk of air pollution on people living with major chronic diseases: A Canadian population-based study. BMJ Open 2015, 5, e009075. [Google Scholar] [CrossRef] [Green Version]
- Ontario Ministry of the Environment (MOE). Transboundary Air Pollution in Ontario. 2005. Available online: http://www.airqualityontario.com/downloads/TransboundaryAirPollutionInOntario2005.pdf (accessed on 7 September 2021).
- Commission for Environmental Cooperation (CEC). Long-Range Transport of Ground Level Ozone and Its Precursors: Assessment of Methods to Quantify Transboundary Transport Within the Northeastern United States and Eastern Canada. 1997. Available online: http://www3.cec.org/islandora/en/item/2185-long-range-transport-ground-level-ozone-and-its-precursors-en.pdf (accessed on 7 September 2021).
- Xu, X.; Zhang, T.; Su, Y. Temporal variations and trend of ground-level ozone based on long-term measurements in Windsor, Canada. Atmos. Chem. Phys. 2019, 19, 7335–7345. [Google Scholar] [CrossRef] [Green Version]
Figure 1.
Windsor Downtown AQHI monitoring station (red star) in Windsor, Ontario (base maps adapted from Google Maps, coordinates of the station from MECP [4]).
Figure 1.
Windsor Downtown AQHI monitoring station (red star) in Windsor, Ontario (base maps adapted from Google Maps, coordinates of the station from MECP [4]).
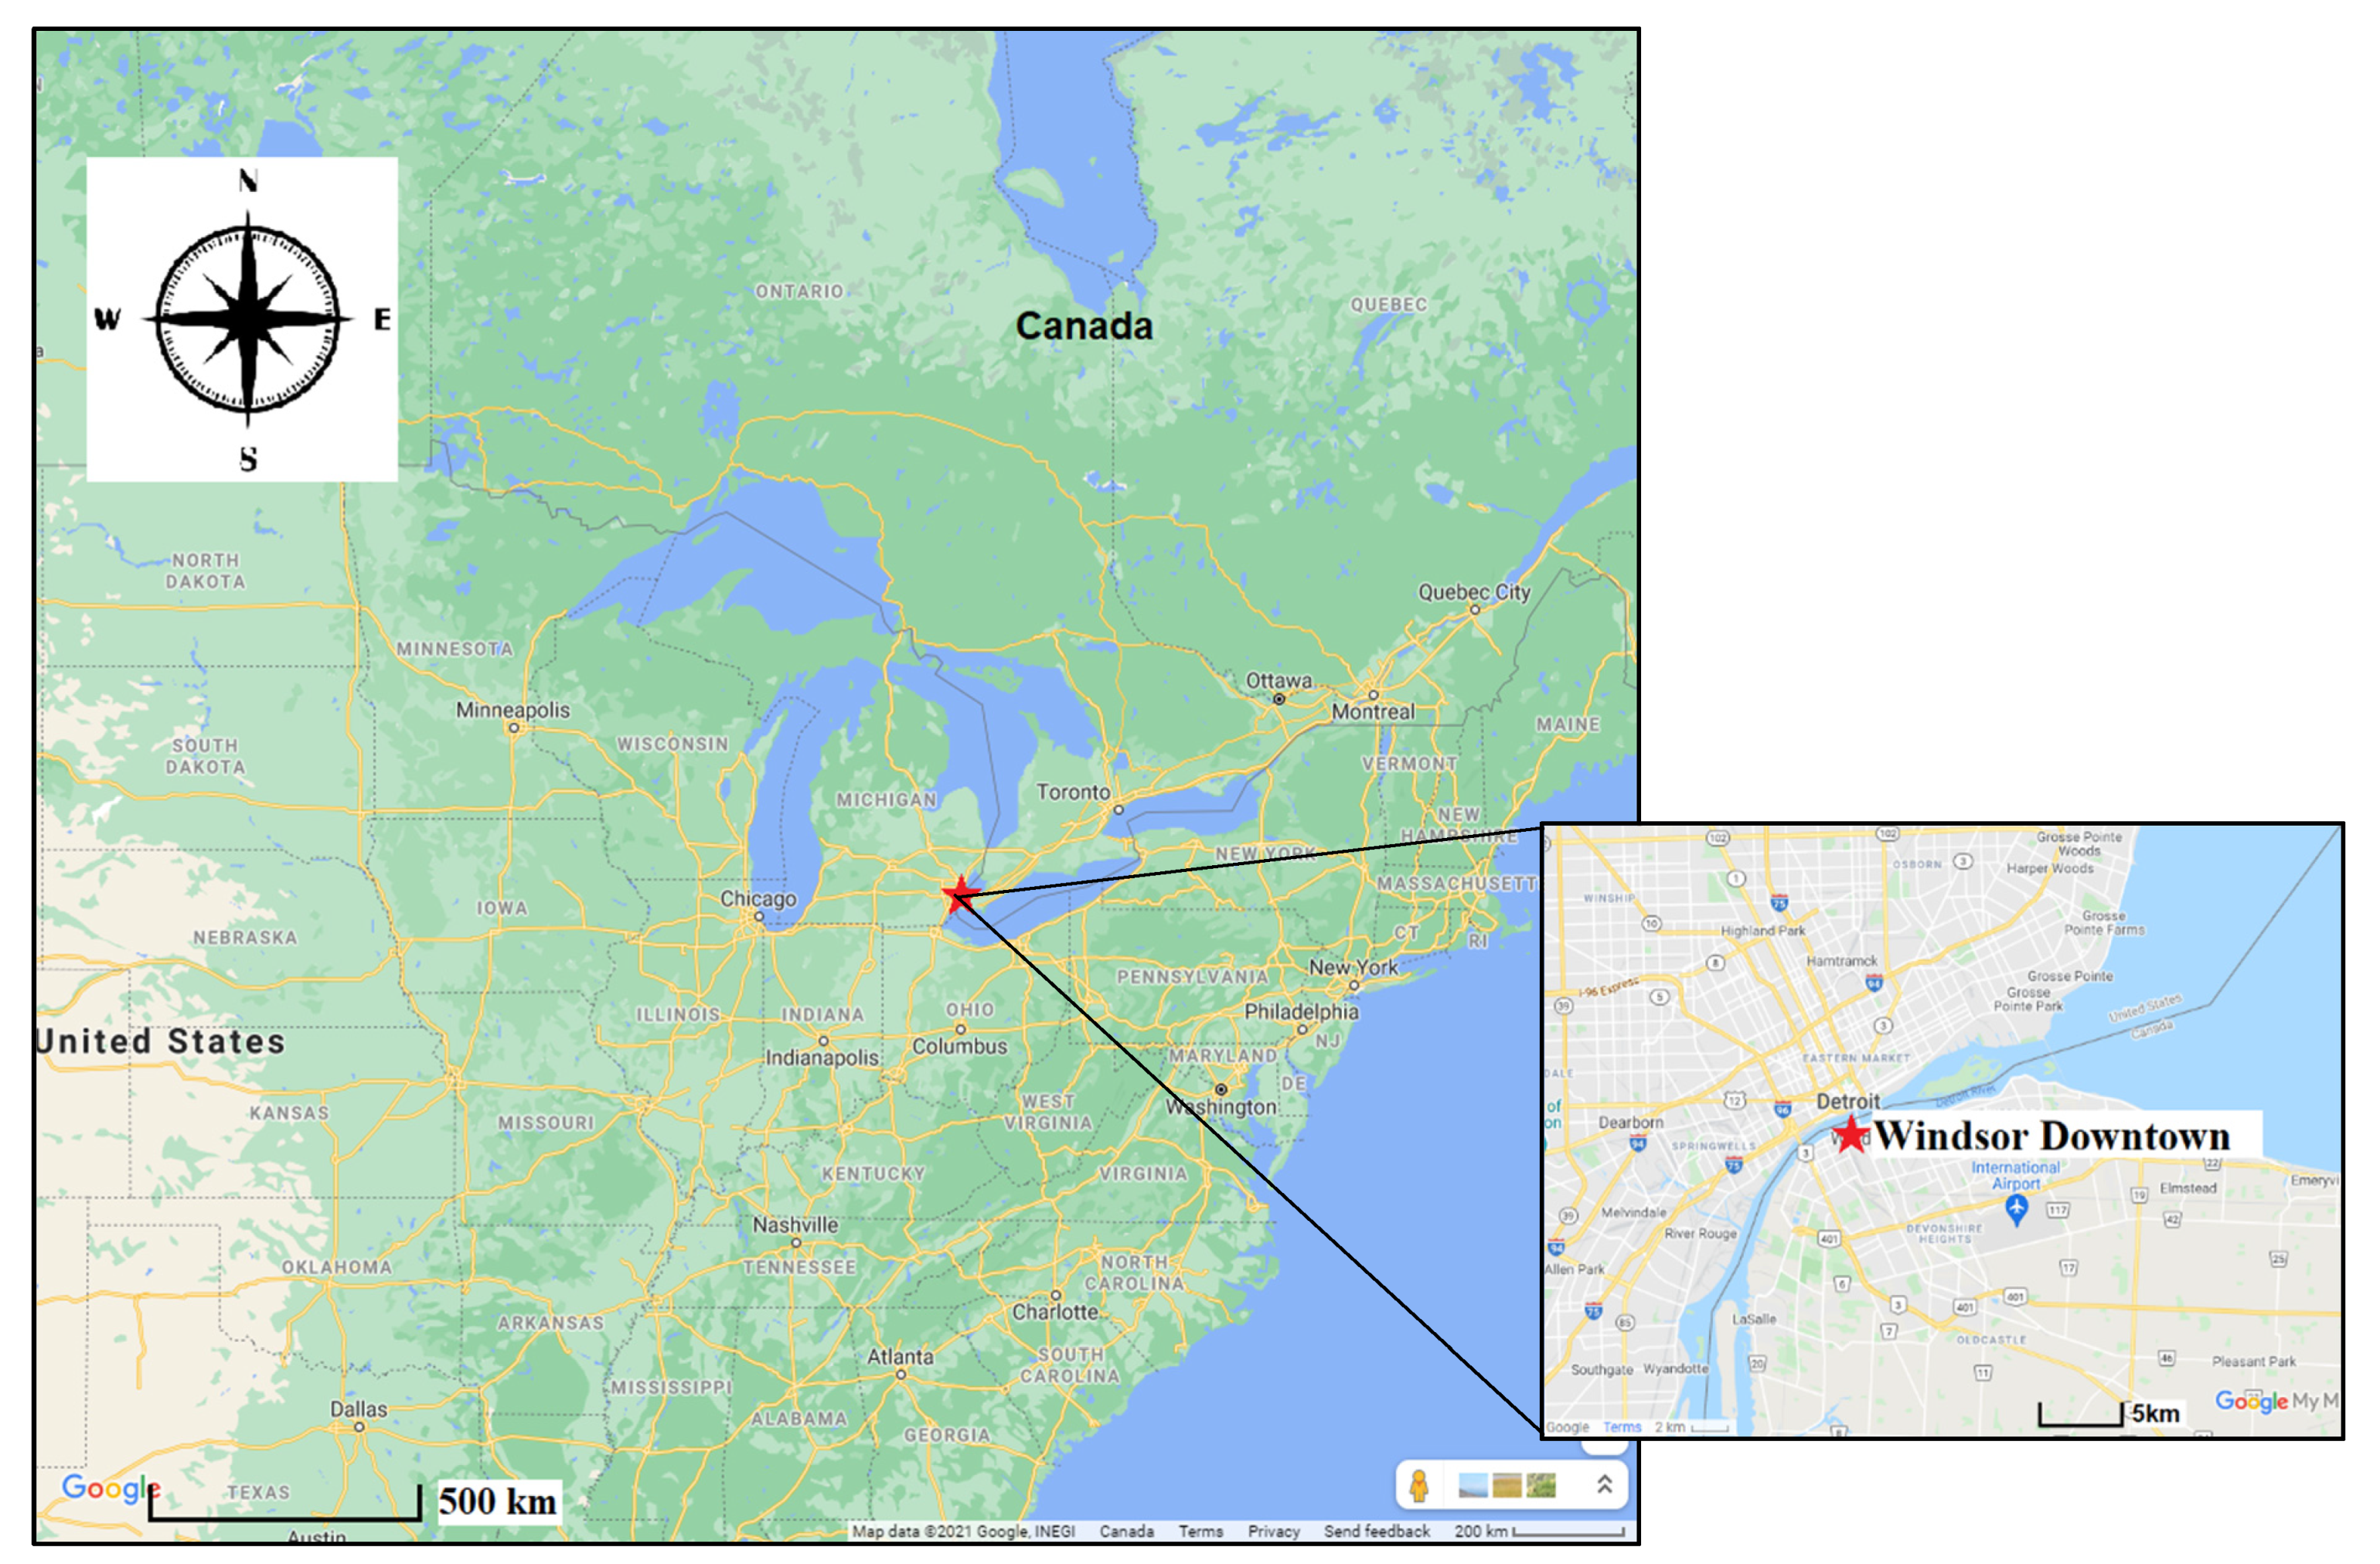
Figure 2.
AQHI in Windsor during 2016–2019, (a) all days, (b) cold season, (c) warm season.
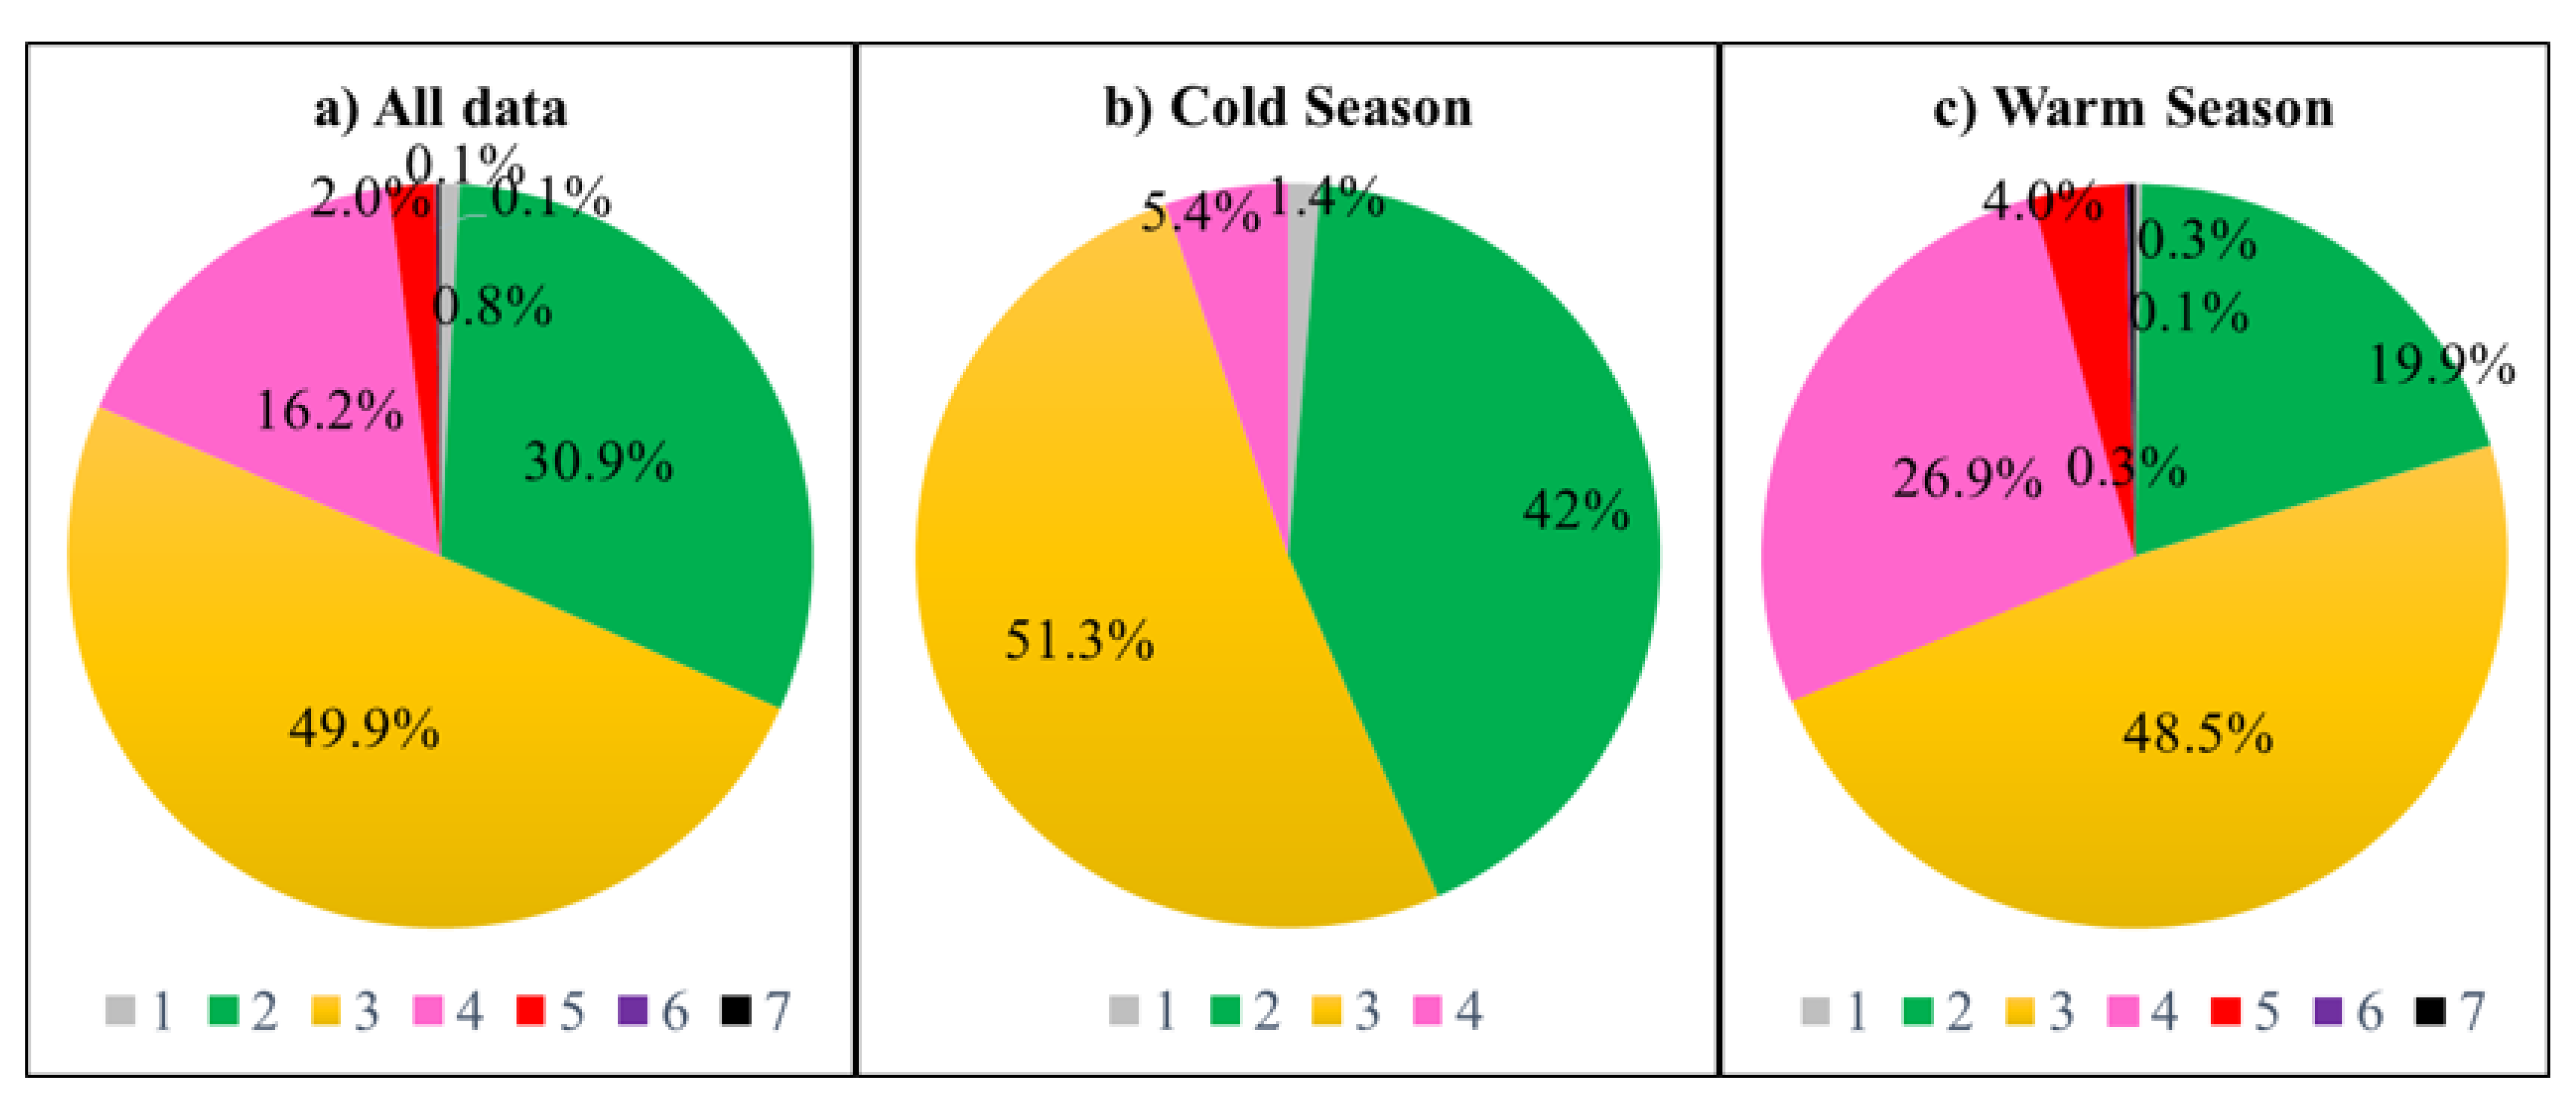
Figure 3.
Percentage distribution (on vertical axis) of air-mass direction in each AQHI group.

Figure 4.
Back trajectories of AQHI < 3 days in cold season (left) and warm season (right). The red dot is Windsor.
Figure 4.
Back trajectories of AQHI < 3 days in cold season (left) and warm season (right). The red dot is Windsor.
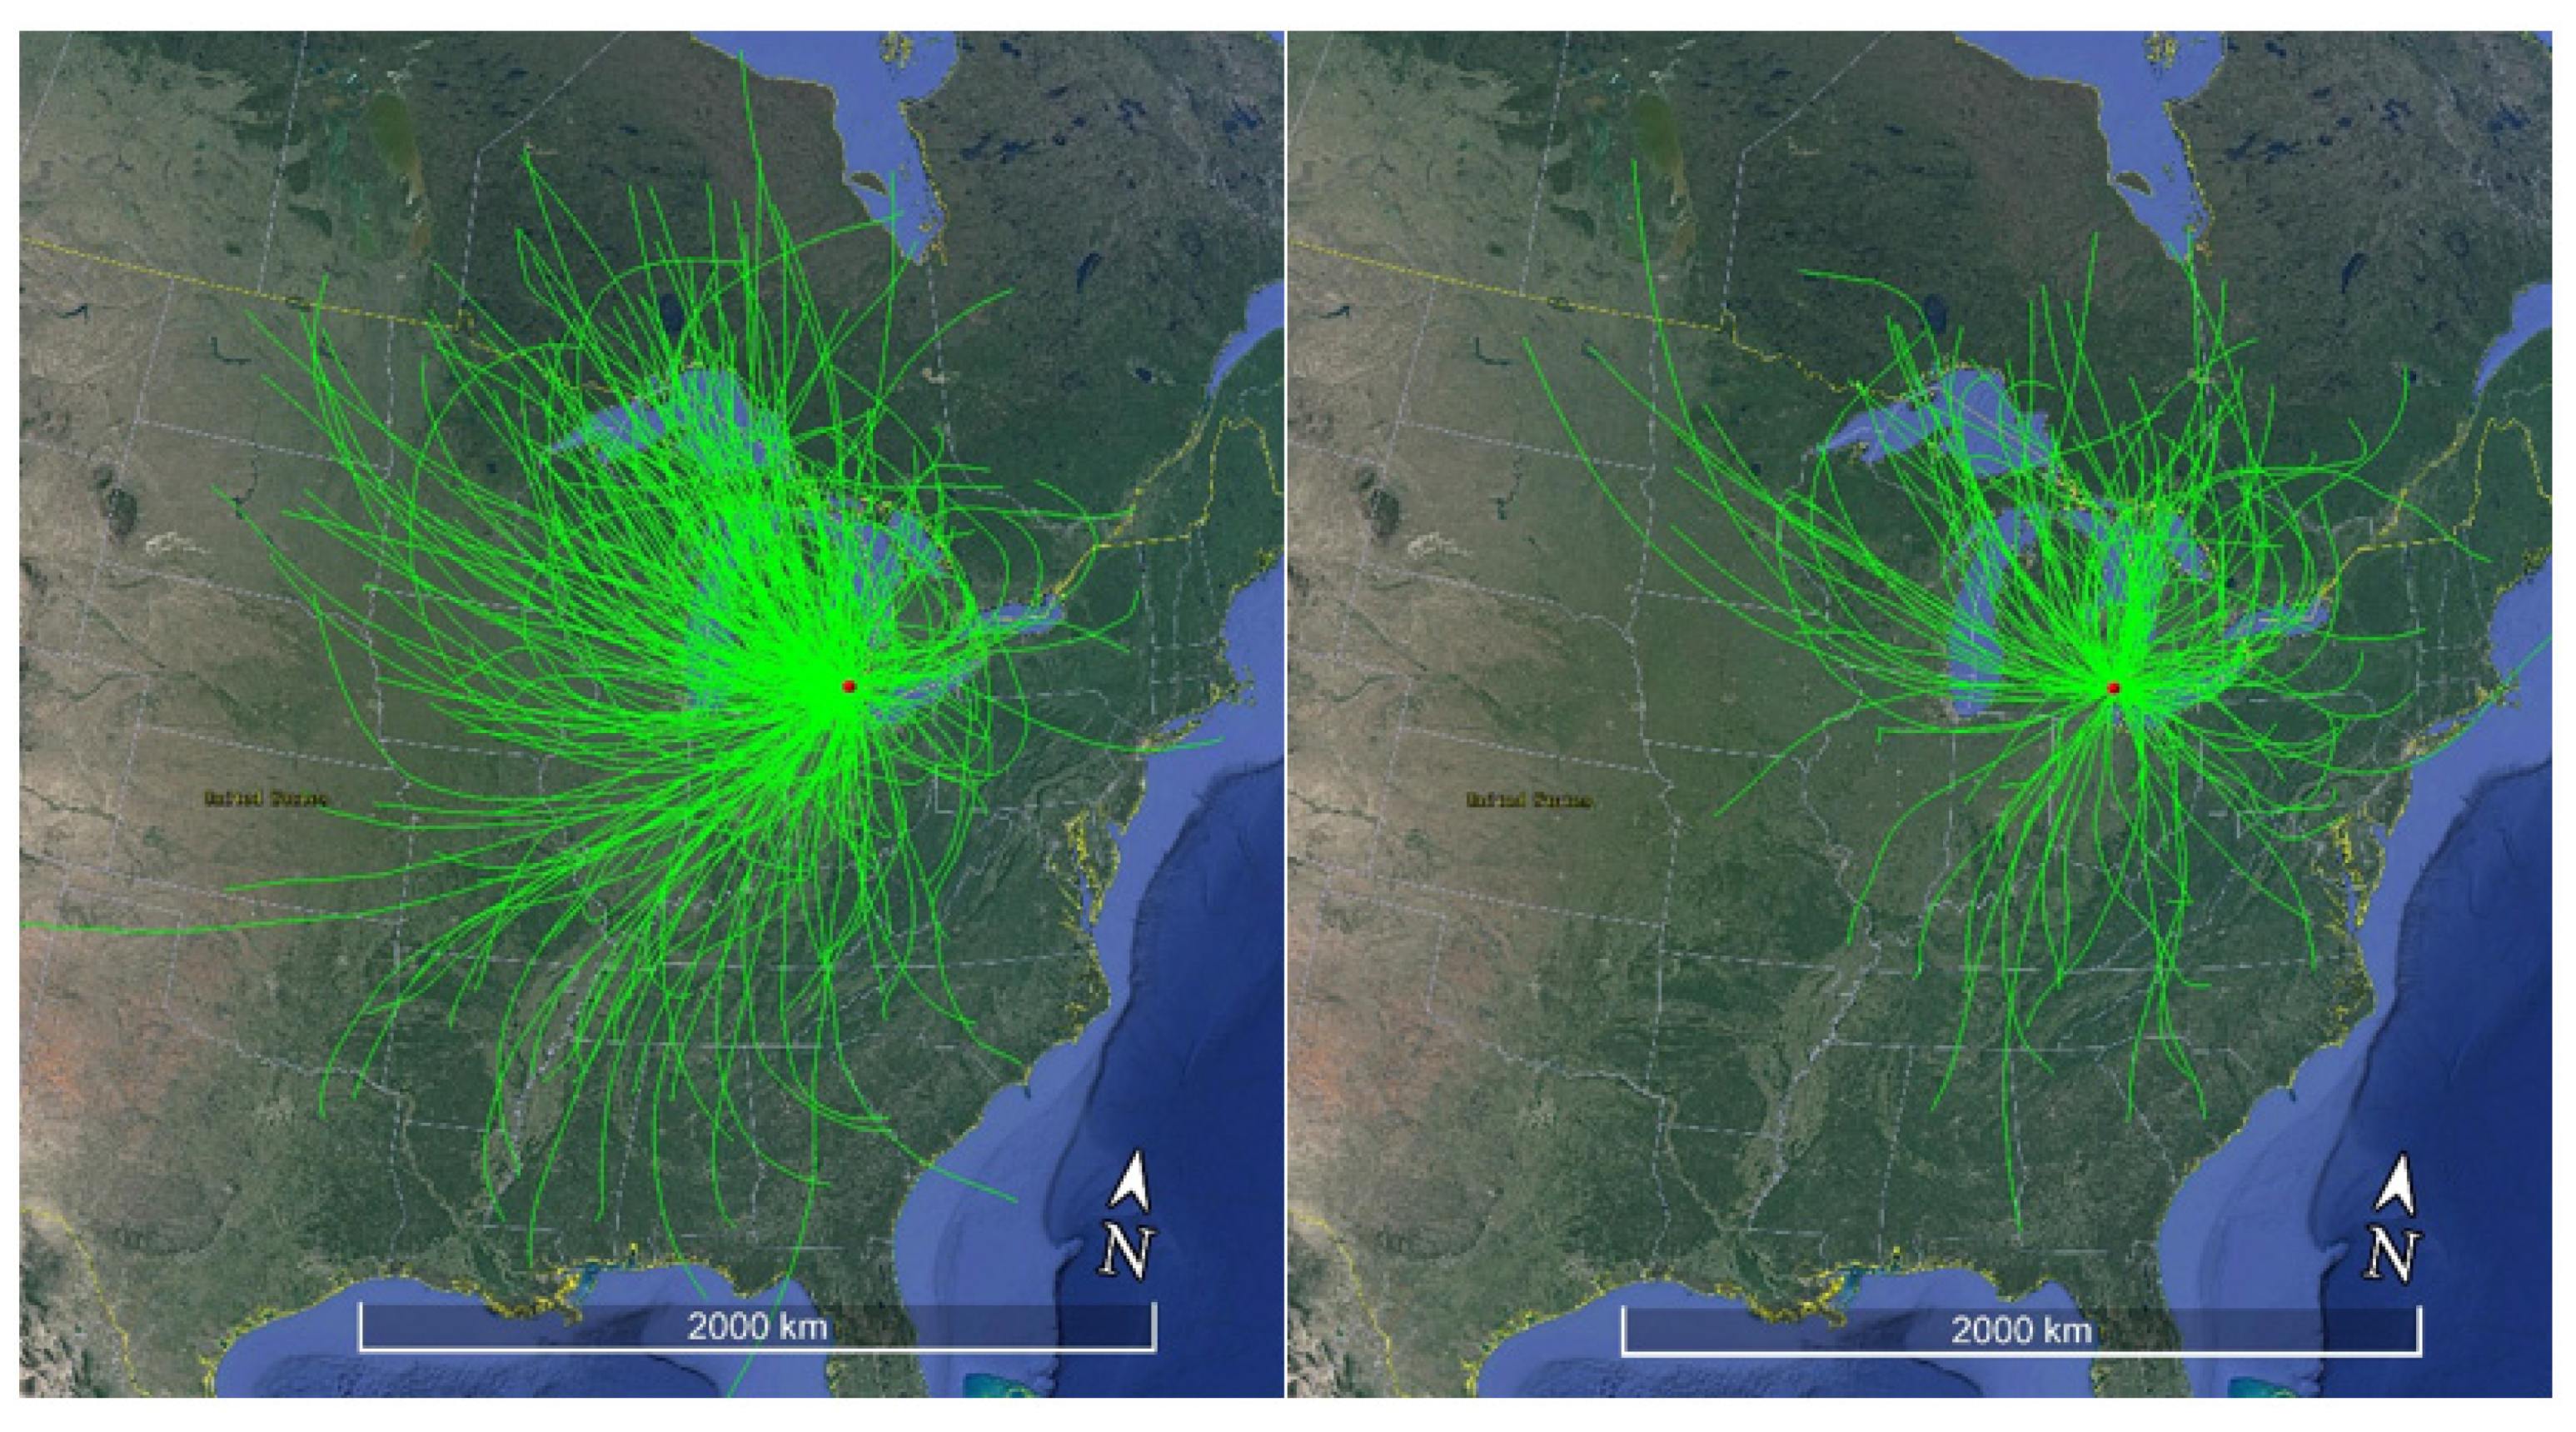
Figure 5.
Back trajectories of AQHI = 3 days in cold season (left) and warm season (right). The red dots are Windsor.
Figure 5.
Back trajectories of AQHI = 3 days in cold season (left) and warm season (right). The red dots are Windsor.
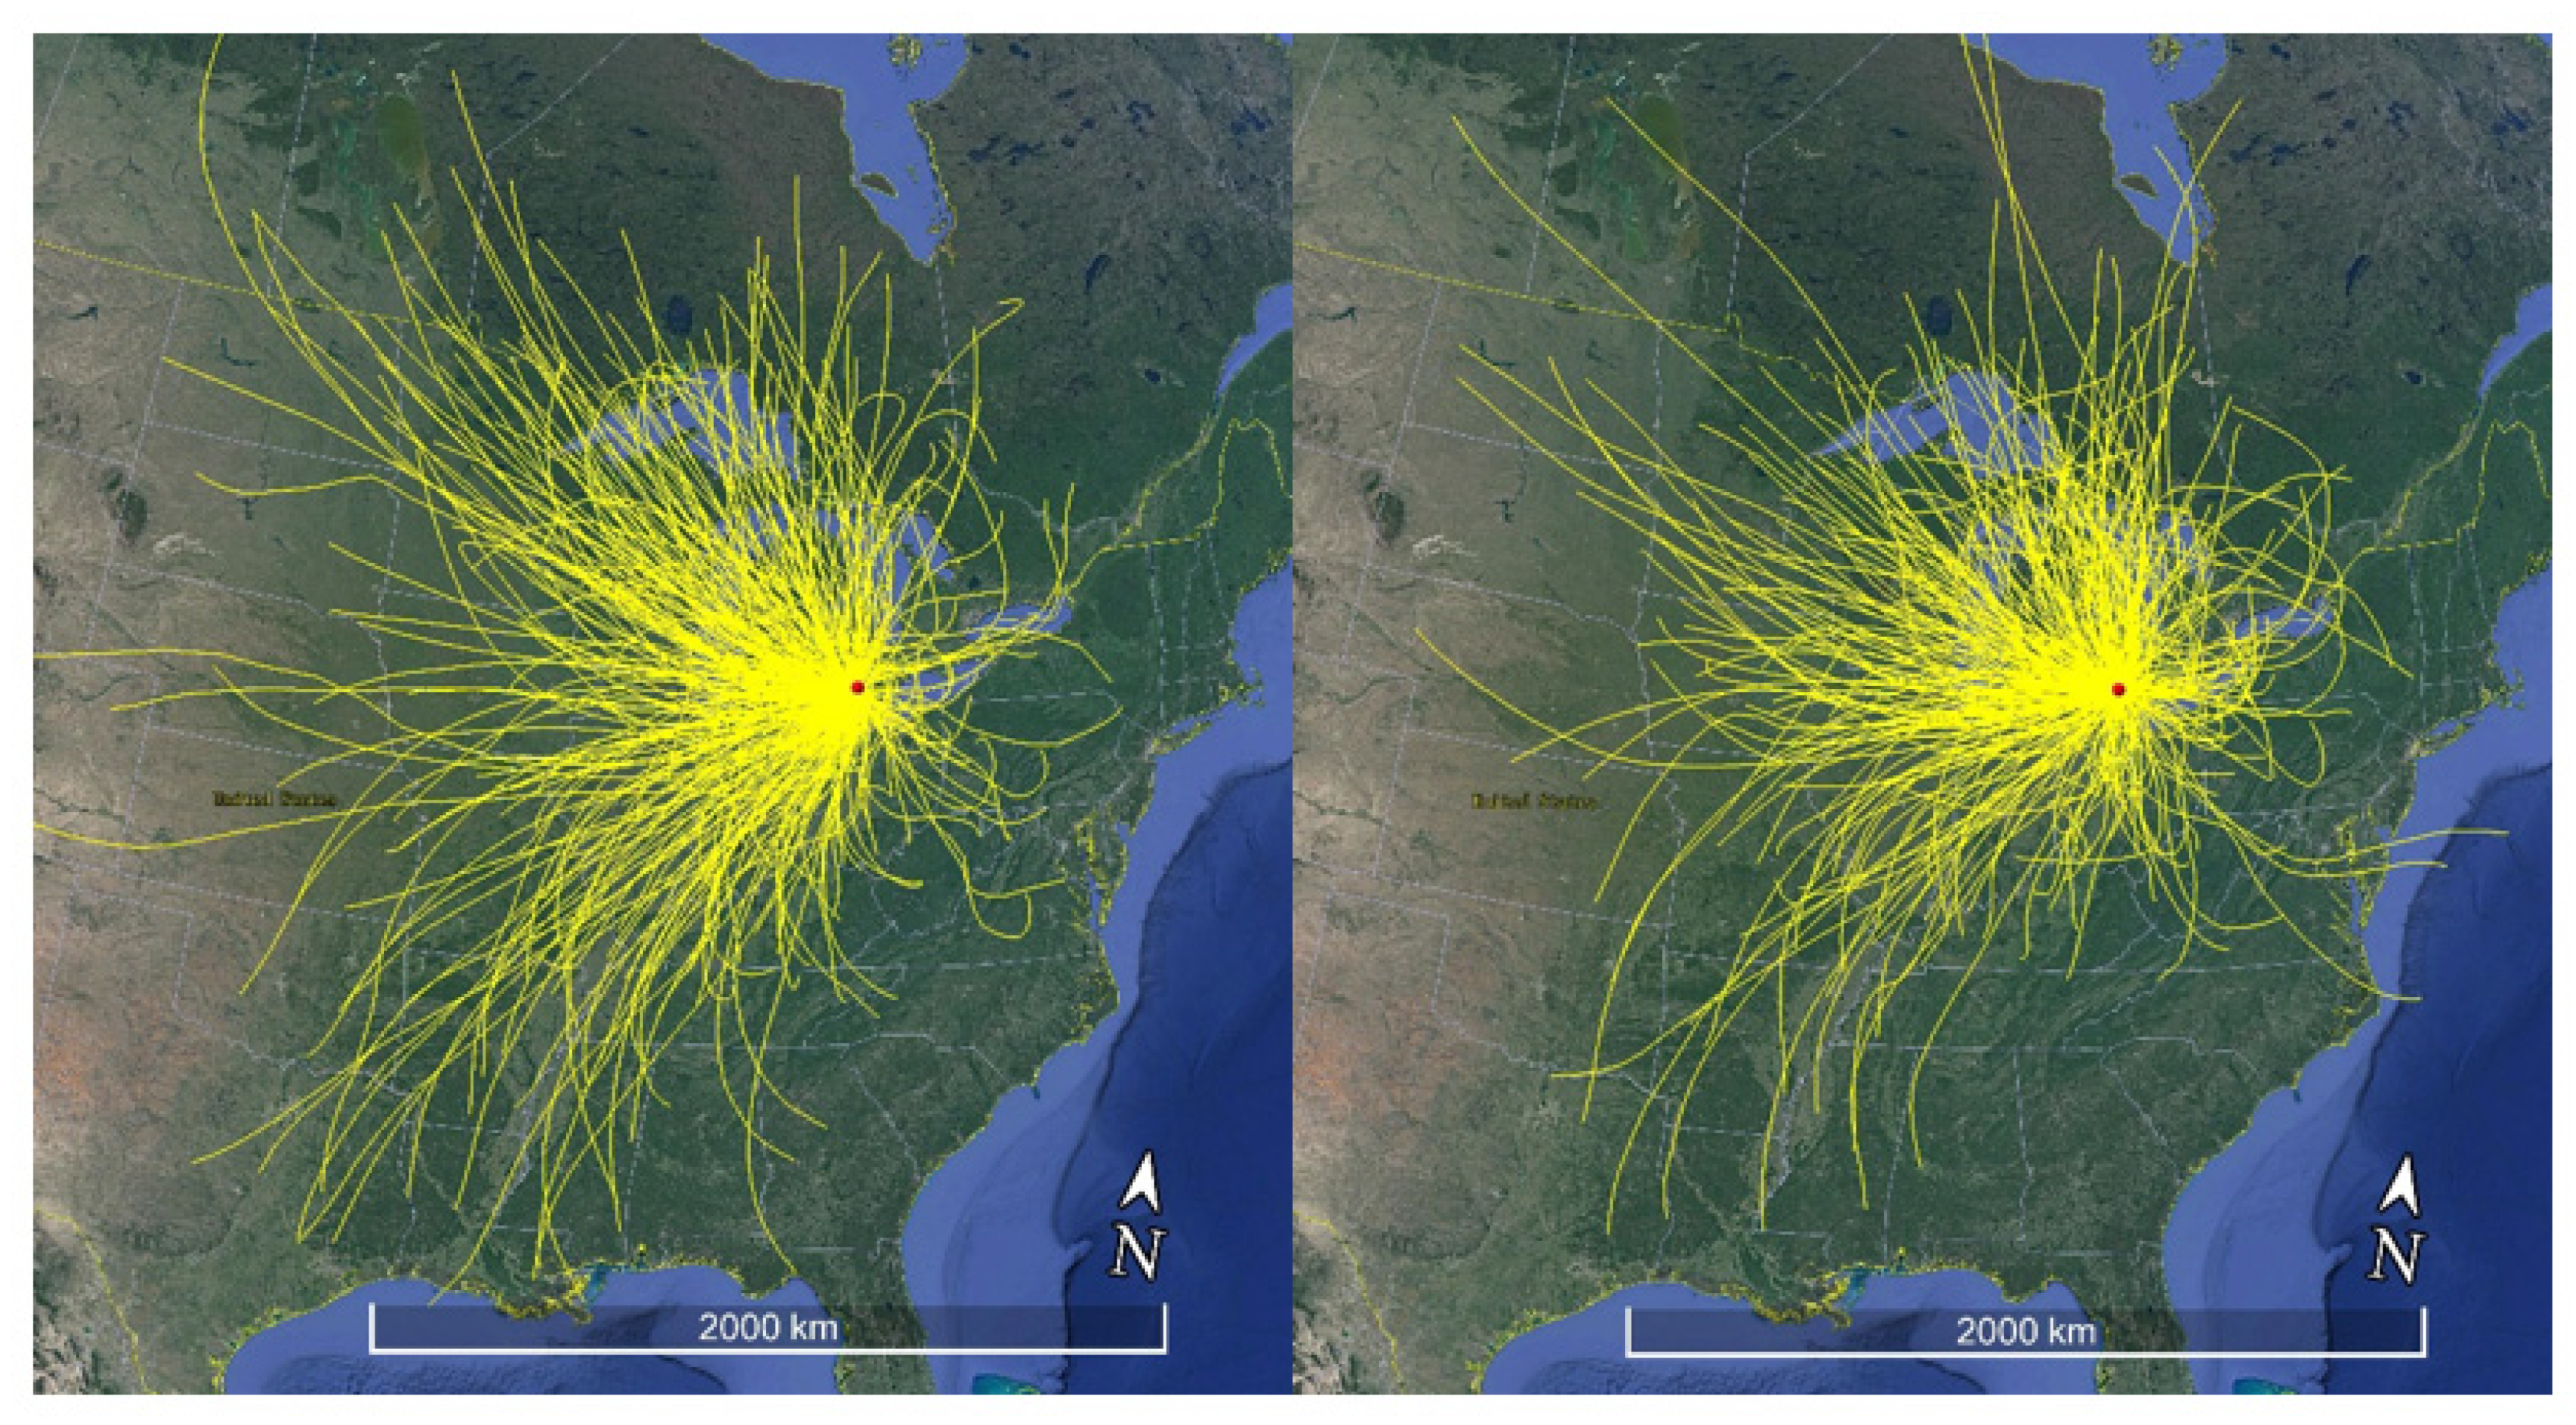
Figure 6.
Back trajectories of AQHI = 4 days in cold season (left) and warm season (right). The red dot is Windsor.
Figure 6.
Back trajectories of AQHI = 4 days in cold season (left) and warm season (right). The red dot is Windsor.
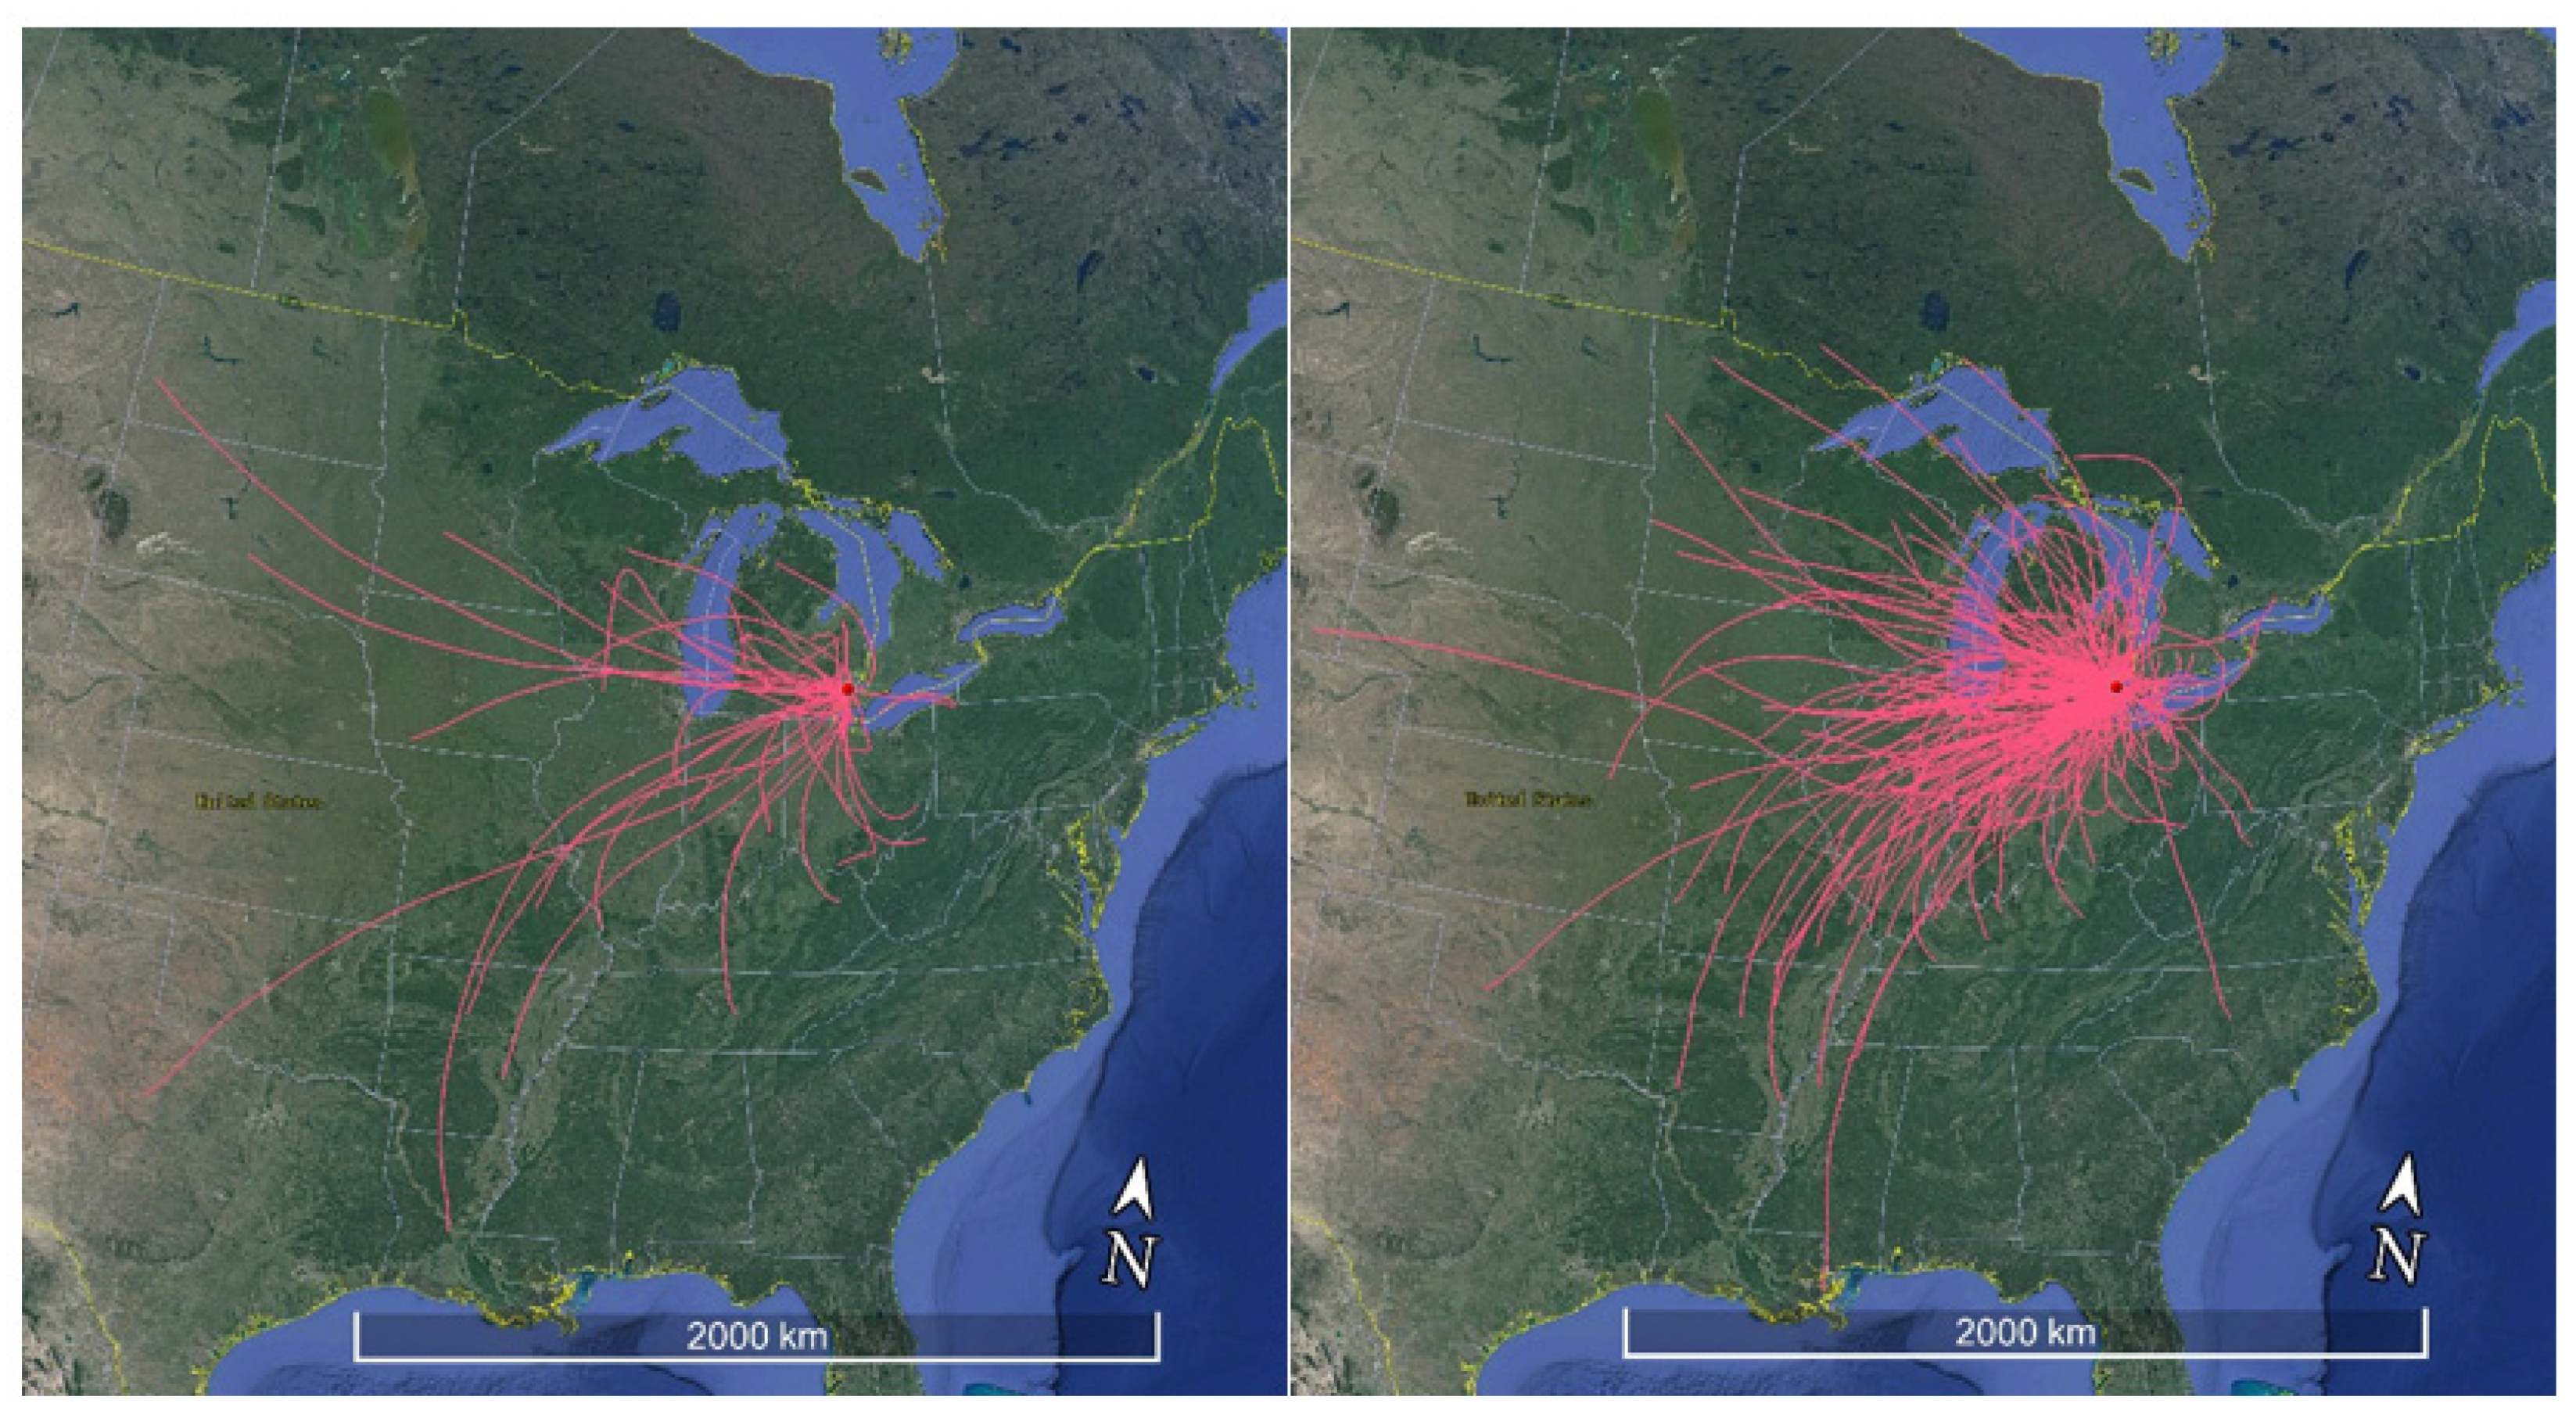
Figure 7.
Back trajectories of AQHI = 5 days in warm season. The red dot is Windsor.
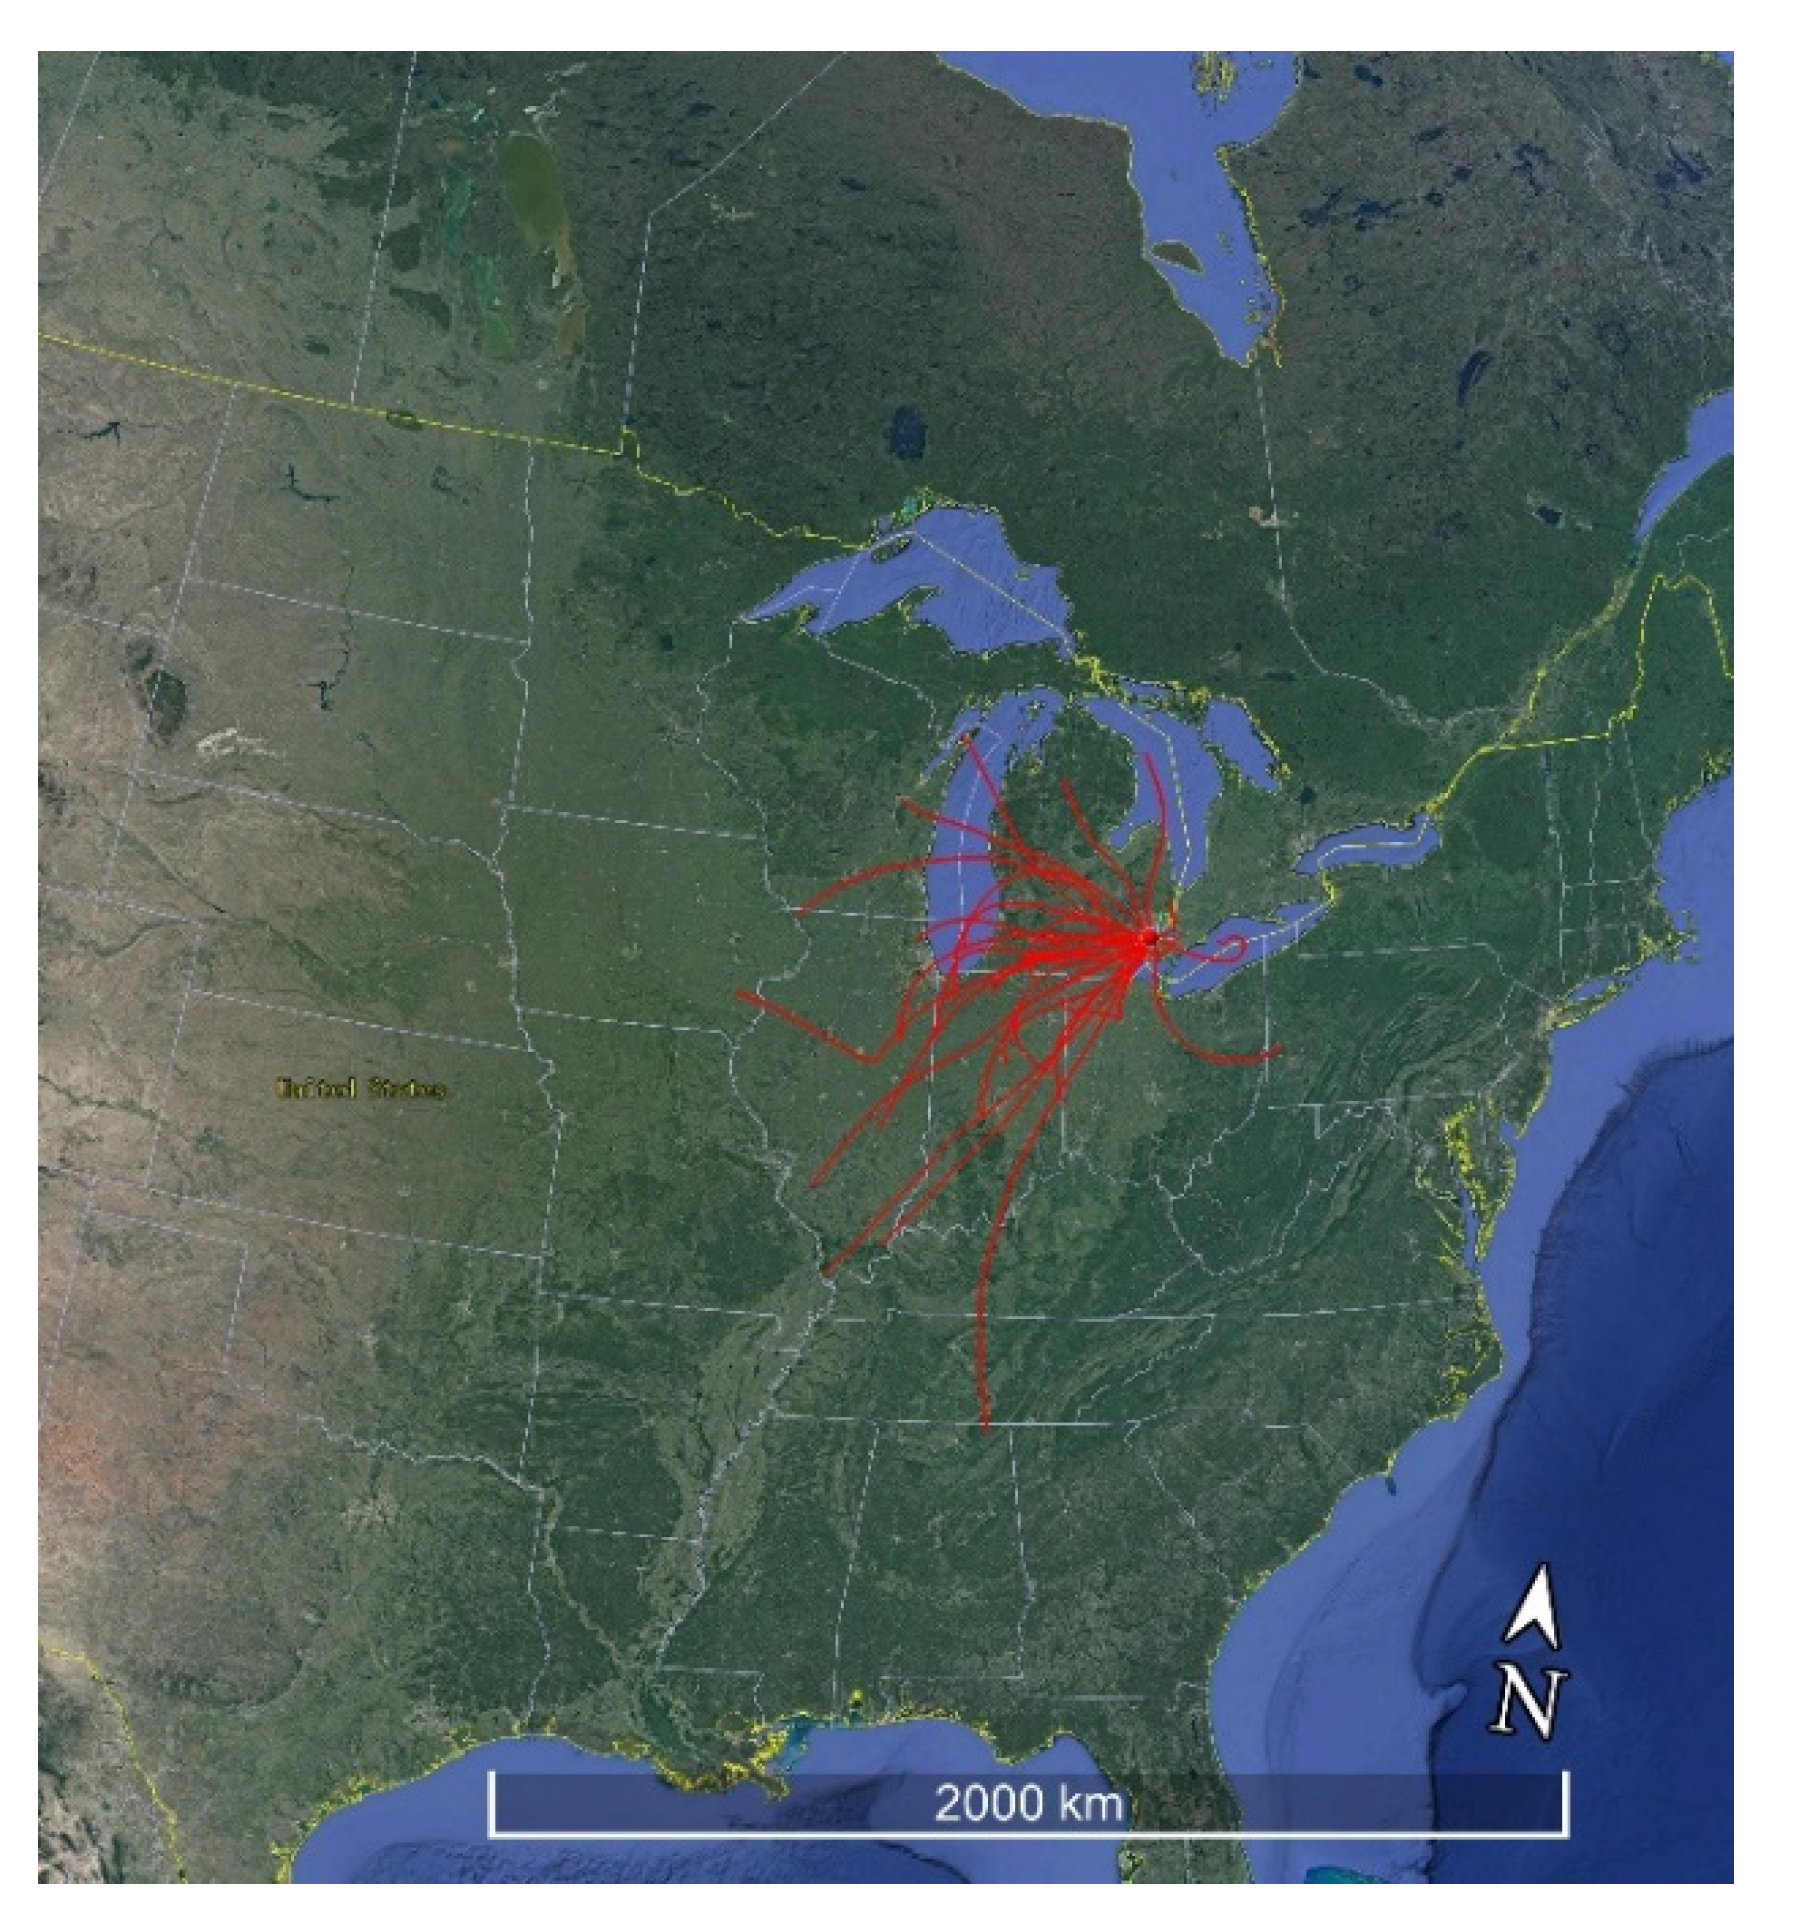
Figure 8.
Percentage of different AQHI values in each of the eight air-mass directions.

Figure 9.
Directional AQHI and air pollutant concentrations, normalized to the perspective overall mean value, respectively.
Figure 9.
Directional AQHI and air pollutant concentrations, normalized to the perspective overall mean value, respectively.

Publisher’s Note: MDPI stays neutral with regard to jurisdictional claims in published maps and institutional affiliations. |
© 2021 by the authors. Licensee MDPI, Basel, Switzerland. This article is an open access article distributed under the terms and conditions of the Creative Commons Attribution (CC BY) license (https://creativecommons.org/licenses/by/4.0/).
Share and Cite
MDPI and ACS Style
Zhang, T.; Chen, Y.; Tan, R.; Xu, X. Air Quality in Windsor (Canada) and Impact of Regional Scale Transport. Atmosphere 2021, 12, 1300. https://doi.org/10.3390/atmos12101300
AMA Style
Zhang T, Chen Y, Tan R, Xu X. Air Quality in Windsor (Canada) and Impact of Regional Scale Transport. Atmosphere. 2021; 12(10):1300. https://doi.org/10.3390/atmos12101300
Chicago/Turabian StyleZhang, Tianchu, Yangfan Chen, Rongtai Tan, and Xiaohong Xu. 2021. "Air Quality in Windsor (Canada) and Impact of Regional Scale Transport" Atmosphere 12, no. 10: 1300. https://doi.org/10.3390/atmos12101300
Note that from the first issue of 2016, this journal uses article numbers instead of page numbers. See further details here.