Article

Climatological Large-Scale Circulation Patterns over The Middle Americas Region

by
Carlos A. Ochoa-Moya
1,
Yoel A. Cala-Pérez
2,
Yanet Díaz-Esteban
2,
Christopher L. Castro
3,
Paulina Ordoñez-Peréz
1 and
Arturo I. Quintanar
1,*
1
Centro de Ciencias de la Atmósfera, Universidad Nacional Autónoma de México, Mexico City 04510, Mexico
2
Posgrado en Ciencias de la Tierra, Universidad Nacional Autónoma de México, Mexico City 04510, Mexico
3
Department of Hydrology and Atmospheric Sciences, University of Arizona, Tucson, AZ 85721, USA
*
Author to whom correspondence should be addressed.
Atmosphere 2020, 11(7), 745; https://doi.org/10.3390/atmos11070745
Submission received: 30 April 2020 / Revised: 4 July 2020 / Accepted: 7 July 2020 / Published: 14 July 2020
(This article belongs to the Special Issue Central America and Caribbean Hydrometeorology and Hydroclimate)

Abstract

:
In this study, twenty large-scale circulation patterns are identified to generate a synoptic classification of Weather Types (WT) over a region that comprises Mexico, the Intra-Americas Seas, Central America, and northern South America. This classification is performed using Self-Organizing Maps (SOMs) with mean sea-level pressure standardized anomalies from reanalysis. The influence of quasi-permanent pressure centers over the region, such as North Atlantic Subtropical High (NASH) and North Pacific High (NPH) are well captured. Seasonal variability of high-pressure centers for dry (November–April) and wet (May–October) periods over the entire region are also well represented in amplitude and pattern among the WTs. The NASH influence and intensification of the Caribbean low-level jet and the North American monsoon system is well captured. During the dry period, a strong trough wind advects cold air masses from mid-latitudes to the subtropics over the western Atlantic Ocean. High-frequency transitions among WTs tend to cluster around the nearest neighbors in SOM space, while low-frequency transitions occur along columns instead of rows in the SOM matrix. Low-frequency transitions are related to intraseasonal and seasonal scales. The constructed catalog can identify near-surface atmospheric circulation patterns from a unified perspective of synoptic climate variability, and it is in high agreement with previous studies for the region.

1. Introduction

Synoptic climatology investigates the connection between atmospheric circulation patterns and climatic differences [1]. A methodological hallmark of synoptic climatology is data reduction, rendering a small set of physically meaningful patterns or categories from a large data volume [2]. One such approach should produce a classification of spatially recognizable weather types (or weather patterns as they are sometimes named) at the daily or sub-daily time scales. Information at this temporal resolution can provide an important insight into how local or regional climates are related to atmospheric circulation processes. Research in synoptic climatology benefits from a number of classification methods that can be applied to a wide range of spatial and temporal scales.
Early classifications methods of Weather Types (WT) were based on manual and subjective techniques. A very popular and widely used classification was developed by Lamb [3] to obtain a seven-WT classification of daily circulation patterns over the British Isles. These methods have evolved over time and have benefited from advanced numerical methods, such as correlation-based classifications [4], principal component analysis and empirical orthogonal functions [5,6]. Clustering methods have been used in the past for classification of atmospheric states [7,8,9] which exhibit large spatial (e.g., hemispheric) and temporal (e.g., days to months) scales [10].
One clustering technique which has gained ample recognition by the meteorological community is the Self-Organizing Maps (SOM) algorithm [11]. This algorithm is based on unsupervised neural networks allowing data classification in large dimensional spaces. The SOM algorithm has been used to identify the most frequently occurring synoptic patterns by clustering around anomalies of a given meteorological variable. Other similar clustering algorithms exist, such as “fuzzy clusters” [12] and the “k-means” method, [13,14,15] but these do not exploit the topological advantage of having information passed on from neighboring nodes as is performed by the SOM algorithm. Recently, the technique has been used to investigate the persistence and transitions of WTs with a focus on weather forecasting applications in specific European regions, e.g., [16].
While there have been studies over North America, e.g., [17,18,19], using WT, here we choose to focus on the region that comprises Mexico, the Intra-Americas Seas, Central America, and northern South America. In this study we refer to this landmass and adjacent oceanic areas as the Middle Americas Region (MAR). A review by Jáuregui [20] revealed that, at least for Mexico, there are three distinct seasonal periods for precipitation: a wet period that lasts from May to October and a dry period (November to April) composed of two seasons—dry-cold (November to January) and dry-warm (February to April) for winter and spring, respectively. Mosiño [21] and Jáuregui [20] recognized the importance of WTs associated with the longitudinal excursions of the North American Subtropical High (NASH) into the southern United States of America (US), the Gulf of Mexico and southern Mexico during wet and dry periods. In more modern times using the SOM method, Cavazos [17] detected a relation between large-scale circulation patterns on both daily precipitation and low-level humidity fields over the northeastern region of Mexico and Southeast Texas. It was found that positive (negative) precipitation anomalies in winter months are related to a stronger (weaker) Aleutian Low and a weaker (stronger) North Pacific High (NPH).
The North American Monsoon System (NAMS) precipitation represents more than 50% of the total annual over Southwestern US and Northwestern Mexico [22]. Economic activities in the region are highly dependent on precipitation amounts and onset timing of the monsoon season [23]. The onset of NAMS occurs between the end of May and early June and reaches a mature stage between July and August and a decay stage in late September–October [22,24]. The NAMS precipitation variability during the wet period exhibits a clear double-peak structure in the climate record at low latitudes [24,25]. A dry “spell” or local minimum is more evident in southeastern Mexico and northern Central America, featuring a decrease in precipitation during July and August. This dry period is commonly referred to as the Mid-Summer Drought (MSD) in current literature [24,25]. Díaz-Esteban and Raga [26] analyzed the WTs that influence precipitation behavior in southeastern Mexico, focusing on the regional atmospheric quasi-permanent circulation centers and El-Nino Southern Oscillation. They detected the MSD on WTs that are characterized by an strengthening of the NASH and the Caribbean Low-Level Jet (CLLJ) with a reduction of low-level humidity and precipitation patterns consistent with the MSD.
The CLLJ and its interactions with the NASH [27] are another important feature in MAR. The CLLJ is part of the trade winds that prevail all year long in the Caribbean basin. Its central core can be found between 10° N and 20° N at about 925 hPa and has an easterly zonal wind that can be larger than 13 m s−1 [27]. It exhibits sub-diurnal and diurnal variability that is related to longitudinal shifts of the NASH [28]. The intensity and position of the CLLJ core is linked to the wet and dry season over the Caribbean basin. The CLLJ intensity has a bi-modal annual distribution with minima on May and October and maxima on January and July [27]. Even though the CLLJ is located at very low latitudes, the jet can be explained in terms of a thermal wind balance above 925 hPa. This condition is reflected in the Mean Sea-Level Pressure (MSLP) fields on January and July when the intensity of the CLLJ peaks [29]. During July, a northern branch of the CLLJ is responsible for moisture transport to the east coasts of Mexico, Central America and the gulf states of the US [30]. Sáenz and Durán-Quesada [31] developed a low-level wind climatology for Central America, applying a clustering technique to obtain 11 WTs. The summer WTs found were dominated by local forcing, while winter WTs were influenced by mid-latitude interactions. Sáenz and Durán-Quesada [31] also found that the most frequent regime during summer is characterized by a strengthening and an increase in the zonal extension of the NASH, enhancing trade winds over the Caribbean Sea. This summer behavior is consistent with the observed zonal wind maximum and the minimum in precipitation, where the maximum strength of the jet is located [27]. Moron et al. [32] complemented the work of Sáenz and Durán-Quesada [31] with a focus on the role of deep convection over the Intra-Americas Seas and the attendant low-level circulation patterns at 925 hPa where the CLLJ core resides. Using a k-means classification algorithm, Moron et al. [32] found eight WTs—five for winter and three for summer. The authors observed that the transition from summer to winter WTs is somewhat abrupt in terms of precipitation. A relevant result for this work is that their most frequent summer WT was characterized by a strong NASH and a strong CLLJ with precipitation patterns covering most of the Caribbean Islands, Central America and the tropical Eastern Pacific.
As mentioned previously, the literature shows that shifts in the latitude and longitude of the NPH and NASH force much of the tropical dynamics over MAR. The main objective of this study is to analyze the latitudinal and longitudinal shifts of the NPH and the NASH over ocean regions that influence local near-surface climate over the continental land-mass. To achieve this, it is proposed to use the SOM method to develop a climatic catalog of the predominant synoptic conditions through an annual cycle that applies to the MAR as a whole. A catalog of WTs will inform the understanding of atmospheric processes that drive local weather within the MAR. In Section 2 we briefly explain the SOM algorithm. Section 3 discusses the results, and in Section 4, conclusions are presented.

2. Data and Methods

The study region corresponds to 0°–50° N and 10°–150° W (see Figure 1). This domain permits identification of synoptic and large-scale circulation patterns within the MAR. Of primary interest is the latitudinal and longitudinal shifts in NASH and the NPH centers over an annual cycle [33]. In addition, the domain is large enough to capture the relevant dynamical features in the tropics related to the variability of precipitation over Mexico and Central America.
We use ERA Interim (ERAI) reanalysis data [34] obtained from the European Center for Medium-Range Weather Forecasts (ECMWF) with a horizontal resolution of approximately 80 km (0.70° × 0.70°) and 60 vertical levels and a temporal resolution of six hours. The ERAI reanalysis dataset has sufficient spatial resolution to investigate precipitation variability in the tropics and subtropics, as demonstrated in several studies [35,36,37,38]. For this study, MSLP, temperature at 2 m (T2m) and horizontal wind fields at 925 hPa for 1800 UTC are utilized to characterize atmospheric circulation patterns. It is assumed that a single-time field per day is representative of synoptic-scale patterns [39,40]. Previous studies for the subtropics have used MSLP as the only predictor variable for SOM algorithm [18,41]. Tests with geopotential height at 500 hPa as the only input to the SOM algorithm yield similar WTs averages in MSLP when comparing to MSLP-classified WTs (not shown). Additionally, MSLP is a variable that can resolve the large-scale overlying circulation of the NASH and the NPH and can inform of the movements of pressure centers over the ocean basins. Nevertheless, including other variables as the multi-predictor inputs to SOM, such as Sea-Surface Temperature (SST) and wind, is part of an ongoing research effort.
Standardized anomalies of daily MSLP are calculated by removing the climatological mean and then dividing by the standard deviation for the 1980–2016 period. In order to have area parity, these standardized anomalies are then weighted at each grid point by the cos ϕ , where ϕ is latitude [42]. The weighted standardized MSLP anomaly fields are the only input used to train the SOM algorithm. Precipitation data from Climate Hazards InfraRed Precipitation (CHIRP) are used to evaluate changes in precipitation associated with each WT, as an independent variable from ERAI. CHIRP is a database with satellite precipitation estimates combining thermal infrared precipitation estimates with cold cloud duration rainfall estimates with a fixed threshold of 235 K and horizontal resolution of 0.25°, covering the globe between 50° N and 50° S [43].

2.1. SOM Method

The SOM method is an artificial intelligence algorithm commonly used in meteorology to help reduce data dimensionality. SOM can cluster weather patterns around a centroid by minimizing the Euclidean distance. The SOM technique has proven advantages over principal component analysis, another very commonly used data reduction technique in the field [44]. SOMs are based on an unsupervised artificial neural network first suggested by Kohonen [11]. In this algorithm, nodes are distributed in a two-dimensional grid. Each one has an associated weight vector of dimension equal to the number of spatial grid points of the field variable of interest. The weight vector, in this study, is initialized using a linear combination of the two first eigenvectors of the covariance matrix of the gridded input field. It should be noted that this is not the only means of initializing the weight vector. Other techniques exist, for example random initialization [45]. Weight vectors update for each node via a neighboring function that preserves pattern similarity. Further mathematical details on the method can be found in Kohonen [11]. The Matlab® SOM Toolbox package [45] was used to obtain the WTs in the study region.
A matrix with standardized anomaly values was constructed for MSLP, which is used as input data to the algorithm. A problem with clustering methods is how to best decide on the number of nodes. There is no agreement as to this point in prior literature, so a series of tests with different number of nodes needed to be performed [16]. A small number of nodes yielded a set of WTs that are too discontinuous, while too many nodes resulted in WTs that have relatively small variation. A series of tests were conducted using different numbers of nodes (12, 16, 20 and 32). Based on visual inspection, we conclude that 20 patterns represent reasonably well the spatial variations, and this number is of the same order of magnitude used in previous studies in the MAR where the SOM method has been applied [26,46].

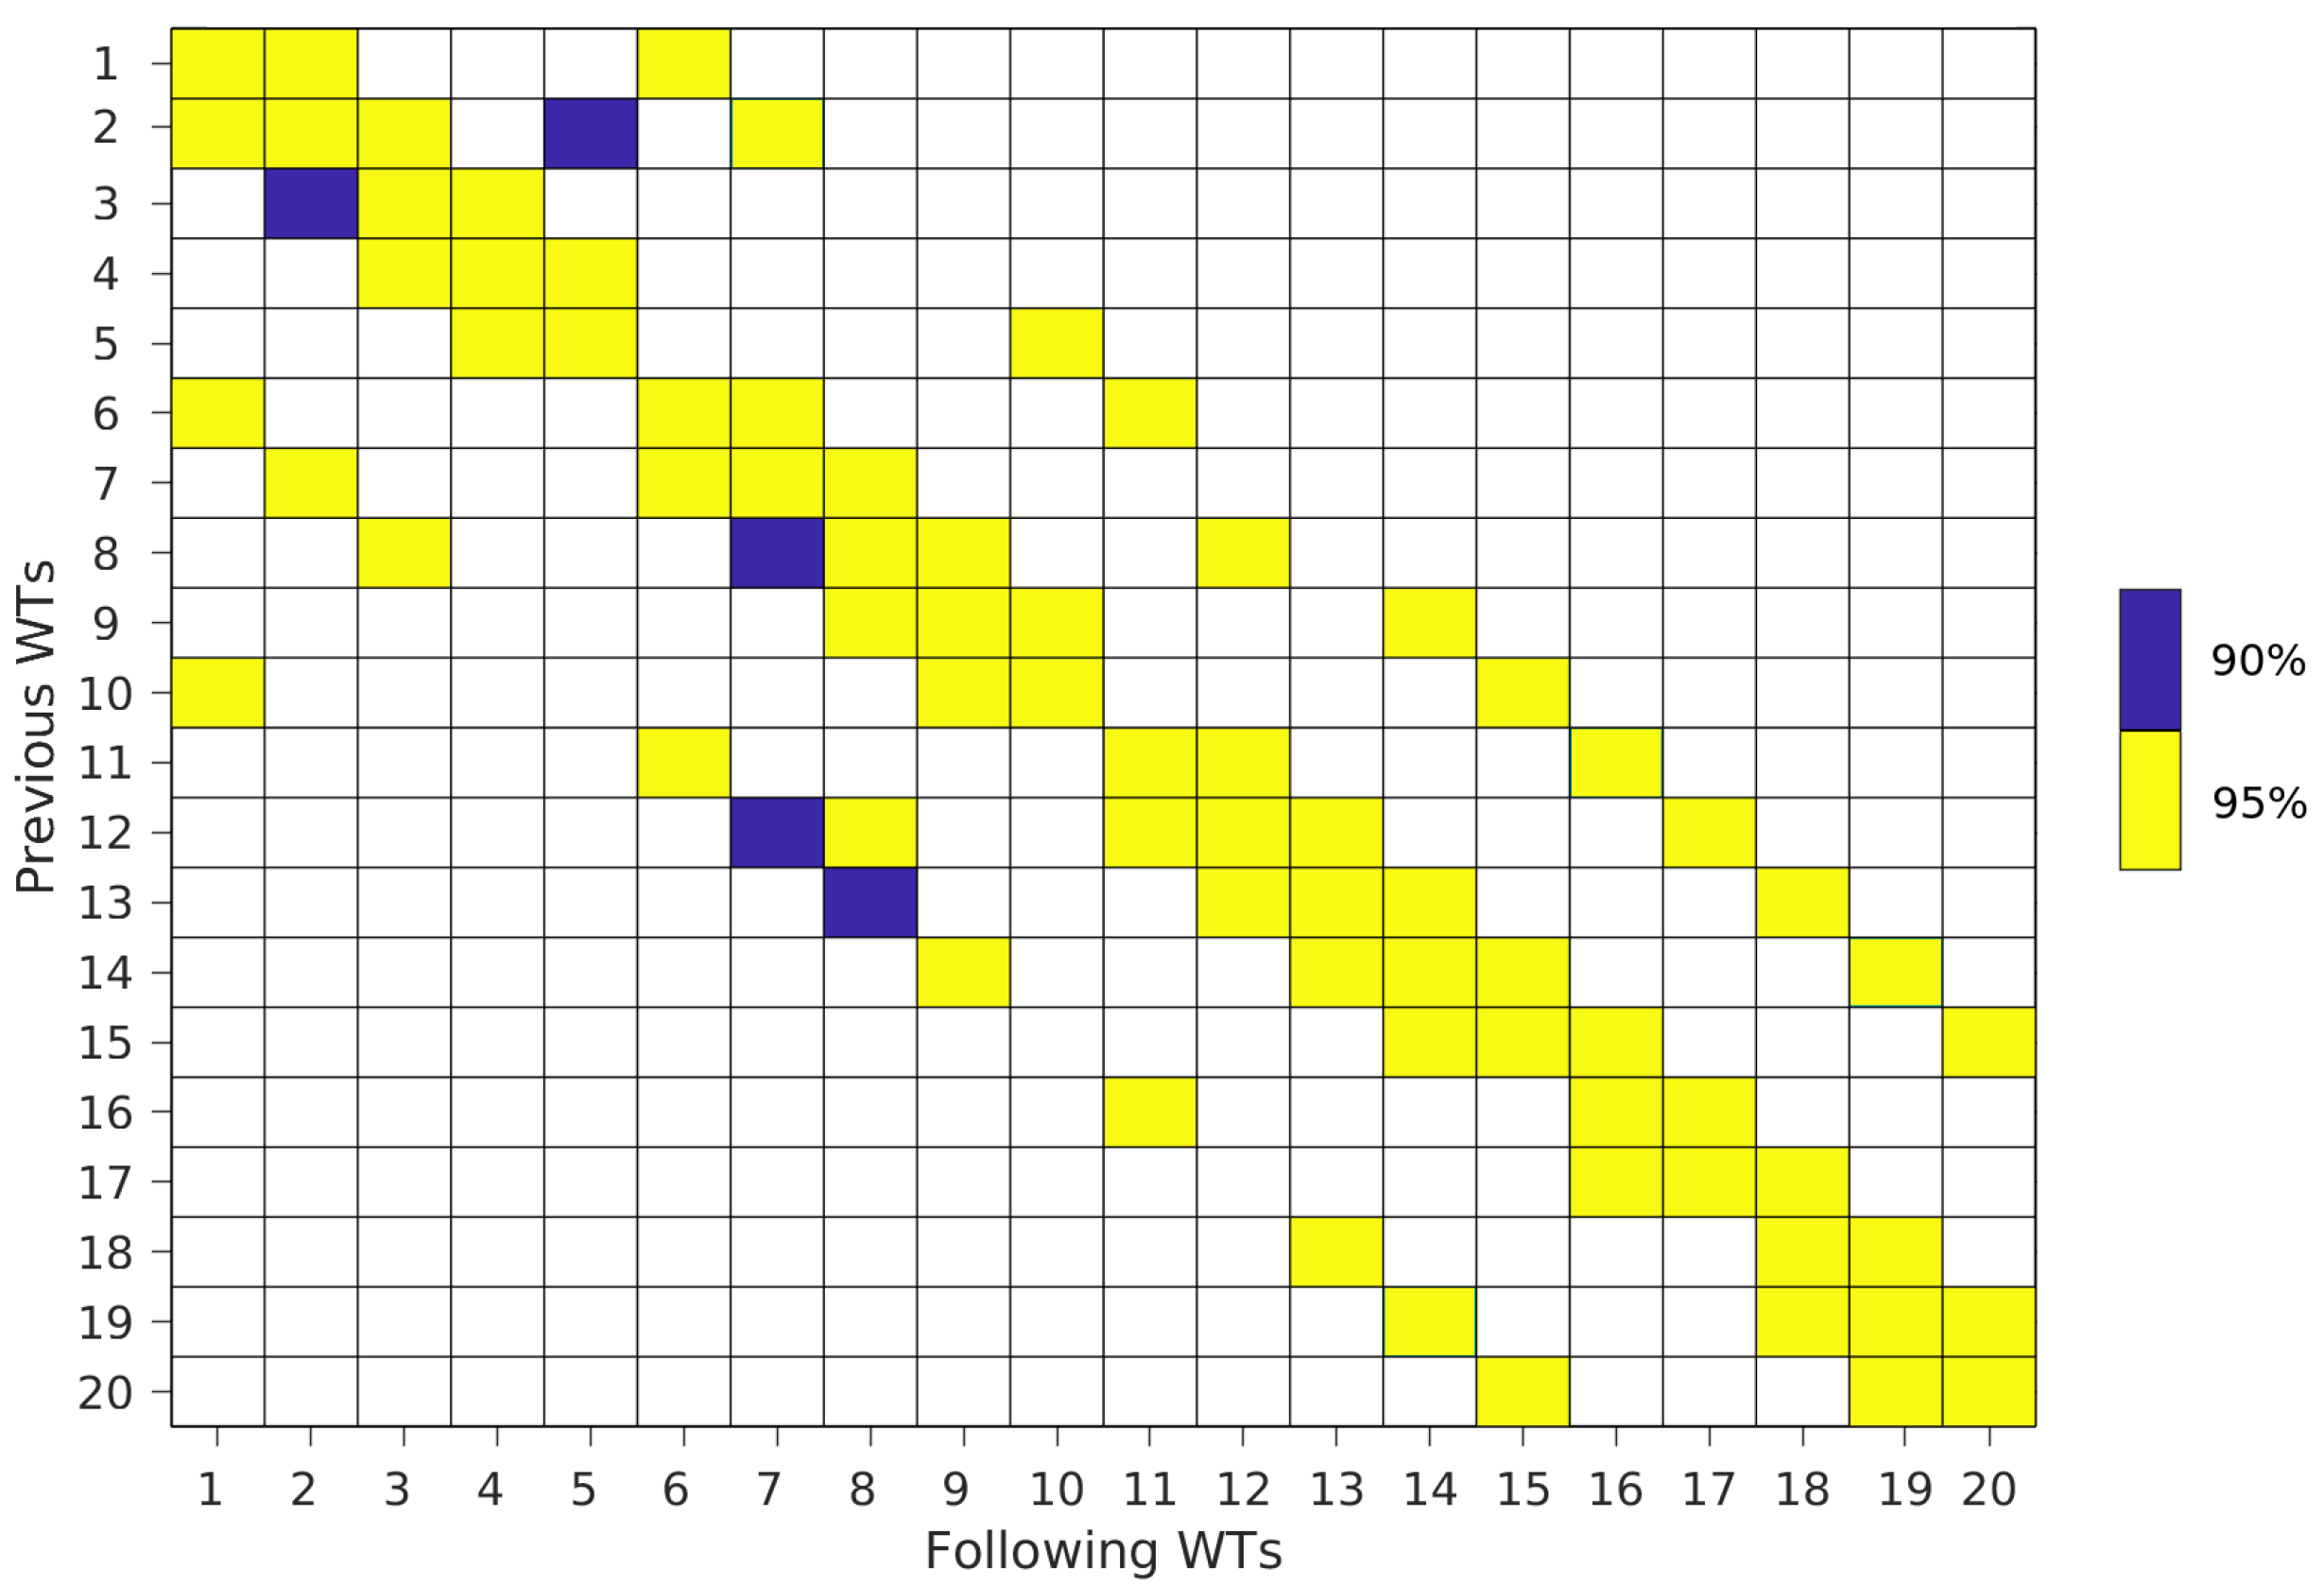
2.2. Persistence and Transitions of Weather Types

As stated in the prior sub-section, the prescribed number of nodes (20 in this study) for the SOM algorithm determines the number of discrete WTs. We denote each of these WTs as WT j with j = 1.20 . The algorithm allocates a set of daily events to each WT. In order to evaluate the synoptic-scale variability of WTs, we first define an “event” as a sequence of consecutive days greater than or equal to two days featuring the same WT. Mean persistence of a WT is measured as the average duration of all events with the same WT.
Transitions that occur on a day-to-day basis between WTs are computed assuming that transitions from one WT to another behave as in a Markov chain process [47]. In this process, it is assumed that the probability of transition between two atmospheric circulation states depends only on the previous one. This assumption permits the computation of the statistical significance of transitions among the WTs. The usage of a Markov chain process is justified a posteriori in the results section and we note that several past studies on weather typing have utilized it [47,48,49]. Statistical significance of transitions is calculated as in Vautard et al. [47], using a Monte Carlo test with 10,000 permutations defining a confidence level of 90%.
Finally, to account for transitions within the annual evolution of T2m and precipitation over most of the MAR (which has a large spatial variability), we propose to consider two main periods. These are defined as a wet period (May to October) and a dry period (November to April) [25,33]. Following Jáuregui [20], we further subdivide the dry period in two: a dry-cold (November–February) period for the winter season and a dry-warm (March–April) period for the spring season.

3. Results and Discussion

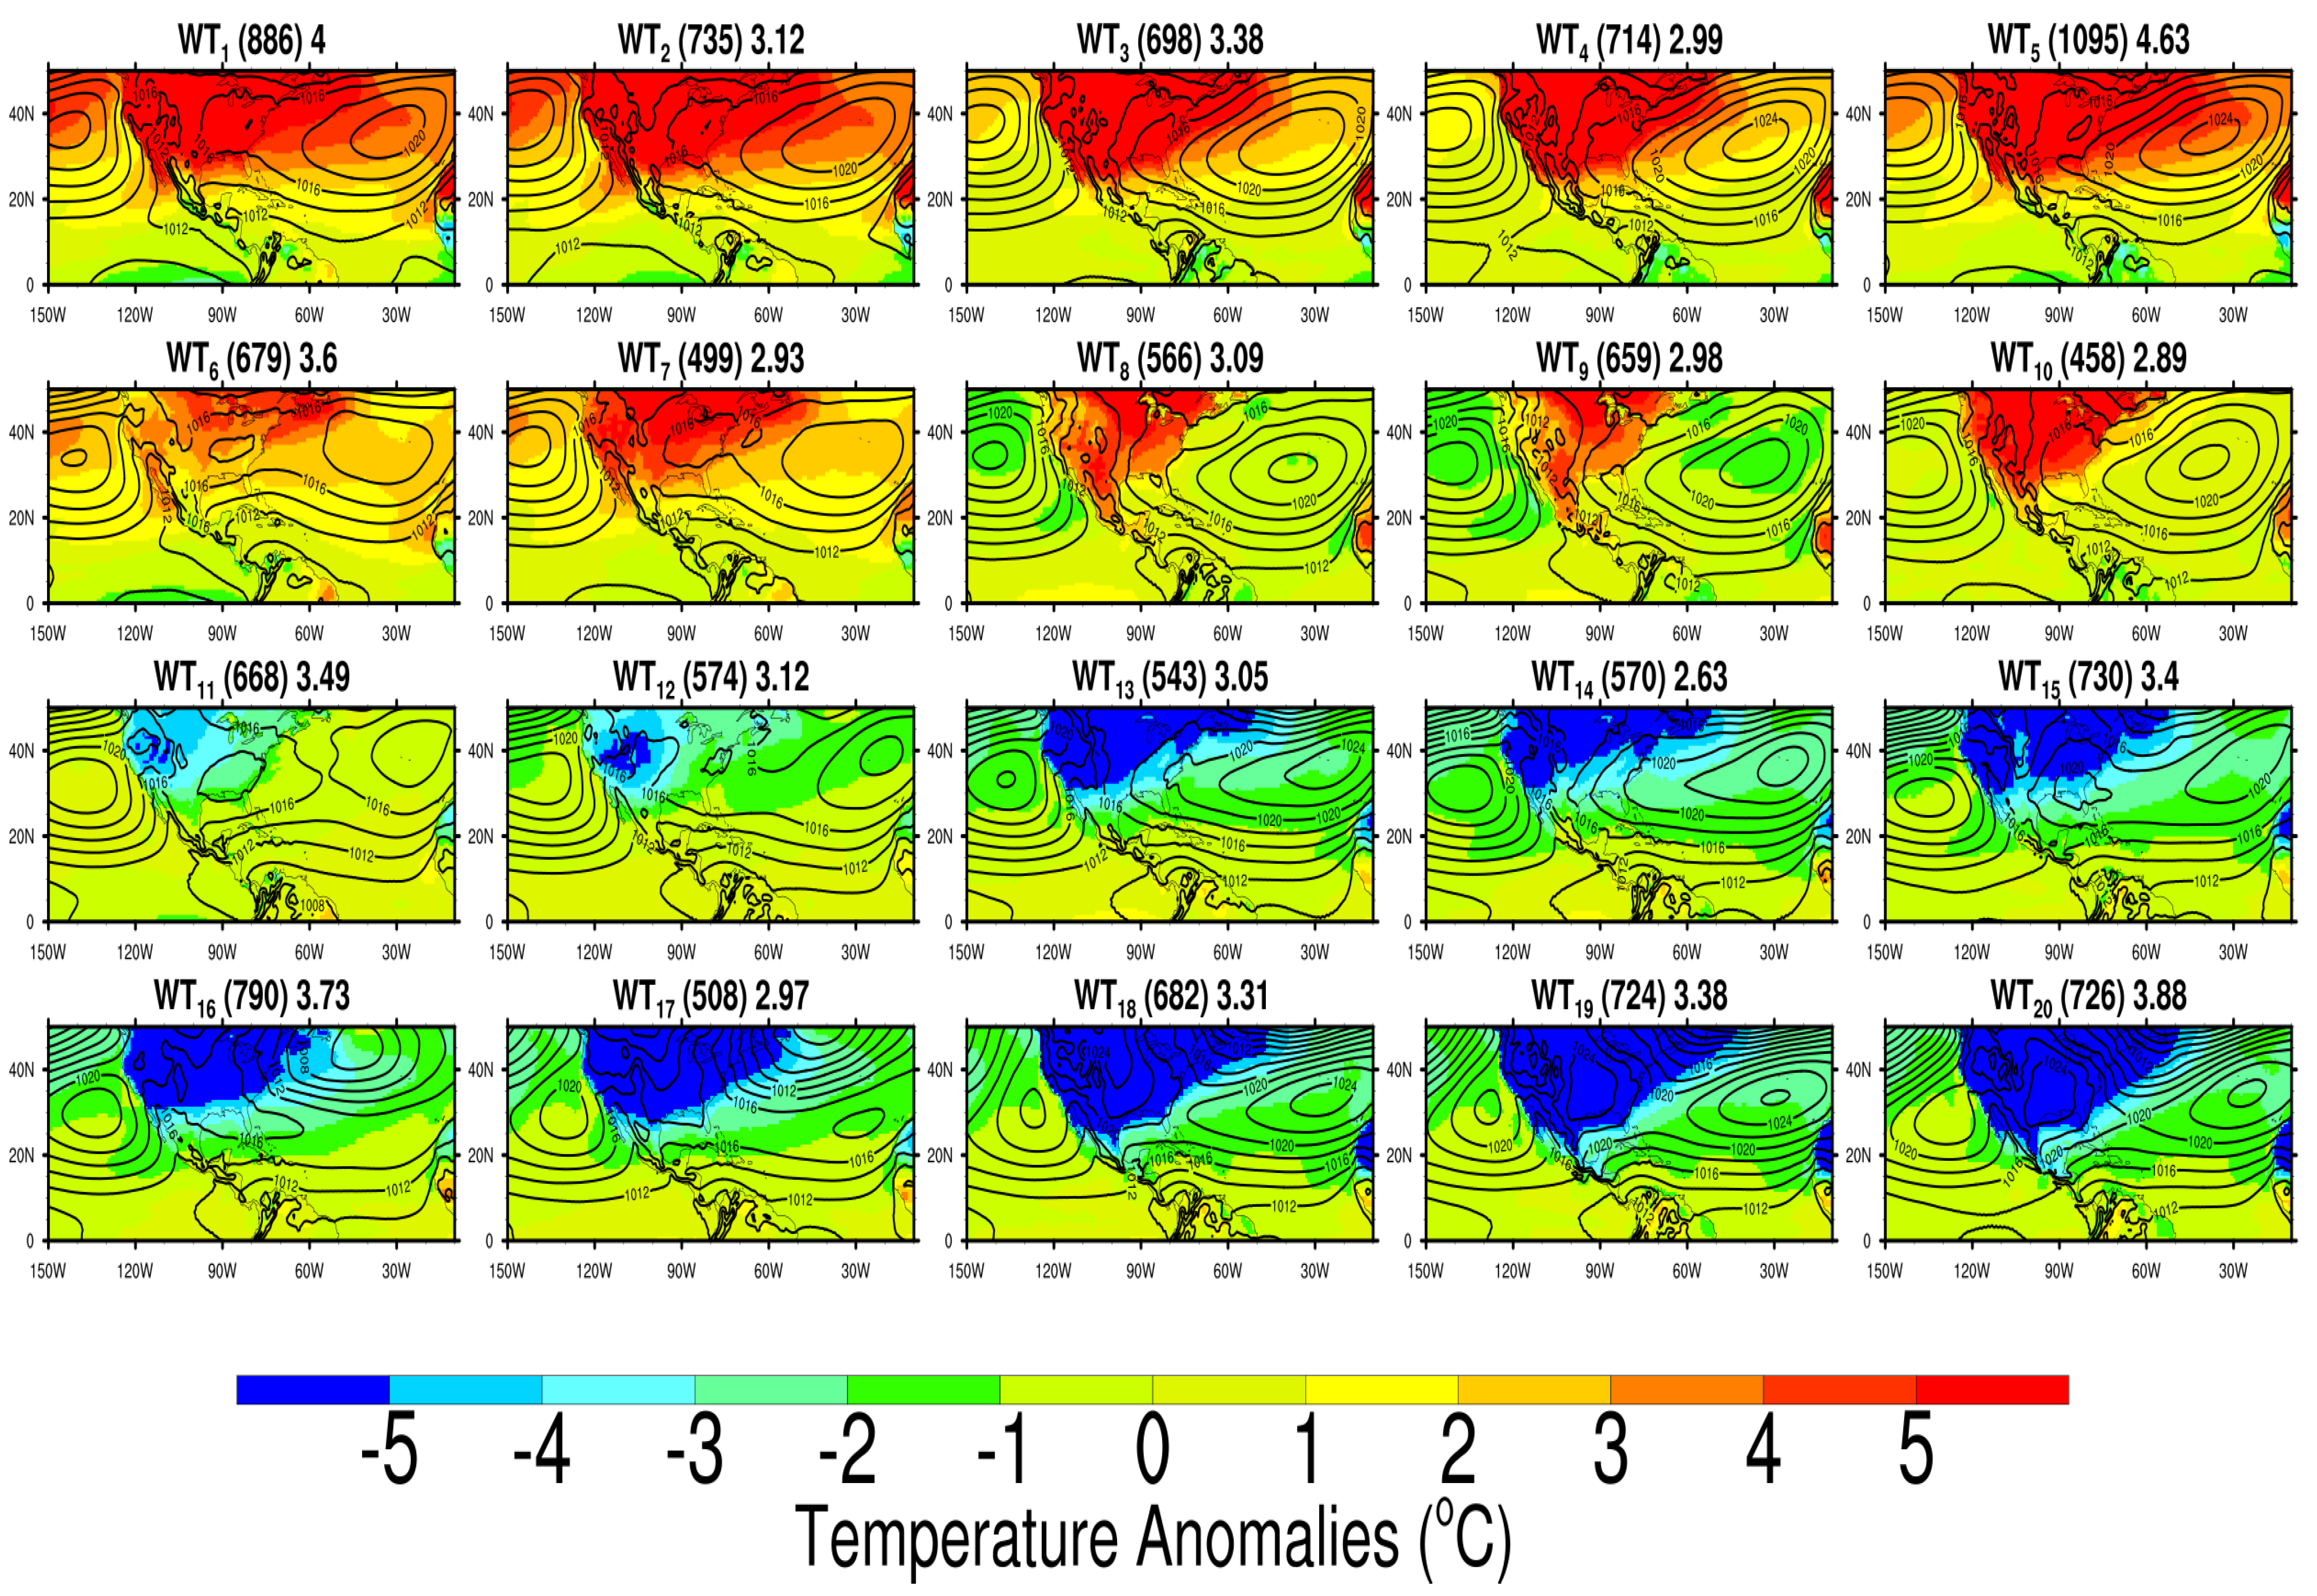
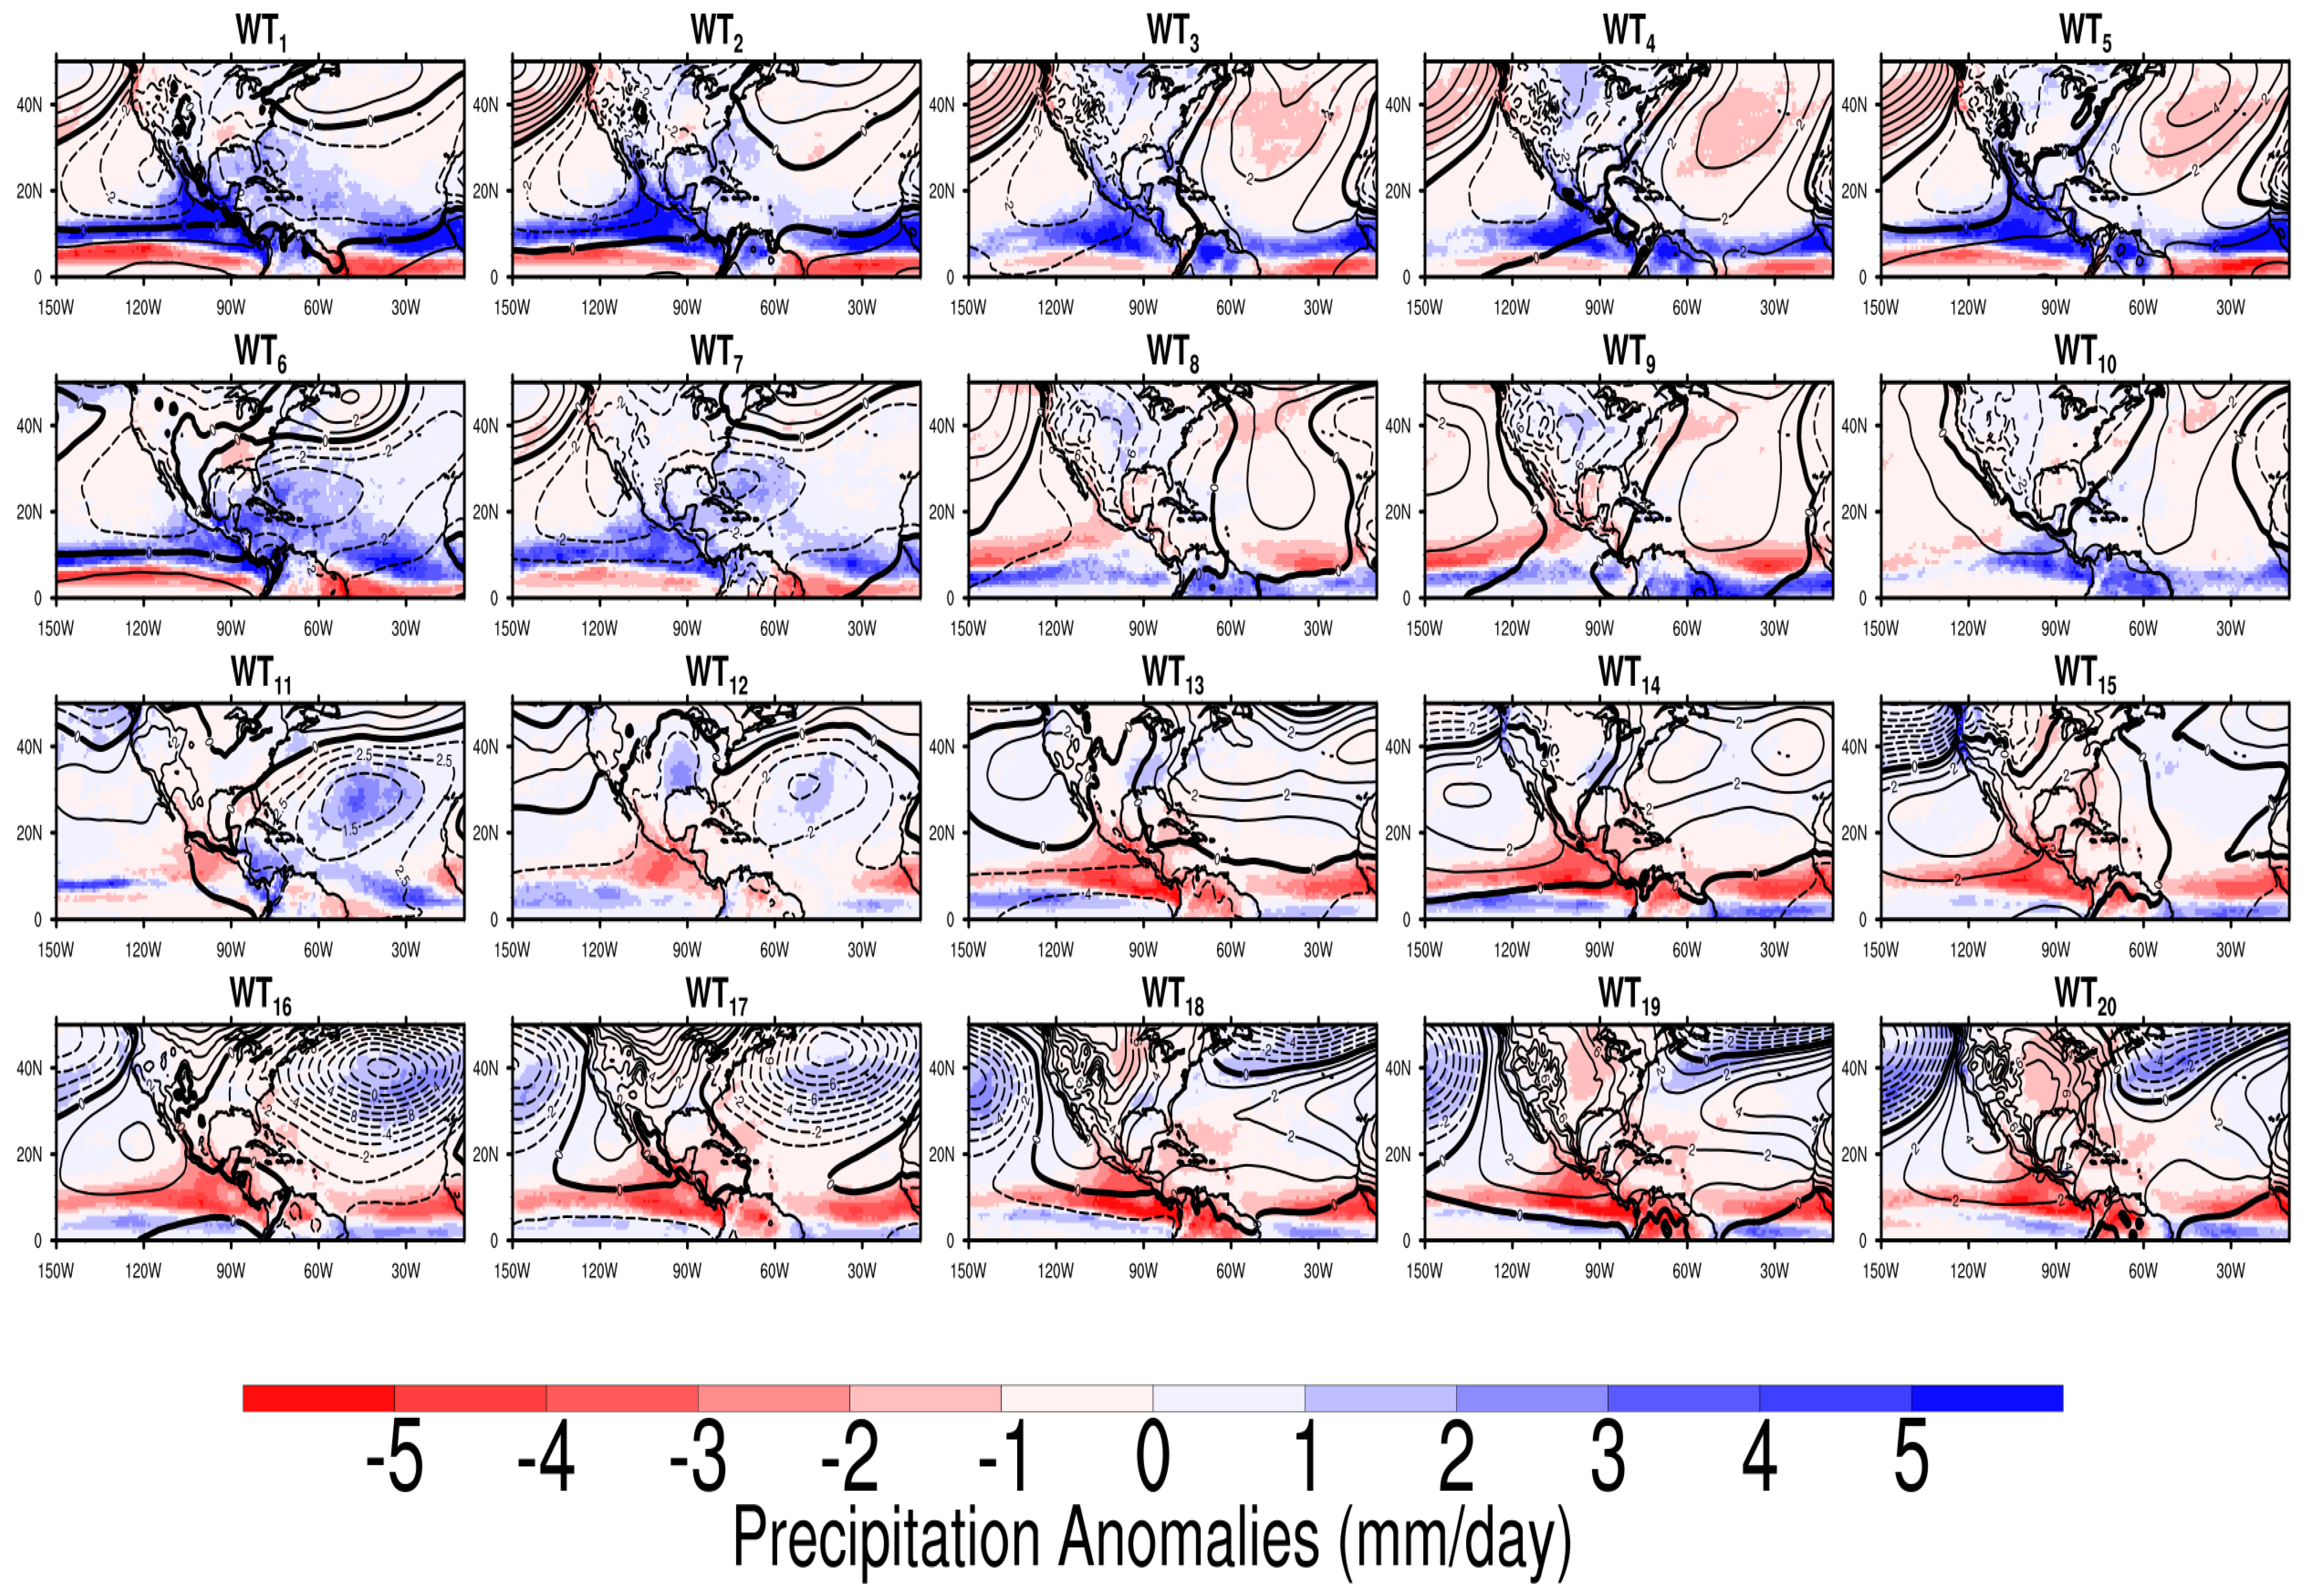
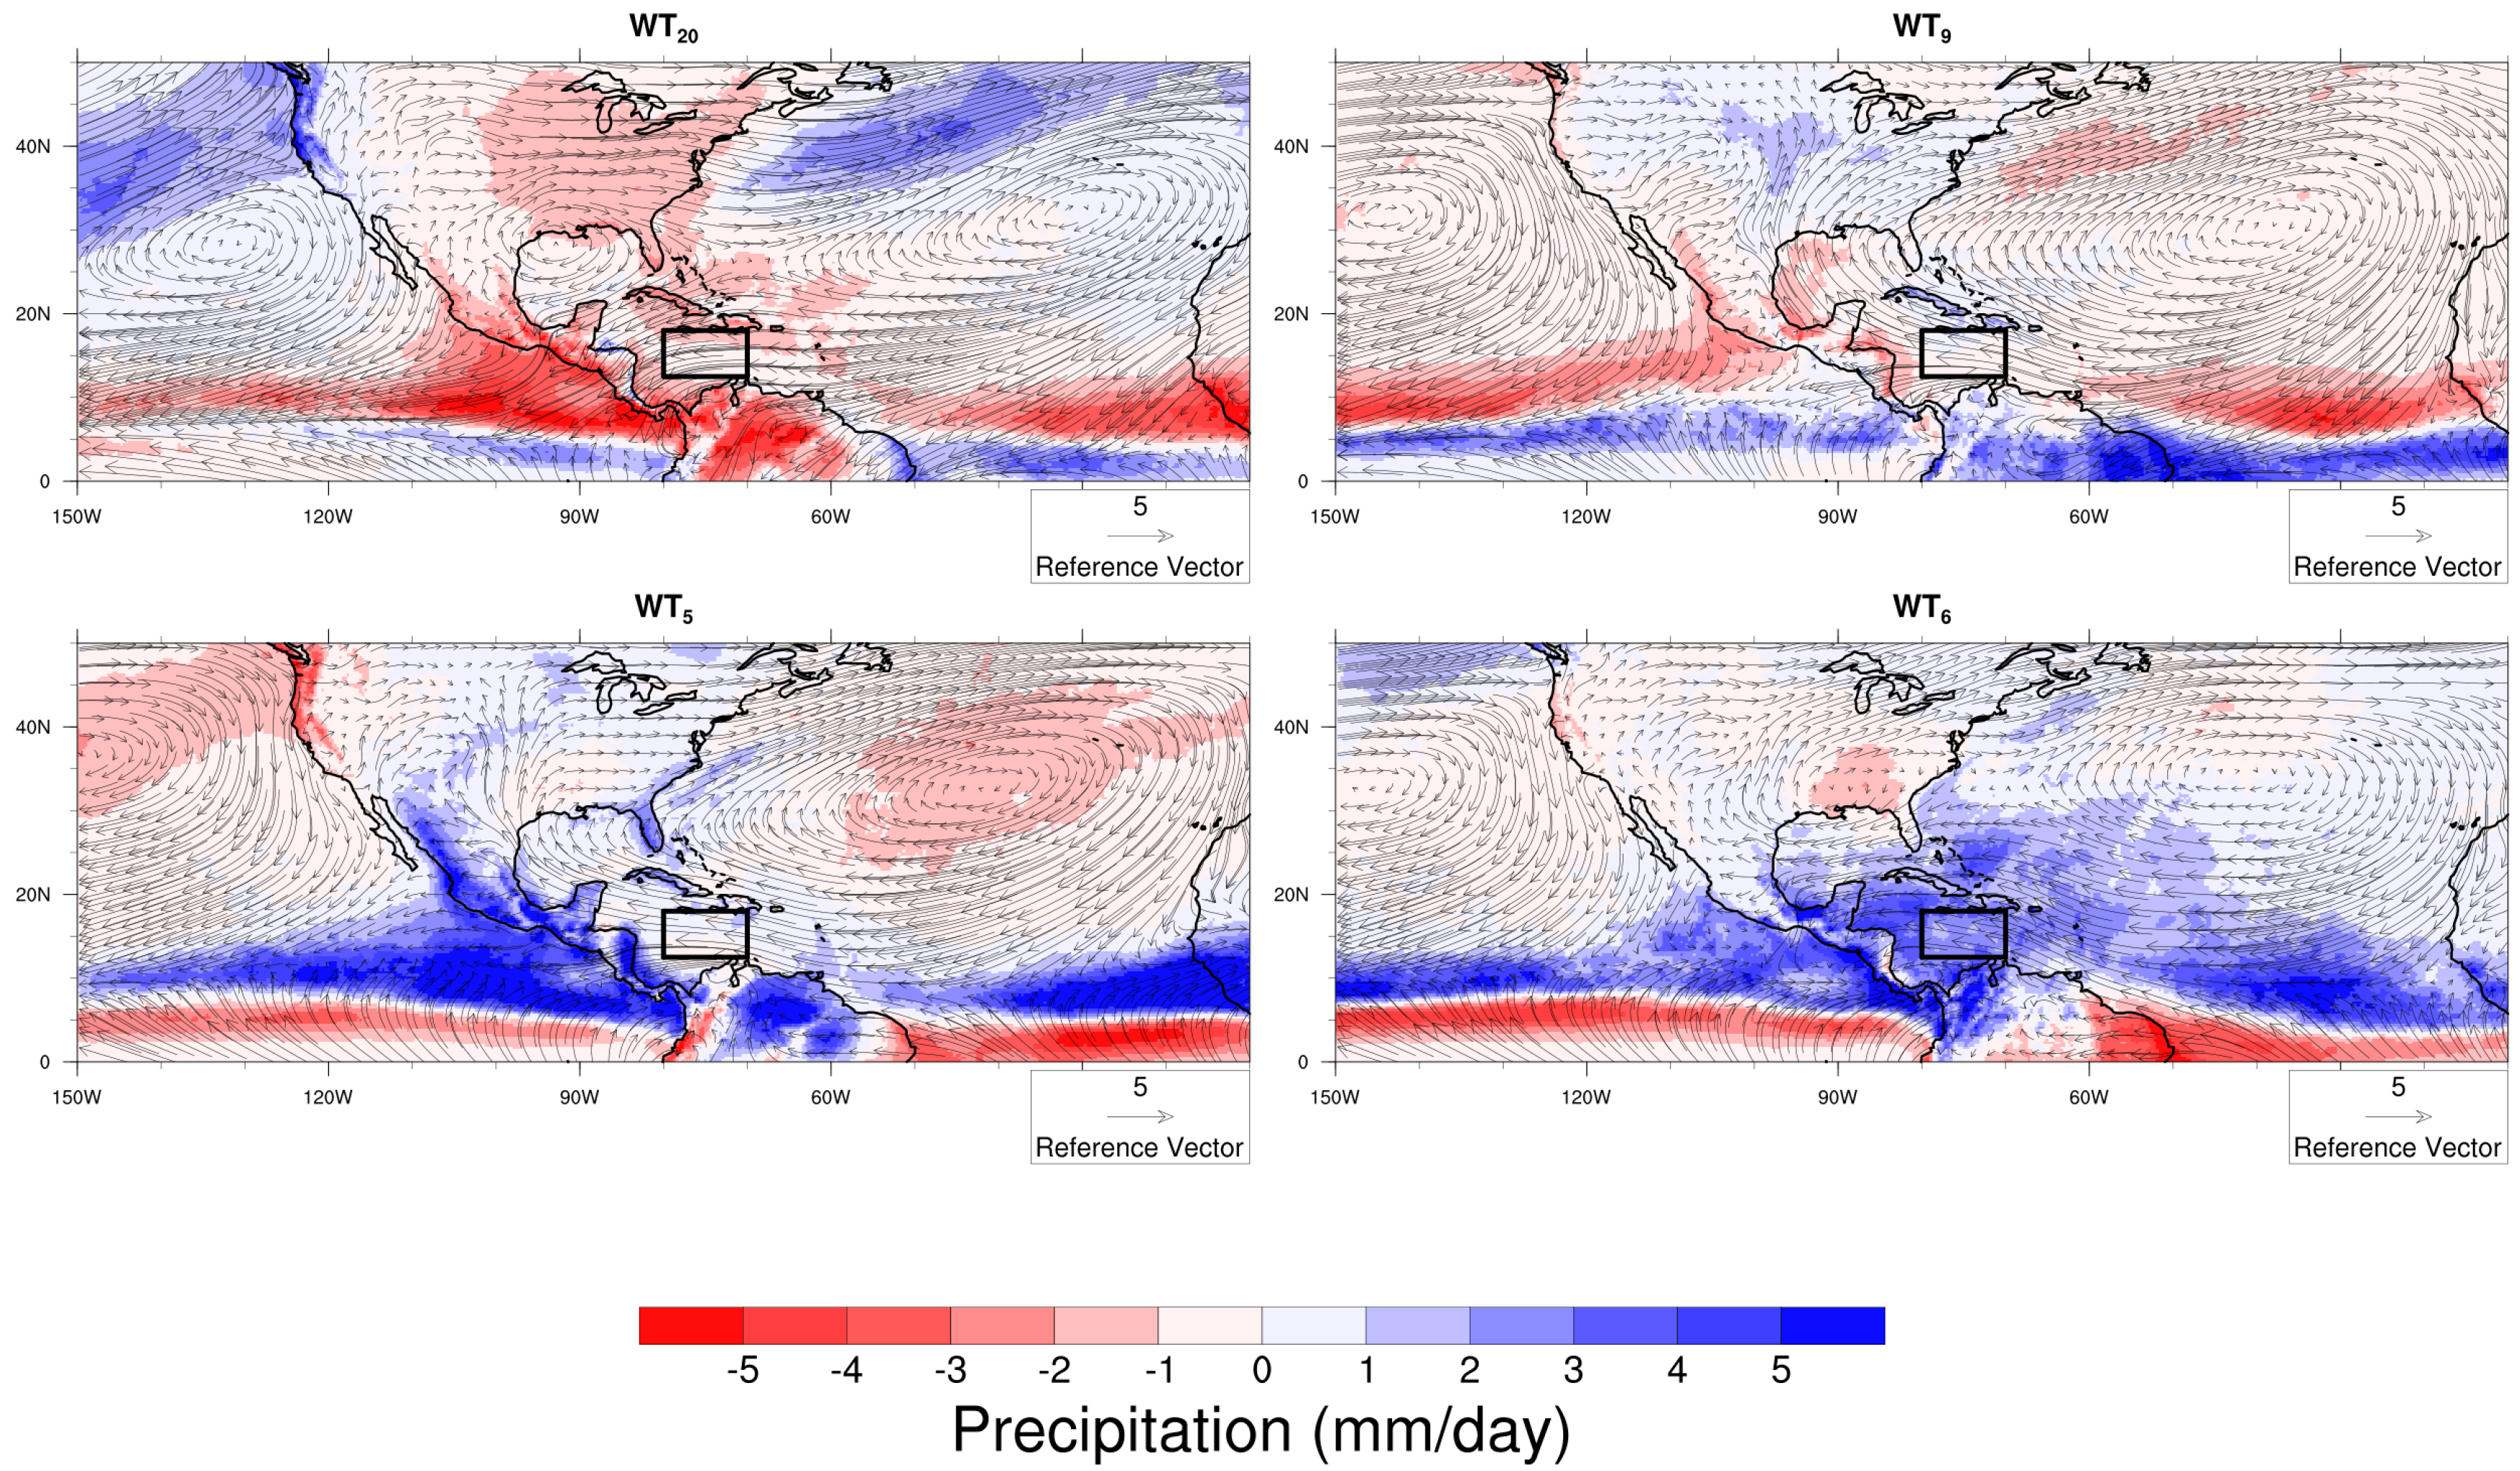
3.1. Synoptic Analysis

Figure 1 shows the MSLP and T2m anomaly fields composites from ERAI as the average of all weather events that fall into each of the 20 WTs. All WTs in Figure 1 show the NPH and NASH semi-permanent pressure systems over oceanic regions in the MAR. In this respect, the MAR domain is sufficiently large to capture the annual march of both features as expressed with MSLP fields. Both NPH and NASH move northward during the dry period and southward during the wet period of the MAR, a well-known feature of the MSLP field in the North Pacific and North Atlantic, respectively [29,33,50]. The position of these two semi-permanent systems is crucial to determine how synoptic conditions over the study area evolve spatially and temporally [51]. Hence the discussion of results in this study hinges on the behavior of both the NASH and the NPH throughout the year. Figure 1 also reveals a clear separation between wet ( WT 1 to WT 10 ) and dry ( WT 11 to WT 20 ) periods. The wet period is composed of two parts; the first from WT 1 to WT 5 , has positive T2m anomalies of up to 5 °C over the North Atlantic. The second part from WT 6 to WT 10 has T2m anomalies that can be as negative as −2 °C. In Figure 1 the T2m anomaly contours between 4 and 5 °C follow the longitudinal shifts of the NASH pressure centers from WT 1 to WT 5 quite clearly, indicating a strong link between the NASH dynamics and T2m anomalies for these WTs that are part of the wet period. The spatial pattern correspondence between T2m anomalies and the NASH spatial pattern in MSLP is lost in the second part of the wet period from WT 6 to WT 10 . For the dry period, on the other hand, a more uniform T2m anomaly distribution than the wet period is evident. This can be noted in Figure 1, where T2m temperature anomalies from WT 11 to WT 20 , range from 1 to −3 °C in both ocean basins. From ( WT 11 to WT 15 ) the MSLP pattern consists of weaker pressure centers for the NASH, compared to their wet counterparts with a longitudinal shift towards the eastern Atlantic.
The anomalous warming off the east coast of the US during the wet period can be partially explained by advection of low–level wind that is close to geostrophic balance, as seen in WT 1 through WT 5 (see Figure 1). On the other hand, the next row below, from WT 6 through WT 10 shows the NASH pressure center shifting longitudinally to the east with a southerly wind that is weaker compared to the southerly wind of the WTs in the upper row for the wet period, causing, as noted before, negative T2m anomalies. During the dry period, a strong trough wind advects cold air masses from mid-latitudes to the subtropics for WT 13 through WT 20 (see Figure 1). Lower latitudes have weaker spatial temperature gradients and so wind advection has little impact on temperature anomalies, as can be seen in all WTs in Figure 1. WT 11 and WT 12 show mixed conditions that can be associated to the seasonal march from wet to dry period.
Figure 2 shows the WTs as expressed in anomalies in MSLP and precipitation. The anomalies presented in this figure reflect the dry and wet period transitions between WTs, as shown in Figure 1. They also show that the catalog of WTs obtained from SOM has a clear physical interpretation. There is a high correspondence between low (high) pressure anomalies and positive (negative) precipitation anomalies between 15° N and 50° N. The latitudinal movement of the Intertropical Convergence Zone (ITCZ) southwards (northwards) in dry (wet) periods produces a deficit (surplus) in precipitation in the tropical band between (0° N–15° N) in both ocean basins [33]. A good agreement between MSLP anomaly fields and precipitation anomaly serves as a verification that the WT catalog can properly identify circulation patterns in the subtropics and tropics in a consistent way.
From Figure 2, two representative WTs for winter are WT 16 and WT 19 . These WTs show different MSLP large-scale configurations from the tropics to higher latitudes. WT 16 shows a deep anomalous trough over the North Atlantic and WT 19 shows a longitudinal shift of the NASH pressure center to the east. Over the continent, positive anomalies in MSLP are present in WT 19 , whereas for WT 16 MSLP anomalies are close to zero. Finally, another feature is WT 12 , which corresponds to the dry-cold period in the MAR. This WT shows positive precipitation anomalies over the southeastern US that correlate very well with negative MSLP anomalies; as mentioned before, it is probably linked to the seasonal march from dry to wet period. Regarding the wet period, WT 5 represents typical wet period conditions characterized by a positive precipitation anomaly along from northern South America, Central America, Mexico and the central US. This is consistent with negative anomalies of the MSLP over the northwestern coast of Mexico when the rainy season is well established.

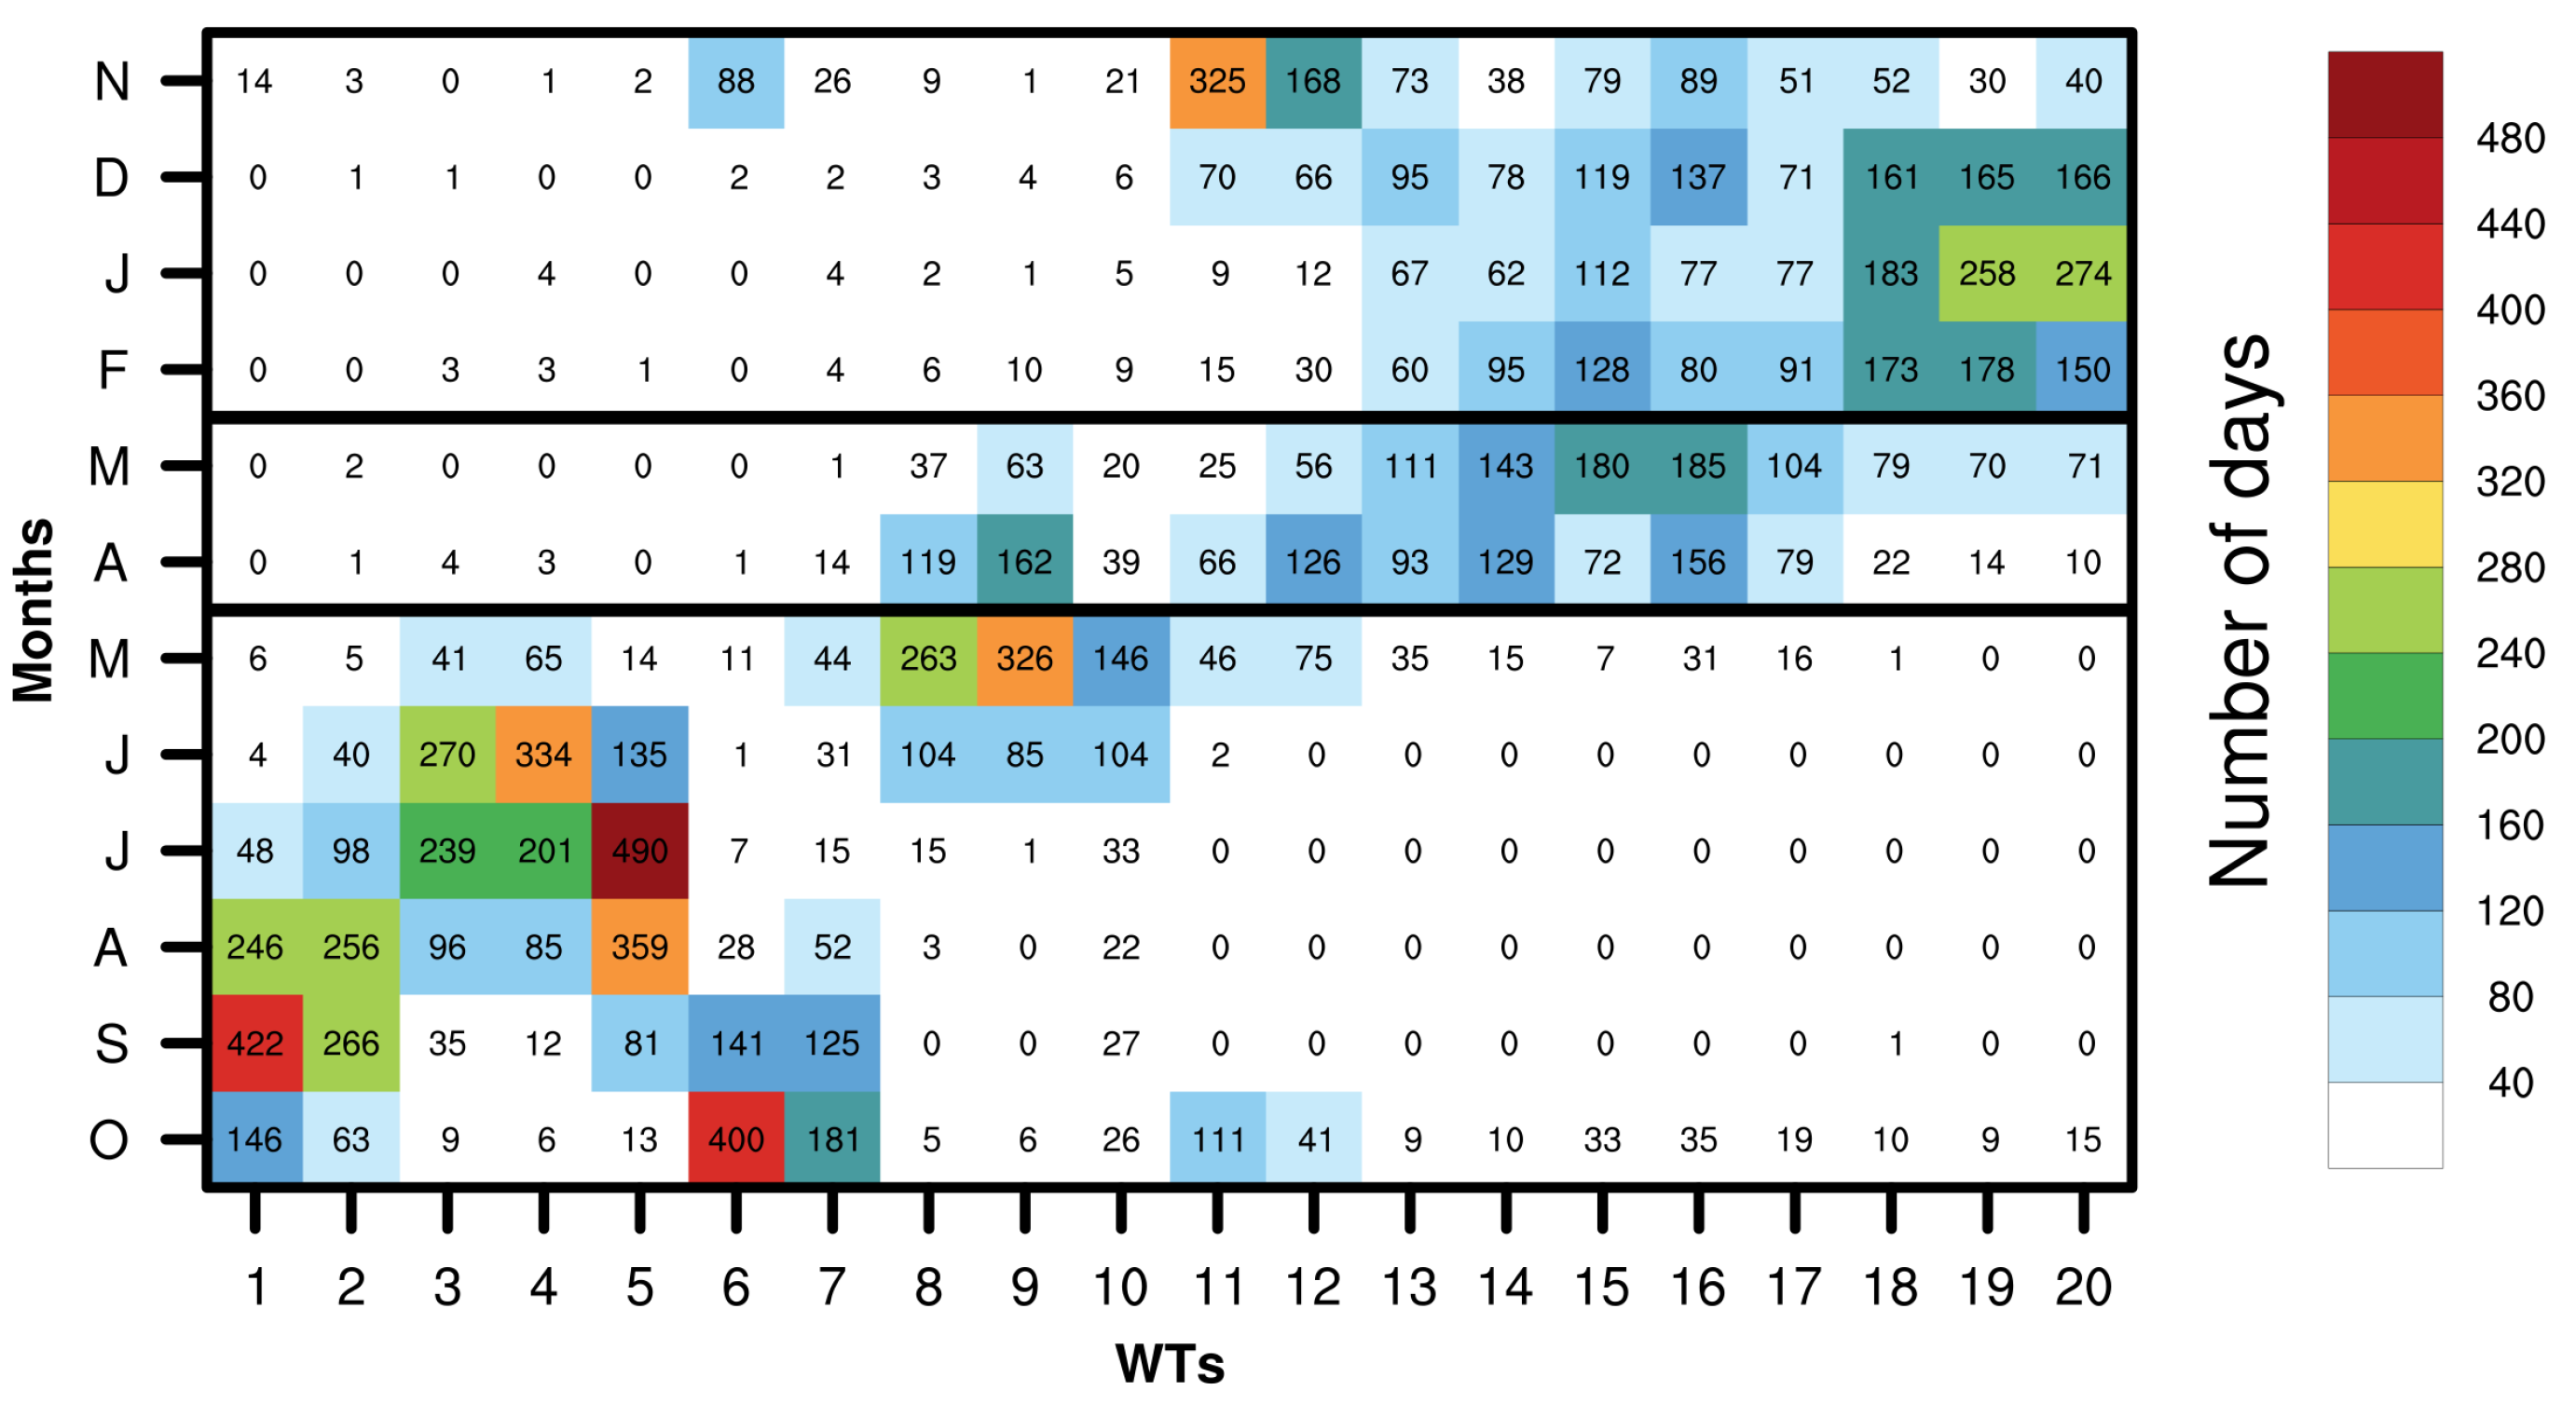
3.2. Monthly Frequency and Persistence of Weather Types

In order to gain insight about the frequency distribution of WTs and their intraseasonal variability, a plot of the frequency for the WTs as a function of the month is shown in Figure 3. Figure 3 also highlights the distinct monthly separation that exists among the various resulting synoptic patterns from SOM. The accumulated frequency of patterns from WT 18 to WT 20 peaks in December–January–February, corresponding to winter. Frequency for patterns from WT 13 to WT 17 is distributed along the dry period months with a small peak in March. Patterns from WT 3 to WT 5 accumulated frequency peaks in June–July–August during the wet period. WT 1 and WT 2 exhibit a peak in frequency for September and similarly WT 6 and WT 7 for October. In summary, Figure 3 shows that WTs tend to have well-defined clusters during the wet period while during the dry period the WTs show a tendency to be dispersed almost uniformly across that period.
Figure 3 highlights how the SOM’s nearest-neighbor function locates similar WTs close to each other in node space. This results in clustering around certain high-frequency WTs, facilitating the recognition of distinct groups of WTs distributed according to the time of the year. During the winter season (see definition in Section 2.2) three WTs stand out: WT 18 , WT 19 and WT 20 , which together comprise 51% of all WT occurrences for the months of December, January and February. This frequency of occurrence for these three WTs has a strong implication for the behavior of the MSLP. All three WTs are characterized by the presence of a strong trough located in the western North Atlantic (as explained earlier) that shifts the pressure center of the NASH to the southeast between 25–30° W and 35° N. This behavior corresponds quite well with the second peak during the dry-cold period of the Caribbean low-level Jet [27] a topic that will be further discussed in Section 3.4. These typical winter patterns have a well-known representation in the literature [33,50,51]. During the wet period, WTs have larger frequencies of occurrence than their winter counterparts (see Figure 3). Figure 3 indicates that during the wet period, WT 1 through WT 7 are grouped into three clusters. The first cluster involving WT 1 and WT 2 constitutes 41% of all instances for August, September and October. A second cluster formed by WT 6 and WT 7 for September and October represents 37% of all occurrences for these two months. The most conspicuous cluster in terms of frequency is formed by WT 3 , WT 4 and WT 5 , which together are 65% of all instances for the months of June through August. WTs that fall in September and October ( WT 1 , WT 2 , WT 6 , WT 7 ) exhibit similar patterns over the Gulf of Mexico and the Caribbean Sea, with negative MSLP anomalies corresponding to positive precipitation anomalies and a weak influence of the NPH. The presence of WT 3 , WT 4 and WT 5 corresponds to the precipitation peak during the wet period with positive precipitation anomalies all over the continent, but with anomalies close to zero over the Gulf of Mexico and the Caribbean Sea.
The WT catalog offers more information regarding the continental US. For instance, WT 8 and WT 9 display positive precipitation anomalies in the Great Plains region in May, coincident with the onset of the wet period for the MAR (see Figure 1 and Figure 2). The anomalous precipitation has been linked to the Great Plains low-level jet [52], whose variability has been linked, in turn, to the westward (eastward) movements of the NASH with increasing (decreasing) ridging in the central US and to the Pacific Decadal Oscillation [53]. WT 18 , WT 19 and WT 20 exhibit lower precipitation than normal over the continent and larger than normal over the northern Atlantic Ocean. The trough over the east coast of the US is correlated with a positive precipitation anomaly and the spatial patterns of these WTs are close to those WTs found by Roller et al. [54] (see their [54] Figure 4). Finally, WT 11 marks the end of summer and the beginning of winter, when it becomes the dominant pattern in November (see Figure 3). This suggests that WT 11 may play a role in intraseasonal variability at this time of the year.
An important metric that can give an insight into possible changes and variability in precipitation or T2m of WTs for a given area is mean persistence. Persistence was defined earlier (see Section 2.2) as the number of consecutive days that remain in a WT. WTs with high frequency of occurrence in the whole catalog, such as WT 5 and WT 16 , are present in 208 and 181 events, respectively (not shown). These events can last a maximum of 30 days for WT 5 and 16 days for WT 16 . With respect to mean persistence in days, WT 5 and WT 16 show the highest mean persistence for the wet period (4.63 days) and dry period (3.4 days) (see Figure 1). In this way, when WT 5 and WT 16 occur, it is very likely that they last at least 3 or 4 days, although certain events might persist longer.

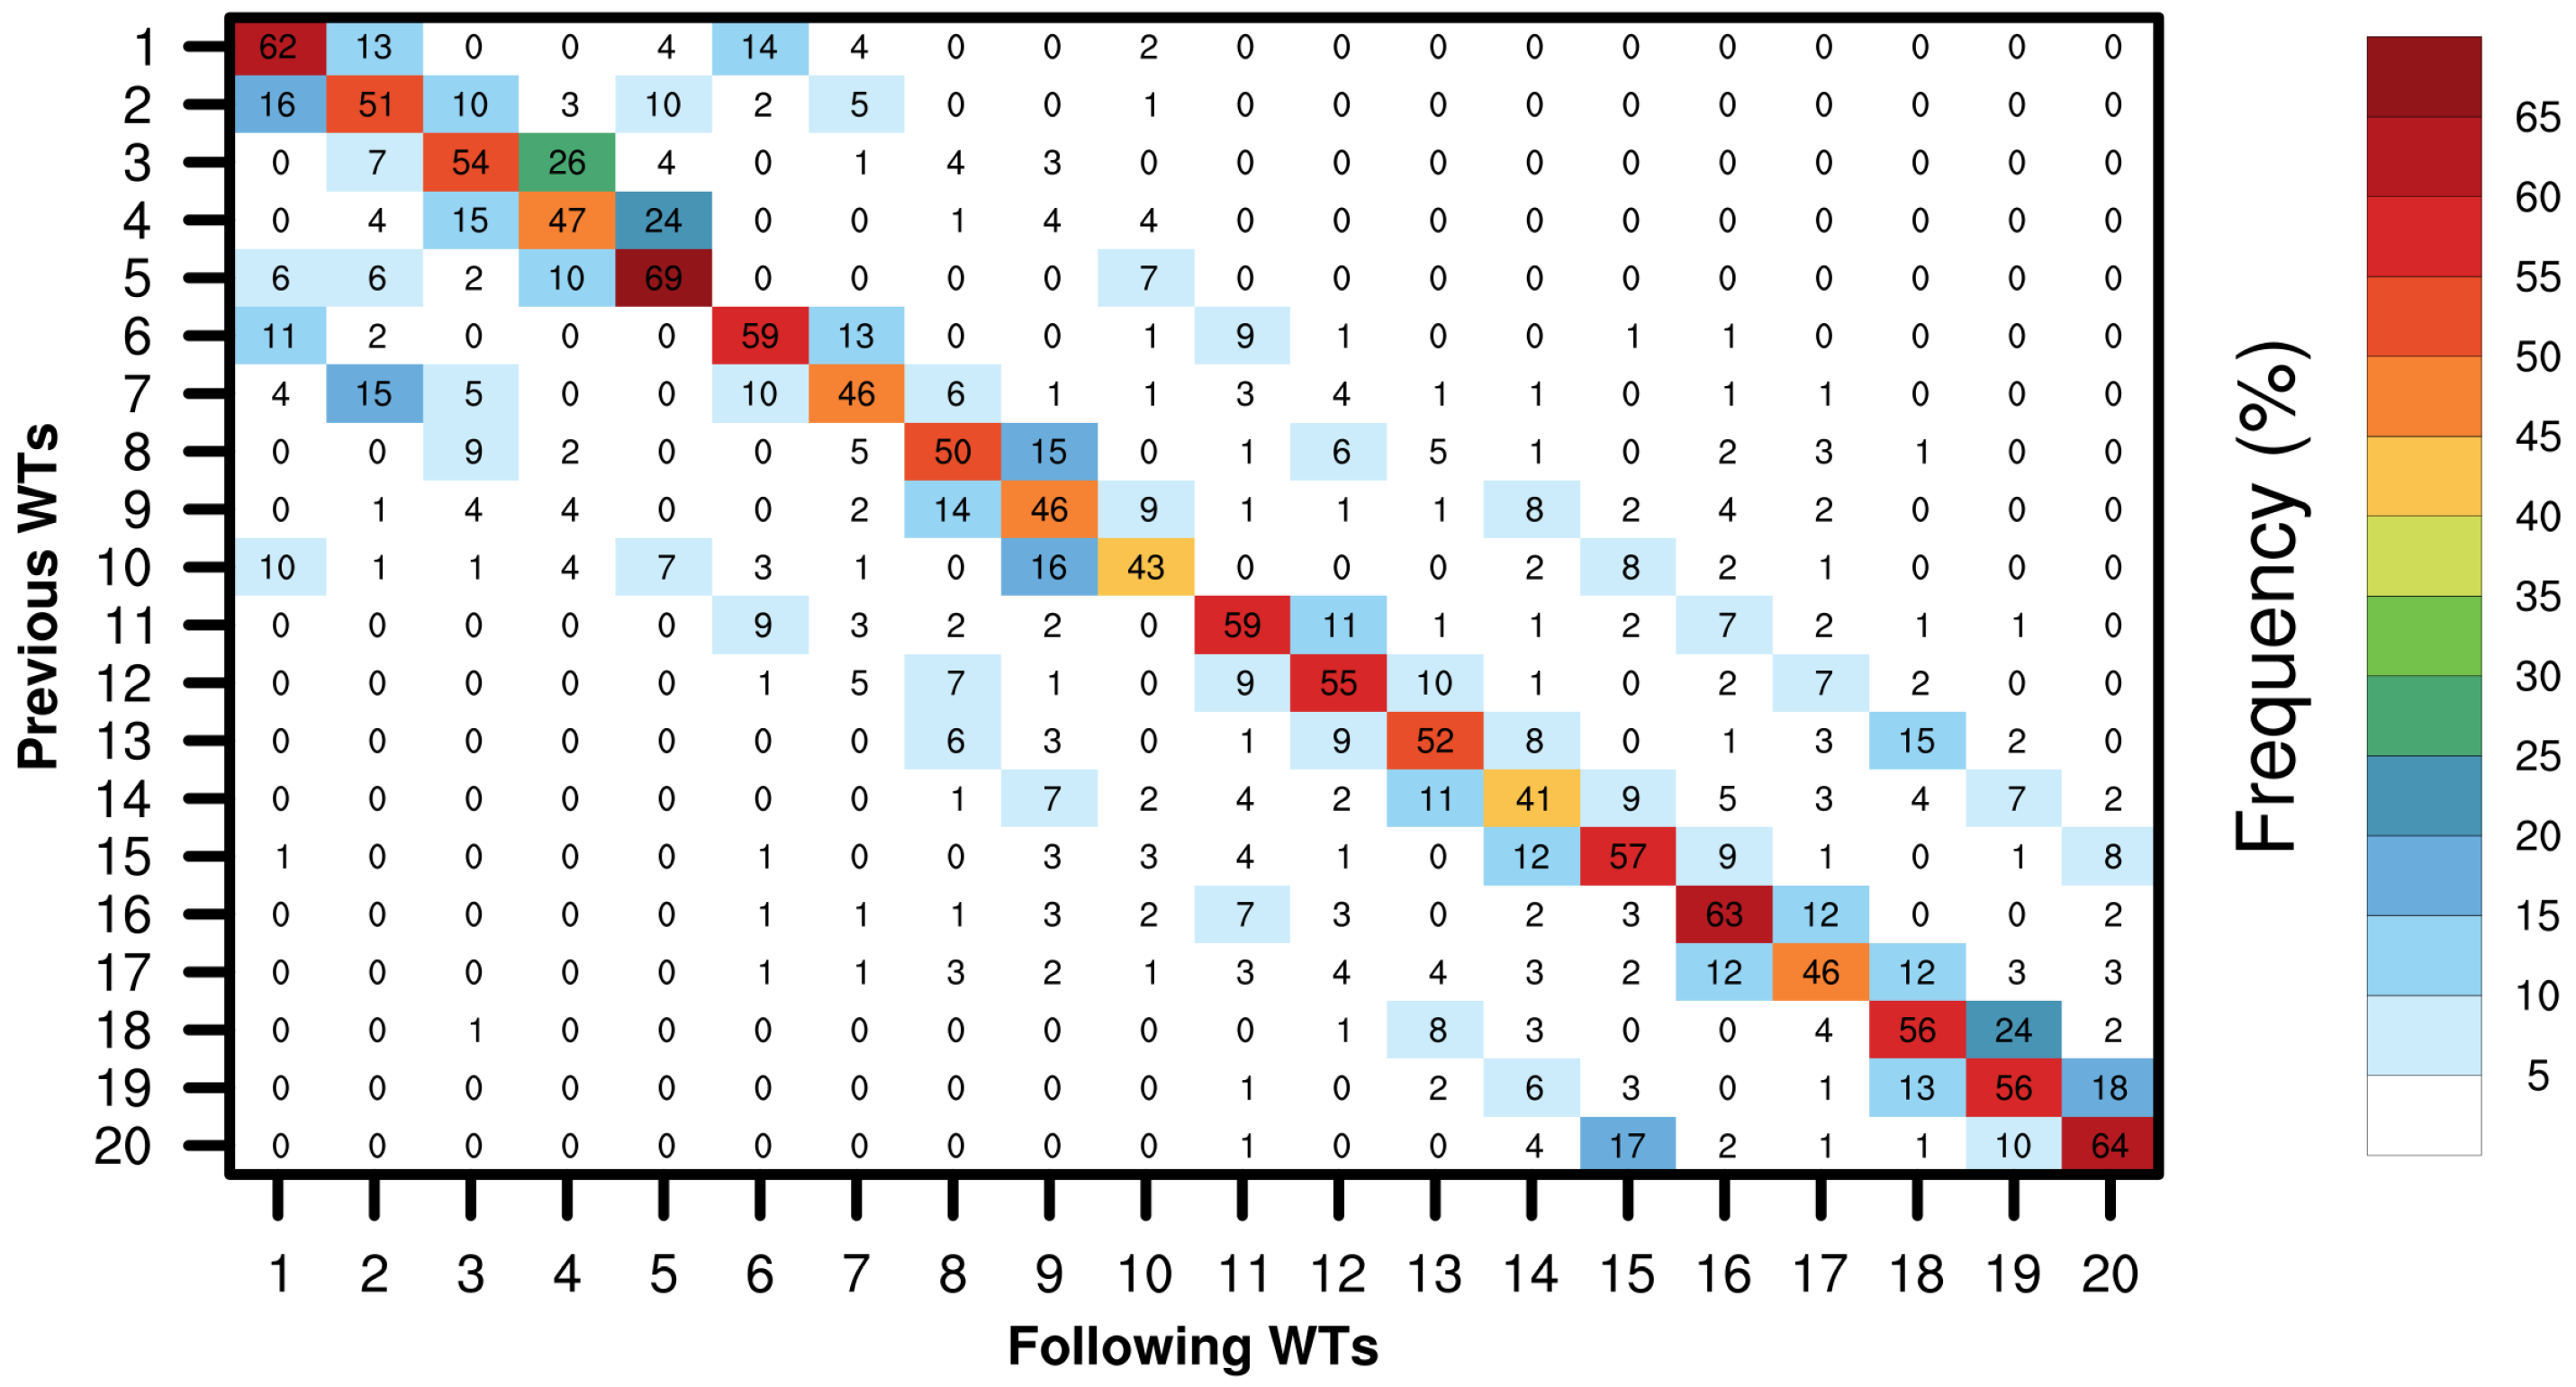
3.3. Transitions of Weather Types

Figure 4 shows the transition matrix for all WTs as defined in Section 2.2. Rows represent the previous WTs and columns contain the following WTs, while the diagonal represents transitions occurring for the same WT. By design, the SOM algorithm places similar nodes in proximity within the SOM matrix. In this sense, we expect transition probabilities to be high for neighboring entries. This expectation needs to be considered when physical interpretation of the resulting WTs and their transitions is made. In fact, Figure 4 shows higher frequency values (larger than 40%) for the diagonal of the SOM matrix compared to values in off-diagonal entries (up to 26%). Consider the transition WT 4 WT 5 , which accounts for 24% of all possible transitions with respect to other WTs originating from WT 4 during the wet period (see Figure 1). Notably, the reverse transition WT 5 WT 4 shows a frequency of only 10%. Further analysis of this pair of WTs reveals subtle but important differences among MSLP anomaly patterns that affect precipitation from June to August, when these two WTs are most likely to occur (see Figure 3). These WTs have a clear physical interpretation, since the associated precipitation and MSLP anomaly patterns (see Figure 2) in the transition WT 4 WT 5 are clearly related to the onset and mature stages of the North American monsoon, a topic in precipitation variability that will be discussed further in Section 3.5. As mentioned earlier in Section 3.2, during the winter season, transitions among three WTs stand out, namely WT 18 WT 19 and WT 19 WT 20 . When examining their transitions, it is also clear that they correspond to high values of frequency transitions of up to 24%.
Figure 5 shows WT transitions that are significant at the 90 and 95% levels. Focusing on those transitions off the diagonal it is observed that there are five transitions at the 90% level of significance while 54 are at the 95% significance level. Additionally, Figure 5 shows that transitions between neighboring WTs, off the diagonal, have the higher significance level. Possible transitions between distant neighbors do not survive the significance test. Thus, WTs with low-frequency transitions (<10% frequency) at 95% of significance normally occur along columns instead of rows in the SOM matrix (see Figure 1 and Figure 2). These transitions can be linked to the seasonal march between wet and dry periods; however, by design the SOM algorithm will group similar nodes that are close to each other in SOM space. A low significance result simply says that it is not possible to know the transition direction of a particular pair of WTs. Thus, transitions considered in the previous sections are to be taken as significant transitions for the synoptic analysis.

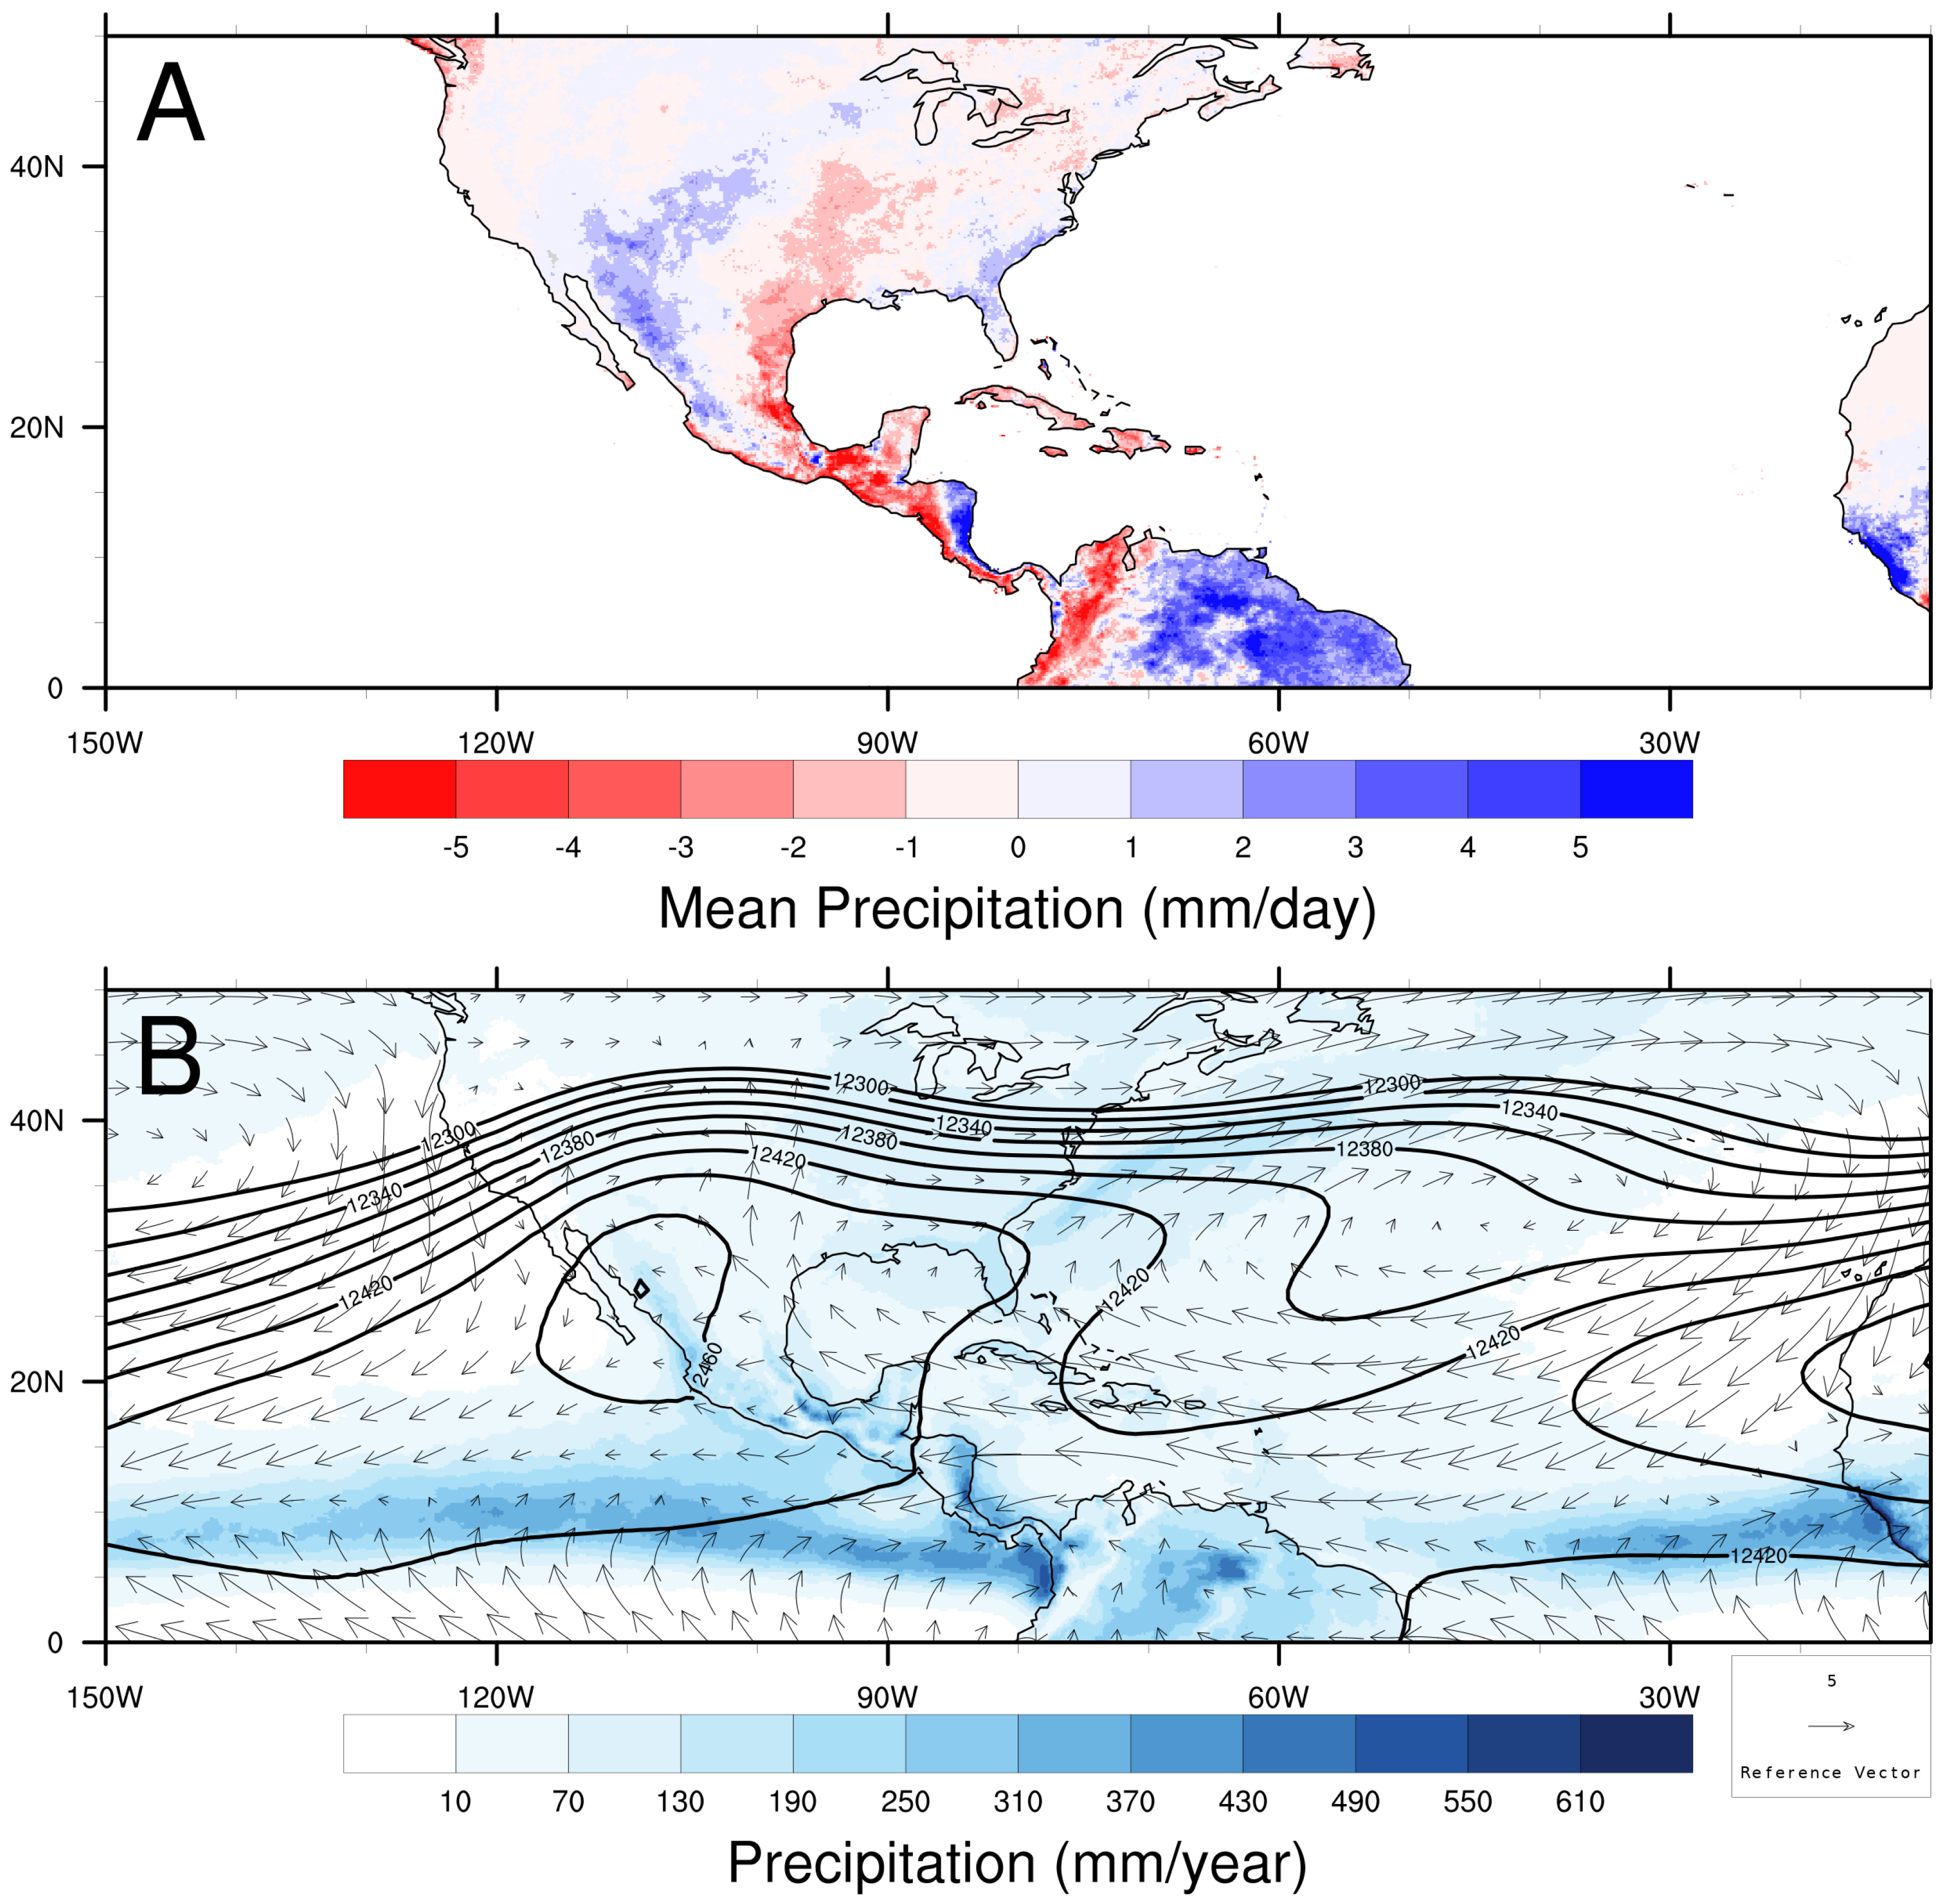
3.4. Caribbean Low Level Jet Interactions

As mentioned in Section 1, the climatology of the CLLJ presents two maxima and two minima throughout the year [27]. From Figure 3 we can observe that WT 5 and WT 20 are most frequent during July and January. Figure 6 shows these two WTs to have maxima in the Caribbean region for these months. Table 1 shows the values of zonal wind at 925 hPa for a region in the Caribbean sea (see inset in Figure 6) where the average zonal wind speed is computed in the same manner as in Wang [27]. Table 1 shows that WT 5 and WT 20 underestimate the climatological wind speed values for July and January, respectively, as given by Wang [27]. Figure 3 also shows WT 9 and WT 6 to be most frequent during May and October, respectively. As in the two previous WTs, Table 1 shows that WT 9 slightly overestimates the climatological wind sped values, while WT 6 correctly identifies October as the minimum in the CLLJ but underestimates wind speed magnitude.
Close inspection of Figure 6 shows WT 20 to have an intense zonal wind with a low precipitation rate over the rectangular region over the Caribbean sea. Table 1 shows that WT 20 has the lowest precipitation rate (0.7 mm day−1) corresponding to this same region in Figure 1 compared to WT 5 , WT 9 and WT 6 . This result for precipitation compares favorably with the results from climatology, as seen in Table 1. On the other hand, WT 6 represents the maximum precipitation rate in the Caribbean rectangular region (4.28 mm day−1), which is similar to the climatological value (4.5 mm day−1). While WT 5 and WT 9 underestimate the climatological value (2.4 mm day−1) for July and May, respectively (1.9 mm day−1 and 1.7 mm day−1, respectively), they display the same behavior as far as being very close to each other just as seen in the climatological values (see Figure 2c in [27]).
In the case of WT 5 the CLLJ shows an intense flow to the Central Plains in the US that corresponds to weak positive precipitation anomalies and weak negative precipitation anomalies to the southeastern US (see Figure 6). On the contrary, WT 20 features negative precipitation anomalies all over the MAR landmass, except for the western coast of the US and a weaker meridional flow than that shown in WT 5 . This comparison between the results reported by Wang [27] and results obtained in this study suggests that the SOM algorithm can generate a synoptic classification that has a clear physical interpretation over the MAR as a whole but more importantly over the tropics.

3.5. The North American Monsoon System and the Mid-Summer Drought

As mentioned in Section 1, during its mature phase, the NAMS can reach as far south as Campeche Bay, Central America and portions of northern South America [24]. This feature is well represented by weather type WT 5 . From the transition matrix in Figure 4 a sequence of significant transitions arises: WT 3 WT 4 and WT 4 WT 5 . These transitions can be linked to the seasonal march during the wet period in Figure 3, where these three WTs’ maxima in frequency per month occur in a sequential manner. In other words, WT 3 and WT 4 reach their peaks of occurrence in June–July, while in the case of WT 5 this occurs in July–August. The above results suggest that these particular transitions can be related to the onset and mature stages of the NAMS.
In order to see that the catalog of WTs contains useful information on the MSD we chose WT 5 and WT 1 as those WTs that have high representation in the months where the MSD is active (see Figure 3). Figure 7A represents the difference in averaged accumulated precipitation for WT 5 and WT 1 . Calculation of accumulated precipitation averages is made by selecting days in specific months where each WT is more frequent. For instance, WT 5 is the most frequent WT during August (359 days) while WT 1 is the most frequent WT during September (422 days, see Figure 3). Precipitation fields for each WT are added and then averaged by the number of days each WT is present. Further analysis of Figure 7A highlights the ability of the SOM algorithm to adequately separate different atmospheric states. This is evident in Figure 7A from the negative precipitation differences that occur over southern Mexico and western Central America, which match the areas affected by the MSD [25]. Another known precipitation characteristic that is apparent in the WT 5 - WT 1 difference is the presence of the Central America Dry Corridor, in the form of a dry (wet) pattern to the west (east) of Central America Hidalgo León et al. [55]. Figure 7B shows the annual average precipitation, the wind field at 925 hPa and the geopotential height at 200 hPa for WT 5 from July through September, when it is most frequent (see Figure 3). The resulting circulation pattern from WT 5 is one that corresponds to the NAMS [22] with low-level anticyclonic circulation patterns from the NASH and the NPH; it consists of a 200 hPa anticyclonic pattern over northwestern Mexico and southwestern US, just above the precipitation tongue that extends from Sonora in Mexico to Arizona in the US (see Figure 7B). This result suggests that WT 5 is a key WT in the evolution of the NAMS and the MSD through transitions between neighboring WTs as the wet season progresses into the dry season. Further inspection for the rest of the WTs in this catalog confirms their significance in the physical processes that take place in the MAR (not shown).

4. Conclusions

In this study, we analyzed and verified a catalog of twenty WTs. We showed this catalog to be useful in detecting key features of regional climate for MAR and adequate to describe the influence of semi-permanent centers from planetary circulation over the study region, such as the NASH and NPH. Standardized anomalies of MSLP are the input to the SOM algorithm whose output results in a classification of WTs. Analysis of the SOM classification indicated that WT 5 is the most frequent during the wet period (see Figure 3) and represents the NASH influence over the Caribbean Sea and Gulf of Mexico, with the presence of low-pressure systems over northwestern Mexico. Furthermore, WT 16 is the most frequent pattern during the dry period (see Figure 3), representing the influence of a trough moving southwards and displacing the NASH to the east Atlantic. This WT also shows the NPH pressure center located in front of California, with positive MSLP anomalies over the continent (see Figure 1 and Figure 2). WT 5 and WT 16 also display the largest persistence in consecutive days during the wet period and dry period, respectively. The analysis of the transitions between WTs demonstrated that the most significant transitions are confined to the dry and wet periods and also among close neighbors in the SOM space, where the largest significant transitions tend to occur.
The pair of WTs associated with the CLLJ maxima (minima), i.e., WT 20 and WT 5 ( WT 9 and WT 6 ), showed a similar behavior when compared to reported values of monthly zonal wind field and precipitation climatology as reported by Wang [27] over a region defined by the core of the CLLJ. The maximum in precipitation and minimum in easterly wind for the October climatology is well captured by WT 6 .
The wet period catalog of WTs produced in this study by the SOM algorithm can represent a portion of the observed NAMS precipitation variability. It is shown that WT 5 has a high frequency of occurrence during July and August among all WTs during this period. The attendant precipitation anomaly shows the typical monsoonal pattern with positive values of about 4 to 5 mm per day−1 in the west coast of Mexico and the southwestern US. In terms of precipitation alone, during the mature phase of the NAMS (July–August) the positive precipitation anomaly covers a large region facing the Pacific Ocean from Central America to the southwestern US. This precipitation pattern is well captured by WT 5 . From the analysis of the significant transitions and WTs monthly frequency of occurrence, transitions WT 3 WT 4 and WT 4 WT 5 can be related to the onset and mature stages of the NAMS, respectively.
The MSD is present as a double-peak structure in precipitation at low latitudes of the MAR with two maxima in June and September and a minimum during July and August. The difference of averaged accumulated precipitation for WTs with the highest number of days in August and September highlights the ability of the SOM algorithm to isolate different atmospheric conditions by showing negative precipitation differences over southern Mexico and western Central America when subtracting the September precipitation from the August precipitation, which corresponds to the MSD signal.
We constructed a catalog using the SOM algorithm that can identify near-surface atmospheric circulation patterns from a unified perspective of synoptic climate variability for the MAR. This catalog permits to asses the localization of semi-permanent high-pressure systems that affect most of the local weather over MAR and its interaction with its major climatic features: NAMS, MSD and CLLJ. Furthermore, it represents an advance over previous studies focused over MAR because WTs permit the comprehensive analysis of a series of complex physical processes taking place at the same time.The resulting WTs compare favorably with results from previous studies devoted to examine precipitation variability over the MAR.
The resulting catalog represents the observed variability of NPH and NASH and their dynamical influence on the subtropical and tropical overlying circulation. Clearly, the use of MSLP as the only predictor variable has some limitations, and using a multi-predictor scheme can add valuable information to the tropical analysis over MAR. For instance, we found a well-known signal in precipitation related to the Central America Dry Corridor (see Figure 2). Adding extra variables, such as SST and wind field data, to the multi-predictor inputs of the SOM can reveal a more complex mechanism that may suggest a reasonable physical explanation of the Central America Dry Corridor. This signal has been linked in the past to SST anomalies over a region in the Eastern Pacific [55].
Future work involving a larger number of variables as input to the SOM algorithm is part of an ongoing research effort focused on the study of limited regions inside MAR. However, this is out of the scope of the present study.

Author Contributions

Y.A.C.-P., C.A.O.-M. and A.I.Q. conceptualized the idea and wrote the first draft of the paper. Y.A.C.-P., C.A.O.-M. and Y.D.-E. worked in code development. All authors contributed to the interpretation of the results and to the writing of the paper. All authors have read and agreed to the published version of the manuscript.

Funding

Cala-Pérez was funded by scholarships from Mexican National Council for Science and Technology (CONACyT) numbers 613957 and 722415. This paper was partially funded with PAPIIT project number IA-104618.

Acknowledgments

We thank the reviewers, Rowan Fealy and an anonymous reviewer, for valuable comments that significantly improved the manuscript. All figures were generated with The NCAR Command Language (Version 6.6.2) [Software]. (2019). Boulder, Colorado: UCAR/NCAR/CISL/TDD. http://dx.doi.org/10.5065/D6WD3XH5.

Conflicts of Interest

The authors declare no conflict of interest.

Abbreviations

The following abbreviations are used in this manuscript:
WTWeather Type
NASHNorth Atlantic Subtropical High
NPHNorth Pacific High
USUnited States of America
SOMSelf-Organizing Maps
SSTSea-Surface Temperature
MARMiddle Americas Region
MSLPMean-Sea-Level Pressure
ERAIERA Interim
ECMWFEuropean Centre for Medium-Range Weather Forecasts
T2mTemperature at 2 m
CHIRPClimate Hazards InfraRed Precipitation
NAMSNorth American Monsoon System
MSDMid-Summer Drought
ITCZIntertropical Convergence Zone
CLLJCaribbean Low Level Jet
NCLNCAR Command Language
UNAMUniversidad Nacional Autónoma de México
CONACyTMexican National Council for Science and Technology
PAPIITPrograma de Apoyo a Proyectos de Investigación e Innovación Tecnológica

References

  1. AMS Glossary Synoptic Climatology. Available online: http://glossary.ametsoc.org/wiki (accessed on 20 May 2020).
  2. Cassano, J.J.; Uotila, P.; Lynch, A. Changes in synoptic weather patterns in the polar regions in the twentieth and twenty-first centuries, part 1: Arctic. Int. J. Climatol. 2006, 26, 1027–1049. [Google Scholar] [CrossRef]
  3. Lamb, H. British Isles weather types and a register of daily sequence of circulation patterns 1861–1971. Geophys. Mem. 1972, 116, 85. [Google Scholar]
  4. Kirchhofer, W. Classification of European 500 mb Patterns; Swiss Meteorological Institute: Zurich, Switzerland, 1974. [Google Scholar]
  5. Kalkstein, L.S.; Corrigan, P. A synoptic climatological approach for geographical analysis: Assessment of sulfur dioxide concentrations. Ann. Assoc. Am. Geogr. 1986, 76, 381–395. [Google Scholar] [CrossRef]
  6. Huth, R. A circulation classification scheme applicable in GCM studies. Theor. Appl. Climatol. 2000, 67, 1–18. [Google Scholar] [CrossRef]
  7. Muñoz, Á.G.; Yang, X.; Vecchi, G.A.; Robertson, A.W.; Cooke, W.F. A weather-type-based cross-time-scale diagnostic framework for coupled circulation models. J. Clim. 2017, 30, 8951–8972. [Google Scholar] [CrossRef]
  8. Vautard, R. Multiple weather regimes over the North Atlantic: Analysis of precursors and successors. Mon. Weather Rev. 1990, 118, 2056–2081. [Google Scholar] [CrossRef]
  9. Robertson, A.W.; Ghil, M. Large-scale weather regimes and local climate over the western United States. J. Clim. 1999, 12, 1796–1813. [Google Scholar] [CrossRef]
  10. Huth, R.; Beck, C.; Philipp, A.; Demuzere, M.; Ustrnul, Z.; Cahynová, M.; Kyselỳ, J.; Tveito, O.E. Classifications of atmospheric circulation patterns: Recent advances and applications. Ann. N. Y. Acad. Sci. 2008, 1146, 105–152. [Google Scholar] [CrossRef] [PubMed]
  11. Kohonen, T. Self-Organizing Maps; Springer Series in Information Sciences; Springer: Berlin/Heidelberg, Germany, 2001; Volume 30. [Google Scholar]
  12. Bárdossy, A.; Stehlík, J.; Caspary, H.J. Automated objective classification of daily circulation patterns for precipitation and temperature downscaling based on optimized fuzzy rules. Clim. Res. 2002, 23, 11–22. [Google Scholar] [CrossRef]
  13. Sinclair, K.; Bertler, N.; Trompetter, W. Synoptic controls on precipitation pathways and snow delivery to high-accumulation ice core sites in the Ross Sea region, Antarctica. J. Geophys. Res. Atmos. 2010, 115, D22112. [Google Scholar] [CrossRef]
  14. Markle, B.; Bertler, N.; Sinclair, K.; Sneed, S. Synoptic variability in the Ross Sea region, Antarctica, as seen from back-trajectory modeling and ice core analysis. J. Geophys. Res. Atmos. 2012, 117, D2. [Google Scholar] [CrossRef]
  15. Coggins, J.H.; McDonald, A.J.; Jolly, B. Synoptic climatology of the Ross Ice Shelf and Ross Sea region of Antarctica: K-means clustering and validation. Int. J. Climatol. 2014, 34, 2330–2348. [Google Scholar] [CrossRef]
  16. Neal, R.; Fereday, D.; Crocker, R.; Comer, R.E. A flexible approach to defining weather patterns and their application in weather forecasting over Europe. Meteorol. Appl. 2016, 23, 389–400. [Google Scholar] [CrossRef] [Green Version]
  17. Cavazos, T. Large-scale circulation anomalies conducive to extreme precipitation events and derivation of daily rainfall in northeastern Mexico and southeastern Texas. J. Clim. 1999, 12, 1506–1523. [Google Scholar] [CrossRef]
  18. Hewitson, B.; Crane, R. Self-organizing maps: Applications to synoptic climatology. Clim. Res. 2002, 22, 13–26. [Google Scholar] [CrossRef]
  19. Crimmins, M.A. Synoptic climatology of extreme fire-weather conditions across the southwest United States. Int. J. Climatol. 2006, 26, 1001–1016. [Google Scholar] [CrossRef]
  20. Jáuregui, E. Variaciones de largo periodo de los tipos de tiempo de superficie en México. Boletín Inst. Geogr. UNAM 1971, 4, 9–22. [Google Scholar] [CrossRef]
  21. Mosiño, P. Una clasificación de las configuraciones del flujo aéreo en la República Mexicana. Rev. Ing. Hidraul. 1958, 12, 29–54. [Google Scholar]
  22. Adams, D.K.; Comrie, A.C. The north American monsoon. Bull. Am. Meteorol. Soc. 1997, 78, 2197–2214. [Google Scholar] [CrossRef] [Green Version]
  23. Ray, A.J.; Garfin, G.M.; Wilder, M.; Vásquez-León, M.; Lenart, M.; Comrie, A.C. Applications of monsoon research: Opportunities to inform decision making and reduce regional vulnerability. J. Clim. 2007, 20, 1608–1627. [Google Scholar] [CrossRef] [Green Version]
  24. Vera, C.; Higgins, W.; Amador, J.; Ambrizzi, T.; Garreaud, R.; Gochis, D.; Gutzler, D.; Lettenmaier, D.; Marengo, J.; Mechoso, C.; et al. Toward a unified view of the American monsoon systems. J. Clim. 2006, 19, 4977–5000. [Google Scholar] [CrossRef]
  25. Magaña, V.; Amador, J.A.; Medina, S. The midsummer drought over Mexico and Central America. J. Clim. 1999, 12, 1577–1588. [Google Scholar] [CrossRef]
  26. Díaz-Esteban, Y.; Raga, G.B. Weather regimes associated with summer rainfall variability over southern Mexico. Int. J. Climatol. 2018, 38, 169–186. [Google Scholar] [CrossRef]
  27. Wang, C. Variability of the Caribbean low-level jet and its relations to climate. Clim. Dyn. 2007, 29, 411–422. [Google Scholar] [CrossRef] [Green Version]
  28. Cook, K.H.; Vizy, E.K. Hydrodynamics of the Caribbean low-level jet and its relationship to precipitation. J. Clim. 2010, 23, 1477–1494. [Google Scholar] [CrossRef]
  29. Muñoz, E.; Busalacchi, A.J.; Nigam, S.; Ruiz-Barradas, A. Winter and summer structure of the Caribbean low-level jet. J. Clim. 2008, 21, 1260–1276. [Google Scholar] [CrossRef]
  30. Mo, K.C.; Chelliah, M.; Carrera, M.L.; Higgins, R.W.; Ebisuzaki, W. Atmospheric moisture transport over the United States and Mexico as evaluated in the NCEP regional reanalysis. J. Hydrometeorol. 2005, 6, 710–728. [Google Scholar] [CrossRef]
  31. Sáenz, F.; Durán-Quesada, A.M. A climatology of low level wind regimes over Central America using a weather type classification approach. Front. Earth Sci. 2015, 3, 15. [Google Scholar] [CrossRef] [Green Version]
  32. Moron, V.; Gouirand, I.; Taylor, M. Weather types across the Caribbean basin and their relationship with rainfall and sea surface temperature. Clim. Dyn. 2016, 47, 601–621. [Google Scholar] [CrossRef]
  33. Peixoto, J.P.; Oort, A.H. Physics of Climate; American Institute of Physics: New York, NY, USA, 1992. [Google Scholar]
  34. Dee, D.P.; Uppala, S.; Simmons, A.; Berrisford, P.; Poli, P.; Kobayashi, S.; Andrae, U.; Balmaseda, M.; Balsamo, G.; Bauer, d.P.; et al. The ERA-Interim reanalysis: Configuration and performance of the data assimilation system. Q. J. R. Meteorol. Soc. 2011, 137, 553–597. [Google Scholar] [CrossRef]
  35. Simmons, A. ERA-Interim: New ECMWF reanalysis products from 1989 onwards. ECMWF Newsl. 2006, 110, 25–36. [Google Scholar]
  36. Simmons, A.; Uppala, S.; Dee, D. Update on ERAInterim; ECMWF Newsletter, No. 111; ECMWF: Reading, UK, 2007; Volume 5. [Google Scholar]
  37. Uppala, S.; Dee, D.; Kobayashi, S.; Berrisford, P.; Simmons, A. Towards a climate data assimilation system: Status update of ERA-Interim. ECMWF Newsl. 2008, 115, 12–18. [Google Scholar]
  38. Serra, Y.L.; Kiladis, G.N.; Hodges, K.I. Tracking and mean structure of easterly waves over the Intra-Americas Sea. J. Clim. 2010, 23, 4823–4840. [Google Scholar] [CrossRef]
  39. Lackmann, G. Midlatitude Synoptic Meteorology: Dynamics, Analysis, and Forecasting; American Meteorological Society: Boston, MA, USA, 2011. [Google Scholar]
  40. Jones, P.; Hulme, M.; Briffa, K. A comparison of Lamb circulation types with an objective classification scheme. Int. J. Climatol. 1993, 13, 655–663. [Google Scholar] [CrossRef]
  41. Verdon-Kidd, D.C.; Kiem, A.S. On the relationship between large-scale climate modes and regional synoptic patterns that drive Victorian rainfall. Hydrol. Earth Syst. Sci. 2009, 13, 467–479. [Google Scholar] [CrossRef] [Green Version]
  42. Chung, C.; Nigam, S. Weighting of geophysical data in principal component analysis. J. Geophys. Res. Atmos. 1999, 104, 16925–16928. [Google Scholar] [CrossRef]
  43. Funk, C.; Peterson, P.; Landsfeld, M.; Pedreros, D.; Verdin, J.; Shukla, S.; Husak, G.; Rowland, J.; Harrison, L.; Hoell, A.; et al. The climate hazards infrared precipitation with stations—a new environmental record for monitoring extremes. Sci. Data 2015, 2, 1–21. [Google Scholar] [CrossRef] [Green Version]
  44. Reusch, D.B.; Hewitson, B.C.; Alley, R.B. Towards ice-core-based synoptic reconstructions of west antarctic climate with artificial neural networks. Int. J. Climatol. A J. R. Meteorol. Soc. 2005, 25, 581–610. [Google Scholar] [CrossRef]
  45. Vesanto, J.; Himberg, J.; Alhoniemi, E.; Parhankangas, J. SOM Toolbox for Matlab 5; Helsinki University of Technology: Helsinki, Finland, 2000. [Google Scholar]
  46. Cavazos, T.; Comrie, A.C.; Liverman, D.M. Intraseasonal Variability Associated with Wet Monsoons in Southeast Arizona. J. Clim. 2002, 15, 2477–2490. [Google Scholar] [CrossRef]
  47. Vautard, R.; Mo, K.C.; Ghil, M. Statistical significance test for transition matrices of atmospheric Markov chains. J. Atmos. Sci. 1990, 47, 1926–1931. [Google Scholar] [CrossRef]
  48. Kimoto, M.; Ghil, M. Multiple flow regimes in the Northern Hemisphere winter. Part II: Sectorial regimes and preferred transitions. J. Atmos. Sci. 1993, 50, 2645–2673. [Google Scholar] [CrossRef] [Green Version]
  49. Kondrashov, D.; Ide, K.; Ghil, M. Weather regimes and preferred transition paths in a three-level quasigeostrophic model. J. Atmos. Sci. 2004, 61, 568–587. [Google Scholar] [CrossRef] [Green Version]
  50. Bograd, S.; Schwing, F.; Mendelssohn, R.; Green-Jessen, P. On the changing seasonality over the North Pacific. Geophys. Res. Lett. 2002, 29, 47-1–47-4. [Google Scholar] [CrossRef]
  51. Romero-Centeno, R.; Zavala-Hidalgo, J.; Raga, G. Midsummer gap winds and low-level circulation over the eastern tropical Pacific. J. Clim. 2007, 20, 3768–3784. [Google Scholar] [CrossRef] [Green Version]
  52. Weaver, S.J.; Nigam, S. Variability of the Great Plains Low-Level Jet: Large-Scale Circulation Context and Hydroclimate Impacts. J. Clim. 2008, 21, 1532–1551. [Google Scholar] [CrossRef] [Green Version]
  53. Li, L.; Li, W.; Kushnir, Y. Variation of the North Atlantic subtropical high western ridge and its implication to Southeastern US summer precipitation. Clim. Dyn. 2012, 39, 1401–1412. [Google Scholar] [CrossRef] [Green Version]
  54. Roller, C.D.; Qian, J.H.; Agel, L.; Barlow, M.; Moron, V. Winter weather regimes in the northeast United States. J. Clim. 2016, 29, 2963–2980. [Google Scholar] [CrossRef]
  55. Hidalgo León, H.G.; Alfaro Martínez, E.J.; Amador Astúa, J.A.; Bastidas Pacheco, Á. Precursors of quasi-decadal dry-spells in the Central America Dry Corridor. Clim. Dyn. 2019, 53, 1307–1322. [Google Scholar] [CrossRef]
Figure 1. Composite averages of mean sea-level pressure (contours from 988 to 1028, by 2 hPa) and 2 m air temperature anomaly (colors) fields per self-organizing map (SOM) node. The number of days each Weather Type (WT) is present in climatology is indicated in parentheses and mean persistence is indicated outside the parentheses to the right.
Atmosphere 11 00745 g001
Figure 2. Composite averages of mean sea-level pressure anomaly (contours from −16 to 13, by 1 hPa) and Climate Hazards InfraRed Precipitation (CHIRP) anomaly (colors) fields per SOM node. Continuous (dashed) contour lines represent positive (negative) anomalies; bold contour line is zero.
Atmosphere 11 00745 g002
Figure 3. Monthly frequency of occurrence (in days) for each weather type. Horizontal thick lines divide the annual march (see Section 2.2) into 3 periods: a dry-cold period (November–February); a dry-warm period (March–April); and a wet period (May–October).
Atmosphere 11 00745 g003
Figure 4. Frequency of transitions between weather types calculated as a percentage of the sum of all cases for each pattern.
Atmosphere 11 00745 g004
Figure 5. As Figure 4, except for significance of transitions between weather types, calculated at the 90 and 95% levels of significance.
Atmosphere 11 00745 g005
Figure 6. Composite averages of wind at 925 mb (arrows in m s−1) and CHIRP anomaly (colors) fields per SOM node. Box-limited area (lower left corner at 12.5° N and 80° W; upper right corner 18° N and 70° W) corresponds to the Caribbean Low-Level Jet (CLLJ) core as defined by Wang [27].
Atmosphere 11 00745 g006
Figure 7. (A) Averaged accumulated precipitation for the difference WT 5 WT 1 highlighting the dry spell in August over southeast Mexico and Central America. Note that precipitation fields in (A) for WT 5 are constructed using days in August and correspondingly, WT 1 uses days in September as presented in Figure 3. (B) Accumulated annual precipitation from CHIRP (color shades), wind vectors at 925 hPa and geopotential height at 200 hPa (contours 12,304 to 12,474 by 20 m). Data plotted in (B) is obtained for days where WT 5 is present in the months of July–August–September.
Atmosphere 11 00745 g007
Table 1. Zonal wind (U) and precipitation (Pcp) area average for the maxima and minima reported by Wang [27] and calculated with a SOM catalog.
WTU-SOMU-WangPcp-SOMPcp-WangMonth
#m s−1m s−1mm day−1mm day−1
WT20−9.0−10.50.90.7January
WT5−11.6−12.01.942.4July
WT9−9.7−9.01.72.4May
WT6−5.0−6.54.284.5October

