Regional Transport Increases Ammonia Concentration in Beijing, China

1
Institute of Agricultural Resources and Regional Planning, Chinese Academy of Agricultural Sciences, Beijing 100081, China
2
Chinese Academy of Meteorological Sciences, Beijing 100081, China
*
Authors to whom correspondence should be addressed.
Atmosphere 2020, 11(6), 563; https://doi.org/10.3390/atmos11060563
Submission received: 2 May 2020
/
Revised: 24 May 2020
/
Accepted: 26 May 2020
/
Published: 28 May 2020
(This article belongs to the Special Issue Emissions, Transport and Fate of Pollutants in the Atmosphere)
Abstract
:To elucidate the critical factors influencing the ammonia (NH3) concentration in Beijing, this study combined observational analyses, backward trajectory calculations, and meteorology–chemistry coupled simulations to investigate the variations in the NH3 concentration from 11 May to 24 June, 2015. A significant positive correlation was found between the NH3 and PM2.5 concentrations in Beijing. By examining the relationships between meteorological parameters and the NH3 concentration, both near-surface temperature and relative humidity showed positive correlations with the NH3 concentration. The higher NH3 concentrations were usually associated with the warming of the upper atmosphere. Distinct wind directions were noted during the days of the top and bottom 33.3% NH3 concentrations. The top 33.3% concentrations were primarily related to southwesterly winds, while the bottom ones were associated with westerly and northerly winds. Since there are strong NH3 emissions in the southern plains adjacent to Beijing, the regional transport induced by the southerly prevailing winds would increase the NH3 concentration in Beijing significantly. From 23 to 25 May, more than one third of NH3 in Beijing was contributed by the southerly transport processes. Thus, joint efforts to reduce NH3 emissions in the whole Beijing–Tianjin–Hebei region are necessary to regulate the NH3 concentration in Beijing.
1. Introduction
Being the most abundant basic/alkaline gas species in the atmosphere, ammonia (NH3) plays an important role in determining the overall acidity of precipitation, cloud water, and airborne particulate matter [1,2]. The largest source of NH3 emission is agriculture, including animal husbandry and NH3-based fertilizer applications [2]. Sutton et al. estimated that 57% of global atmospheric NH3 was emitted from crop and livestock production in 2008 [1]. Once emitted into the atmosphere, NH3 undergoes complex atmospheric processes such as transformation due to reactions, transport associated with winds, and wet and dry deposition [3].
During the past decades, the rapid development of economy and urbanization in China have led to poor air quality and high PM2.5 (particle matter with an aerodynamic diameter less than 2.5 μm) loading in most cities, particularly in the densely populated Beijing–Tianjin–Hebei region [4,5]. Among the aerosol precursors, several studies have pointed out the importance of NH3 [6,7,8,9], which acts as a limiting species in the formation of secondary inorganic aerosols (SIA). In the atmosphere, NH3 can neutralize ambient acidic species, such as sulfuric acid (H2SO4) and nitric acid (HNO3), to form ammonium salts, which are the dominant inorganic compounds in the ambient PM2.5 [2,10]. These reaction pathways link NH3 to aerosol pollution and its subsequent impacts on human health and climate change [11,12]. It was found that the mass of secondary sulfate, nitrate, and ammonium accounted for 25–60% of the total PM2.5 concentration [13,14]. The total NH3 emission in China in 2015 was estimated to be 15.6 ± 0.9 Tg N yr−1 [6]. Such a high emission rate makes NH3 become one of the critical species related to the air pollution issues in China. Long-term measurements of NH3 in Shanghai of China demonstrated the important role of the gas-to-particle conversion of NH3 on PM2.5 formation [15], and the ammonium accounted for about 10% of the PM2.5 concentration measured in Shanghai [15]. The gas-to-particle conversion of NH3 was also observed to lead to a significant increase of ammonium during haze events in Beijing [16,17]. The chemical composition analysis of PM2.5 in Beijing indicated that the ammonium accounted for 11% of the total defined PM2.5 components during the heavily polluted days [16,17]. In addition, the atmospheric deposition of NH3 into terrestrial and aquatic ecosystems can cause adverse environmental effects, such as soil acidification, eutrophication of water bodies, and even plant biodiversity reduction [2,18,19,20,21]. Although the environmental impacts of NH3 in China have been recognized [10,13], until now, the NH3 emissions have not been regulated by the Chinese government; by contrast, stringent measures have been taking to control the emissions of sulfur dioxide (SO2) and nitrogen oxide (NOX) [22]. Since the balance between SO2, NOX, and NH3 emissions will define cation- or anion-limited regimes of inorganic aerosol formation [23,24], it is suggested to consider the regulation of NH3 emissions as a possible measure to mitigate the heavy aerosol pollution in some regions of China [24].
The atmospheric NH3 concentration in Beijing is not only contributed by local emission sources (e.g., traffic exhaust, husbandry), but can also be influenced by adjacent agricultural emissions from surrounding croplands (Figure 1) under certain synoptic conditions [25,26]. Based on one-year observations of the vertical distribution of NH3 at the 325-m meteorological tower in Beijing, Zhang et al. found that air masses from the agricultural regions contributed most to the high NH3 concentration measured [27]. At a rural site in the Beijing–Tianjin–Hebei region, Meng et al. also observed that the increased NH3 concentration was associated with specific wind directions, and suggested that the transport of NH3 emitted from agricultural regions was critical to the air quality in the downstream regions [25]. Although the regional transport of NH3 in the Beijing–Tianjin–Hebei region has been documented, the potential source region to Beijing and to what extent the regional transport influences the NH3 concentration in Beijing are not yet clearly understood.
To identify the potential source regions, and quantitatively evaluate the impacts of regional transport on the NH3 concentration in Beijing, this study combines observational analyses, backward trajectory calculations, and meteorology–chemistry coupled simulations to systematically investigate the transport processes of NH3 in the Beijing–Tianjin–Hebei region. The rest of this paper is organized as follows. In Section 2, the methods and data are described. In Section 3, the impacts of regional transport on NH3 concentration in Beijing are analyzed. Finally, the main findings are summarized in Section 4.
2. Methods and Data
To understand the variations in NH3 concentration in Beijing, hourly NH3 concentration from 11 May to 24 June in 2015 was measured in the Beijing Municipal Environmental Monitoring Center (116.32° E, 39.93° N; marked by the blue cross in Figure 1b) using a differential optical absorption spectroscope (DOAS, Anhui Landun Photoelectron Co. Ltd., Tongling, Anhui, China). The DOAS, an open-path monitoring technique, is based on the wavelength dependent absorption of light over a specified light path [28]. It is often utilized in the UV and visible parts of the electromagnetic spectrum. The absorption lines and bands of gas molecules in this part of the spectrum are caused by electronic transitions and their shapes only weakly depend on temperature and pressure [28]. Regarding NH3, it has a strong absorption band with narrowband features in the UV part from 170 to 220 nm [29], and the DOAS system can monitor its concentration with a high accuracy of 0.04 μg m−3 for a total light path of 100 m [30]. In this study, both the transmitter and retro-reflector were placed 20 m high above the ground [30]. The detailed information of the NH3 measurement in the Beijing Municipal Environmental Monitoring Center can be found in the previous study of Cheng et al. [30]. The PM2.5 concentration in Beijing (116.31° E, 39.97° N; marked by the red dot in Figure 1b) was also collected from the China National Environmental Monitoring Center. Besides, both the ground-level and upper-air meteorological observations in the southern Beijing (116.47° E, 39.80° N, marked by the black plus in Figure 1b) were obtained. The ground-level meteorological parameters were recorded hourly, while the sounding balloons were launched twice a day at 08:00 and 20:00 local time (LT = UTC + 8h). In total, 45-day measurements in Beijing were collected, including the near-surface NH3 and PM2.5 concentrations, 2-m temperature (T), 2-m relative humidity (RH), precipitation and the vertical profiles of the potential temperature (PT) and horizontal winds.
Through analyzing these observational data, the relationships between the meteorological conditions and NH3 concentration in Beijing were elucidated, and then a typical pollution episode (23–25 May) associated with southerly prevailing winds was selected and simulated using the Weather Research and Forecasting model coupled with chemistry (WRF-Chem) [31]. The simulation domain was centered in the Beijing–Tianjin–Hebei region with a horizontal resolution of 11 km, covering an area of 106–126° E in longitude and 31–45° N in latitude (Figure 1a). In the vertical dimension, 33 vertical layers were set from the surface to the 10-hPa level, of which 15 layers were set below 2 km above ground-level (AGL). The physics parameterization schemes used in the WRF-Chem simulation included the Noah land surface scheme [32], Yonsei University (YSU) boundary layer scheme [33], rapid radiative transfer model for general circulation (RRTMG) long-/short-wave radiation scheme [34], Betts–Miller–Janjic cumulus scheme [35], and WRF single-moment-5-class microphysics scheme [36]. Regarding the chemical processes, the RADM2-MADE/SORGAM mechanism [37,38,39] was used with the Multi-resolution Emission Inventory for China (MEIC), and the dry and wet deposition schemes were turned on. The MEIC is the most updated and widely used emission data available for the studied region, which is developed and provided by Tsinghua University [40]. The WRF-Chem simulation was initialized at 20:00 LT on 21 May, and ran for 100 h until 00:00 LT on 26 May. The first 28 h were considered as a spin-up period. The initial and boundary conditions of the meteorological variables were configured using the 5th generation of atmospheric reanalysis produced by European Centre for Medium-Range Weather Forecasts (ERA5), and the initial and boundary conditions of the chemical variables were derived from the output of a global chemical transport model [41]. In the rest, the simulation using these configurations is referred to as the baseline (BASE) run.
To identify the potential source regions, for each day of the selected episode, 24-h air mass backward trajectories were calculated using the hybrid single particle Lagrangian integrated trajectory model (HYSPLIT, developed by the Air Resource Laboratory of the United States National Oceanic and Atmospheric Administration, College Park, Maryland, US). The model has been widely applied to identify the air mass origins and pathways that reach the receptor sites [42]. The ending point was set using the location of the NH3 monitoring site (116.32° E, 39.93° N) with a height of 100 m AGL, and the ending time was 18:00 LT of each day. According to those backward trajectories, a sensitivity numerical experiment was designed using the emission zero-out method [26,43], in which all the anthropogenic emissions in the possible source region were set to zero. Except for the emission configuration, the other settings of the sensitivity experiment used were the same settings of the BASE run. The sensitivity experiment is referred to as the EXP run hereafter. Thereby, the contributions of regional transport to the NH3 concentration in Beijing can be roughly estimated as the simulation differences between the BASE and EXP runs. In the rest of this paper, the simulation results presented and discussed are derived from the BASE run unless otherwise noted.
Besides, to examine the effects of emission control measures on the aerosol pollution in Beijing, two more sensitivity simulations (i.e., SIM-1 and SIM-2) were conducted using the same settings of the BASE run except for the emissions. In SIM-1, the emissions of SO2 and NOX in the whole simulation domain were reduced by 50%. In SIM-2, the changes in SO2 and NOX emissions were the same as those in SIM-1, and the emissions of NH3 were also reduced by 50%.
3. Results and Discussion
3.1. Relationships between NH3 Concentration and Meteorological Parameters
The time series of the daily NH3 concentration from 11 May to 24 June in Beijing is shown in Figure 2a. The peak daily NH3 concentration was 34.6 μg m−3 on 17 May, and the minimum concentration was 2.0 μg m−3 on 19 May. During the studied period, there were in total 12 rainy days in Beijing (Figure 2c). To isolate the complex impacts of precipitation on air pollution [44], only the measurements of the rest 33 days under dry conditions were further analyzed in this study. After excluding the rainy days, the relationships between the NH3 concentrations and near-surface meteorological parameters in Beijing were examined (Figure 2b,c). It was found that the daily NH3 concentration was positively correlated with the near-surface T and RH, with correlation coefficients of 0.49 and 0.65, respectively. The link between the vertical thermal stratification and ground-level NH3 concentration in Beijing was also investigated based on the sounding data at 20:00 LT. The higher NH3 concentrations in Beijing were usually associated with the warming of the upper atmosphere (Figure 2d), such as the episodes that occurred around 25 May and 1 June. As a result, a significant positive correlation was found between the 1500-m PT and NH3 concentration in Beijing (R = 0.72). Such a relationship can be explained by the development of the boundary layer and its impact on the pollutants’ vertical dispersion. The warming aloft can increase the thermal stability, which would suppress the development of the boundary layer to some extent, as well as the vertical dispersion and dilution of pollutants [5,45,46]. Besides, we compared the NH3 concentrations with the PM2.5 concentrations, and a significant positive correlation (R = 0.75) was found (Figure 2a). It can be explained by the day-to-day variations in the meteorological conditions that caused the simultaneous increase or drop in the NH3 and PM2.5 concentrations. On the other hand, NH3 is also intricately linked to the secondary formation of aerosols [22,23,24], which is relevant to the acidity (pH), liquid water content and HNO3 level [47,48].
To further understand the factors leading to the increased NH3 concentrations in Beijing, Figure 3 and Table 1 compare the different characteristics associated with the top and bottom 33.3% daily NH3 concentrations under dry conditions. The top 33.3% NH3 concentrations in Beijing were within 22.4–34.6 μg m−3, significantly higher than the bottom 33.3% concentrations (2.0–16.6 μg m−3). When the top 33.3% concentrations happened, the average 2-m T and 2-m RH in Beijing were 26.0 °C and 52%, respectively, significantly warmer and moister than those associated with the bottom 33.3% concentrations (i.e., 23.1 °C and 35%). At the upper levels, the thermal difference between the days associated with the top and bottom 33.3% concentrations was larger; the average values of the 1500-m PT were 305.6 K and 300.7 K, respectively. In short, the warmer and moister conditions and appearance of strong thermal inversion aloft in Beijing favor the accumulation of NH3.
In addition, distinct wind directions could be found based on the wind measurements at 800-m AGL (close to the 925-hPa level). The top 33.3% NH3 concentrations in Beijing were primarily in relation to the southwesterly winds (181–225°), while the bottom 33.3% NH3 concentrations were corresponding to the westerly and northerly winds (226–360°). Since there are strong NH3 emissions in the southern plains adjacent to Beijing (Figure 1a), it is hypothesized that the regional transport of NH3 induced by the southerly prevailing winds is critical to the increased NH3 concentration in Beijing. To quantitatively evaluate the impact of regional transport, the episode from 23 to 25 May associated with the southwesterly prevailing winds was simulated using WRF-Chem and further analyzed in the Section 3.2.
3.2. Case Study on the Regional Transport of NH3 to Beijing using WRF-Chem
In this section, the simulation results were first validated against the observations, and then the impact of regional transport on the NH3 concentration in Beijing was presented. Figure 4 shows the time series of the observed and simulated NH3 concentrations, PM2.5 concentrations, 2-m Ts, and 2-m RHs in Beijing from 23 to 25 May. Although the model tends to underestimate the daytime NH3 and PM2.5 concentrations in Beijing, both the diurnal pattern (peaking in the early morning and reaching the minimum in the afternoon) and the daily variation were generally well reproduced. The correlation coefficients between the observed and simulated NH3 and PM2.5 concentrations in Beijing were 0.73 and 0.70, respectively (Figure 4a,b). Good agreements also can be found between the observations and simulations of T and RH (Figure 4c,d). In addition to the near-surface parameters, the simulated vertical structures of PT and horizontal wind over Beijing were also compared with the sounding data (Figure 5). The gradual warming of the upper air and the strengthening of southerly winds in Beijing from 23 to 25 May were accurately simulated by the model. Overall, these generally good model performances (Figure 4 and Figure 5) provide a basis to use the simulation results to investigate the transport process during the studied period.
To identify the possible source regions, 24-h backward trajectories ending at the NH3 monitoring site in Beijing were simulated using the HYSPLIT. With a high pressure located over the south seas at the 925-hPa level, there was a southeast-to-northwest pressure gradient across Beijing from 23 to 25 May, which supported the southerly prevailing winds towards Beijing (Figure 6). Influenced by such synoptic conditions, the backward trajectories during those three days all passed through the south part of Hebei province. Based on these trajectories and the spatial distribution of NH3 emissions (Figure 1 and Figure 6), we roughly delimited a potential source region in the southern plains adjacent to Beijing (114.3–118.0° E, 35.8–39.5° N). The EXP simulation was conducted using the emission zero-out configuration in the potential source region. Figure 7 presents the spatial distribution of the ground-level NH3 concentration in the Beijing–Tianjin–Hebei region at 18:00 LT during the selected episode. The NH3 concentration in the center of Beijing was around 12 μg m−3, significantly lower than those in the southern upstream plains, in which the NH3 concentrations were greater than 20 µg m−3 on 24 and 25 May (Figure 7a–c). By calculating the difference between the BASE and EXP runs, the contributions of the potential source region to the NH3 concentrations in the Beijing–Tianjin–Hebei region were illustrated in Figure 7d–f. At 18:00 LT, the transport process can increase the NH3 concentration in the center of Beijing by 5–7 µg m−3. Averaging the simulation results of each day, the daily NH3 concentrations in the center of Beijing were calculated, which were 15.1 µg m−3 on 23 May, 15.0 µg m−3 on 24 May, and 15.7 µg m−3 on 25 May (Figure 8), and the southern plains could contribute 5.4 µg m−3 (36%), 6.1 µg m−3 (41%), and 5.3 µg m−3 (34%), respectively. These results indicate that when the Beijing–Tianjin–Hebei region is influenced by the southerly prevailing winds, the regional transport plays an important role in the NH3 concentration in Beijing. Thus, joint efforts to reduce NH3 emissions in the whole Beijing–Tianjin–Hebei region are necessary to regulate the NH3 concentration in Beijing.
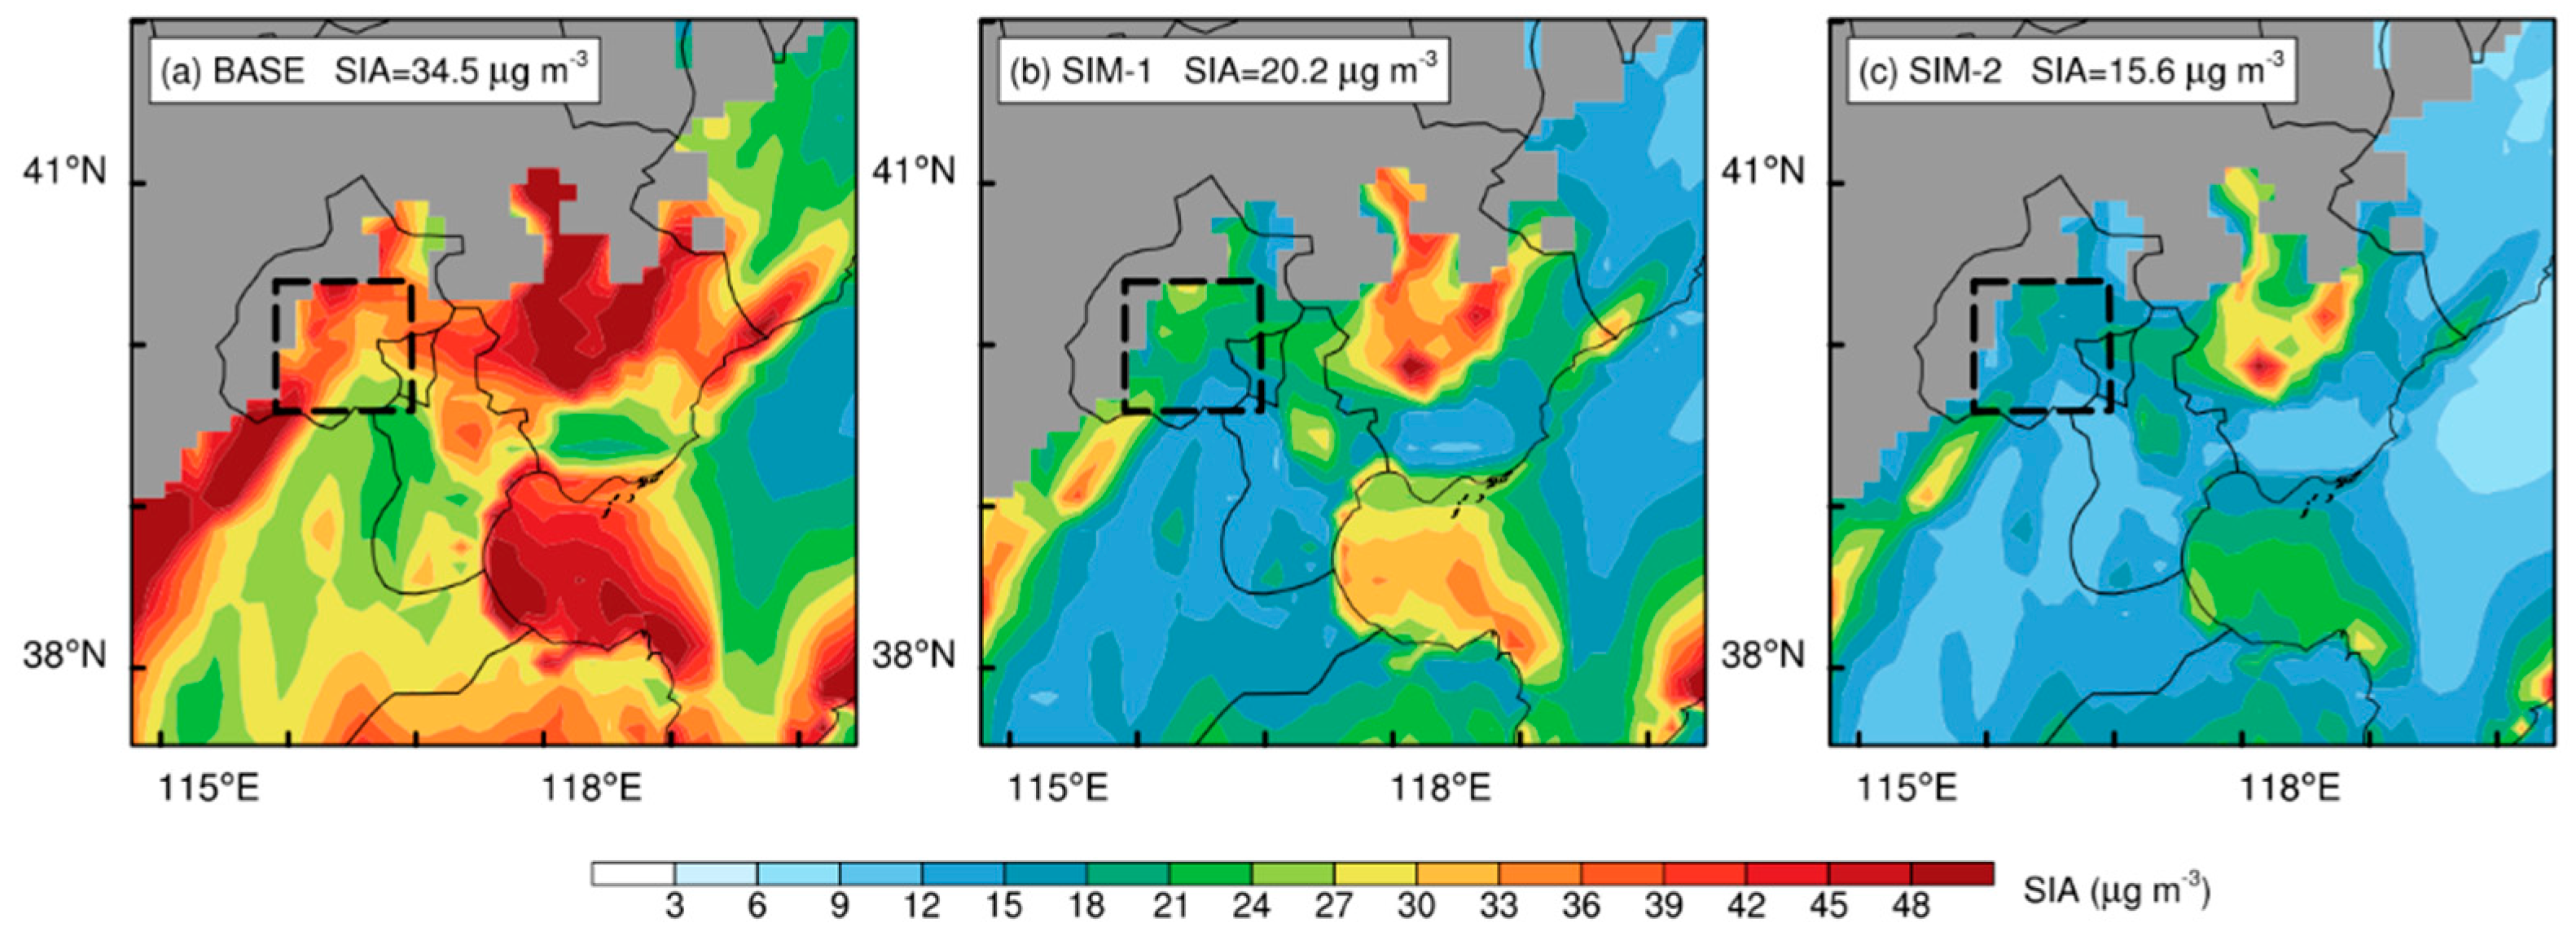
Besides, to understand the impacts of NH3 emissions on the PM2.5 pollution, we compared the simulated SIA concentrations in the Beijing–Tianjin–Hebei region under different emission scenarios (i.e., BASE, SIM-1 and SIM-2). By halving the emissions of SO2 and NOX (Figure 9b), the near-surface SIA concentration in Beijing can decrease by 14.3 µg m−3 (41%). Comparing the results of SIM-2 with those of SIM-1, it was found that the control of NH3 emissions could result in an additional 13% reduction in the SIA concentration in Beijing (Figure 9c). Similar results have also been found by Fu et al. [24]. Thus, enforcing the NH3 emissions control in conjunction with other gas pollutants can benefit the PM2.5 pollution mitigation [2,10,24]. It should be noted that the link between NH3 and aerosol pollution is quite complicated [23,24,47,48], and here we just presented some results of simplistic numerical experiments, which warrants further studies. To develop the effective emission control policies, the framework that explicitly considers the pH and liquid water content proposed by Nenes et al. [47] can be used to determine the chemical domains of the sensitivity of the aerosol concentration to the NH3 and HNO3 levels.
4. Conclusions
In this study, the influence of regional transport on the NH3 concentration in Beijing was systematically investigated by combining observational analyses, backward trajectory calculations, and meteorology–chemistry coupled simulations. The NH3 concentration was measured in the Beijing Municipal Environmental Monitoring Center from 11 May to 24 June, 2015.
A statistically significant positive correlation was found between the NH3 and PM2.5 concentrations in Beijing. The relationships between the NH3 concentrations and meteorological parameters in Beijing were also examined. The daily NH3 concentration was positively correlated with the near-surface T and RH. The higher NH3 concentrations in Beijing were usually associated with the warming of the upper atmosphere. The warming aloft can increase the thermal stability, which would suppress the development of the boundary layer to some extent, as well as the vertical dispersion of pollutants. Further, distinct wind directions could be found during the days of the top and bottom 33.3% NH3 concentrations. The top 33.3% NH3 concentrations in Beijing were primarily in relation to the southwesterly winds (181–225°), while the bottom 33.3% NH3 concentrations were corresponding to the westerly and northerly winds (226–360°). Since there are strong NH3 emissions in the southern plains adjacent to Beijing, the regional transport of NH3 induced by the southerly prevailing winds plays an important role in the NH3 concentration in Beijing.
From 23 to 25 May, with a high pressure located over the south seas at the 925-hPa level, there was a southeast-to-northwest pressure gradient across Beijing, which supported the southerly prevailing winds towards Beijing. As a result, the NH3 emitted from southern Hebei could be easily transported to Beijing, leading to a higher NH3 concentration in Beijing. Thus, joint efforts to reduce NH3 emissions in the whole Beijing–Tianjin–Hebei region are necessary to regulate the NH3 concentration in Beijing. Besides, enforcing the NH3 emissions control in conjunction with the ongoing stringent control of SO2 and NOX emissions can further mitigate the aerosol pollution in Beijing.
Author Contributions
Y.M. and L.W. designed the study, Q.W. and Y.M. conducted the simulations, analyzed, and wrote the manuscript. All authors have read and agreed to the published version of the manuscript.
Funding
This research was funded by from the National Key R&D program of China (2016YFD0201204, 2016YFE0101100, and 2017YFD0201801), National Natural Science Foundation of China (41705002, 21777191).
Acknowledgments
The authors would like to thank China Meteorological Administration for providing meteorological data, China National Environmental Monitoring Center and Beijing Municipal Environmental Monitoring Center for providing air quality measurements, European Centre for Medium-Range Weather Forecasts (ECWMF) for providing the ERA5 reanalysis, and Tsinghua University for providing the emission data. The authors also would like to acknowledge the support from China Scholarship Council (CSC).
Conflicts of Interest
The authors declare no conflict of interest.
References
- Sutton, M.A.; Reis, S.; Riddick, S.N.; Dragosits, U.; Nemitz, E.; Theobald, M.R.; Tang, Y.S.; Braban, C.F.; Vieno, M.; Dore, A.J.; et al. Towards a climate-dependent paradigm of ammonia emission and deposition. Philos. Trans. R. Soc. B Biol. Sci. 2013, 368, 20130166. [Google Scholar] [CrossRef] [PubMed]
- Behera, S.N.; Sharma, M.; Aneja, V.P.; Balasubramanian, R. Ammonia in the atmosphere: A review on emission sources, atmospheric chemistry and deposition on terrestrial bodies. Environ. Sci. Pollut. Res. 2013, 20, 8092–8131. [Google Scholar] [CrossRef] [PubMed]
- Aneja, V.P.; Roelle, P.A.; Murray, G.C.; Southerland, J.; Erisman, J.W.; Fowler, D.; Asman, W.A.H.; Patni, N. Atmospheric nitrogen compounds II: Emissions, transport, transformation, deposition and assessment. Atmos. Environ. 2001, 35, 1903–1911. [Google Scholar] [CrossRef]
- Chan, C.K.; Yao, X. Air pollution in mega cities in China. Atmos. Environ. 2008, 42, 1–42. [Google Scholar] [CrossRef]
- Miao, Y.; Liu, S.; Guo, J.; Huang, S.; Yan, Y.; Lou, M. Unraveling the relationships between boundary layer height and PM2.5 pollution in China based on four-year radiosonde measurements. Environ. Pollut. 2018, 243, 1186–1195. [Google Scholar] [CrossRef] [PubMed]
- Zhang, X.; Wu, Y.; Liu, X.; Reis, S.; Jin, J.; Dragosits, U.; Van Damme, M.; Clarisse, L.; Whitburn, S.; Coheur, P.-F.; et al. Ammonia Emissions May Be Substantially Underestimated in China. Environ. Sci. Technol. 2017, 51, 12089–12096. [Google Scholar] [CrossRef]
- Lelieveld, J.; Evans, J.S.; Fnais, M.; Giannadaki, D.; Pozzer, A. The contribution of outdoor air pollution sources to premature mortality on a global scale. Nature 2015, 525, 367–371. [Google Scholar] [CrossRef]
- Pozzer, A.; Tsimpidi, A.P.; Karydis, V.A.; de Meij, A.; Lelieveld, J. Impact of agricultural emission reductions on fine-particulate matter and public health. Atmos. Chem. Phys. 2017, 17, 12813–12826. [Google Scholar] [CrossRef] [Green Version]
- Hristov, A.N. Technical note: Contribution of ammonia emitted from livestock to atmospheric fine particulate matter (PM2.5) in the United States. J. Dairy Sci. 2011, 94, 3130–3136. [Google Scholar] [CrossRef]
- Liu, X.; Xu, W.; Duan, L.; Du, E.; Pan, Y.; Lu, X.; Zhang, L.; Wu, Z.; Wang, X.; Zhang, Y.; et al. Atmospheric Nitrogen Emission, Deposition, and Air Quality Impacts in China: An Overview. Curr. Pollut. Rep. 2017, 3, 65–77. [Google Scholar] [CrossRef]
- Pope, C.A., III; Burnett, R.T.; Thurston, G.D.; Thun, M.J.; Calle, E.E.; Krewski, D.; Godleski, J.J. Cardiovascular mortality and long-term exposure to particulate air pollution: Epidemiological evidence of general pathophysiological pathways of disease. Circulation 2004, 109, 71–77. [Google Scholar] [CrossRef] [Green Version]
- Tao, W.K.; Chen, J.P.; Li, Z.; Wang, C.; Zhang, C. Impact of aerosols on convective clouds and precipitation. Rev. Geophys. 2012, 50, 1–62. [Google Scholar] [CrossRef] [Green Version]
- Xu, P.; Zhang, Y.; Gong, W.; Hou, X.; Kroeze, C.; Gao, W.; Luan, S. An inventory of the emission of ammonia from agricultural fertilizer application in China for 2010 and its high-resolution spatial distribution. Atmos. Environ. 2015, 115, 141–148. [Google Scholar] [CrossRef]
- Cheng, Z.; Luo, L.; Wang, S.; Wang, Y.; Sharma, S.; Shimadera, H.; Wang, X.; Bressi, M.; de Miranda, R.M.; Jiang, J.; et al. Status and characteristics of ambient PM2.5 pollution in global megacities. Environ. Int. 2016, 89–90, 212–221. [Google Scholar] [CrossRef]
- Wang, S.; Nan, J.; Shi, C.; Fu, Q.; Gao, S.; Wang, D.; Cui, H.; Saiz-Lopez, A.; Zhou, B. Atmospheric ammonia and its impacts on regional air quality over the megacity of Shanghai, China. Sci. Rep. 2015, 5, 15842. [Google Scholar] [CrossRef] [Green Version]
- Hu, G.; Sun, J.; Zhang, Y.; Shen, X.; Yang, Y. Chemical Composition of PM2.5 Based on Two-Year Measurements at an Urban Site in Beijing. Aerosol Air Qual. Res. 2015, 15, 1748–1759. [Google Scholar] [CrossRef]
- Wei, L.; Duan, J.; Tan, J.; Ma, Y.; He, K.; Wang, S.; Huang, X.; Zhang, Y. Gas-to-particle conversion of atmospheric ammonia and sampling artifacts of ammonium in spring of Beijing. Sci. China Earth Sci. 2015, 58, 345–355. [Google Scholar] [CrossRef]
- Bobbink, R.; Hicks, K.; Galloway, J.; Spranger, T.; Alkemade, R.; Ashmore, M.; Bustamante, M.; Cinderby, S.; Davidson, E.; Dentener, F.; et al. Global assessment of nitrogen deposition effects on terrestrial plant diversity: A synthesis. Ecol. Appl. 2010, 20, 30–59. [Google Scholar] [CrossRef] [PubMed] [Green Version]
- Bowman, A.F.; Van Vuuren, D.P.; Derwent, R.G.; Posch, M. A global analysis of acidification and eutrophication of terrestrial ecosystems. Water Air Soil Pollut. 2002, 141, 349–382. [Google Scholar] [CrossRef]
- Bowman, W.; Cleveland, C.; Halada, Ĺ.; Hreško, J.; Baron, J. Negative impact of nitrogen deposition on soil buffering capacity. Nat. Geosci. 2008, 1, 767–770. [Google Scholar] [CrossRef]
- Stevens, C.J.; Duprè, C.; Dorland, E.; Gaudnik, C.; Gowing, D.J.G.; Bleeker, A.; Diekmann, M.; Alard, D.; Bobbink, R.; Fowler, D.; et al. Nitrogen deposition threatens species richness of grasslands across Europe. Environ. Pollut. 2010, 158, 2940–2945. [Google Scholar] [CrossRef] [PubMed] [Green Version]
- Liu, M.; Huang, X.; Song, Y.; Xu, T.; Wang, S.; Wu, Z.; Hu, M.; Zhang, L.; Zhang, Q.; Pan, Y.; et al. Rapid SO2 emission reductions significantly increase tropospheric ammonia concentrations over the North China Plain. Atmos. Chem. Phys. 2018, 18, 17933–17943. [Google Scholar] [CrossRef] [Green Version]
- Lachatre, M.; Fortems-Cheiney, A.; Foret, G.; Siour, G.; Dufour, G.; Clarisse, L.; Clerbaux, C.; Coheur, P.-F.; Van Damme, M.; Beekmann, M. The unintended consequence of SO2 and NO2 regulations over China: Increase of ammonia levels and impact on PM2.5 concentrations. Atmos. Chem. Phys. 2019, 19, 6701–6716. [Google Scholar] [CrossRef] [Green Version]
- Fu, X.; Wang, S.; Xing, J.; Zhang, X.; Wang, T.; Hao, J. Increasing Ammonia Concentrations Reduce the Effectiveness of Particle Pollution Control Achieved via SO2 and NOX Emissions Reduction in East China. Environ. Sci. Technol. Lett. 2017, 4, 221–227. [Google Scholar] [CrossRef]
- Meng, Z.; Xu, X.; Lin, W.; Ge, B.; Xie, Y.; Song, B.; Jia, S.; Zhang, R.; Peng, W.; Wang, Y.; et al. Role of ambient ammonia in particulate ammonium formation at a rural site in the North China Plain. Atmos. Chem. Phys. 2018, 18, 167–184. [Google Scholar] [CrossRef] [Green Version]
- Miao, Y.; Guo, J.; Liu, S.; Liu, H.; Zhang, G.; Yan, Y.; He, J. Relay transport of aerosols to Beijing-Tianjin-Hebei region by multi-scale atmospheric circulations. Atmos. Environ. 2017, 165, 35–45. [Google Scholar] [CrossRef]
- Zhang, Y.; Tang, A.; Wang, D.; Wang, Q.; Benedict, K.; Zhang, L.; Liu, D.; Li, Y.; Collett, J.L.; Sun, Y.; et al. The vertical variability of ammonia in urban Beijing, China. Atmos. Chem. Phys. 2018, 18, 16385–16398. [Google Scholar] [CrossRef] [Green Version]
- Volten, H.; Bergwerff, J.B.; Haaima, M.; Lolkema, D.E.; Berkhout, A.J.C.; van der Hoff, G.R.; Potma, C.J.M.; Wichink Kruit, R.J.; van Pul, W.A.J.; Swart, D.P.J. Two instruments based on differential optical absorption spectroscopy (DOAS) to measure accurate ammonia concentrations in the atmosphere. Atmos. Meas. Tech. 2012, 5, 413–427. [Google Scholar] [CrossRef] [Green Version]
- Chen, F.; Judge, D.; Wu, C.Y.R.; Caldwell, J. Low and room temperature photoabsorption cross sections of NH3 in the UV region. Planet. Space Sci. 1998, 47, 261–266. [Google Scholar] [CrossRef]
- Cheng, G.; Li, J.; Wang, X.; Li, Y.; Zhang, D. Atmospheric ammonia pollution in the traffic environment of Beijing city in spring. Acta Sci. Circumst. 2016, 36, 2803–2810. [Google Scholar]
- Grell, G.A.; Peckham, S.E.; Schmitz, R.; McKeen, S.A.; Frost, G.; Skamarock, W.C.; Eder, B. Fully coupled “online” chemistry within the WRF model. Atmos. Environ. 2005, 39, 6957–6975. [Google Scholar] [CrossRef]
- Chen, F.; Dudhia, J. Coupling an Advanced Land Surface–Hydrology Model with the Penn State–NCAR MM5 Modeling System. Part I: Model Implementation and Sensitivity. Mon. Weather Rev. 2001, 129, 569–585. [Google Scholar] [CrossRef] [Green Version]
- Hong, S.-Y.; Noh, Y.; Dudhia, J. A New Vertical Diffusion Package with an Explicit Treatment of Entrainment Processes. Mon. Weather Rev. 2006, 134, 2318–2341. [Google Scholar] [CrossRef] [Green Version]
- Iacono, M.J.; Delamere, J.S.; Mlawer, E.J.; Shephard, M.W.; Clough, S.A.; Collins, W.D. Radiative forcing by long-lived greenhouse gases: Calculations with the AER radiative transfer models. J. Geophys. Res. 2008, 113, D13103. [Google Scholar] [CrossRef]
- Janjić, Z.I. The Step-Mountain Eta Coordinate Model: Further Developments of the Convection, Viscous Sublayer, and Turbulence Closure Schemes. Mon. Weather Rev. 1994, 122, 927–945. [Google Scholar] [CrossRef] [Green Version]
- Hong, S.-Y.; Dudhia, J.; Chen, S.-H. A Revised Approach to Ice Microphysical Processes for the Bulk Parameterization of Clouds and Precipitation. Mon. Weather Rev. 2004, 132, 103–120. [Google Scholar] [CrossRef]
- Ackermann, I.J.; Hass, H.; Memmesheimer, M.; Ebel, A.; Binkowski, F.S.; Shankar, U. Modal aerosol dynamics model for Europe. Atmos. Environ. 1998, 32, 2981–2999. [Google Scholar] [CrossRef]
- Schell, B.; Ackermann, I.J.; Hass, H.; Binkowski, F.S.; Ebel, A. Modeling the formation of secondary organic aerosol within a comprehensive air quality model system. J. Geophys. Res. Atmos. 2001, 106, 28275–28293. [Google Scholar] [CrossRef]
- Stockwell, W.R.; Middleton, P.; Chang, J.S.; Tang, X. The second generation regional acid deposition model chemical mechanism for regional air quality modeling. J. Geophys. Res. 1990, 95, 16343–16367. [Google Scholar] [CrossRef]
- MEIC Data. Available online: http://www.meicmodel.org (accessed on 21 March 2020).
- MOZART-4/GEOS-5 Data. Available online: https://www.acom.ucar.edu/wrf-chem/mozart.shtml (accessed on 25 March 2020).
- Sun, J.; Huang, L.; Liao, H.; Li, J.; Hu, J. Impacts of Regional Transport on Particulate Matter Pollution in China: A Review of Methods and Results. Curr. Pollut. Rep. 2017, 3, 182–191. [Google Scholar] [CrossRef]
- Streets, D.G.; Fu, J.S.; Jang, C.J.; Hao, J.; He, K.; Tang, X.; Zhang, Y.; Wang, Z.; Li, Z.; Zhang, Q.; et al. Air quality during the 2008 Beijing Olympic Games. Atmos. Environ. 2007, 41, 480–492. [Google Scholar] [CrossRef]
- Yoo, J.-M.; Lee, Y.-R.; Kim, D.; Jeong, M.-J.; Stockwell, W.R.; Kundu, P.K.; Oh, S.-M.; Shin, D.-B.; Lee, S.-J. New indices for wet scavenging of air pollutants (O3, CO, NO2, SO2, and PM10) by summertime rain. Atmos. Environ. 2014, 82, 226–237. [Google Scholar] [CrossRef]
- Miao, Y.; Liu, S. Linkages between aerosol pollution and planetary boundary layer structure in China. Sci. Total Environ. 2019, 650, 288–296. [Google Scholar] [CrossRef] [PubMed]
- Miao, Y.; Li, J.; Miao, S.; Che, H.; Wang, Y.; Zhang, X.; Zhu, R.; Liu, S. Interaction between planetary boundary layer and PM2.5 pollution in megacities in China: A Review. Curr. Pollut. Rep. 2019, 5, 261–271. [Google Scholar] [CrossRef] [Green Version]
- Nenes, A.; Pandis, S.N.; Weber, R.J.; Russell, A. Aerosol pH and liquid water content determine when particulate matter is sensitive to ammonia and nitrate availability. Atmos. Chem. Phys. 2020, 20, 3249–3258. [Google Scholar] [CrossRef] [Green Version]
- Guo, H.; Otjes, R.; Schlag, P.; Kiendler-Scharr, A.; Nenes, A.; Weber, R.J. Effectiveness of ammonia reduction on control of fine particle nitrate. Atmos. Chem. Phys. 2018, 18, 12241–12256. [Google Scholar] [CrossRef] [Green Version]
Figure 1.
Maps of (a) Weather Research and Forecasting model coupled with chemistry (WRF-Chem) simulation domain and anthropogenic NH3 emissions in May, 2016, and (b) the land use types in Beijing and its adjacent regions. The location of Beijing is denoted by the red lines in Figure 1a, and the locations of the NH3 monitoring site, PM2.5 monitoring site, and meteorological site in Beijing are marked by the blue cross, red dot, and black plus in Figure 1b, respectively. The dashed rectangle in Figure 1a indicates the regions using the emission zero-out method in the WRF-Chem simulation.
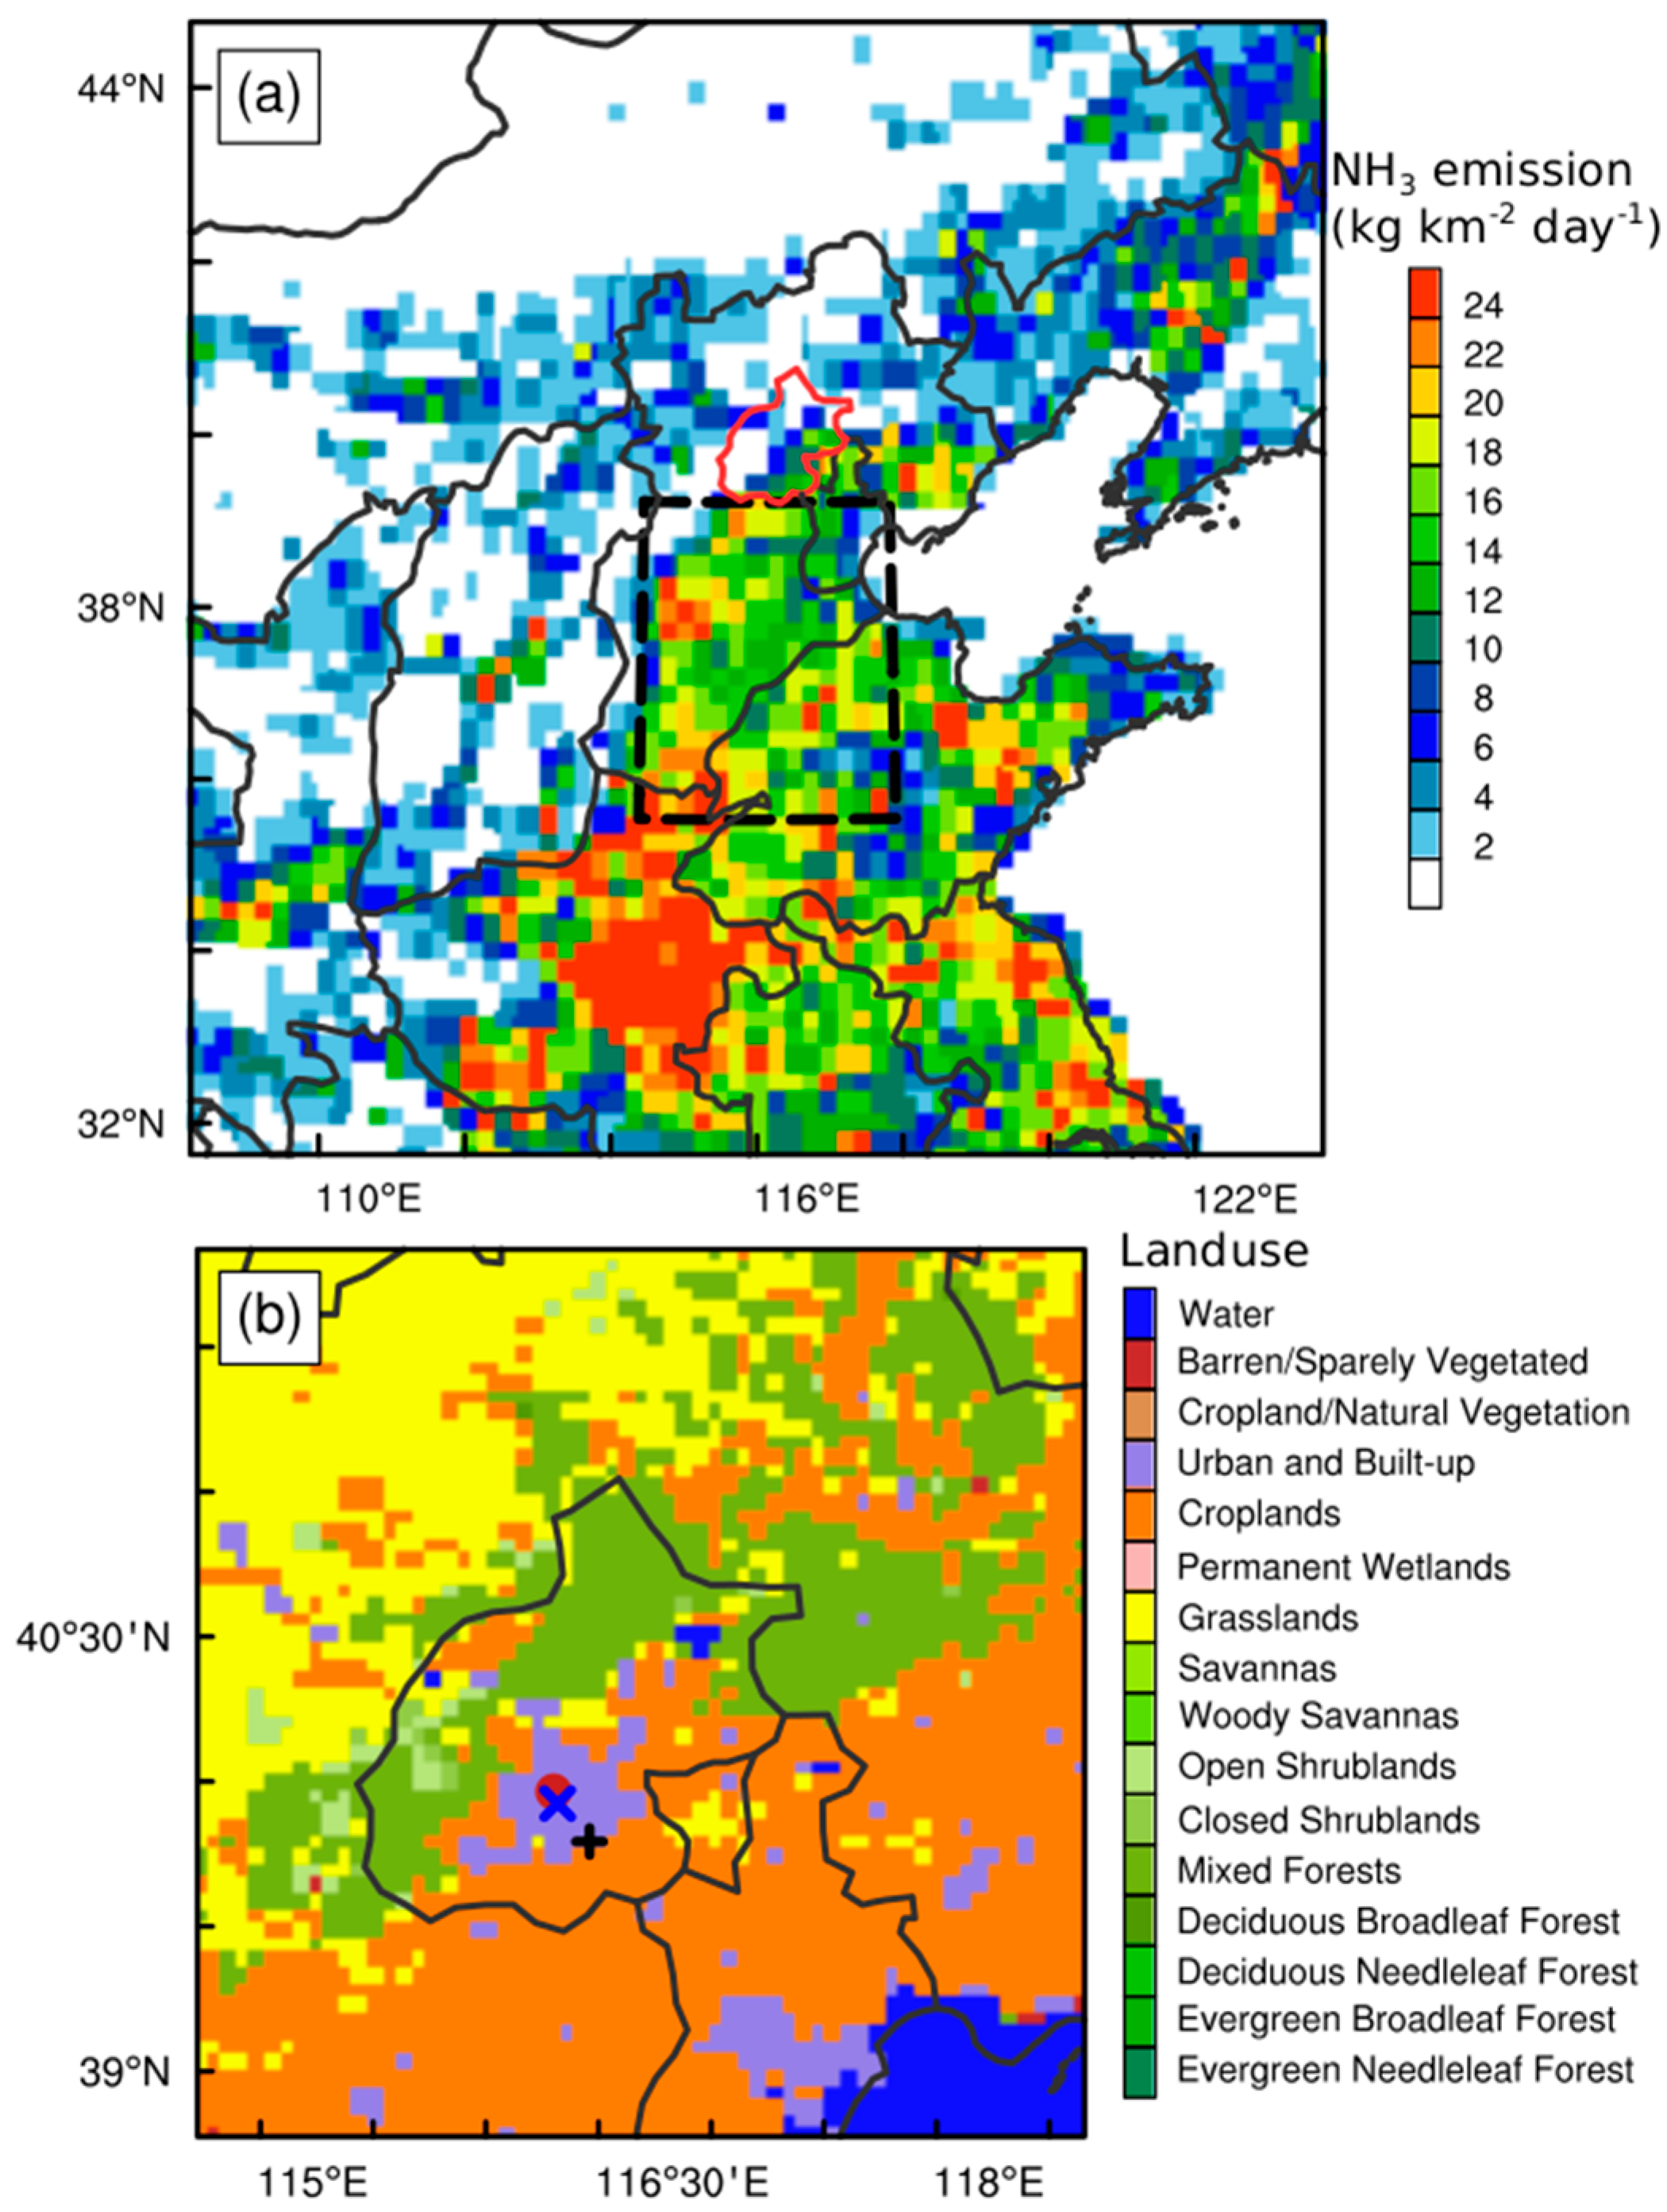
Figure 2.
Daily variations in (a) NH3 and PM2.5 concentrations, (b) 2-m temperature (T), (c) 2-m relative humidity (RH), and rainfall, (d) potential temperature vertical profile in Beijing from 11 May to 24 June, 2015. There were in total 12 rainy days during the studied period, and the correlation coefficients (R) between the NH3 concentration and different variables in Beijing under dry conditions are given for each panel, including the PM2.5 concentration, T, RH and 1500-m PT.
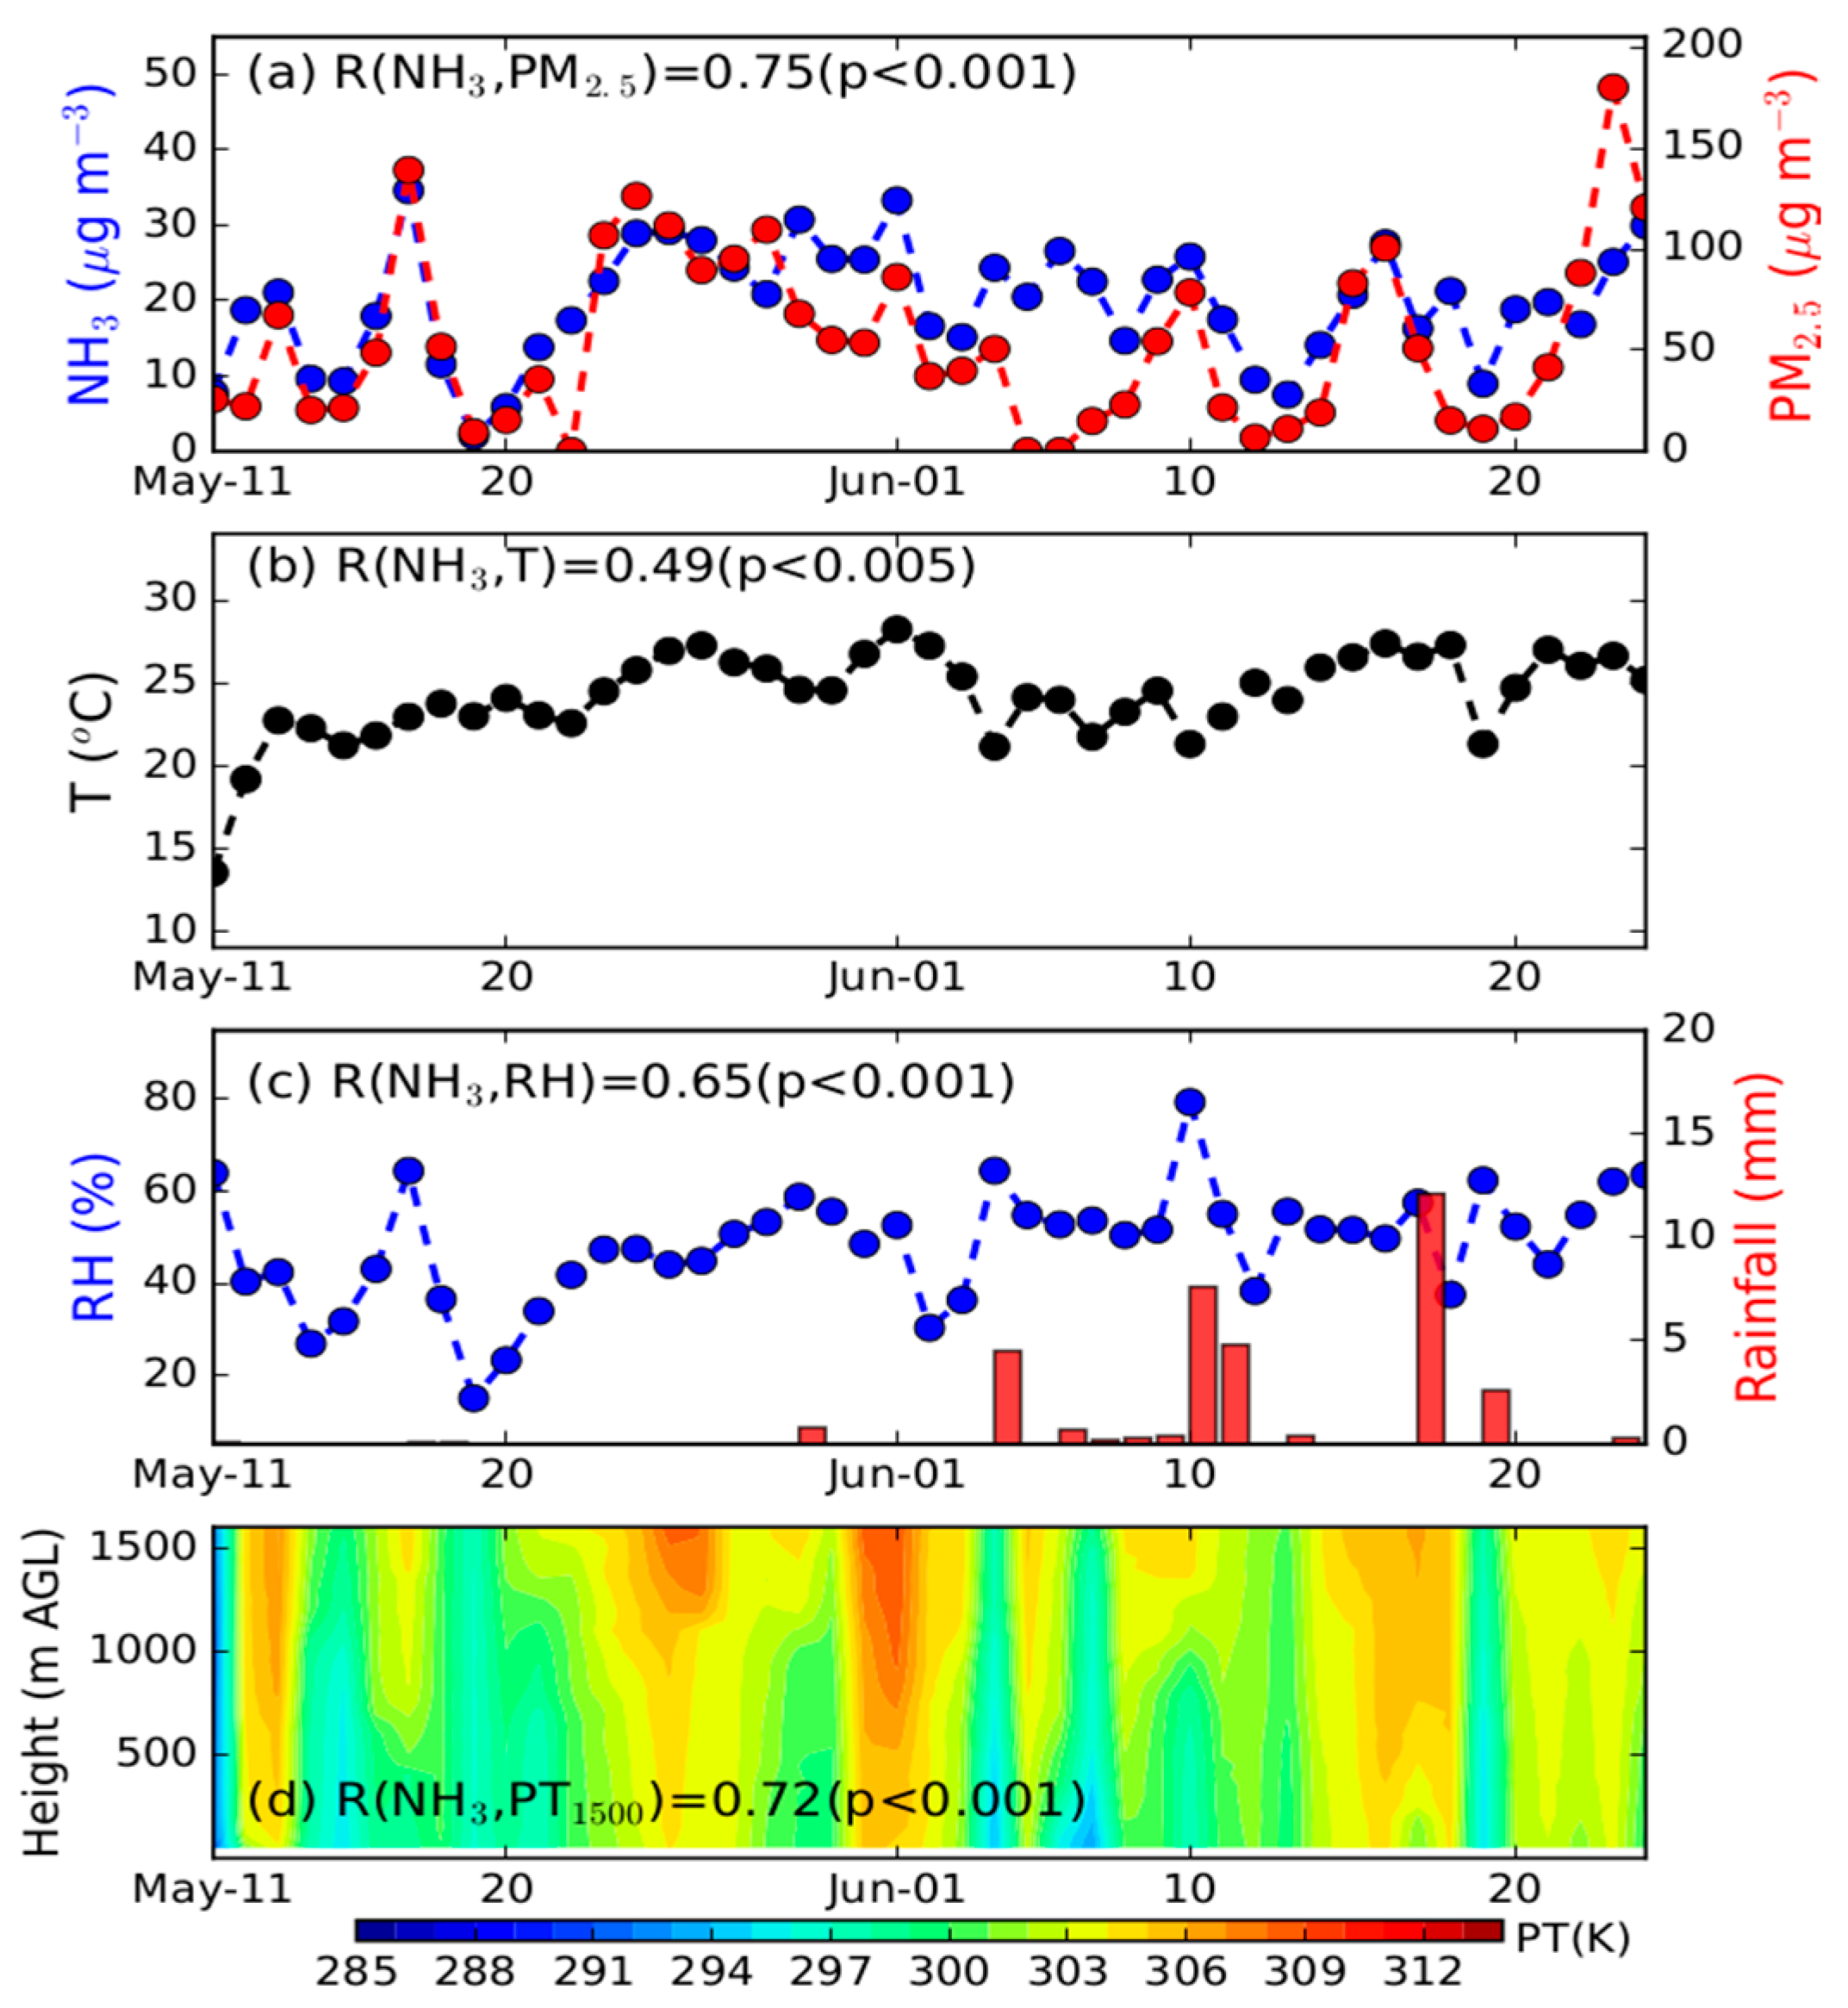
Figure 3.
Box-whiskers plots showing different characteristics between the top 33.3% and bottom 33.3% NH3 concentrations during the dry conditions from 11 May to 24 June, 2015, including (a) NH3 concentrations, (b) 2-m T, (c) 2-m RH, and (d) 1500-m PT. The central box represents the values from the lower to upper quartile (25th to 75th percentile). The vertical line extends from the 10th percentile to the 90th percentile value. The middle solid line represents the median, and the dot represents the mean value. In (e), wind rose diagram based on the 800-m horizontal wind associated with the top 33.3% (in blue) and bottom 33.3% (in red) NH3 concentrations in Beijing are shown. Except for that the 1500-m PT and 800-m wind are shown according to the soundings at 20:00 LT, the other variables are derived from the daily mean values.
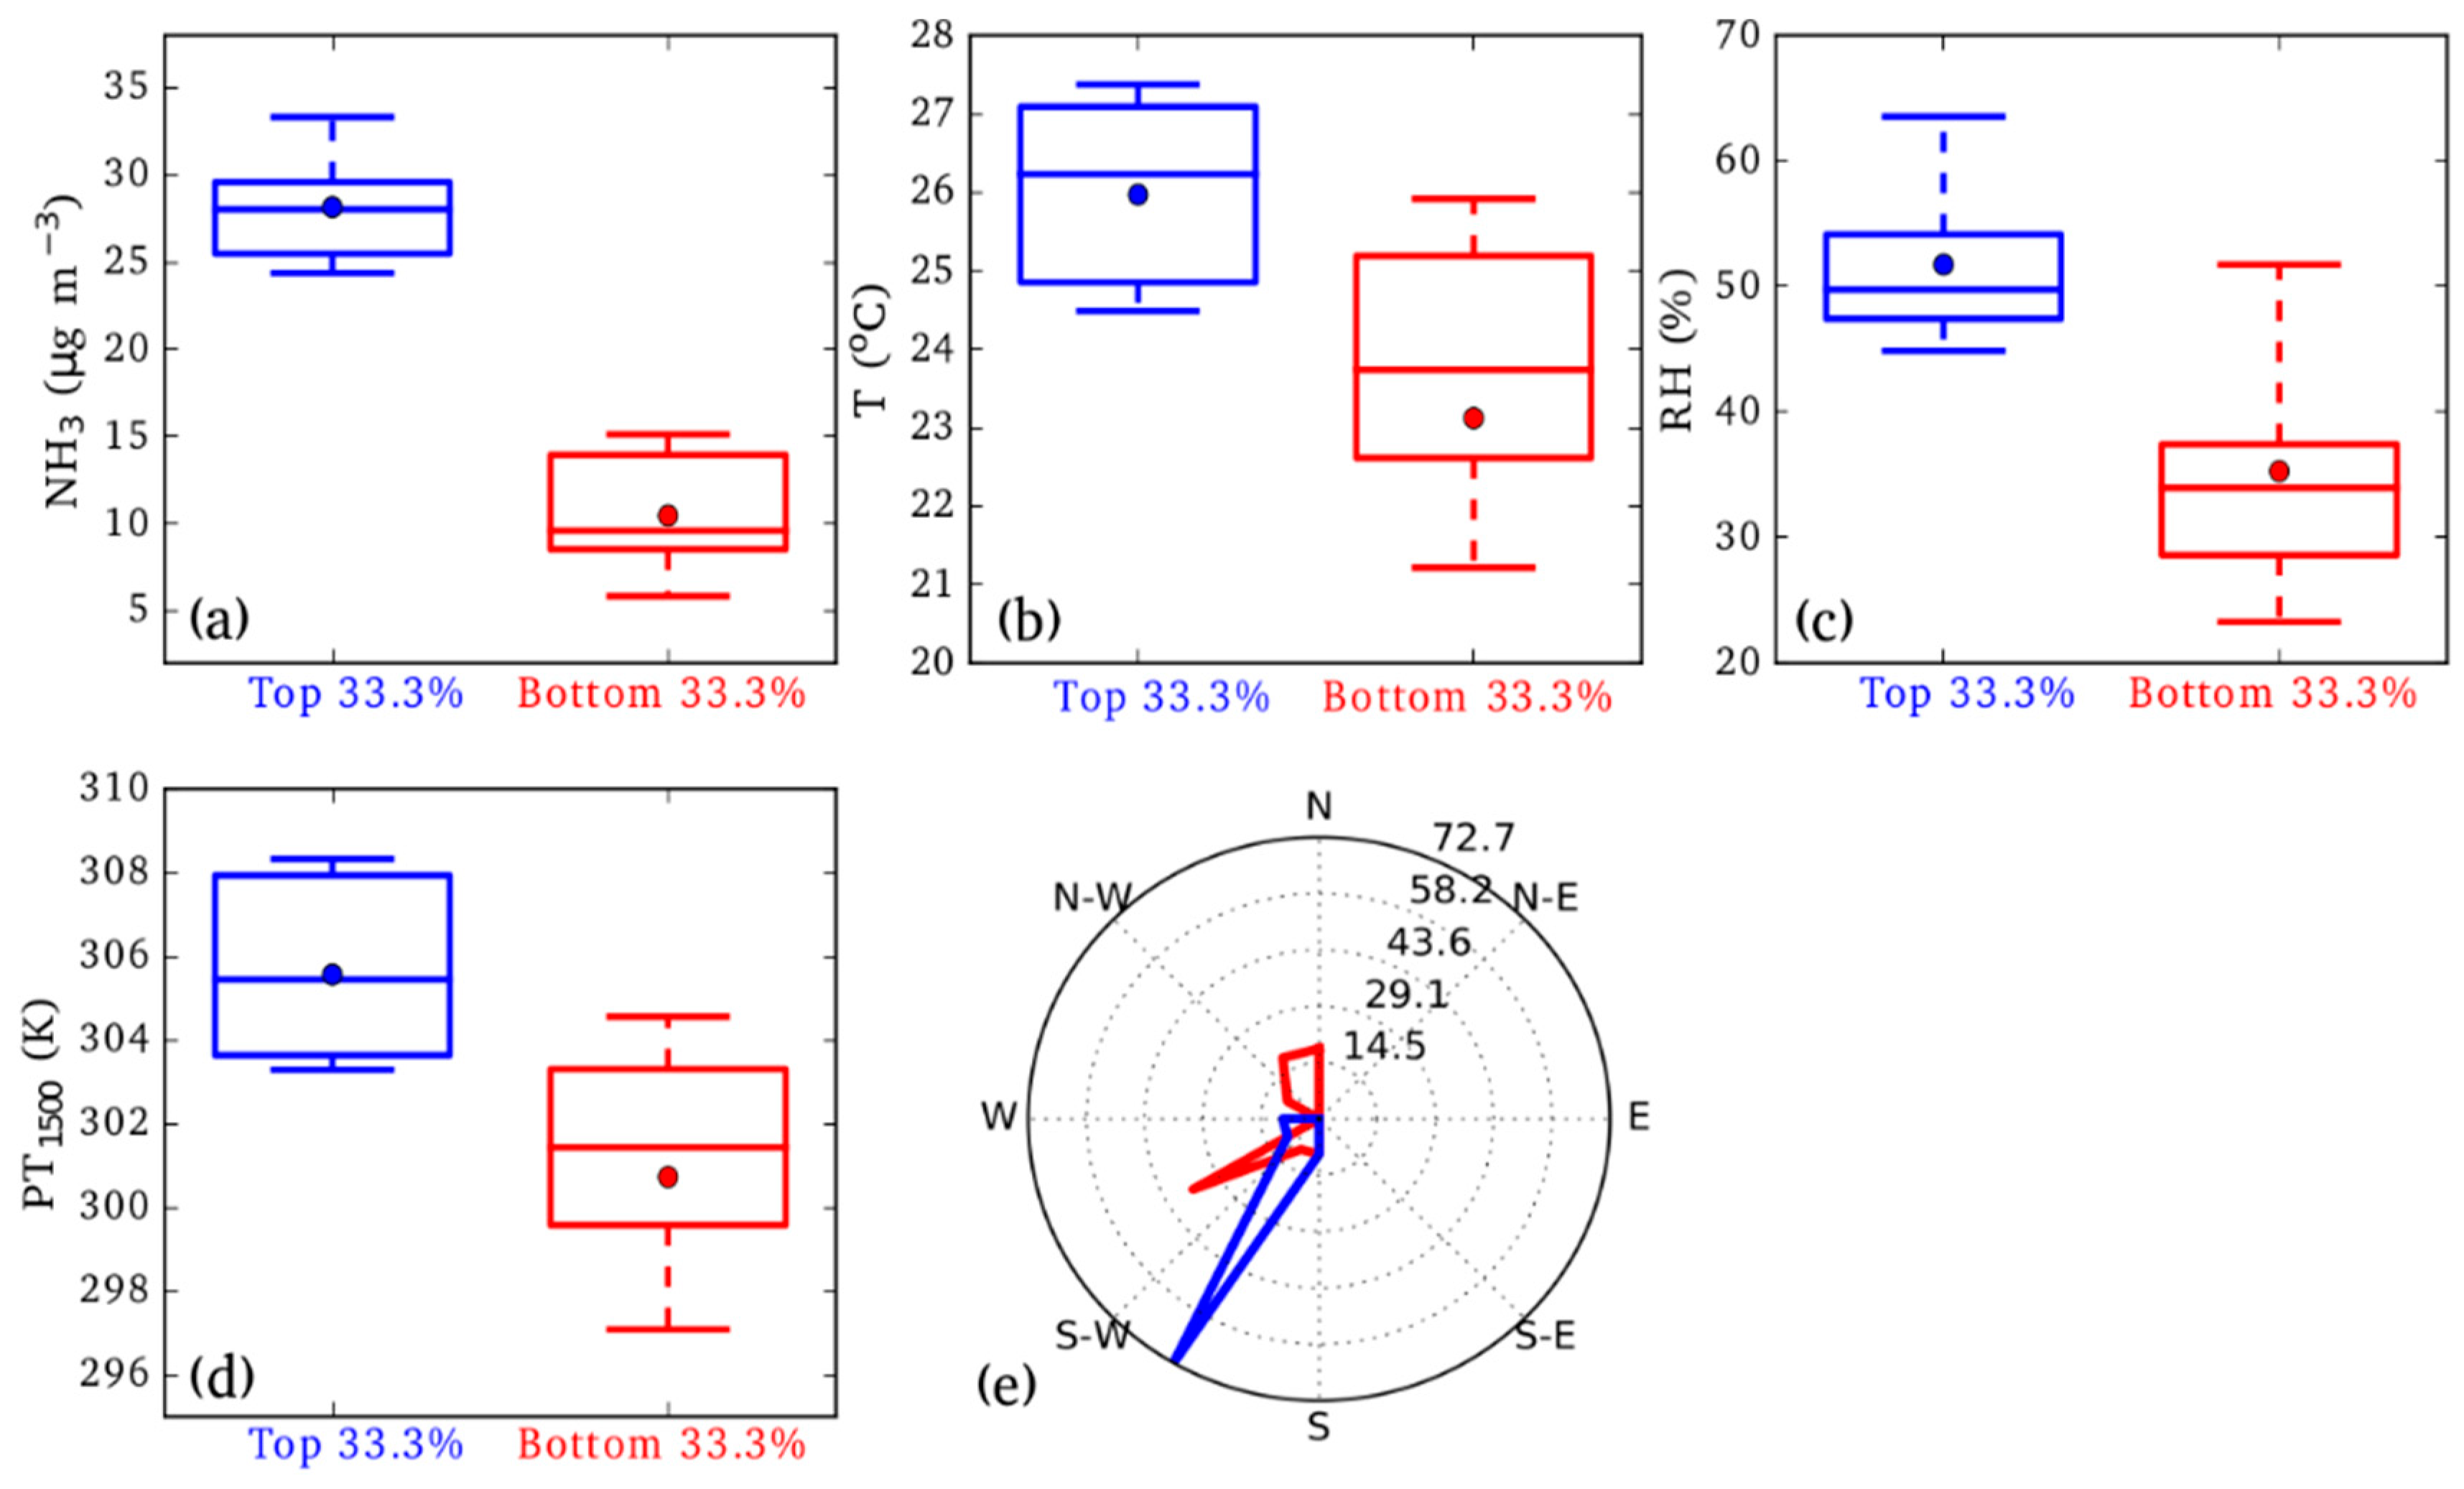
Figure 4.
Time series of observed and simulated (a) NH3 concentrations, (b) PM2.5 concentrations, (c) 2-m Ts, and (d) 2-m RHs in Beijing from 23 to 25 May, 2015. The correlation coefficients (R) between observations and simulations are presented for each panel.
Figure 4.
Time series of observed and simulated (a) NH3 concentrations, (b) PM2.5 concentrations, (c) 2-m Ts, and (d) 2-m RHs in Beijing from 23 to 25 May, 2015. The correlation coefficients (R) between observations and simulations are presented for each panel.

Figure 5.
Vertical structures of (a) the observed and (b) the simulated PTs and horizontal winds in Beijing from 23 to 25 May, 2015. Both simulations and observations are shown with an interval of 12-h. At the top of Figure 5a, the correlation coefficients (R) between simulations and observations are presented.

Figure 6.
Spatial distributions of 925-hPa geopotential height (GH) and horizontal winds in the simulation domain at 18:00 LT on (a) 23 May, (b) 24 May, and (c) 25 May, 2015, derived from the atmospheric reanalysis of European Centre for Medium-Range Weather Forecasts. The location of the NH3 monitoring site is marked by the blue cross, and 24-h backward trajectories arriving in the site are shown as the green lines. The dashed rectangle adjacent to Beijing indicates the regions using the emission zero-out method in the WRF-Chem simulation. The high-pressure systems in the southern seas are denoted by the text “H”.
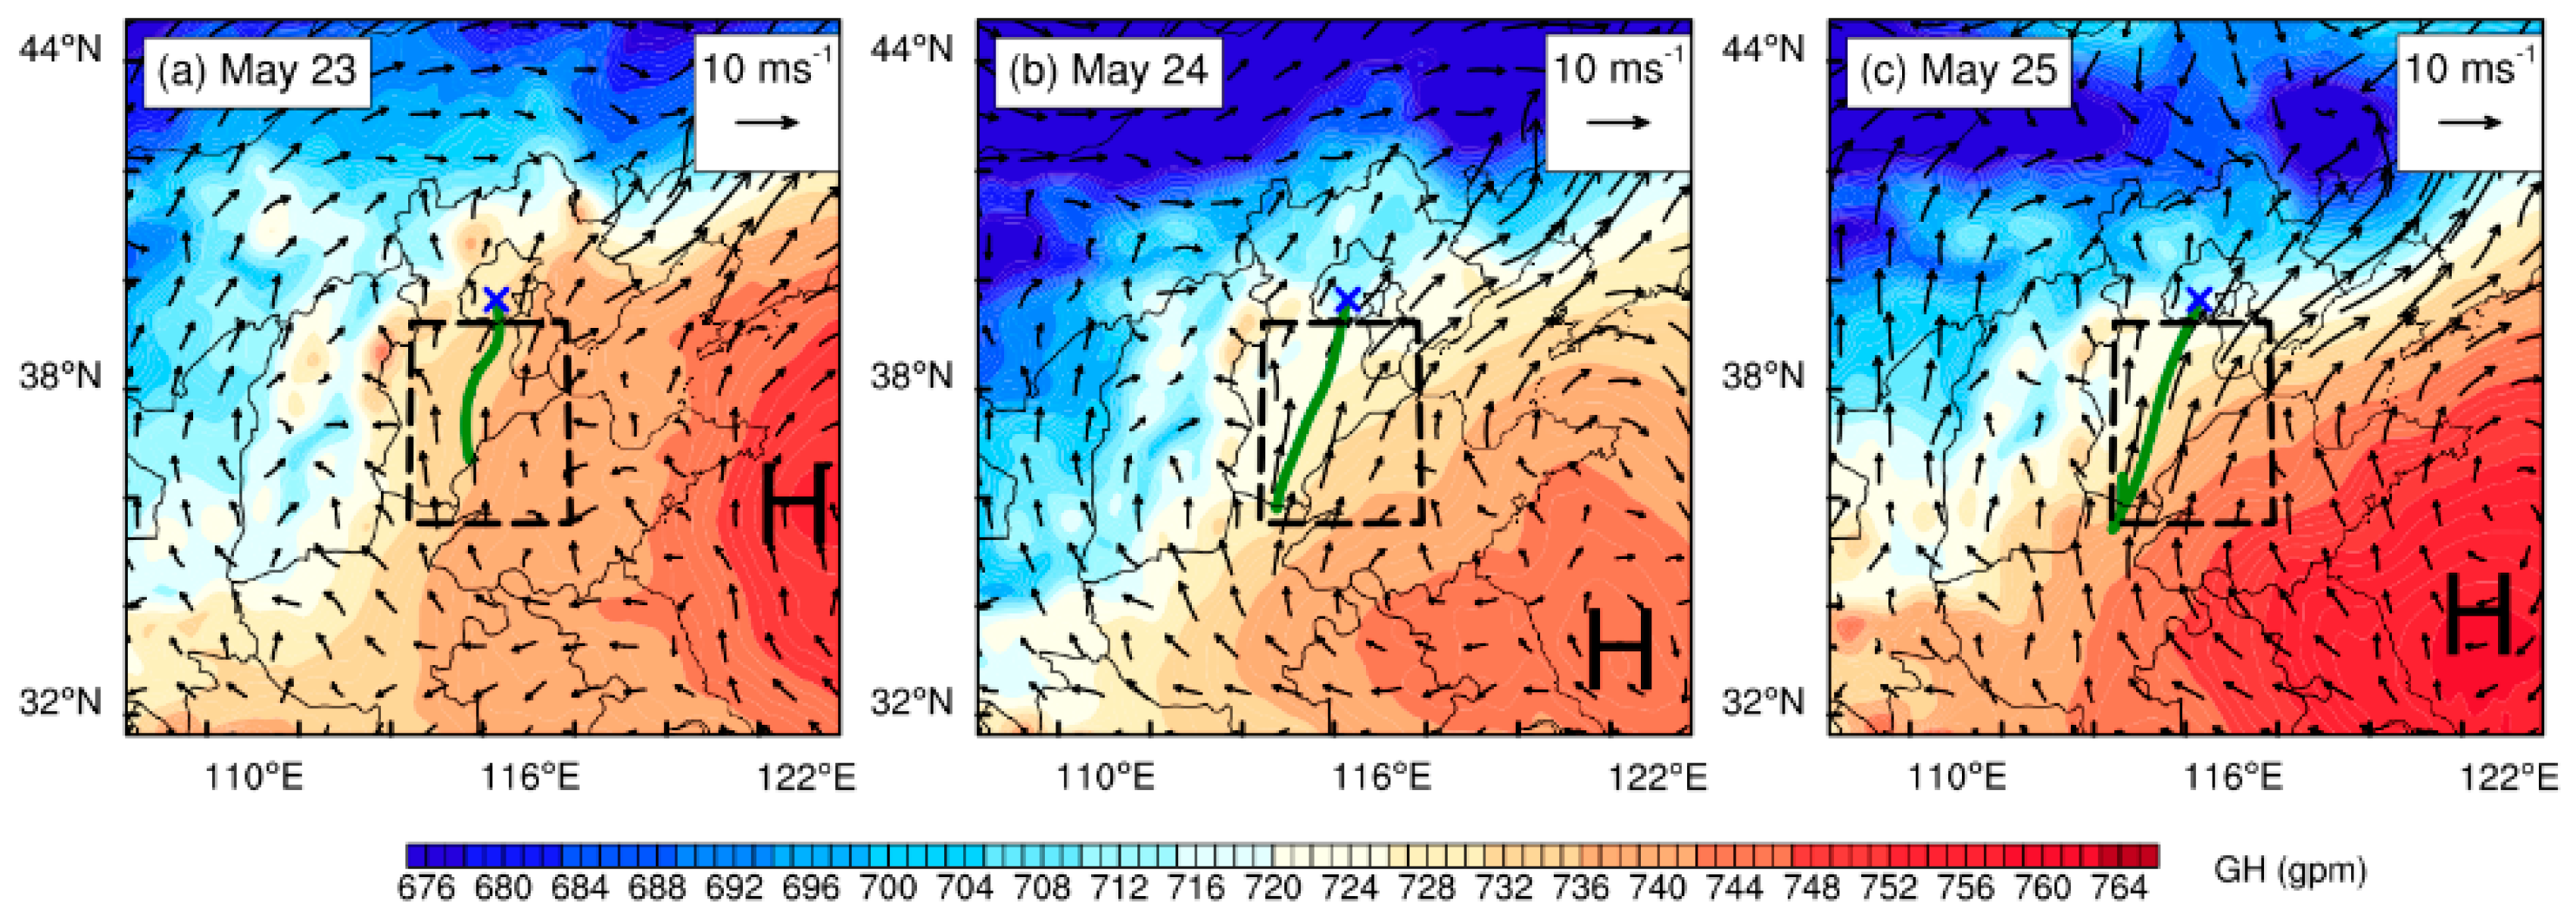
Figure 7.
Spatial distribution of the simulated near-surface NH3 concentrations and winds at 18:00 LT on (a,d) 23 May, (b,e) 24 May, and (c,f) 25 May, 2015. The mountainous regions are denoted by the grey shadings. The top panels show the simulation results of the baseline (BASE) run, and the bottom panels present the differences between the BASE run and sensitivity experiment (EXP). The location of the NH3 monitoring site in Beijing is indicated by the blue cross.

Figure 8.
Bar plot showing the daily NH3 concentrations in Beijing derived from the BASE run and contributed by the southern plain regions (BASE-EXP).
Figure 8.
Bar plot showing the daily NH3 concentrations in Beijing derived from the BASE run and contributed by the southern plain regions (BASE-EXP).

Figure 9.
Spatial distributions of near-surface secondary inorganic aerosols (SIA) concentrations in the Beijing–Tianjin–Hebei region during the studied episode derived from the (a) BASE run, (b) SIM-1 run, and (c) SIM-2 run. The average SIA concentrations in the dashed rectangle are given for each panel.

Table 1.
NH3 concentrations, 2-m T, 2-m RH, 1500-m PT and 800-m wind direction (WD) in Beijing during the dry conditions from 11 May to 24 June, 2015. Except for that the PT and WD are presented according to the soundings at 20:00 LT, the other variables are derived from the daily mean values.
Table 1.
NH3 concentrations, 2-m T, 2-m RH, 1500-m PT and 800-m wind direction (WD) in Beijing during the dry conditions from 11 May to 24 June, 2015. Except for that the PT and WD are presented according to the soundings at 20:00 LT, the other variables are derived from the daily mean values.
| Date (Month-Day) | NH3 (μg m−3) | T (°C) | RH (%) | PT1500 (K) | WD800 (°) | |
|---|---|---|---|---|---|---|
| Days with Top 33.3% Daily NH3 Concentrations | 05-17 | 34.6 | 22.9 | 64 | 304.6 | 217 |
| 05-23 | 22.6 | 24.5 | 47 | 303.8 | 208 | |
| 05-24 | 28.9 | 25.8 | 48 | 305.4 | 220 | |
| 05-25 | 29.2 | 26.9 | 44 | 307.9 | 215 | |
| 05-26 | 28.0 | 27.3 | 45 | 307.9 | 217 | |
| 05-27 | 24.4 | 26.2 | 51 | 303.5 | 231 | |
| 05-30 | 25.5 | 24.5 | 56 | 302.0 | 183 | |
| 05-31 | 25.4 | 26.7 | 49 | 308.3 | 214 | |
| 06-01 | 33.3 | 28.2 | 53 | 308.9 | 209 | |
| 06-16 | 27.6 | 27.4 | 50 | 305.4 | 267 | |
| 06-24 | 29.9 | 25.2 | 64 | 303.3 | 218 | |
| Days with Bottom 33.3% Daily NH3 Concentrations | 05-11 | 7.8 | 13.5 | 64 | 291.2 | 337 |
| 05-14 | 9.6 | 22.3 | 27 | 301.3 | 205 | |
| 05-15 | 9.3 | 21.2 | 32 | 298.8 | 235 | |
| 05-18 | 11.5 | 23.7 | 37 | 300.4 | 345 | |
| 05-19 | 2.0 | 23.0 | 15 | 297.1 | 348 | |
| 05-20 | 5.8 | 24.1 | 23 | 301.4 | 242 | |
| 05-21 | 13.8 | 23.0 | 34 | 302.7 | 229 | |
| 06-02 | 16.6 | 27.2 | 30 | 305.0 | 353 | |
| 06-03 | 15.1 | 25.4 | 36 | 304.6 | 234 | |
| 06-12 | 9.5 | 25.0 | 38 | 301.7 | 302 | |
| 06-14 | 14.1 | 25.9 | 52 | 303.9 | 184 |
© 2020 by the authors. Licensee MDPI, Basel, Switzerland. This article is an open access article distributed under the terms and conditions of the Creative Commons Attribution (CC BY) license (http://creativecommons.org/licenses/by/4.0/).
Share and Cite
MDPI and ACS Style
Wang, Q.; Miao, Y.; Wang, L. Regional Transport Increases Ammonia Concentration in Beijing, China. Atmosphere 2020, 11, 563. https://doi.org/10.3390/atmos11060563
AMA Style
Wang Q, Miao Y, Wang L. Regional Transport Increases Ammonia Concentration in Beijing, China. Atmosphere. 2020; 11(6):563. https://doi.org/10.3390/atmos11060563
Chicago/Turabian StyleWang, Qingmei, Yucong Miao, and Ligang Wang. 2020. "Regional Transport Increases Ammonia Concentration in Beijing, China" Atmosphere 11, no. 6: 563. https://doi.org/10.3390/atmos11060563
Note that from the first issue of 2016, this journal uses article numbers instead of page numbers. See further details here.