Article

Low-Cost Air Quality Sensors: One-Year Field Comparative Measurement of Different Gas Sensors and Particle Counters with Reference Monitors at Tušimice Observatory

1
Czech Hydrometeorological Institute, Tušimice Observatory, Tušimice 6, 432 01 Kadaň, Czech Republic
2
Czech Hydrometeorological Institute, Central Ambient Air Quality Laboratories, Generála Šišky 942, 142 00 Prague, Czech Republic
3
Envitech Bohemia s.r.o., Ovocná 34/1021, 161 00 Prague, Czech Republic
*
Author to whom correspondence should be addressed.
Atmosphere 2020, 11(5), 492; https://doi.org/10.3390/atmos11050492
Submission received: 20 April 2020 / Revised: 7 May 2020 / Accepted: 9 May 2020 / Published: 11 May 2020
(This article belongs to the Special Issue Ambient Air Quality in the Czech Republic)

Abstract

:
With attention increasing regarding the level of air pollution in different metropolitan and industrial areas worldwide, interest in expanding the monitoring networks by low-cost air quality sensors is also increasing. Although the role of these small and affordable sensors is rather supplementary, determination of the measurement uncertainty is one of the main questions of their applicability because there is no certificate for quality assurance of these non-reference technologies. This paper presents the results of almost one-year field testing measurements, when the data from different low-cost sensors (for SO2, NO2, O3, and CO: Cairclip, Envea, FR; for PM1, PM2.5, and PM10: PMS7003, Plantower, CHN, and OPC-N2, Alphasense, UK) were compared with co-located reference monitors used within the Czech national ambient air quality monitoring network. The results showed that in addition to the given reduced measurement accuracy of the sensors, the data quality depends on the early detection of defective units and changes caused by the effect of meteorological conditions (effect of air temperature and humidity on gas sensors and effect of air humidity with condensation conditions on particle counters), or by the interference of different pollutants (especially in gas sensors). Comparative measurement is necessary prior to each sensor’s field applications.

1. Introduction

Similarly to other countries, in the Czech Republic, the public’s interest in the current state of ambient air quality is increasing, especially in cities and locations exposed to industrial sources of pollution. Although the national air quality network is representatively deployed over the entire territory, covering all types of monitoring sites (urban, industrial, and background) and potential air pollution sources (traffic, agricultural, and industrial), requests to widen the spatial resolution of the measurement network (to almost personal exposure) are still increasing in the public sector [1,2,3].
During the last three years, the Czech Hydrometeorological Institute (CHMI) has recorded several requests for assistance in processing data from public projects that applied sensors in cities or other places of interest. Most of these projects suffered from severe shortcomings in the following points:
  • Clearly defined sensor application targets;
  • Appropriate sensor placement (study design) to monitor the given target;
  • Selection of suitable sensor types;
  • Initial and continuous verification of sensor measurement quality;
  • Sensor data control and processing;
  • Appropriate use and interpretation of results.
The indicated order of these points is very important because effective and successful sensor application depends mainly on the first four points. Unfortunately, most of the applicants for assistance turn to the experts only at points five or six, but it should be emphasized that even professionally processed data cannot save a poorly designed project. This paper deals with the two main points highlighted in bold above (sensor type selection and measurement quality control).
Among all the issues, the selection of appropriate and reliable sensors is always a challenging goal [4]. There is a wide range of air quality sensors available on the market, which grows every year, while no regulatory legislation or standards for quality control exist yet. Although some activities in creating international standards for air quality sensors evaluation have been already started (e.g., the European Committee for Standardization [5]), in the meantime, different specialized institutions are trying to objectively evaluate and show the measurement quality of recently produced sensor units (by performing standard statistical procedures including descriptive statistics, calculation of correlation coefficients, coefficients of determination, or measurement errors [4,6,7,8,9]). A common summary of all these independent evaluations is that this miniaturized technology has some limits, manifested primarily by different performance in real outdoor (uncontrolled) conditions than in laboratory evaluations under controlled conditions (e.g., [4,10]). The measurement quality of electrochemical gas sensors is usually susceptible to changes in ambient air temperature (T) and relative humidity (RH) [4] (for the effect of increasing sensor unit temperature on sensor sensitivity or zero offset, see Mead et al. [11]), and to cross-interference of various gases (especially between O3 and NO2; [11,12]), which often leads to the overestimation of the real concentrations [7,13]. Miniaturized optical particle counters are susceptible especially to high RH conditions (close to water condensing conditions), which may lead to erroneous estimation of particle size and mass concentration due to potential particle hygroscopic growth (particles’ ability to bind water) [14].
All of the above-mentioned negative effects on sensor measurement quality can be filtered out of the measured datasets using different correction procedures (e.g., [7,9,13,14]) if they are clearly defined at least at the beginning of the measurement (or also during the comparative measurement; ideally applied on a daily correction routine [15]). Some sensor manufacturers state that they have already implemented certain correction algorithms (for the elimination of cross-sensitivity or T and RH effects) in the sensors’ processing units. However, the algorithms used are usually not published, so the verification of the effectiveness of applied methods is again impossible without performing comparative control measurement of the given sensor unit.
Under the circumstances that measurement quality of both gas and aerosol sensors can be affected by changes in ambient meteorological conditions (T, RH) is evident, that the effect of seasonality (the effect of particular months) plays an important role [4,13,16]. The different timing of short-term comparative measurement tests (within days) may, therefore, be one of the main reasons that mixed information about the performance quality of particular sensor types is reported across literature [4,6,9,14]. Although this is known as one of the shortcomings of this topic [14], there are (so far) only very few studies providing results from long-term field comparisons (lasting at least three months or more) of different types of air quality sensors [13,16,17,18].
The aim of this study is to show the performance of different Cairpol gas sensor pairs (Cairclip for SO2, NO2, O3, and CO) and miniature Plantower (PMS7003) and Alphasense (OPC-N2) particle counter pairs (for PM1, PM2.5, and PM10 mass concentration) within almost one year of continuous field comparative measurement with the corresponding reference monitors and equivalent optical particle monitor used in the CHMI ambient air quality network (all data used are available in Supplement 2). This paper follows up on recently published studies [13,17] and complements and extends the results obtained.

2. Experimental Methodology

2.1. Study Area and Experimental Design

Field-testing measurement of different kinds of air quality sensors took place at Tušimice Observatory (the northwest area of the Czech Republic; GPS: 50°22′35.59″ N, 13°19′39.76″ E), a professional station of the CHMI focused on the integration of ground-based and remote sensing methods in meteorology and air quality measurement. The station is located in a semi-agricultural and semi-industrial background, surrounded by three brown coal-fired power plants and a spacious open-pit brown coal mine. All the sensor types were tested in pairs (to control intra-sensors variability) and installed in the appropriate housings (ventilated boxes; Figure 1) on the roof of the automatic ambient air quality monitoring reference station. Comparative testing measurement was carried out continuously between the end of 2017 and the beginning of 2019 (Cairpol gas sensors measured from November 2017 until September 2018, Plantower particle counters from March 2018 until December 2018, and Alphasense from September 2018 until January 2019).

2.2. Technical Specification of Tested Sensors and Reference (or Equivalent to Reference) Monitors

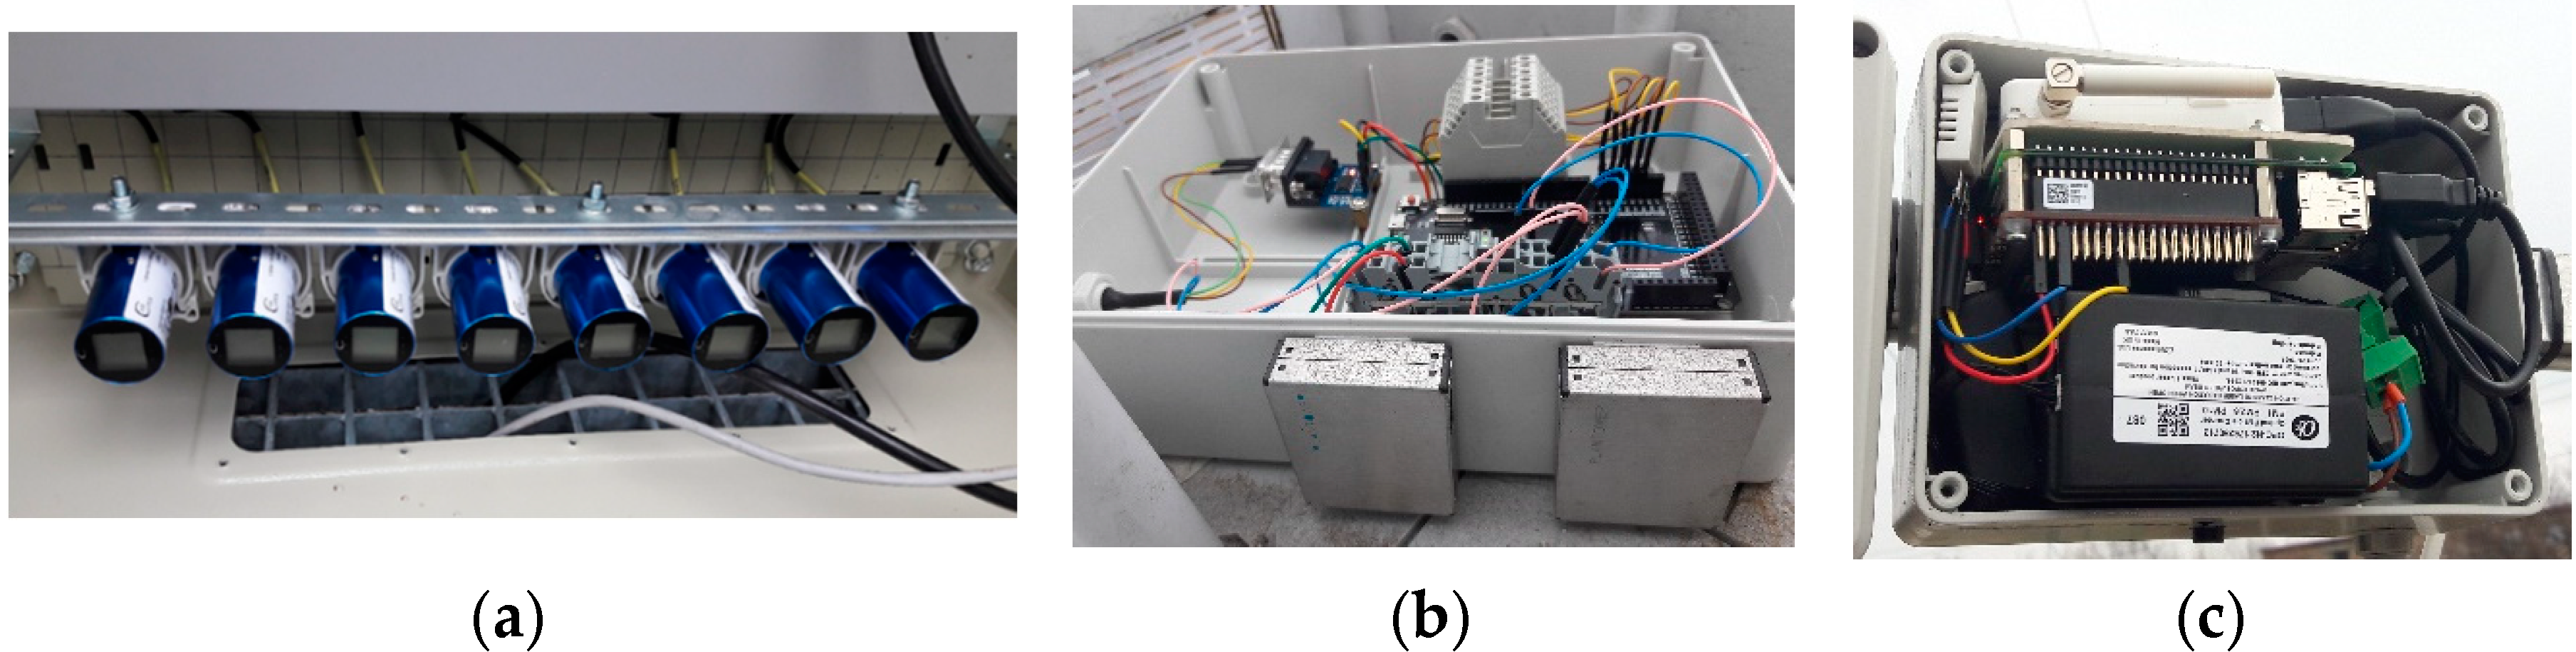
2.2.1. Cairpol Gas Sensors

The detailed specifications of Cairclip SO2, NO2, O3, and CO electrochemical sensors (Cairpol, Envea, France (FR); Figure 1a) have been described in our previous study [13], so here we cover them only briefly. Cairclip sensors are small, tube-shaped, autonomous measuring units (weight 55 g). Each sensor unit has its own battery with an operating time from 24 to 36 h (or it can be connected directly to a 5V DC power supply with a current demand of 500 mA) and a small screen, where the measured values and device status are displayed. The fundamental technical parameters of the particular sensors are listed in Table 1. All the units have an optionally adjustable measuring period from 1 min to 15 or 60 min. The operating conditions stated by the manufacturer are in temperatures (Ts) from −20 °C to 50 °C and relative humidity (RH) from 15% to 90% (non-condensing conditions). Special attention can be given to the O3 Cairpol sensor, which is actually a combined type of sensor for O3/NO2. It has the same limit of detection, range of measurement, uncertainty, and admitted effect of temperature on zero value drift as the NO2 Cairclip sensor itself [19,20]. Although the exact algorithm for sensor response on O3 separately is not known [19,21,22], given the strong positive correlation of concentrations measured by the combined O3 sensor with concentrations measured by the Cairpol sensor for SO2, NO2, or CO (see the Results section (Section 3.1)), we assume that it indicates a modified sum of O3, NO2, and possibly other oxidants’ values [11,12,13,22,23].

2.2.2. Plantower and Alphasense Miniature Particle Counters

The PMS7003 optical particle counters (Plantower, China (CHN); Figure 1b) for measuring mass concentrations of PM1, PM2.5, and PM10 (by converting the particle number concentration in an air volume of 0.1 L) are small boxes with dimensions of 48 × 37 × 12 mm. This particle analyzer is not a fully autonomous measurement unit because it is powered externally (power supply 4.5–5.5 V DC, current demand 100 mA) and needs to be connected to a processing unit (Figure 1b). The fundamental technical parameters of PMS7003 analyzers are listed in Table 2. The sampling frequency is 1 s. The operating conditions stated by the manufacturer are in Ts from −10 °C to 60 °C and RH from 0% to 99% [26].
The OPC-N2 (Alphasense, United Kingdom (UK); Figure 1c) optical particle counters for measuring particle number concentration and mass concentrations of PM1, PM2.5, and PM10 (conversion to air volume 1.2 L) are small measuring units with dimensions of 75 × 60 × 65 mm. Similarly to the previous analyzers (PMS7003 from Plantower), even these units need to be powered externally (power supply 4.8–5.2 V DC, current demand 175 mA) and connected to a processing unit (Figure 1c). For technical specifications, see Table 2 again. The sampling interval is optional, from 1 to 10 s. The operating conditions are stated in Ts from −20 °C to 50 °C and RH from 0% to 95% (under non-condensing conditions) [27].

2.2.3. Reference Monitors and Other Equivalent Methods

During the testing measurement, all the above-mentioned sensors were compared to the appropriate reference monitors (RMs) or to other equivalent analyzers (Fidas200 particle analyzer) currently used in the CHMI ambient air quality monitoring network. For monitoring gaseous pollutants, RMs from Teledyne API company (San Diego, CA, USA) were used: the SO2 analyzer T100 (UV fluorescence method with minimum measurement range 0–50 ppb, maximum range 0–20 ppm, and limit of detection 0.4 ppb), the NO2 analyzer T200 (chemiluminescence detection method with the same measurement ranges and limit of detection as the aforementioned T100), and the O3 analyzer T400 (UV absorption method with minimum range 0–100 ppb, maximum range 0–10 ppm, and limit of detection <0.4 ppb) [28].
For monitoring aerosol concentrations in fractions PM2.5 and PM10, reference monitors MP101M (Environment SA, Envea, FR) based on radiometry (beta ray absorption) were used (measurement range 0–10,000 µg/m3, limit of detection 0.5 µg/m3) [29]. Given the similarity of measurement technology, we have also used for sensor comparison the Fidas200 (Palas, Germany (DE)) optical particle counter for PM1, PM2.5, and PM10 (measuring particle number concentration of up to 64 size channels with a range of 1–20,000 particles/cm3 and mass concentrations with a range of 0–1500 µg/m3) [30]. The Fidas200 optical counter is equipped with an Intelligent Aerosol Drying System (IADS), which ensures water removal before particle measurement. During the last year, the Fidas200 was found to be a suitable equivalent monitor to an RM for the determination of PM mass concentrations in ambient air quality in the Czech Republic (according to successful tests of equivalence; published only within the CHMI [31]).

2.2.4. Data Analysis and Data Control

The measured data from all tested sensors were cleaned of any outages and negative values (treated as missing values; mentioned further as not available (NA)) before processing. However, to show the real sensor performance, all the other measured values (even the possible outliers) were left in the dataset for basic statistical processing in the first stage. The hourly averages of all measured concentrations were calculated from 10 min of data (gas pollutants in ppb or ppm, aerosol particles in µg/m3). In the event that more than 40% of the values were missing in any particular hour, the whole hourly average was considered to be NA.
Firstly, summary statistics of all measured values during the field-testing period were performed (mean values and standard deviations (SDs) of concentrations measured by sensor pairs and by RMs), including the intra-sensors correlation within pairs of similar sensor types. Given the non-normal distribution of most of the measured values (Figures S1–S4 in the Supplement 1), non-parametric Spearman’s rank correlation coefficients (rS) were used in this study (similarly as in Bauerová et al. [13] and Fishbain et al. [32]). Further summary statistics of different sensors’ performance were calculated, including the presence (indicating the sensors’ availability over time in percentage [32]), correlation with RMs and other equivalent monitors (rS), and measurement errors for indicating the differences between the sensor and RM measurements (calculated as mean bias error (MBE), mean absolute error (MAE) and root mean square error (RMSE); see e.g., Feenstra et al. [6]).
Finally, in the second stage, an identification of significant outliers (defined as higher than 3× max of the hourly average RM concentration reached during the testing period; [13,33]) was performed and their representation in the dataset was expressed in percentage. In the case of suitable sensors (with correlation coefficients rS resulting from comparison with RMs at least >0.50), the coefficients of determination (R2) were determined according to the best-fitting regression equation in comparison with the RM (not only linear relationships). In addition, the potential effect of ambient T or RH on the sensors’ measurement quality was assessed according to the values of rS and R2.

3. Results

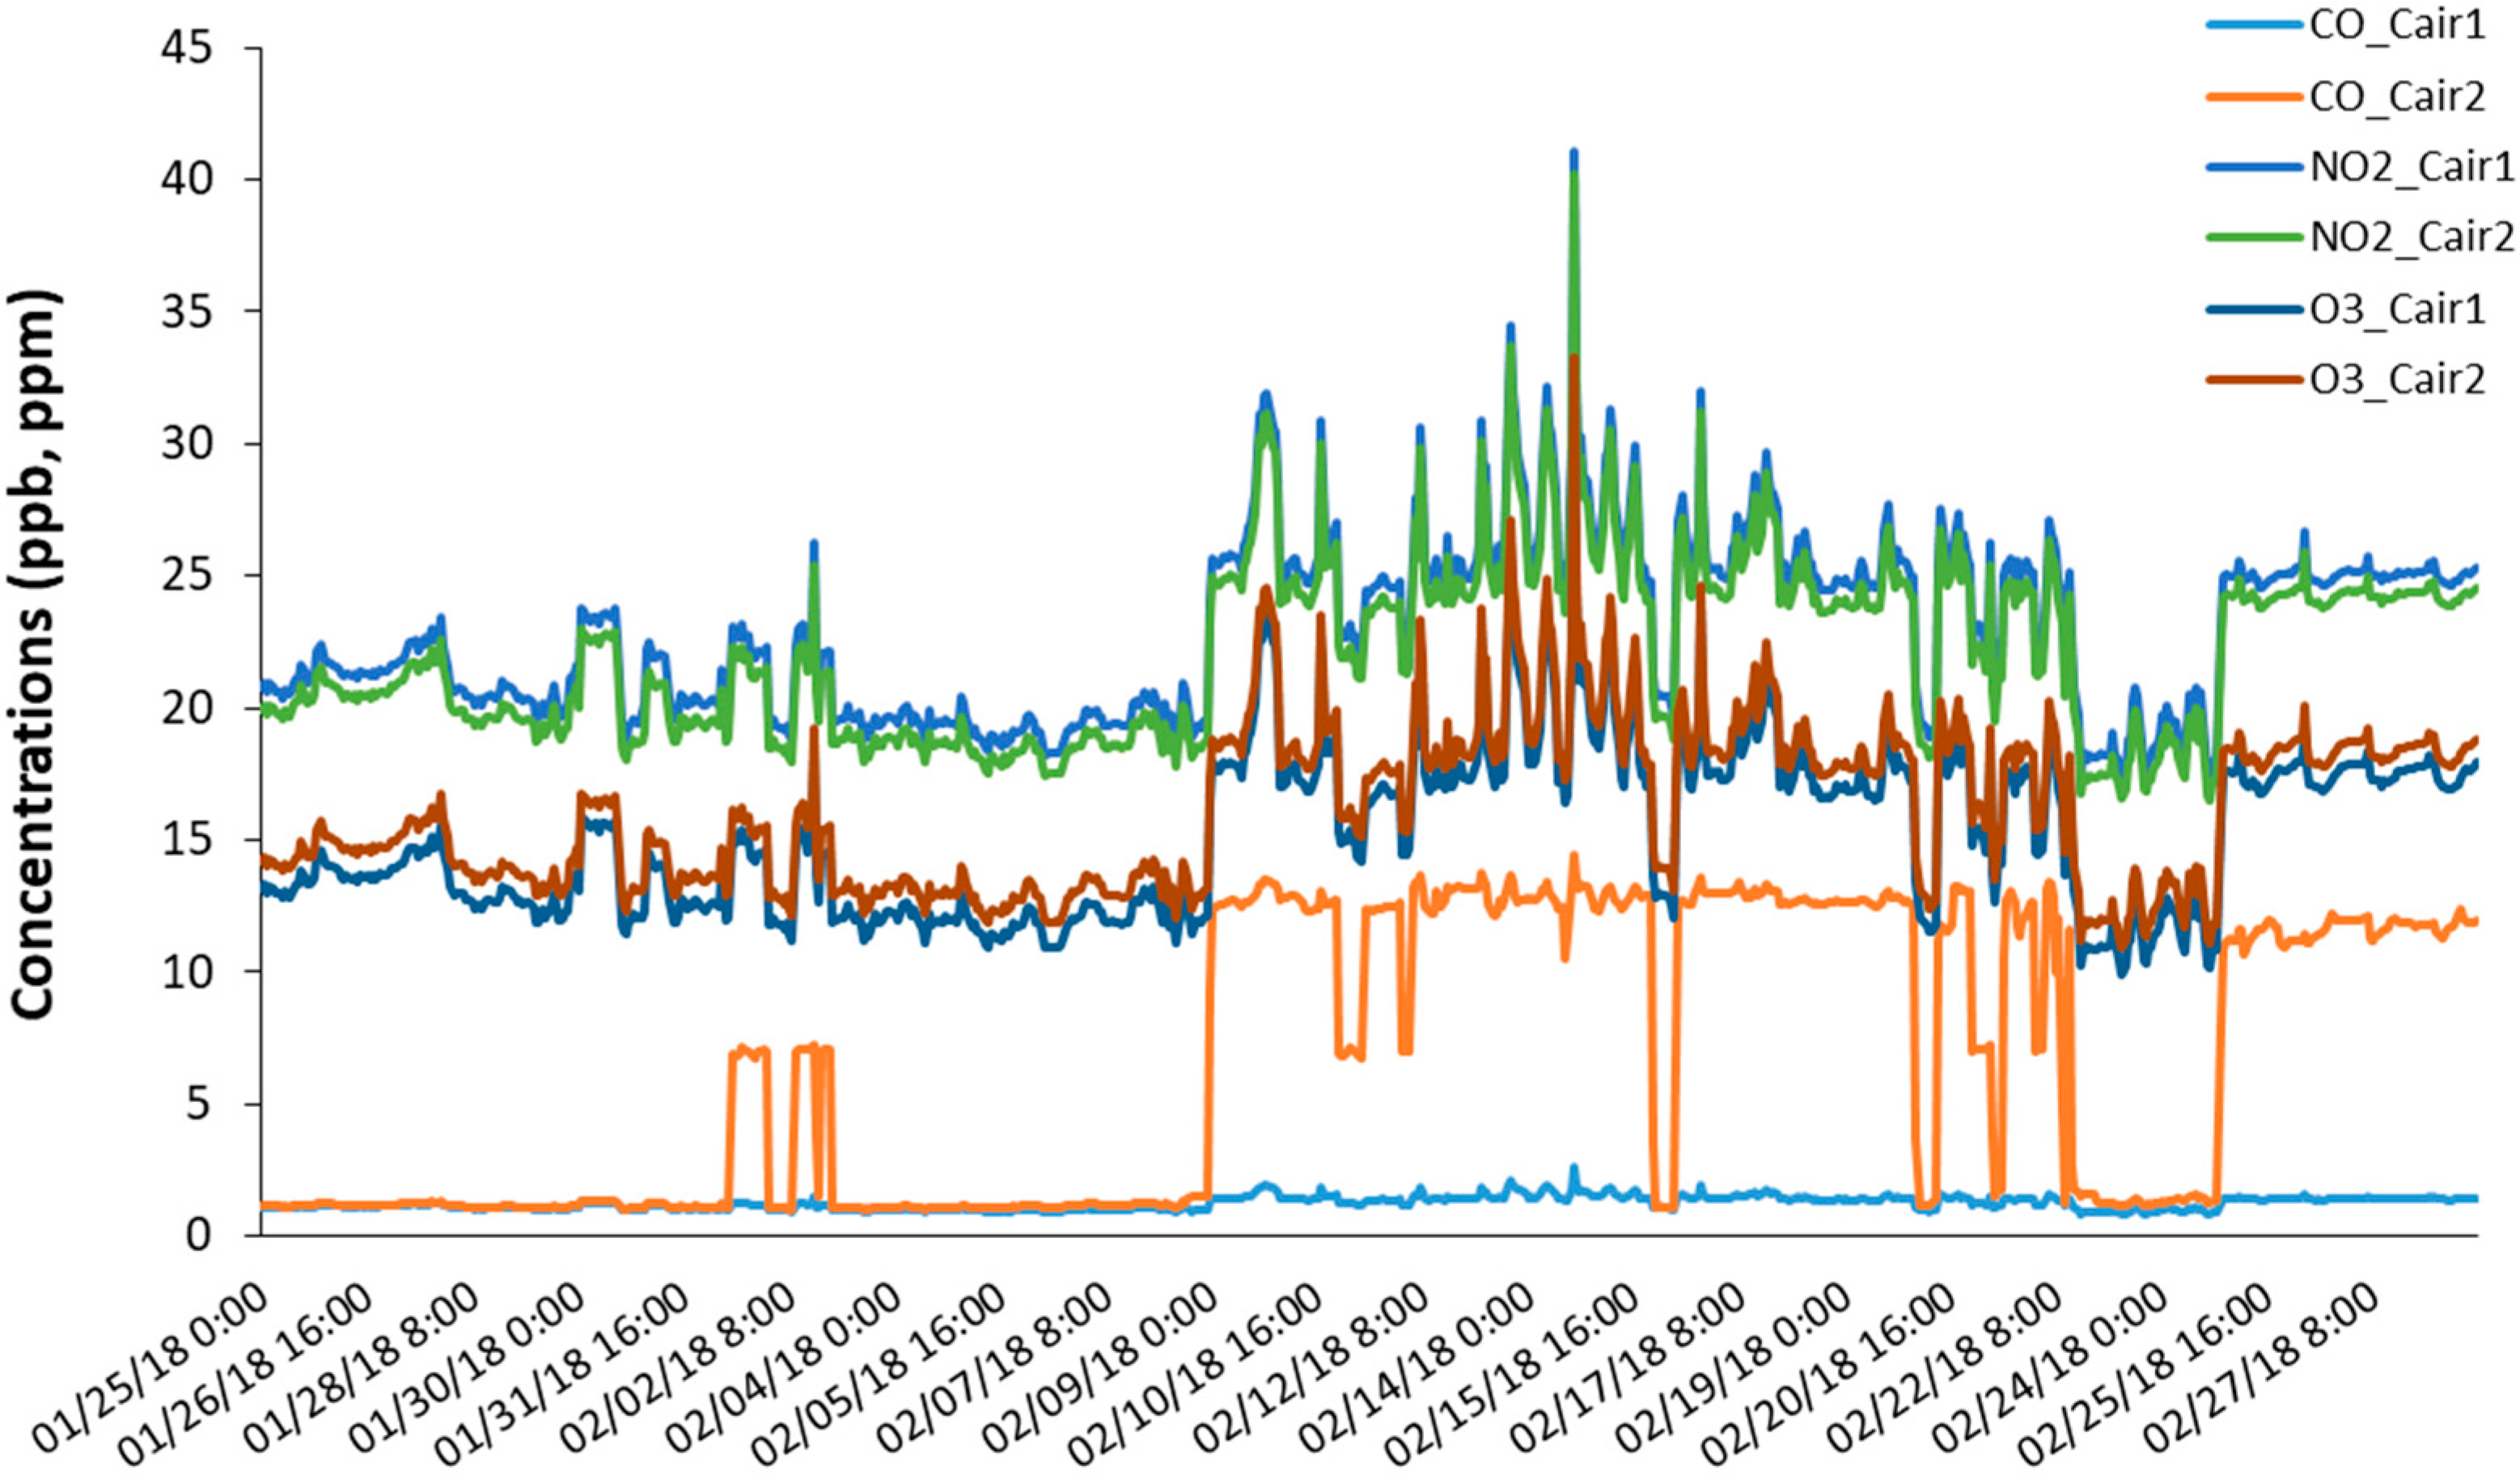
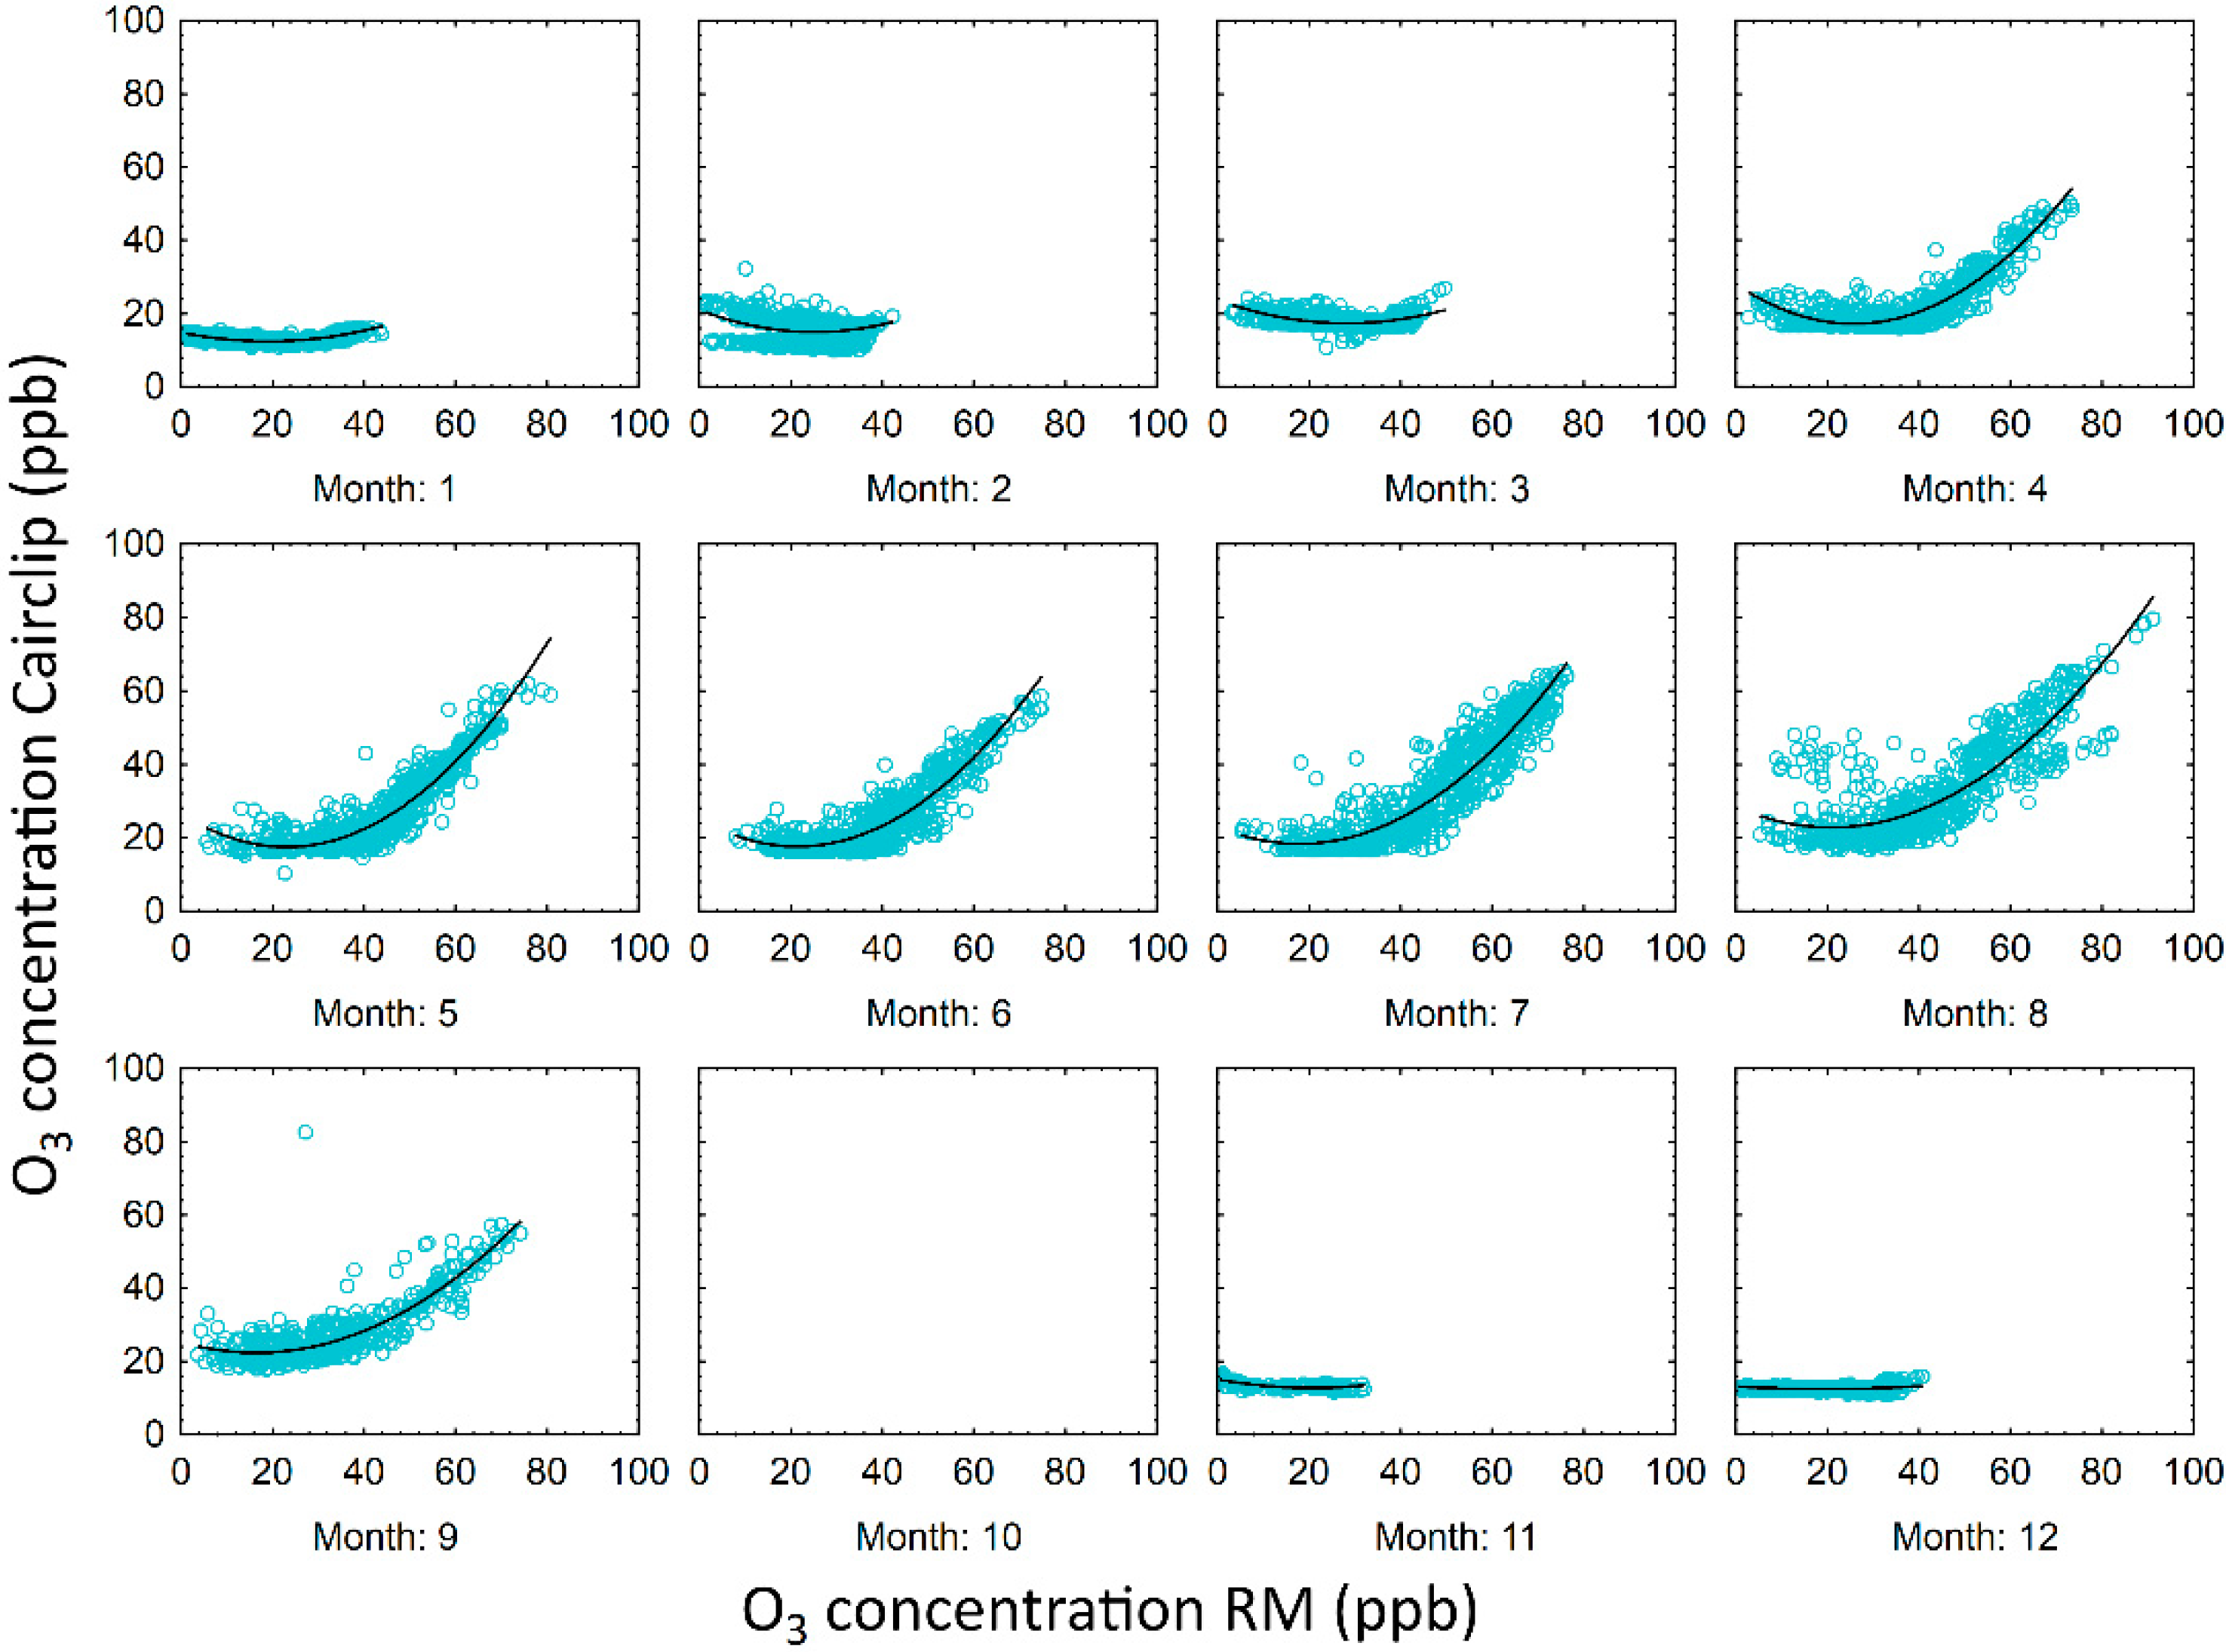
3.1. Cairpol Gas Sensors

The summary statistic of concentrations measured by different Cairclip gas sensors and by corresponding RMs is listed in Table 3 (except RM for CO, which is not available at the testing station). The results showed that despite the significant strong correlations (for all sensor types rS > 0.80) of the measured concentrations within the pairs of particular sensors (intra-sensors correlation), significant data drifts were also found within the pairs of SO2 and CO sensors (in the case of the SO2 sensors, a difference in mean concentration values of about 60 ppb from the beginning of the measurement, i.e., in 100% of the data; in the case of the CO sensors, a difference of about 10 ppm after three months of measurement, i.e., in 75.2% of the data; see Figure 2 or Figures S1 and S4 in Supplement 1). In the case of the NO2 and O3 sensors, such data drifts within the pairs did not appear during the entire testing measurement (only for a selected time period; see Figure 2). The percentage of valid data (hourly average concentrations of different gases) measured by Cairclip sensors in particular months of the testing period is shown in Table S1 in Supplement 1.
The comparison with the RMs showed very weak measurement quality in the case of the SO2 and NO2 sensors. There were high differences in the measured concentrations (Table 3, Figures S1 and S2 in Supplement 1), and the calculated measurement errors were very high (Table 4). In the case of the SO2 Cairclip sensors, no correlation with the RM was detected (rS around zero; Figure S5), in the case of the NO2 sensors the correlation with the RM was significant but negative (rS = −0.26 in both tested units; Table 4, Figure S6). The strongest correlations (rS = 0.68 for both units) and the lowest measurement errors occurred during the inter-comparison with the RM detected in the combined O3 Cairclip sensors (Table 4, Figures S3 and S7; compared with the concentrations measured by the O3 RM). The concentrations measured by these combined sensors were, however, also significantly positively inter-correlated with the concentrations measured by all other types of Cairclip gas sensors (SO2 sensors rS > 0.98, NO2 sensors rS = 1.00, CO sensors rS > 0.79; see Table S2 in Supplement 1 and Figure 2).
In all the Cairclip sensors, significant correlations of measured gas concentrations with the ambient air T (rS > 0.79) and RH (rS < −0.50) were found (Table S2 in Supplement 1). Even in the case of the best-performing combined O3 sensors, the measurement quality changed significantly during the testing period (see the differences between the cold period from November to March and the warm period from April to September in Figure 3). The better sensor performance was reached during the warmer months when the real O3 concentrations reached the values over 40 ppb (Figure S8). The presence of significant outliers (values > 3× max RM one hourly average concentration) was 51% and 10% in the case of SO2 Cairclip sensors (SO2_Cair1 and SO2_Cair2, respectively), and 0.01% in the case of NO2 Cairclip sensors (both units). In combined O3 Cairclip sensors, no significant outliers were detected during the testing period.

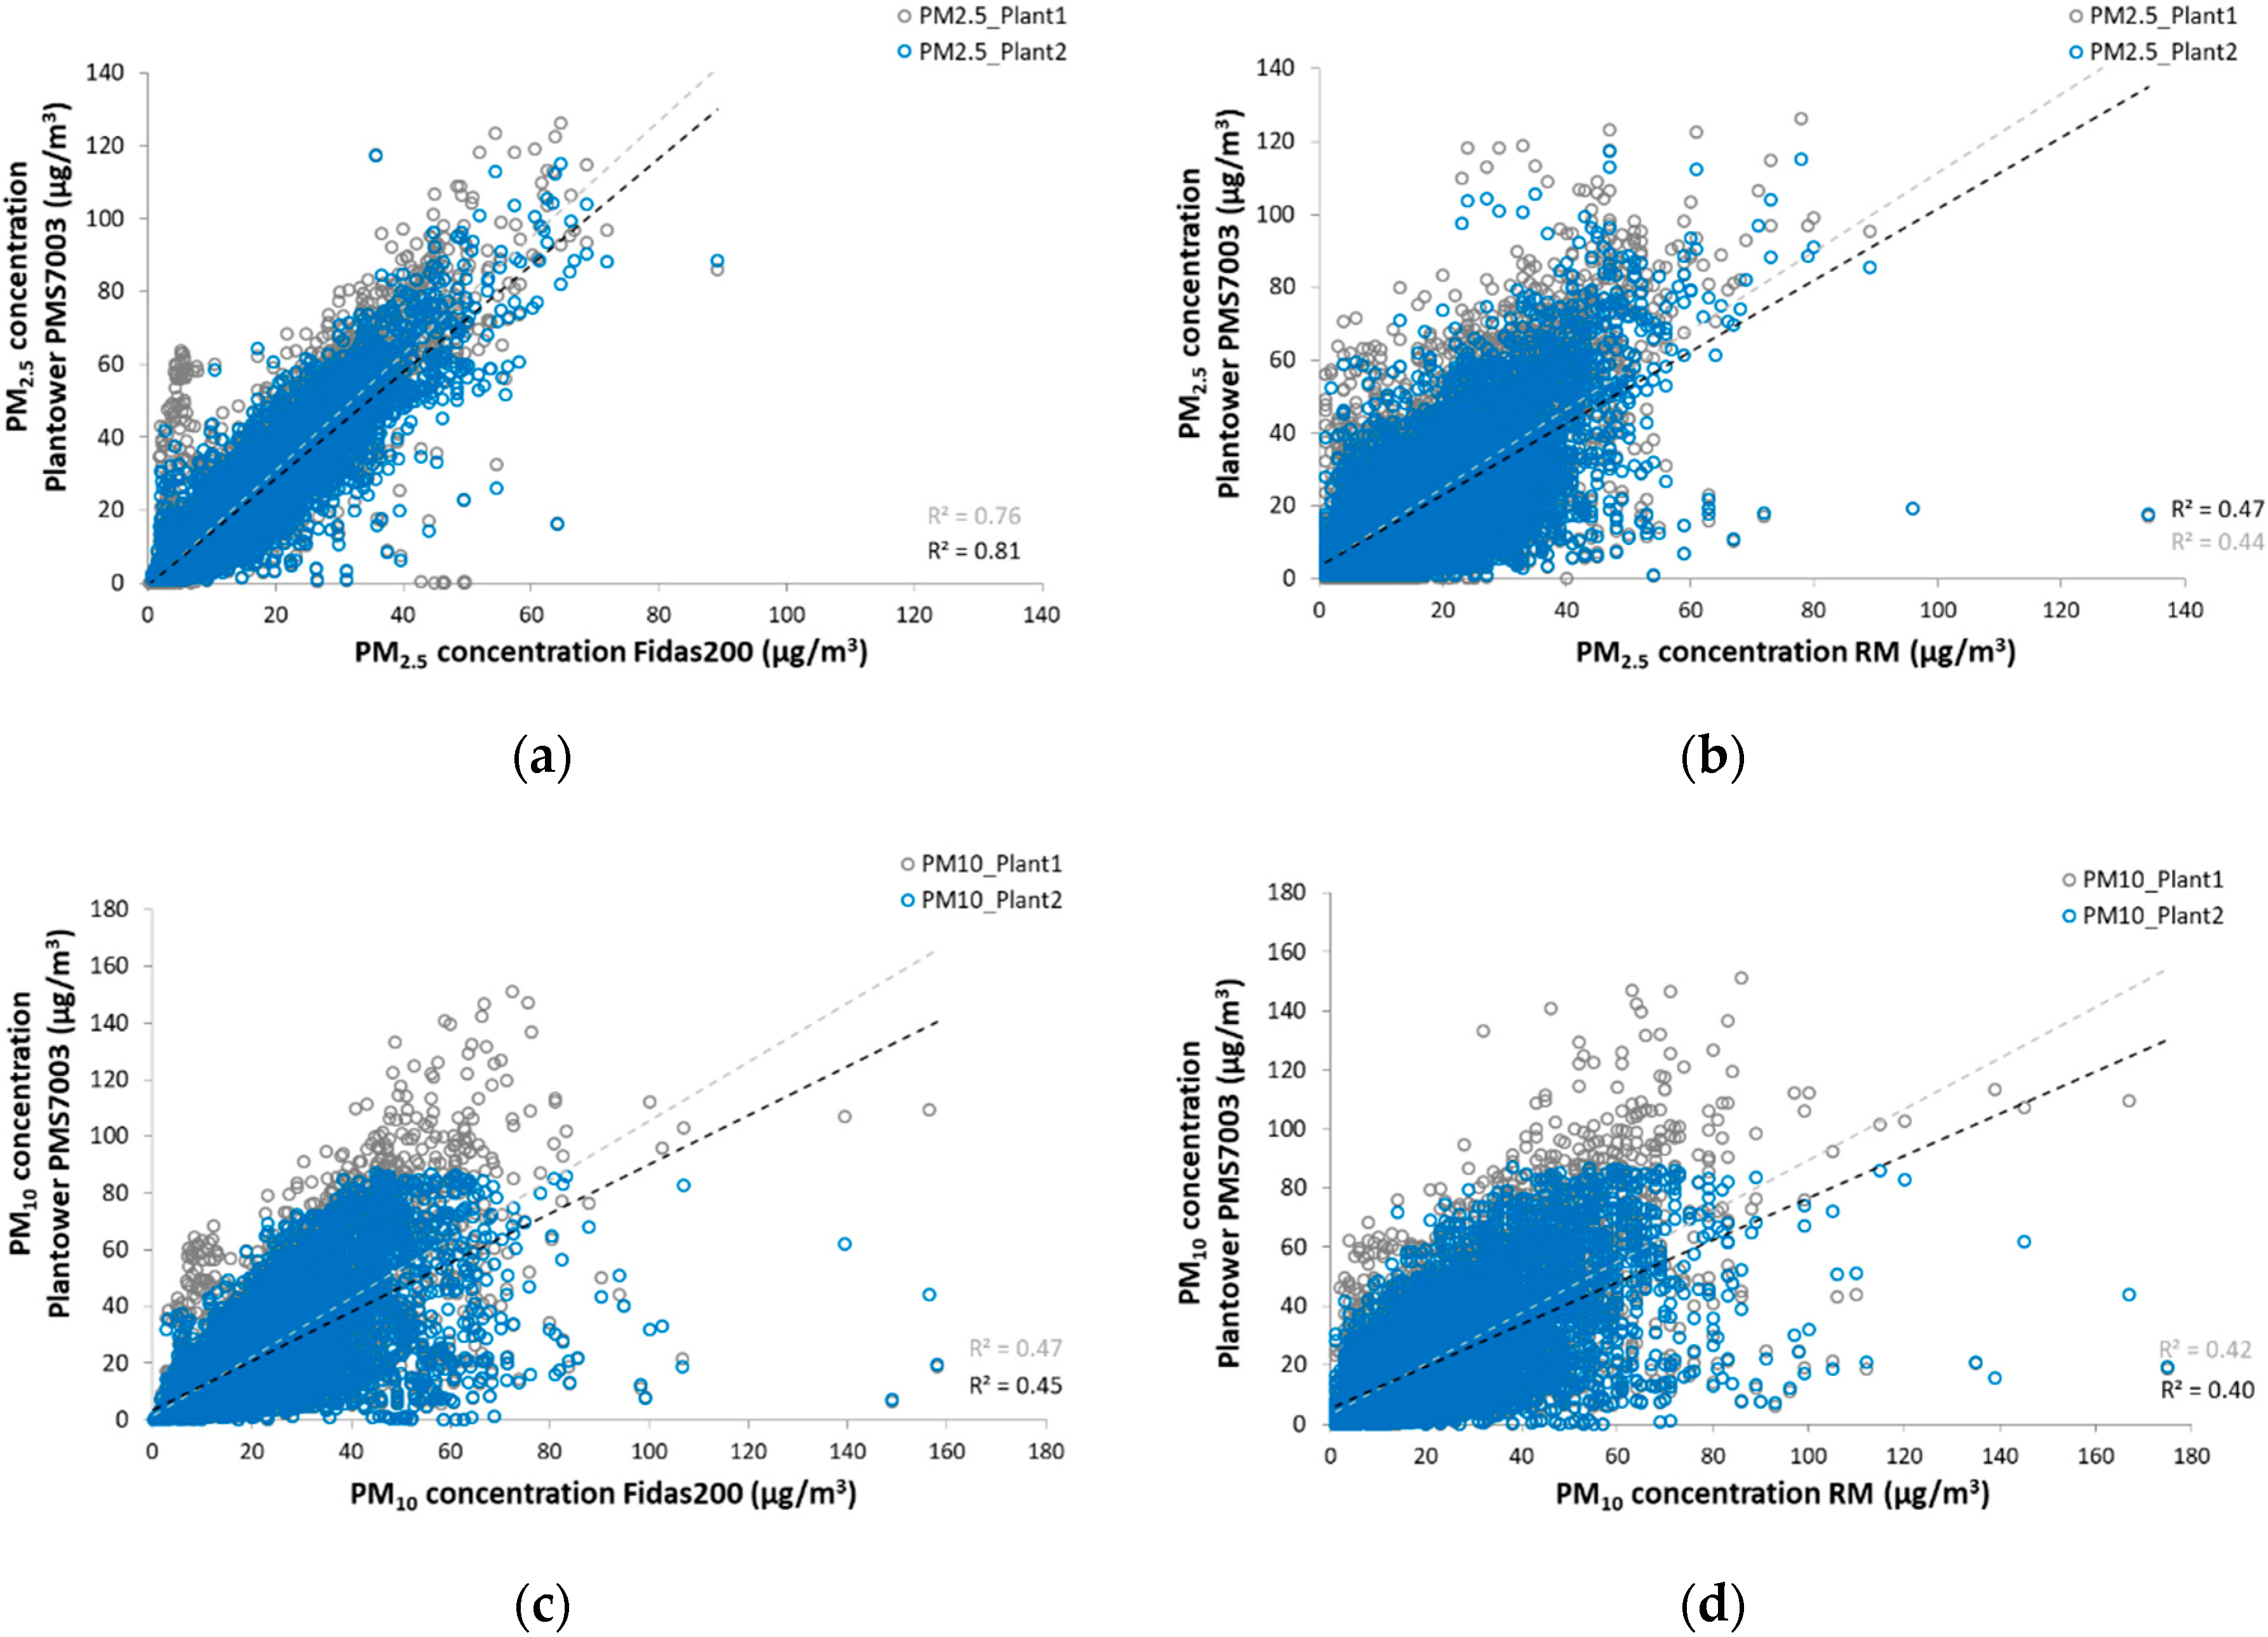
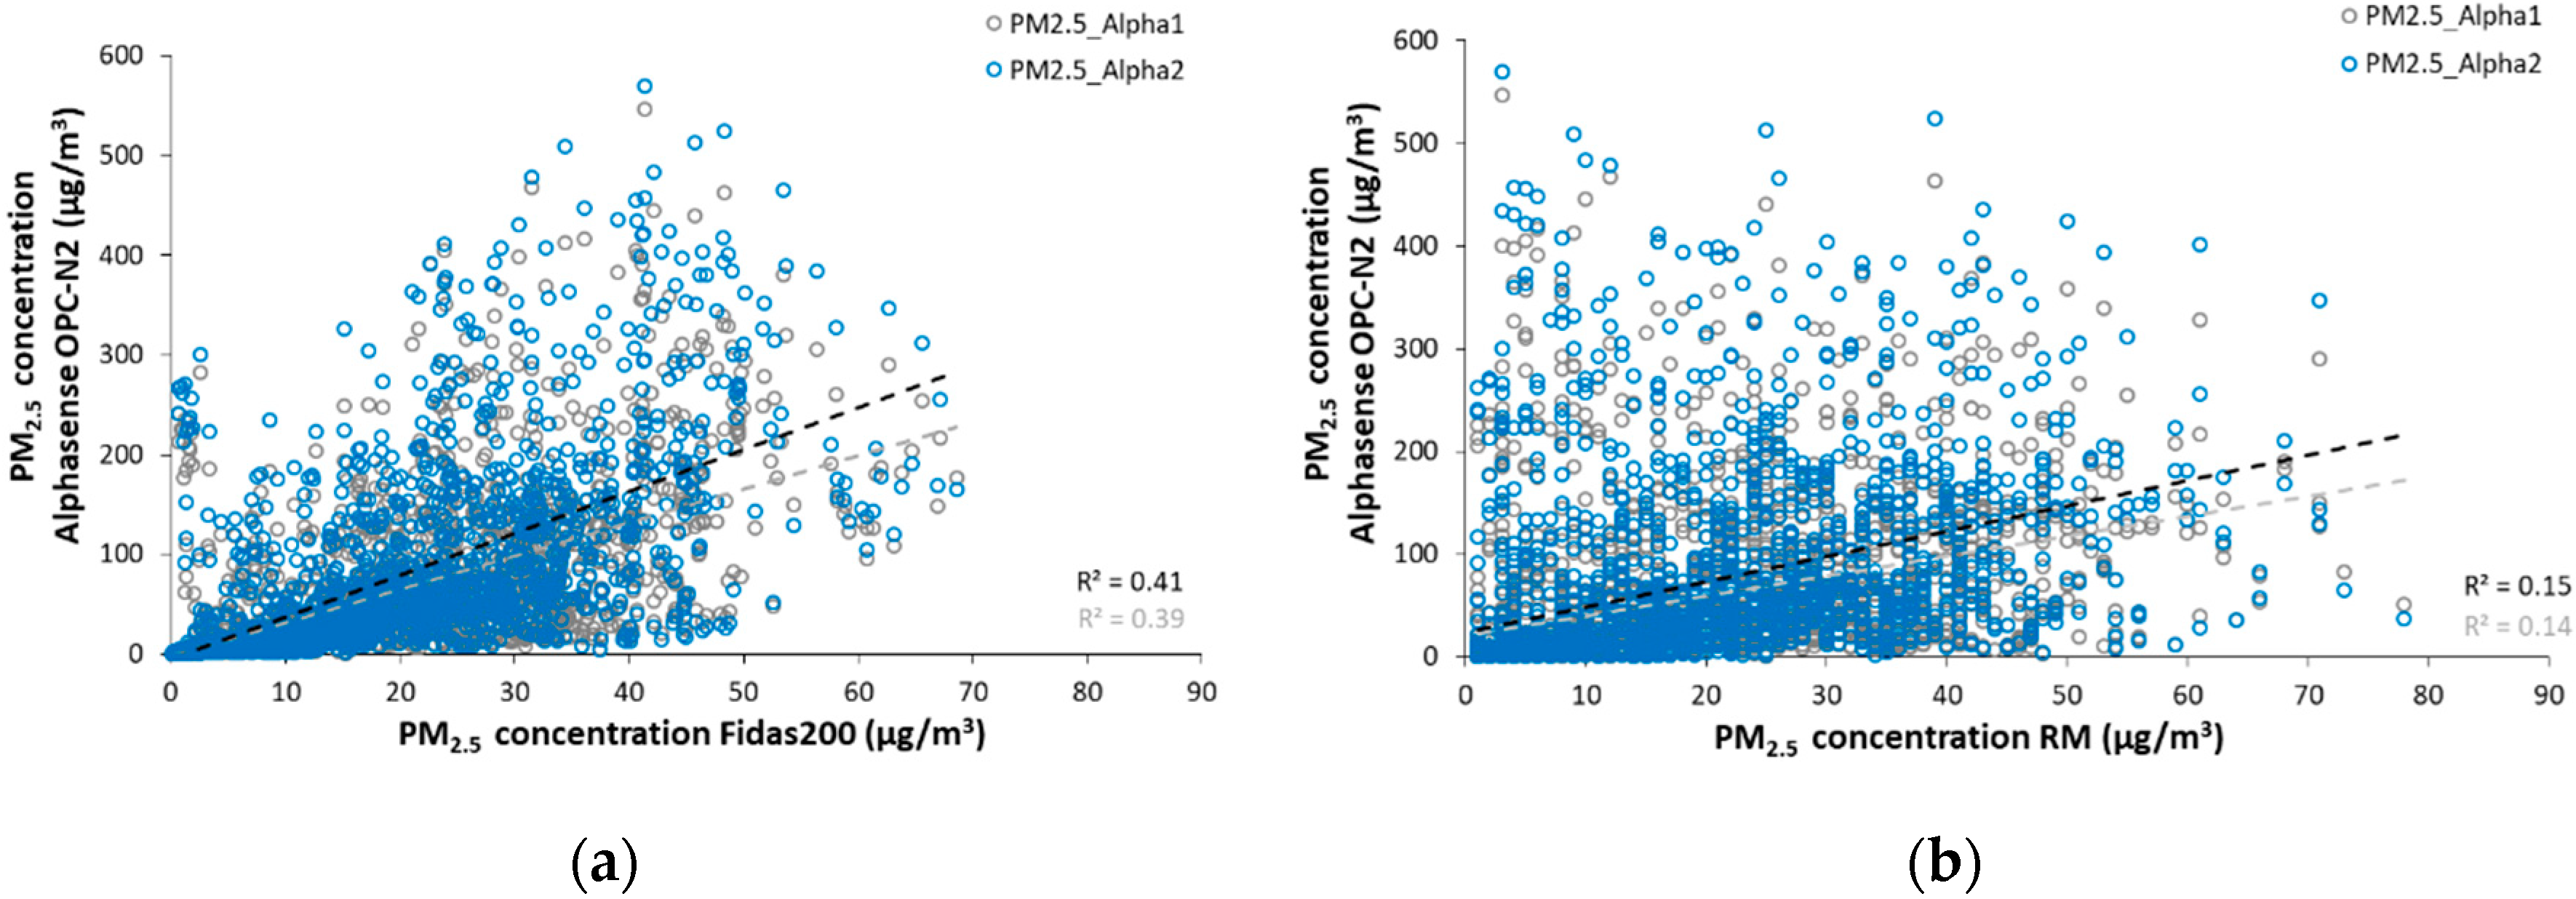
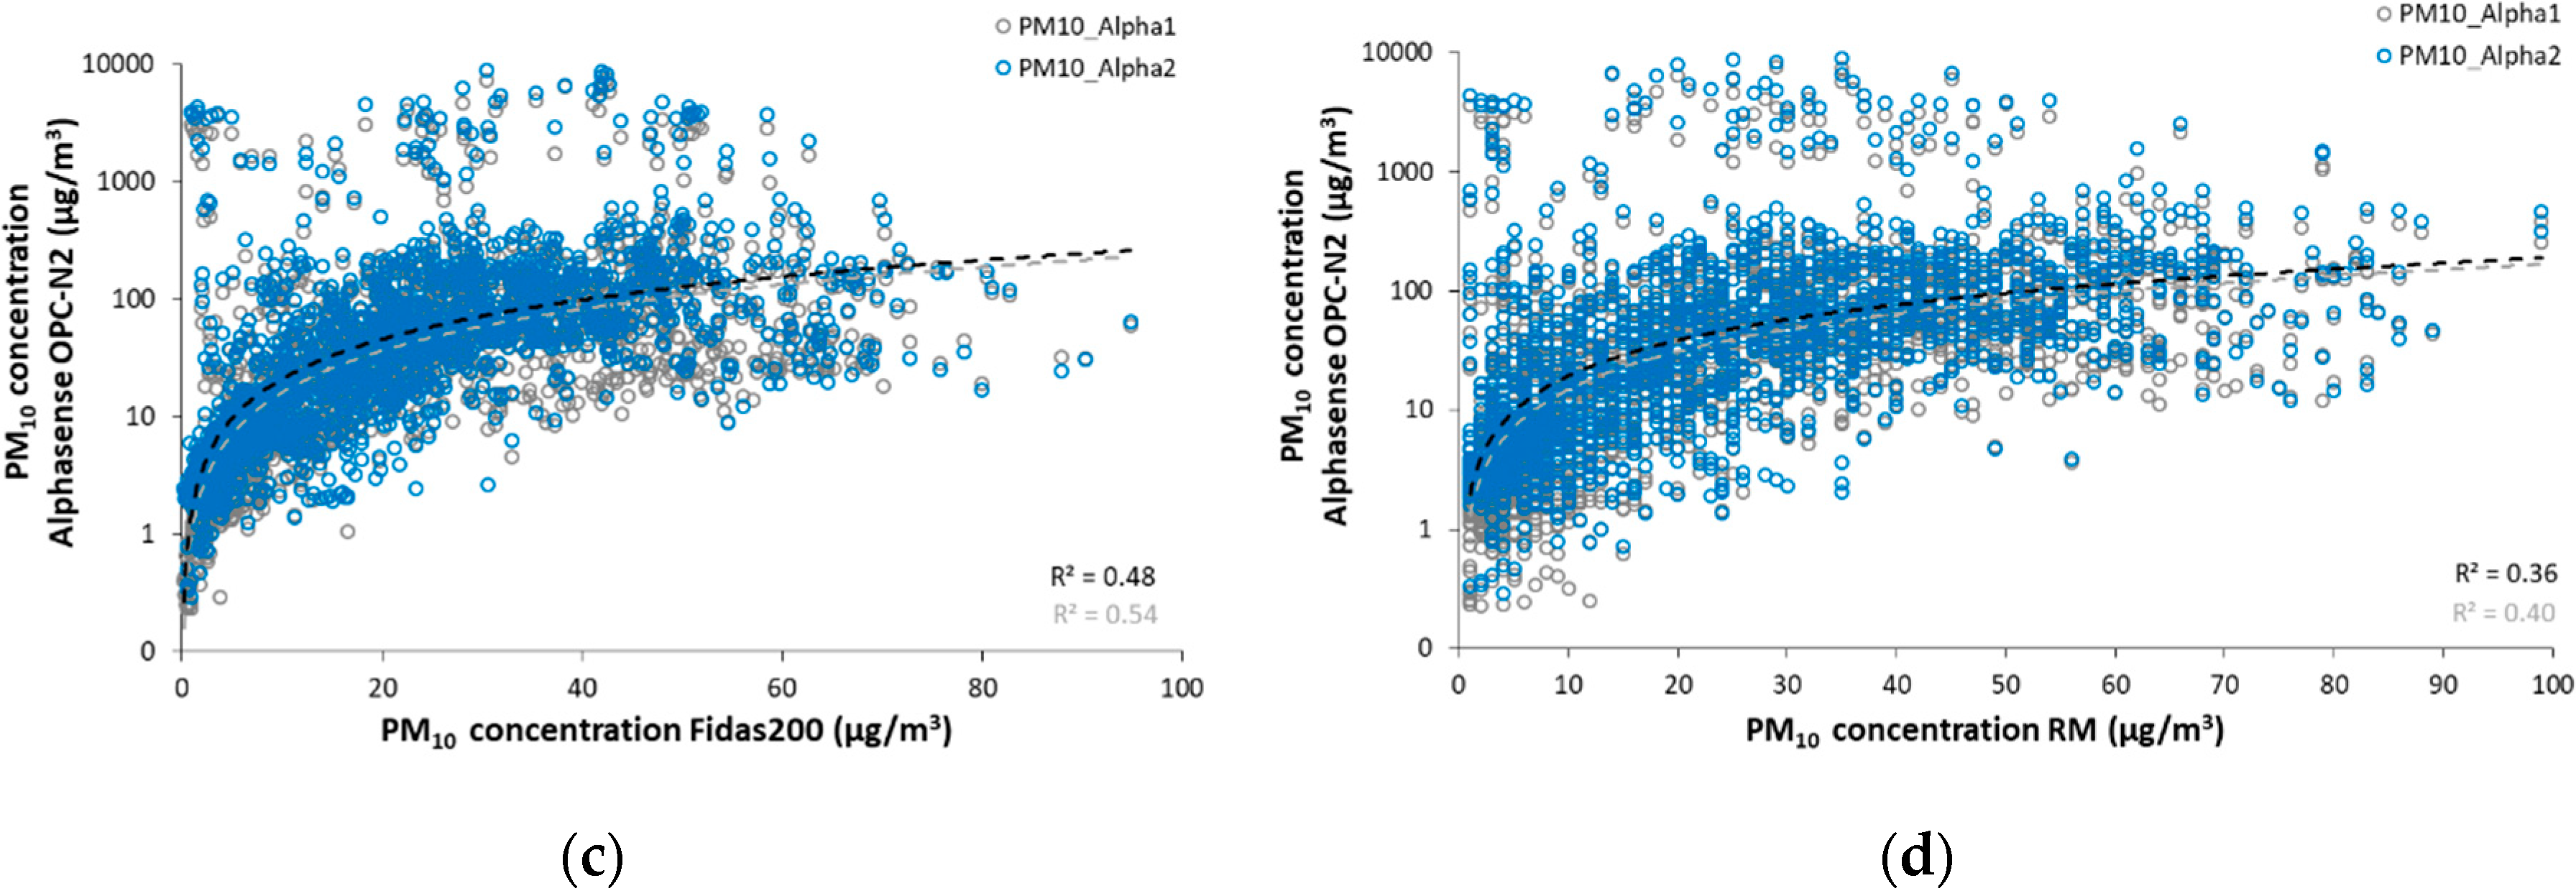
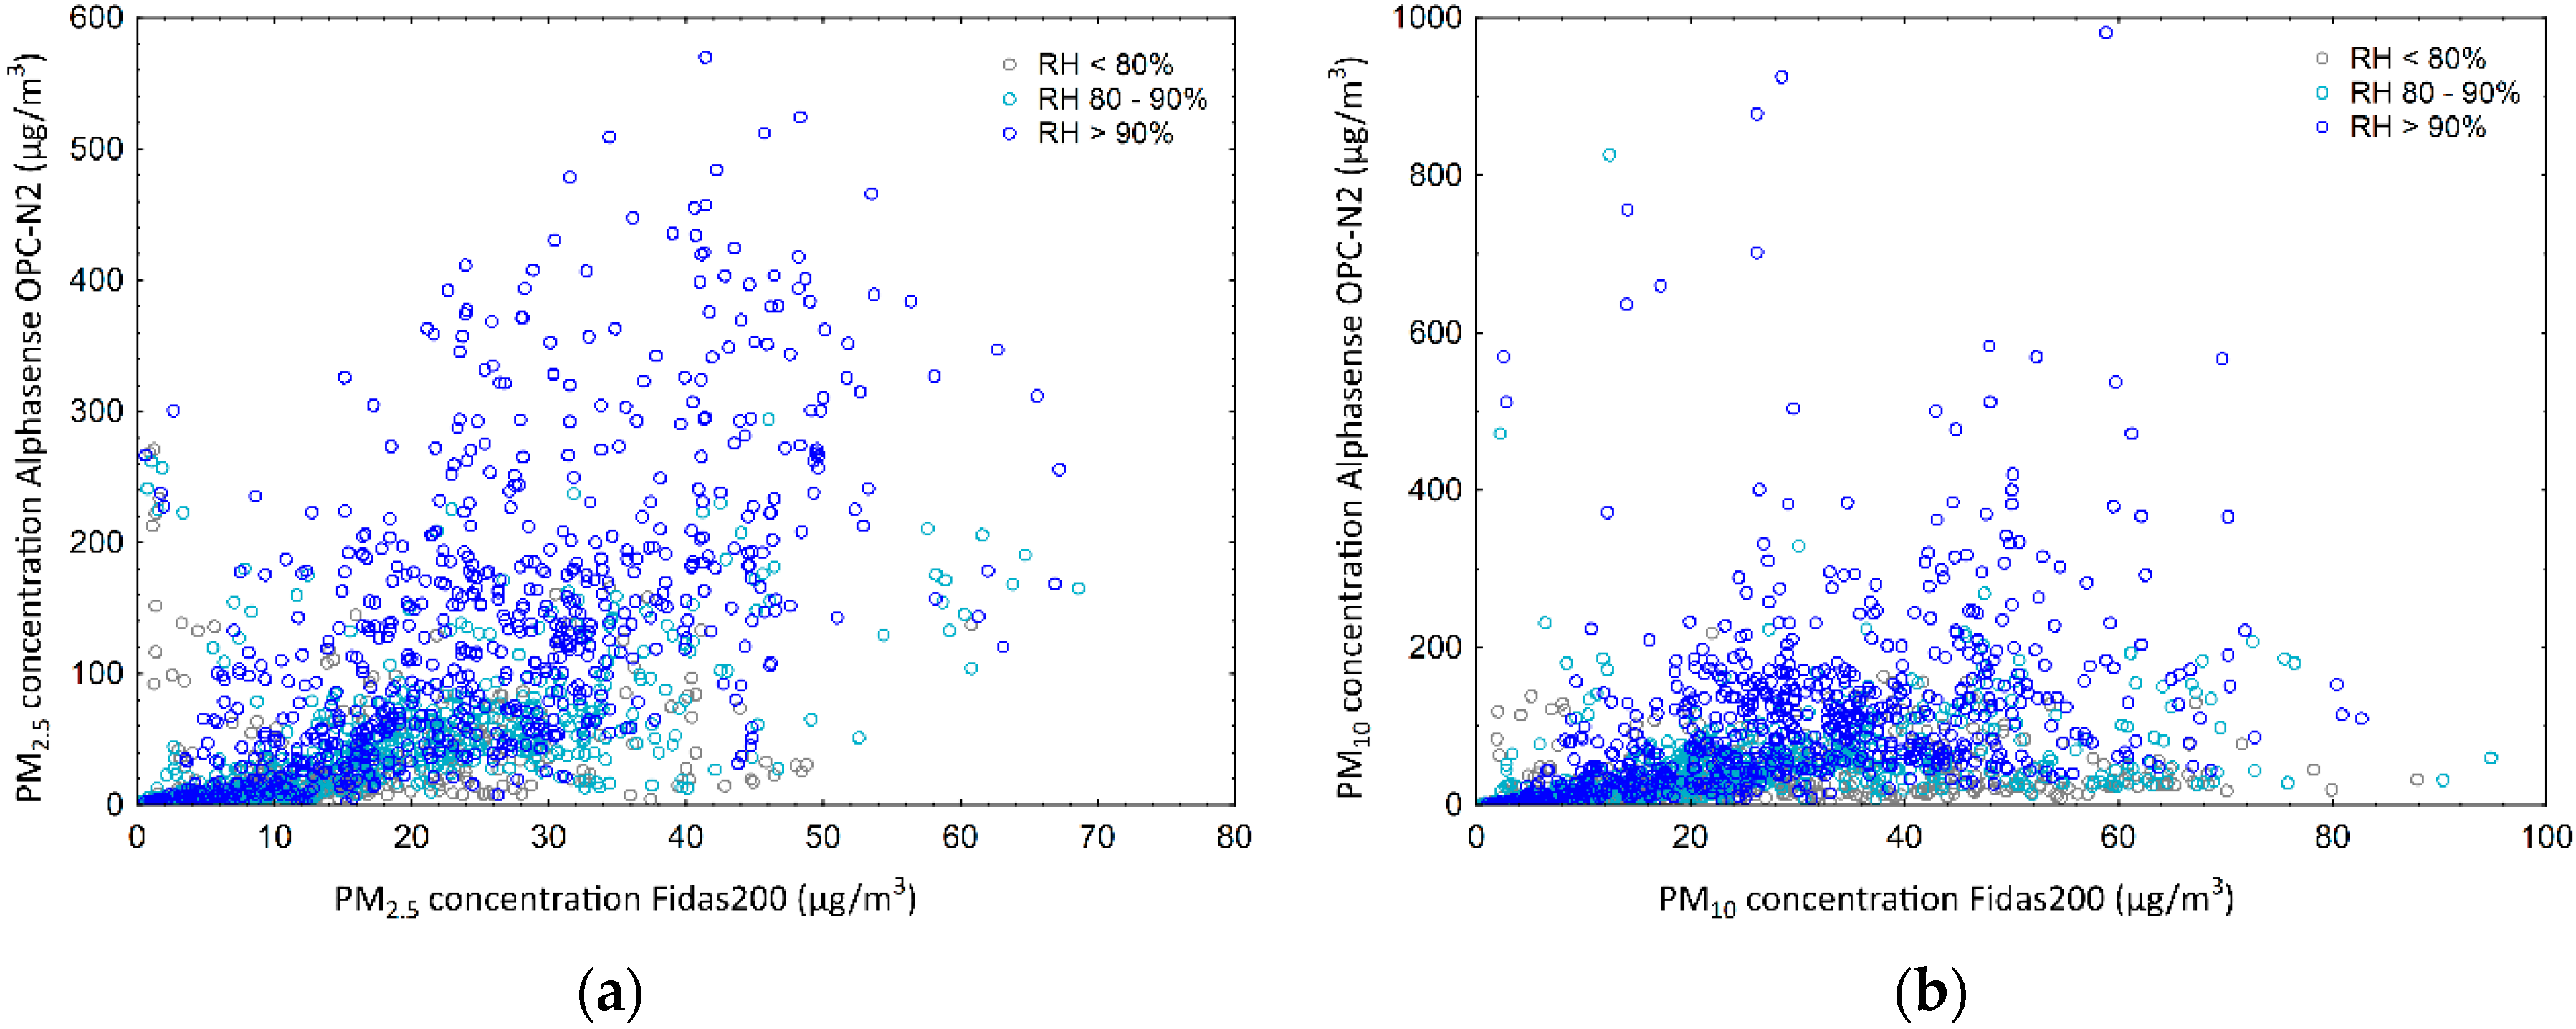
3.2. Plantower and Alphasense Particle Counters

The summary statistic of PM1, PM2.5, and PM10 mass concentrations measured by two tested types of particle counters—PMS7003 Plantower and OPC-N2 Alphasense—and by RMs or a Fidas200 monitor is listed in Table 5 (in the case of an RM, no PM1 mass concentrations are available). The intra-sensors comparison within pairs showed highly significant correlations in the measured PM concentrations in both the Plantower and Alphasense sensors (both types rS > 0.95 in all PM fractions; see Table 5). In both sensor types, no significant data drifts were found within the sensor pairs, although the OPC-N2 sensors had a tendency to differ in mean and standard deviation (SD) concentration values (especially in the case of PM2.5 and PM10 fractions, which had a higher occurrence of outlying values; see Table 5). The percentage of valid data (hourly average PM concentrations) measured by Plantower and Alphasense particle counters in particular months of the testing period is shown in Tables S3 and S4, respectively, in Supplement 1.
The comparison with the RMs and equivalent Fidas200 showed a very good measurement quality of the PMS7003 Plantower particle counters. The means and SDs of all measured PM fraction concentrations corresponded very well with both control monitors, and no significant outliers appeared (Table 5, Figures S9–S11 in Supplement 1). This also resulted in a significant positive correlation of the measured data (with optical Fidas200 rS > 0.70 for all fractions measured within a sensor pair, with radiometric RM rS > 0.62 for PM2.5 and PM10 fractions; Table 6, Figure 4 and Figure S12), and low measurement error of these sensing units (Table 6).
In the case of the OPC-N2 Alphasense particle counters, the measurement quality was considerably weaker in comparison with the Fidas200 or RM. The mean values and SDs of the concentrations measured by the sensors and by the control monitors differed significantly in all PM fractions (Table 5, Figures S13–S15). Despite a strong positive correlation with both control monitors (with Fidas200 rS > 0.75 for all fractions, with RM rS > 0.63 for PM2.5 and PM10; Table 6, Figure 5, and Figure S16 in Supplement 1), the high values of the measurement errors showed the presence of extreme outliers in all PM fractions analyzed by OPC-N2 sensors (Table 6; the maximum PM1 concentration measured by the OPC-N2 was 256.6 µg/m3, the maximum PM2.5 concentration was 569.8 µg/m3, and the maximum PM10 concentration was 9036.7 µg/m3).
In both tested particle counter types, the concentrations of all measured fractions correlated weakly negatively (yet statistically significantly) with ambient T (Plantower sensors rS < −0.24, Alphasense sensors rS < −0.16) and significantly positively with RH (Plantower sensors rS >0.46, Alphasense sensors rS > 0.57; see Tables S5 and S6 in Supplement 1). In the case of the PMS7003 particle counters, there were no extreme outliers in the measured concentrations detected in relation to the effect of changing T and RH. Conversely, in the OPC-N2 particle counters, 5.4% of the PM2.5 data and 6.2% of the PM10 data were determined as extreme outliers (>3× max RM one hourly average concentration); most of them were detected at the time with high ambient RH (RH > 90%; see Figure 6).

4. Discussion

Small sensors can undoubtedly serve as an affordable and easy-to-use complementary solution for further development of the ambient air quality monitoring network. Nevertheless, due to the limits of this miniaturized technology, special attention should be given to the selection of suitable sensor types during the planning of specific intent and to the subsequent data control and verification before and continuously during each application. This study was performed to show the individual measurement quality of different gas sensors and particle counters and the possible changes during long-lasting outdoor measurement while compared to corresponding reference monitors.

4.1. Cairpol Gas Sensors

The results of the Cairpol Cairclip gas sensors showed a highly unsatisfactory performance of the SO2, NO2, and CO sensor units. The measured SO2 and CO concentrations drifted significantly within pairs of identical sensor types. Such data drifts arising in electrochemical gas sensors can be caused by several reasons [34]; one which is often discussed is the aging of the sensor unit [35,36,37]. In our case, the data drift of SO2 concentrations was observed in the first sensor (SO2_Cair1) right from the beginning of the testing measurement (see Figure S1 in Supplement 1). Therefore, we assumed the presence of a defective or poorly calibrated unit (from the manufacturer). Conversely, in the case of CO, the data drift appeared in the second sensor unit (CO_Cair2) after three months of measurements. Given that it occurred exactly at the same time that there was also a certain increase in other concentrations measured by the NO2 and O3 sensors (Figure 2), an erroneous measurement caused by sudden interference with other gases cannot be ruled out. Furthermore, the comparison of the Cairpol gas sensors with the corresponding RMs showed very weak measurement quality in the case of the SO2 and NO2 Cairclip sensors (no relationship and a significantly negative relationship with RM concentrations; respectively). Although we have found no other study describing the field performance of SO2 Cairclip sensors (except our previous study [13]), the weak results in SO2 measurement were also recorded in other sensors from different manufacturers [9,22]. In the case of the NO2 Cairclip sensors, some comparative field studies are available, but the information about measurement quality varies widely [7,18,22]. Our results showed that, in both cases, the concentrations measured by the Cairclip sensors were inappropriately overestimated against the real SO2 and NO2 concentrations, and, therefore, these sensor units were again evaluated as non-compliant and probably defective.
The best performance was observed in the combined O3 Cairclip sensors, where both the intra-sensors comparison in pairs and the comparison with the RM achieved very satisfactory results (similarly as in Jiao et al. [22]). However, it should be pointed out here that the quality of the O3 sensor measurement changed significantly during the year, when in the warmer months (from April to September) the sensors’ performance was significantly better (R2 up to 0.79), than in the colder months (where almost no relationship with the RM was observed, R2 < 0.34 [13]; Figure 3). This can be explained by the lowered reactivity of this sensor on low ambient O3 concentrations (during the colder months) and on the other hand better reactivity during the warmer months, when the O3 concentrations are naturally higher. With respect to the improvement of the mutual relationship between the sensor and RM O3 measurement under the real concentrations over 40 ppb (see Figure S8 in Supplement 1), we assume that the effective limit of detection of the combined O3 Cairclip sensor may be actually at least a half more than the value of 20 ppb stated by the manufacturer. At the same time, given the strong correlation of the combined O3 sensors with all the other Cairpol sensors (Figure 2), we cannot rule out even a certain effect of interference with other gases. Continuous data control and post-measurement data validation (by the application of some correction indices [7,9,13,14]) should, therefore, always be considered here.
It should also be mentioned that, during our long-term field testing, we reached the maximum lifetime of electrochemical Cairclip sensors after 11 months of continuous measurement. After this period, all gas concentrations measured by all sensor units drifted significantly to unreal stable values and, therefore, the sensors were dismounted. To our knowledge, there is no other study for the comparison of the operational lifetime duration of these sensors.

4.2. Plantower and Alphasense Particle Counters

Similarly to some other studies focused on field comparative measurement of Plantower and Alphasense miniature particle counters [14,16,38], we found very good results in the intra-sensors comparison of measured concentrations within pairs of identical sensor types. In both cases, no significant data drifts appeared during the testing period, although for the Alphasense OPC-N2 particle counters, a higher variability in PM concentrations measured within the sensor pair was recorded (especially in maximum concentrations; see also Feenstra et al. [6] or Bulot et al. [16]). The comparison with the RMs and Fidas200 monitor showed very satisfactory results in the case of the Plantower PMS7003 sensors (see also the course of hourly concentrations in Figure S17 in Supplement 1). In all PM fractions, the concentrations measured by the Plantower sensors were systematically lightly overestimated against the concentrations measured by both control monitors (similarly as in the studies by Zheng et al. [38] and Bulot et al. [16]). Naturally, better performance was found when compared to the optical Fidas200 monitor (given the similarity of the measuring method), than to radiometric RMs. Unlike with the Alphasense, we did not detect any extreme outliers for Plantower sensors during the entire testing period (lasting 10 months). With regard to the very good performance of the Plantower sensors, we assume that the manufacturer may have applied a very effective correction algorithm in the sensor processing unit.
In the case of the Alphasense OPC-N2 sensors we found, similarly to Crilley et al. [14] and Feinberg et al. [18], data artifacts (outliers in the form of extremely high concentrations) in all of the aerosol fractions (PM1, PM2.5, and PM10) under high ambient relative humidity conditions (RH > 80%; Figure 6). The most noticeable effect of high air humidity on measurement error occasion was seen in the case of PM10 fraction, where the maximum hourly average concentrations even reached above 9000 µg/m3. We assume that such extreme measurement errors were caused by the high particle hygroscopicity under the condensation conditions (increased particle water content), which resulted in wrong particle size detection and its mass concentration [14]. Overall, the OPC-N2 counters tended to significantly overestimate the real PM concentrations (Figure S17 in Supplement 1), which is reflected by weaker and not always linear relationships with the control monitors (Figure 5; similarly as in other studies [6,14,18]). Therefore, we join in the recommendation for continuous data control and post-measurement data validation while using Alphasense particle counters for ambient air monitoring [14].
The maximum limit was not reached in any of the tested particle counters before completion of the comparative measurement (Plantower sensors tested within a 10-month period, Alphasense sensors tested only for five months).

5. Conclusions

Four miniaturized Cairpol gas sensors and two different miniaturized particle counters (Plantower and Alphasense) were tested in duplicates against collocated reference and other control monitors in a long-lasting comparative measurement at the Tušimice Observatory. The SO2, NO2, and CO Cairclip sensors were identified as inappropriate due to their weak measurement quality or data inconsistency within sensor pairs. The combined O3 Cairpol sensor achieved satisfactory results, but interference with meteorological conditions and other gases definitely needs to be considered during data processing and interpretation. Among the particle counters, the Plantower PMS7003 definitely showed a higher measurement quality than the Alphasense OPC-N2 counters, which were more likely to be affected by high relative humidity and had a higher occurrence of measurement outliers.
We believe that this paper can help to clarify the real (outdoor) sensor performance and possible tendency to change the measurement quality over time. The results of this study show that long-term comparison studies are of great importance and should be further supported and developed by scientists. They can serve the general public, as an important material for decision making when purchasing suitable sensor types and for the suppression of common mistakes during their application, or the manufacturers, for identifying main issues and for further product development. Finally, we still believe that comparative measurements with RMs have to be necessarily implemented at least before each field application (ideally also during the measurement at given intervals), because it is the only way to detect possible sensor failures or systematic and random measurement deviations of sensors.

Supplementary Materials

The following are available online at https://www.mdpi.com/2073-4433/11/5/492/s1. Electronic Supplementary Material 1 (Supplement 1) contains all supplementary tables and figures (10 pages, 6 tables, 17 figures). Supplementary material 2 (Supplement 2) is containing the complete dataset used for preparation of this article.

Author Contributions

Technical concept and measurement preparation, Z.N., J.K., Š.R. and P.B.; Software for data collection, Z.N.; Data control and processing, P.B., A.Š.; writing—original draft preparation, P.B.; writing—review and editing, J.K., A.Š., Š.R.; supervision, J.K.; All authors have read and agreed to the published version of the manuscript.

Funding

This research received no external funding.

Acknowledgments

We are grateful to the leadership of the CHMI and Envitech Bohemia for enabling the realization of this study, to all the technicians who participated in commissioning the tested instruments, to Erin Naillon for proofreading the manuscript, and to four anonymous reviewers for their comments to earlier version of the manuscript.

Conflicts of Interest

The authors declare no conflicts of interest.

References

  1. Kumar, P.; Morawska, L.; Martani, C.; Biskos, G.; Neophytou, M.; Di Sabatino, S.; Bell, M.; Norford, L.; Britter, R. The rise of low-cost sensing for managing air pollution in cities. Environ. Int. 2015, 75, 199–205. [Google Scholar] [CrossRef] [Green Version]
  2. McKercher, G.R.; Salmond, J.A.; Vanos, J.K. Characteristics and applications of small, portable gaseous air pollution monitors. Environ. Pollut. 2017, 223, 102–110. [Google Scholar] [CrossRef] [Green Version]
  3. Languille, B.; Gros, V.; Bonnaire, N.; Pommier, C.; Honoré, C.; Debert, C.; Gauvin, L.; Srairi, S.; Annesi-Maesano, I.; Chaix, B.; et al. A methodology for the characterization of portable sensors for air quality measure with the goal of deployment in citizen science. Sci. Total Environ. 2020, 708, 134698. [Google Scholar] [CrossRef]
  4. Collier-Oxandale, A.; Feenstra, B.; Papapostolou, V.; Zhang, H.; Kuang, M.; Boghossian, B.D.; Polidori, A. Field and laboratory performance evaluations of 28 gas-phase air quality sensors by the AQ-SPEC program. Atmos. Environ. 2020, 220, 117092. [Google Scholar] [CrossRef]
  5. Gerboles, M. European Committee for Standardization: CEN/TC 264/WG 42—Ambient Air—Air Quality Sensors. Available online: https://standards.cen.eu/dyn/www/f?p=204:22:0::::FSP_ORG_ID,FSP_LANG_ID:2012773,25&cs=13EA71B95E446E4F77D5EEB632F4BF317 (accessed on 5 May 2020).
  6. Feenstra, B.; Papapostolou, V.; Hasheminassab, S.; Zhang, H.; Der Boghossian, B.; Cocker, D.; Polidori, A. Performance evaluation of twelve low-cost PM2.5 sensors at an ambient air monitoring site. Atmos. Environ. 2019, 216, 116946. [Google Scholar] [CrossRef]
  7. Spinelle, L.; Gerboles, M.; Villani, M.G.; Aleixandre, M.; Bonavitacola, F. Field calibration of a cluster of low-cost available sensors for air quality monitoring. Part A: Ozone and nitrogen dioxide. Sens. Actuators B Chem. 2015, 215, 249–257. [Google Scholar] [CrossRef]
  8. Spinelle, L.; Gerboles, M.; Villani, M.G.; Aleixandre, M.; Bonavitacola, F. Field calibration of a cluster of low-cost commercially available sensors for air quality monitoring. Part B: NO, CO and CO2. Sens. Actuators B Chem. 2017, 238, 706–715. [Google Scholar] [CrossRef]
  9. Borrego, C.; Costa, A.M.; Ginja, J.; Amorim, M.; Coutinho, M.; Karatzas, K.; Sioumis, T.; Katsifarakis, N.; Konstantinidis, K.; De Vito, S.; et al. Assessment of air quality microsensors versus reference methods: The EuNetAir joint exercise. Atmos. Environ. 2016, 147, 246–263. [Google Scholar] [CrossRef] [Green Version]
  10. Castell, N.; Dauge, F.R.; Schneider, P.; Vogt, M.; Lerner, U.; Fishbain, B.; Broday, D.; Bartonova, A. Can commercial low-cost sensor platforms contribute to air quality monitoring and exposure estimates? Environ. Int. 2017, 99, 293–302. [Google Scholar] [CrossRef]
  11. Mead, M.I.; Popoola, O.A.M.; Stewart, G.B.; Landshoff, P.; Calleja, M.; Hayes, M.; Baldovi, J.J.; McLeod, M.W.; Hodgson, T.F.; Dicks, J.; et al. The use of electrochemical sensors for monitoring urban air quality in low-cost, high-density networks. Atmos. Environ. 2013, 70, 186–203. [Google Scholar] [CrossRef] [Green Version]
  12. Wei, P.; Ning, Z.; Ye, S.; Sun, L.; Yang, F.; Wong, K.C.; Westerdahl, D.; Louie, P.K.K. Impact analysis of temperature and humidity conditions on electrochemical sensor response in ambient air quality monitoring. Sensors 2018, 18, 59. [Google Scholar] [CrossRef] [PubMed] [Green Version]
  13. Bauerová, P.; Novák, Z.; Rychlík, Š.; Keder, J. Small air quality sensors: In vivo testing of electrochemical Cairpol sensors in comparison to reference measurement. WIT Trans. Ecol. Environ. 2018, 230, 343–354. [Google Scholar]
  14. Crilley, L.R.; Shaw, M.; Pound, R.; Kramer, L.J.; Price, R.; Young, S.; Lewis, A.C.; Pope, F.D. Evaluation of a low-cost optical particle counter (Alphasense OPC-N2) for ambient air monitoring. Atmos. Meas. Tech. 2018, 11, 709–720. [Google Scholar] [CrossRef] [Green Version]
  15. Zoest, V.; Van Osei, F.B.; Stein, A.; Hoek, G. Calibration of low-cost NO2 sensors in an urban air quality network. Atmos. Environ. 2019, 210, 66–75. [Google Scholar] [CrossRef]
  16. Bulot, F.M.J.; Johnston, S.J.; Basford, P.J.; Easton, N.H.C.; Apetroaie-Cristea, M.; Foster, G.L.; Morris, A.K.R.; Cox, S.J.; Loxham, M. Long-term field comparison of multiple low-cost particulate matter sensors in an outdoor urban environment. Sci. Rep. 2019, 9, 7497. [Google Scholar] [CrossRef] [PubMed]
  17. Bauerová, P.; Keder, J. Hodnocení Testovacího Měření Různých Typů Malých Senzorů Kvality Ovzduší na Observatoři Tušimice: Cairclip (Cairpol, FR), PMS7003 (Plantower, CHN); Czech Hydrometeorological Institute: Prague, Czech Republic, 2019. [Google Scholar]
  18. Feinberg, S.; Williams, R.; Hagler, G.S.W.; Rickard, J.; Brown, R.; Garver, D.; Harshfield, G.; Stauffer, P.; Mattson, E.; Judge, R.; et al. Long-term evaluation of air sensor technology under ambient conditions in Denver, Colorado. Atmos. Meas. Tech. 2018, 11, 4605–4615. [Google Scholar] [CrossRef] [Green Version]
  19. Cairpol. Technical Datasheet Cairsens O3/NO2; Cairpol Environment S.A.: Poissy, France, 2016. [Google Scholar]
  20. Cairpol. Technical Datasheet Cairsens NO2; Cairpol Environment S.A.: Poissy, France, 2016. [Google Scholar]
  21. Spinelle, L.; Gerboles, M.; Aleixandre, M. Report of Laboratory and in-Situ in itu Validation of Micro-Sensor Sensor for Monitoring Ambient air Pollution. O12: CairClip O3/NO2 of Cairpol (F); Publications Office of the European Union: Luxembourg, 2013. [Google Scholar]
  22. Jiao, W.; Hagler, G.; Williams, R.; Sharpe, R.; Brown, R.; Garver, D.; Judge, R.; Caudill, M.; Rickard, J.; Davis, M.; et al. Community Air Sensor Network (CAIRSENSE) project: Evaluation of low-cost sensor performance in a suburban environment in the southeastern United States. Atmos. Meas. Tech. 2016, 9, 5281–5292. [Google Scholar] [CrossRef] [Green Version]
  23. Notario, A.; Bravo, I.; Adame, J.A.; Díaz-de-Mera, Y.; Aranda, A.; Rodríguez, A.; Rodríguez, D. Behaviour and variability of local and regional oxidant levels (OX = O3 + NO2) measured in a polluted area in central-southern of Iberian Peninsula. Environ. Sci. Pollut. Res. 2013, 20, 188–200. [Google Scholar] [CrossRef]
  24. Cairpol. Technical Datasheet Cairsens SO2; Cairpol Environment S.A.: Poissy, France, 2016. [Google Scholar]
  25. Cairpol. Technical Datasheet Cairsens CO; Cairpol Environment S.A.: Poissy, France, 2016. [Google Scholar]
  26. Yong, Z.; Haoxin, Z. Digital Universal Particle Concentration Sensor: PMS7003 Series Data Manual; Plantower: Beijing, China, 2016. [Google Scholar]
  27. Alphasense. Alphasense User Manual OPC-N2 Optical Particle Counter; Sensor Technology House: Essex, UK, 2015. [Google Scholar]
  28. Teledyne API. Available online: http://www.teledyne-api.com/ (accessed on 5 March 2018).
  29. Environment, SA. Available online: http://www.environnement-sa.com/ (accessed on 14 January 2019).
  30. Palas, Fidas200. Available online: https://www.palas.de/en/product/fidas200 (accessed on 20 November 2018).
  31. Smolík, P.; Rychlík, Š. Validační Zpráva Pro Metodu T 22 AA-005; Czech Hydrometeorological Institute: Prague, Czech Republic, 2019. [Google Scholar]
  32. Fishbain, B.; Lerner, U.; Castell, N.; Cole-Hunter, T.; Popoola, O.; Broday, D.M.; Martinez Iniguez, T.; Nieuwenhuijsen, M.; Jovasevic-Stojanovic, M.; Topalovic, D.; et al. An evaluation tool kit of air quality micro-sensing units. Sci. Total Environ. 2017, 575, 639–648. [Google Scholar] [CrossRef]
  33. van Zoest, V.M.; Stein, A.; Hoek, G. Outlier Detection in Urban Air Quality Sensor Networks. Water Air Soil Pollut. 2018, 229, 1–13. [Google Scholar] [CrossRef] [Green Version]
  34. Weissert, L.F.; Alberti, K.; Miskell, G.; Pattison, W.; Salmond, J.A.; Henshaw, G.; Williams, D.E. Low-cost sensors and microscale land use regression: Data fusion to resolve air quality variations with high spatial and temporal resolution. Atmos. Environ. 2019, 213, 285–295. [Google Scholar] [CrossRef]
  35. Clements, A.L.; Griswold, W.G.; RS, A.; Johnston, J.E.; Herting, M.M.; Thorson, J.; Collier-Oxandale, A.; Hannigan, M. Low-Cost Air Quality Monitoring Tools: From Research to Practice (A Workshop Summary). Sensors 2017, 17, 2478. [Google Scholar] [CrossRef] [PubMed] [Green Version]
  36. Clements, A.L.; Reece, S.; Conner, T.; Williams, R. Observed data quality concerns involving low-cost air sensors. Atmos. Environ. X 2019, 3, 100034. [Google Scholar] [CrossRef]
  37. Lewis, A.C.; Von Schneidemesser, E.; Peltier, R.E. Low-Cost Sensors for the Measurement of Atmospheric Composition: Overview of Topic and Future Applications; WMO-No.121.; World Meteorological Organization: Geneva, Switzerland, 2018. [Google Scholar]
  38. Zheng, T.; Bergin, M.H.; Johnson, K.K.; Tripathi, S.N.; Shirodkar, S.; Landis, M.S.; Sutaria, R.; Carlson, D.E. Field evaluation of low-cost particulate matter sensors in high-and low-concentration environments. Atmos. Meas. Tech. 2018, 11, 4823–4846. [Google Scholar] [CrossRef] [Green Version]
Figure 1. Tested pairs of sensor units installed on the roof of the reference monitoring station within the ventilated boxes: (a) pairs of Cairclip sensors for SO2, NO2, O3, and CO (Cairpol, FR); (b) pairs of PMS7003 particle counters (Plantower, CHN) and (c) OPC-N2 particle counters (Alphasense, UK) for PM1, PM2.5, and PM10 [13,17].
Atmosphere 11 00492 g001
Figure 2. The course of CO, NO2, and O3 hourly concentrations (in ppb, only CO in ppm) measured by Cairpol Cairclip gas sensors during the selected part of the testing period (from 25 January until 28 February 2018).
Atmosphere 11 00492 g002
Figure 3. The relationship between O3 concentrations measured by Cairpol Cairclip sensors and by the RM (both in ppb) with differentiation into particular months of the testing period (lasting from November 2017 until September 2018). The black line presents the polynomial best-fit regression line (degree = 2).
Atmosphere 11 00492 g003
Figure 4. The relationship between the PM2.5 and PM10 concentrations (µg/m3) measured by Plantower PMS7003 particle counters (Plant1 in gray, Plant2 in blue) and by control monitors: (a) PM2.5 concentration comparison with equivalent optical Fidas200 monitor; (b) PM2.5 concentration comparison with radiometric RM; (c) PM10 concentration comparison with equivalent optical Fidas200 monitor; (d) PM10 concentration comparison with radiometric RM. The coefficients of determination (R2) were estimated from the linear best-fit regression lines.
Atmosphere 11 00492 g004
Figure 5. The relationship between the PM2.5 and PM10 concentrations (µg/m3) measured by Alphasense OPC-N2 particle counters (Alpha1 in gray, Alpha2 in blue; including outliers) and by control monitors: (a) PM2.5 concentration comparison with equivalent optical Fidas200 monitor; (b) PM2.5 concentration comparison with radiometric RM; (c) PM10 concentration comparison with equivalent optical Fidas200 monitor; (d) PM10 concentration comparison with radiometric RM. In the case of PM2.5, the coefficients of determination (R2) were estimated from the linear best-fit regression lines. In the case of PM10, the y-axis is converted to a logarithmic scale and the R2 values were estimated from the power best-fit regression lines.
Atmosphere 11 00492 g005aAtmosphere 11 00492 g005b
Figure 6. The relationship between PM concentrations (µg/m3) measured by OPC-N2 Alphasense particle counters and by an optical Fidas200 monitor: (a) comparison of PM2.5 concentrations; (b) comparison of PM10 concentrations (only concentrations <1000 µg/m3 are shown), both colored according to the ambient relative humidity (RH).
Atmosphere 11 00492 g006
Table 1. Technical parameters of different Cairpol gas sensors specified by the manufacturer [19,20,24,25]. 1
Gas Sensor TypeMeasurement RangeLimit of DetectionUncertaintyInterference Effect Temperature Effect on Zero Value
Cairclip SO2 (ppb)0–100050<25%NO2, O3: ~−125%
H2S: ~5%
CO, H2: <1%
Not detected
Cairclip NO2 (ppb)0–25020<30%Cl2: ~80%
sulfur compounds: negative interference O3: ~80%
±50 ppb
Cairclip O3 (ppb, also O3/NO2 ppb)0–25020<30%Cl2: ~80%
sulfur compounds: negative interference
±50 ppb
Cairclip CO (ppm)0–200.05<25%H2 < 60%
Long-term high concentrations of H2S, NOx, SO2 may interfere with the signal
±1 ppm
1 All the mentioned technical specifications were based on laboratory testing under standard operating conditions at T = 20 °C (±2 °C), RH = 50% (±10%), and p = 1013 hPa (±5%).
Table 2. Technical parameters of Plantower and Alphasense optical particle counters specified by the manufacturers [26,27].
Particle Counter TypeMeasured FractionsDetection Range (µm) Measurement Range Maximum Consistency Error/Coincidence ProbabilityStandard Volume
Plantower PMS7003PM10.30–10.000–500 (µg/m3)±10% at conc. 100–500 μg/m3
±10 μg/m3 at conc. 0–100 μg/m3
0.1 L
PM2.5
PM10
Alphasense OPC-N2PM10.38–17.000–10,000 (particles/s)0.84% at 106 particles/L1.2 L
PM2.5
PM10
Table 3. Summary statistics of gaseous pollutant concentrations (SO2, NO2, O3, and CO) measured by pairs of Cairpol (Cairclip) sensors (ID 1 and 2) and by corresponding reference monitors.
Type of SensorSensor ID Reference Monitor
Mean ± SD 1 Intra-Sensors Mean ± SD 1
12Correlation (rS) 2
Cairclip SO2 (ppb)97.68 ± 53.4531.01 ± 30.160.991.67 ± 1.69
Cairclip NO2 (ppb)30.54 ± 13.6329.61 ± 13.491.006.31 ± 4.20
Cairclip O3 (ppb)22.53 ± 12.5023.68 ± 12.831.0032.57 ± 17.42
Cairclip CO (ppm)1.81 ± 0.9712.26 ± 7.490.81- 3
1 SD = standard deviation. 2 rS = Spearman’s rank correlation coefficient. 3 There is no reference monitor available for CO at the Tušimice station.
Table 4. Summary of Cairpol (Cairclip) gas sensor performance statistics in comparison with the corresponding reference monitors (RMs).
Type of SensorSensor IDPresence 1 (%)Correlation with RMMeasurement Error 3
rS 2MBEMAERMSE
Cairclip SO2 (ppb)194.80.02−110.11110.11119.89
272.60.00−30.3530.5244.46
Cairclip NO2 (ppb)194.8−0.26−27.9927.9930.54
294.8−0.26−27.1327.1329.75
Cairclip O3 (ppb)194.80.6811.1313.3115.03
294.80.689.9412.4714.16
Cairclip CO (ppm)194.8----
294.8----
1 Presence is indicating the sensors’ availability over the time of the whole testing period in percentage. 2 rS = Spearman’s rank correlation coefficient. Coefficients highlighted in italics are statistically non-significant (p > 0.05). 3 Measurement error calculated as: MBE = mean bias error, MAE = mean absolute error, RMSE = root mean square error.
Table 5. Summary statistics of particulate matter (PM1, PM2.5, and PM10) concentrations (µg/m3) measured by pairs of Plantower (PMS7003) and Alphasense (OPC-N2) particle counters (ID 1 and 2) and by a corresponding Fidas200 optical particle counter and reference monitors (RMs).
Type of SensorSensor ID Fidas200RM
Mean ± SD 1 Intra-Sensors Correl.Mean ± SD Mean ± SD 1
12rS 2
PMS7003 PM115.14 ± 12.3713.38 ± 10.950.9512.67 ± 10.26- 3
PMS7003 PM2.522.14 ± 19.3320.67 ± 17.170.9614.63 ± 11.0017.39 ± 12.21
PMS7003 PM1024.34 ± 21.9222.56 ± 18.690.9622.19 ± 14.7624.46 ± 16.85
OPC-N2 PM139.59 ± 43.7243.95 ± 47.820.9915.17 ± 12.53- 3
OPC-N2 PM2.556.86 ± 72.3667.87 ± 85.240.9917.05 ± 13.7217.93 ± 14.25
OPC-N2 PM10149.40 ± 536.43196.00 ± 661.980.9922.63 ± 17.3925.14 ± 19.56
1 SD = standard deviation. 2 rS = Spearman’s rank correlation coefficient. 3 There is no reference monitor available for PM1.
Table 6. Summary of Plantower (PMS7003) and Alphasense (OPC-N2) particle counters’ performance statistics in comparison with a Fidas200 optical particle counter and the reference monitors (RMs).
Type of SensorSensor IDPresence 1 (%)Correlation with Fidas200 1, RM 2Measurement Error
rS 2rS 3MBE 4MAE 4RMSE 4MBE 5MAE 5RMSE 5
PMS7003 PM1193.30.88-−2.704.086.86---
294.90.91-−1.083.244.74---
PMS7003 PM2.5194.80.870.63−7.948.9213.53−4.9310.6114.99
293.00.900.66−6.087.1310.58−3.079.1012.56
PMS7003 PM10195.90.700.62−2.5111.0515.93−0.3112.0516.63
295.90.730.63−0.829.7013.821.3911.0115.16
OPC-N2 PM1186.50.85-−26.2727.5245.43---
278.30.83-−28.9130.4750.51---
OPC-N2 PM2.5186.50.830.66−43.2744.5981.71−42.6846.0784.58
278.30.810.63−51.3852.9797.64−50.7954.30100.52
OPC-N2 PM10186.50.770.68−140.12143.56620.93−137.11142.96621.47
278.30.750.66−174.61178.06766.85−171.60177.21767.39
1 Presence is indicating the sensors’ availability over the time of the whole testing period in percentage. 2 Correlations with Fidas200 optical particle counter tested by: rS = Spearman’s rank correlation coefficient. 3 Correlations with RM tested by: rS = Spearman’s rank correlation coefficient. 4 Measurement error calculated as: MBE = mean bias error, MAE = mean absolute error, RMSE = root mean square error, where the modeled concentrations were given by the Fidas200 optical particle counter (in µg/m3). 5 Measurement error calculated as: MBE = mean bias error, MAE = mean absolute error, RMSE = root mean square error, where the modeled concentrations were given by the corresponding RM (in µg/m3).

