Evaluation of the Performance of CMIP6 HighResMIP on West African Precipitation


1
Collaborative Innovation Center on Forecast and Evaluation of Meteorological Disasters/Key Laboratory of Meteorological Disaster, Ministry of Education/Joint International Research Laboratory of Climate and Environment Change, Nanjing University of Information Science and Technology, Nanjing 210044, China
2
School of Atmospheric Sciences, Nanjing University of Information Science and Technology, Nanjing 210044, China
3
National Weather Forecasting and Climate Research Centre, Nigerian Meteorological Agency, PMB 615 Abuja, Nigeria
4
School of Computer and Software, Nanjing University of Information Science and Technology, Nanjing 210044, China
*
Author to whom correspondence should be addressed.
Atmosphere 2020, 11(10), 1053; https://doi.org/10.3390/atmos11101053
Submission received: 13 August 2020
/
Revised: 10 September 2020
/
Accepted: 15 September 2020
/
Published: 1 October 2020
(This article belongs to the Special Issue Climate Events and Extreme Weather)
Abstract
:This research focuses on evaluating the High-Resolution Model Intercomparison Project (HighResMIP) simulations within the framework of the Coupled Model Intercomparison Project (CMIP) Phase 6 (CMIP6). We used seven of its consortiums to study how CMIP6 reproduced the West African precipitation features during the 1950–2014 historical simulation periods. The rainfall event was studied for two sub-regions of West Africa, the Sahel and the Guinea Coast. Precipitation datasets from the Climate Research Unit (CRU) TS v4.03, University of Delaware (UDEL) v5.01, and Global Precipitation Climatology Centre (GPCC) were used as observational references with the aim of accounting for uncertainty. The observed annual peak during August, which is greater than 200, 25, and 100 mm/month in the Guinea Coast, the Sahel, and West Africa as a whole, respectively, appears to be slightly underestimated by some of the models and the ensemble mean, although all the models captured the general rainfall pattern. Global climate models (GCMs) and the ensemble mean reproduced the spatial daily pattern of precipitation in the monsoon season (from June to September) over West Africa, with a high correlation coefficient exceeding 0.8 for the mean field and a relatively lower correlation coefficient for extreme events. Individual models, such as IPSL and ECMWF, tend to show high performance, but the ensemble mean appears to outperform all other models in reproducing West African precipitation features. The result from this study shows that merely improving the horizontal resolution may not remove biases from CMIP6.
1. Introduction
The West African region is one of the most densely populated regions in the world, with close to 400 million inhabitants in 2018 [1]. Most of its key economic sectors, such as agriculture, power generation, and industry, strongly depend on the climate, of which seasonal rainfall forms a key component [2,3]. The study of climate and its change over the region is challenging because the region is vulnerable to low adaptive capacity to observed climate change [4] and because there are variations in the observed precipitation dataset from one location to another [5,6,7,8]. The fifth assessment of the Intergovernmental Panel on Climate Change (IPCC) [9] reported that most of the African region lacks sufficient observational data to provide conclusions on trends in annual precipitation over the past century, but beyond these challenges, research has shown that there might be a wetter core rainfall season with a small delay to the rainy season by the end of the 21st century. Several studies have shown that climate change may have an intense impact on agriculture, construction, power generation, and the health sector, so information gleaned from a climate model evaluation will benefit the African region.
To improve climate change knowledge and detect the effect of changes in the past, present, and future, global climate models (GCMs) under the supervision of the Coupled Model Intercomparison Project (CMIP) were established by modeling groups globally [10]. Climate model data are accessible through the World Climate Research Program (WCRP), which supervises the various phases of the CMIP [11]. This effort has been in place for the past more than 20 years to gradually improve the understanding of climate science. When CMIP phase 3 (CMIP3) was released, the horizontal resolution was 250 km in the atmosphere and 150 km in the ocean [12] but seven years later, CMIP phase 5 (CMIP5) was released with an improved resolution of 150 km and 100 km for the atmosphere and ocean, respectively [13]. Activities of several modeling groups are coordinated under a single framework for a specific phase of CMIP so that previous efforts are not replicated and to minimize the operational and computational burden. Data standards, such as metadata and governing structures, have been adopted by the Earth System Grid Federation (ESGF) that was designed to provide access to CMIP model outputs hosted by several institutions around the world [10].
Simulating precipitation in West Africa using a GCM with low to medium resolution has shown noticeable deficiencies [14,15]. Low- to medium-resolution GCMs from CMIP3 and CMIP5 were not able to incorporate the drivers of regional precipitation, such as orography and the role of vegetation, and have shown major discrepancies in reproducing precipitation due to synoptic, sub-synoptic, and mesoscale convective systems [16]. The issue of resolution has led to the extensive use of statistical or dynamical downscaling to improve the resolution over a region. Downscaling methods, while useful for regionally resolved climate information, can have high levels of uncertainty due to regional climate model (RCM) physics or uncertainties from driving GCMs [17,18] under particular conditions [19]. High-resolution models are more capable of simulating mesoscale convective systems than coarse-resolution models and are therefore able to represent multi-scale interactions [20,21]. Moreover, they are able to represent diurnally forced circulations and modulated rainfall due to orography [22,23]. The introduction of multiple model simulations at fine resolutions (25–50 km) in the High-Resolution Model Intercomparison Project (HighResMIP) is timely, as it could significantly improve the confidence in CMIP6 models used to devise adaptation strategies under a changing climate. The vertical resolution was focused on in the HighResMIP, as the main aim of this model is to determine the robust benefits of increased horizontal model resolution based on multi-model ensemble simulations [24].
This study makes use of CMIP6 HighResMIP GCMs with the aim of ascertaining whether the improved resolution of CMIP6 can capture precipitation features of the West African region. The analyses are segmented into four sections: The first section examines how HighResMIP simulates the annual cycle of precipitation, the second section analyzes mean climatology, the third session evaluates trends from 1950 to 2014, and in the final section, we use daily data to evaluate extreme events (R95p) over the region, as suggested by Alexander et al. [25].
Due to the low density of rain gauge networks over West Africa, the use of a gridded dataset for proxies to observation has gained momentum and it is now an important method, especially in the context of understanding and evaluating the quality of climate models in reproducing precipitation features. To alleviate uncertainties that may arise from different approaches being employed to obtain gridded datasets, the use of more than one gridded observational dataset has been prescribed for reliable climate data assessment studies [26,27].
2. Study Area, Model Dataset, Evaluation, and Statistical Analysis
2.1. Study Area
West Africa consists of 16 countries: Benin, Burkina Faso, Cape Verde, Gambia, Ghana, Guinea-Bissau, Ivory Coast, Liberia, Mali, Mauritania, Niger, Nigeria, Senegal, Sierra Leone, and Togo. In this study, West Africa is defined as the region distributed within longitude 20° W–20° E and latitude 0°–30° N (Figure 1). Here, we refer to it as two climatic zones: The Sahel (north of 15° N) and the Guinea Coast (south of 15° N).
2.2. Model Datasets
The daily precipitation of the historical simulations for the period 1950–2014 from seven high-resolution models (see Table 1) was used in this study. The data are archived at the Earth System Grid Federation (ESGF) website under CMIP6 HighResMIP (https://esgf-node.llnl.gov/search/cmip6/).
2.3. Model Evaluation
Due to the sparse observation precipitation datasets over West Africa, data from the daily Global Precipitation Climatology Centre (GPCC) 2018 version (https://opendata.dwd.de/climate_environment/GPCC/html/fulldata-daily_v2018_doi_download.html), and monthly data from the University of Delaware (UDEL) v5.01 (https://psl.noaa.gov/data/gridded/data.UDel_AirT_Precip.htm) and Climate Research Unit (CRU) TSv4.03 (https://crudata.uea.ac.uk/cru/data/hrg/) were used in this study as the observation data with which to evaluate the ability of GCMs to reproduce precipitation and to account for the observation uncertainty. GPCC data are a rain-gauge-based gridded precipitation dataset with a horizontal resolution of 1° × 1° [28]. The dataset has a quality control program to check for errors in the precipitation data received all over the world. We used it in this study to evaluate how the high-resolution GCMs simulate daily climatology and extreme events over the study area. CRU TS v4.03 and UDEL v5.01 are produced at 0.5 km resolution by the Climate Research Unit, School of Environmental Sciences, University of East Anglia, and the Centre for Climate Research and Department of Geography, University of Delaware, respectively; these were used to examine the performance of the GCMs in simulating the annual cycle and trend of precipitation. Due to differences in the horizontal resolution of each dataset (see Table 1), we re-gridded using a bilinear interpolation method so that each model’s datasets have the same grid resolution as the observation data.
2.4. Statistical Analysis
The arithmetic average of each CMIP6 dataset was taken as the ensemble mean. A Taylor diagram and spatial analysis were used to evaluate climatology and extreme events, while temporal plots were used for annual precipitation cycle and trend analysis. We calculated the mean bias for both climatology and extreme events using
where is the mean of each model, is the mean of the observation dataset, is the mean of the 95th percentile of each model, and is the mean of the 95th percentile of the observation.
The ability of the CMIP6 models to simulate precipitation trends from one period to the other was investigated by subtracting precipitation values for 1955–1984 and 1985–2014. The changes were compared and differences at p < 0.10 were considered significant. The standardized anomaly in each model was analyzed to determine the trends and to study how each model simulates the wet and dry season with respect to the observation. The standardized anomaly was calculated using
where is the raw time series, is the mean of the time series, and is the standard deviation.
Extreme precipitation (R95p) and its return levels were extracted by calculating the 95th percentile from the daily datasets.
3. Results and Discussion
3.1. Annual Cycle
Figure 2a–c presents the annual cycle of precipitation over the Guinea Coast, Sahel, and West Africa as a whole. The amount of rainfall in the monsoon season (June–September) is higher in the Guinea Coast than the Sahel. The individual GCM and ensemble mean captured the high/low rainfall over the Guinea Coast and Sahel adequately. The observed annual peak during August was greater than 200, 25, and 100 mm/month in the Guinea Coast, Sahel, and West Africa as a whole, respectively. This appears to be slightly underestimated by some of the models and the ensemble mean, although all models captured the general rainfall pattern. In the Guinea Coast (Figure 2a), the length of the rainy season was from May to October, with peak rainfall in August; this observation was well captured by most GCMs, and was also noted by Abatan [29], although the GCMs show some variation in the intensity of precipitation. The NICAM and MRI models simulated early onset and late cessation. In comparison, the IPSL model appears to perform well over the Guinea Coast and West Africa with an exact peak in precipitation during August (Figure 2a,c), while the NICAM model simulates the pattern of precipitation over the Sahel sub-region better than others (Figure 2b).
3.2. Mean Climatology
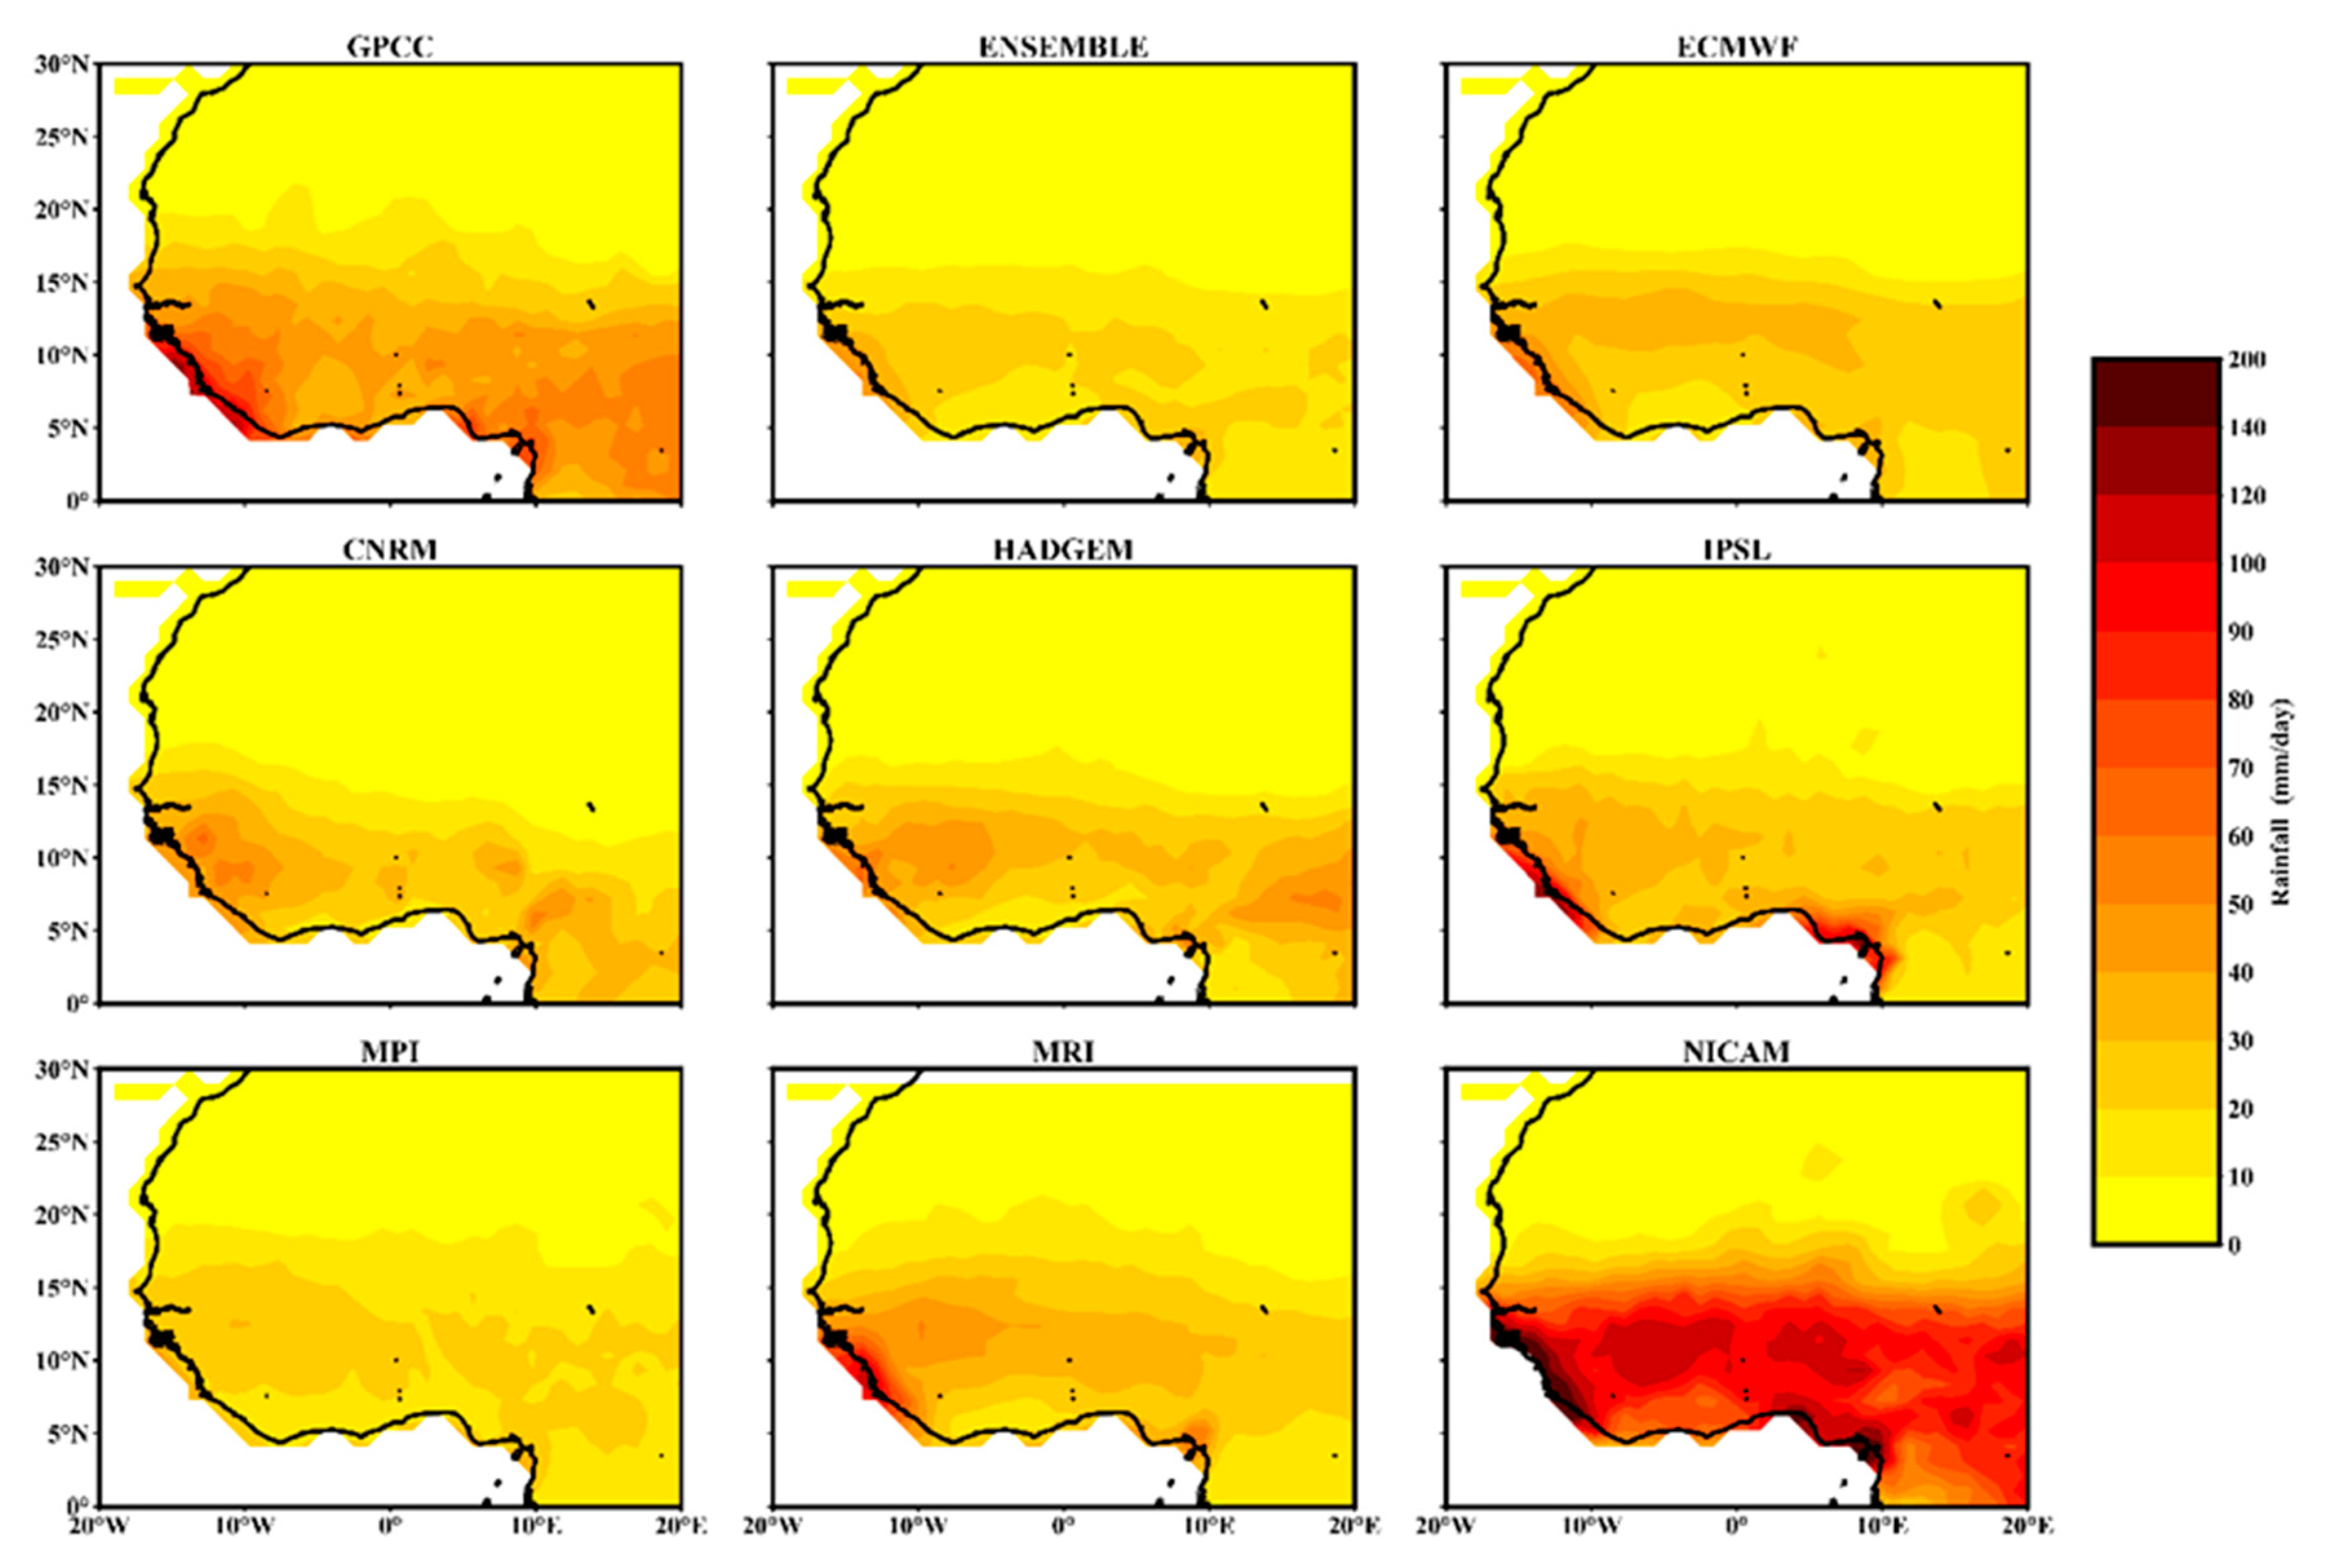
Figure 3 depicts the spatial distribution of daily precipitation from June to September. Most of the models adequately captured daily precipitation over the region, with rain bands from 3 to 24 mm/day. There was slight to moderate variation in the amount of precipitation simulated by the models with respect to the GPCC. The daily rainfall pattern was well simulated by the GCMs and the ensemble mean. The majority of areas with less than 8 mm/day precipitation, and the areas with most precipitation (i.e., Guinea high-ground including its sub-region and southern Nigeria) were captured adequately. Over the southeast and southwest areas of West Africa, daily precipitation was above 20 mm/day, and this was reproduced by the GCMs and ensemble mean; these findings were also reported by [30,31,32,33,34,35]. Figure 4 shows the deviation of the ensemble mean and its constituent values from observations. The ensemble mean, ECMWF, CNRM, HADGEM, and MPI showed moderate underestimation in the range of 1–5 mm/day precipitation, while IPSL, MRI, and NICAM showed consistent overestimation of precipitation in the Guinea Coast ranging from 1–6 mm/day. There were moderate overestimations in Jos, Nigeria by the CNRM, and IPSL models ranging from 3–4 mm/day, but the MRI and NICAM models overestimated by more, ranging from 10–12 mm/day. The ensemble mean, followed by the ECMWF model, outperformed other models, with less deviation from observational data.
We further evaluated the performance of HighResMIP of CMIP6 using a Taylor diagram, which quantitatively measures how well the simulated and observed patterns match each other in terms of spatial correlation coefficient, root-mean-square error (RMSE), and the ratio of standard deviation [36]. As shown in Figure 5, the ensemble mean and its members showed a high spatial correlation coefficient exceeding 0.8. The RMSEs relative to the observation were below 0.5 for all simulations except CNRM. The ratios of standard deviations between the simulations and the observation were around 1. In comparison, the ECMWF model had the highest spatial correlation and the lowest RMSEs, followed by the ensemble mean; MRI seems to perform better in terms of the standard deviation, which is the closest to the observation, followed by CNRM and the ensemble mean. These results demonstrate that both the ensemble mean and individual models have a strong performance in simulating spatial patterns of precipitation over West Africa, and the ensemble mean outperforms its constituent members overall.
3.3. Trend Analysis
Climate change is an important aspect of climate study and mean climatology alone may not be sufficient to reveal if a model can simulate climate change [37]. The precipitation from the historical periods 1955–1984 and 1985–2014 simulated by the CMIP6 were subtracted to quantify the percentage of the West African region (grid) that has experienced a significant decrease or increase in precipitation. Table 2 presents the results of the analysis. Observations show that some grids are exhibiting decreasing/increasing trends, while some are showing no significant change. The extent of the trend is not the same between CRU TSv4.03 and UDEL v5.01. CRU TSv4.03 shows that 32% of the grids had a significant decrease in precipitation, while 1% of the grids had a significant increase and 67% of the region showed no significant precipitation change. UDEL v5.01 shows 18% of the grids had a significant decrease, while 82% of the region had no significant precipitation change. The uncertainty in interpolation could cause a variation in the precipitation estimates [38]. In contrast with observation, ECMWF shows 17% of the grids had precipitation increase, with 23% of the grids showing precipitation decrease, while 60% of the region showed no significant precipitation change. NICAM had 4% of the grids showing increasing trends, with 21% of the grids showing decreasing trends, while 75% of the grids showed no significant change. Among the simulations, NICAM outperformed in simulating observed decreasing trends among the grids. In this analysis, ensemble mean did not outperform individual models, and this could be attributed to the low performance of its members in capturing the change.
The ability of GCMs to capture observed trends during the 1950s to 2000s using standardized precipitation anomaly is presented in Figure 6. As shown by the observations, there was a decreasing trend from the 1950s to the mid-1980s and then turned to slightly increasing trend afterwards. Furthermore, the two observation datasets showed wet and dry periods during the 1950s to 1960s and the 1970s to 1980s, respectively, as also noticed by [39]. Most of the GCMs and the ensemble mean captured the observed trends as well as wet and dry periods. IPSL outperformed in capturing the observed trends, in wet and dry periods. The performance of the GCMs depicts their capabilities in simulating the wet and dry periods, which are regular features of West African precipitation.
3.4. Extreme Precipitation Event
Extreme event analysis is an important aspect of climate change, as many of the regions usually have excess rainfall that frequently leads to flooding. The performance of the GCMs used to estimate it will aid the preparation for such events. Figure 7 presents the spatial pattern of extreme events in the study area. Observations showed more than 60 mm/day precipitation over coastal areas of Sierra Leone, Liberia, and Nigeria. The remaining part of the Guinea coast had from 30 to 40 mm/day. In comparison with the observational data, the ensemble mean and its constituent models showed a similar pattern of extreme precipitation; however, there was consistent underestimation by most models throughout the Guinea coast, except for the NICAM model, which overestimated precipitation in most of the region. Figure 8 shows the magnitude of deviation of the GCMs and ensemble mean from observation in simulating extreme events. The ensemble mean and its constituents showed moderate positive and negative bias (+6 mm/day and −6 mm/day) over the Sahel sub-region. Over the Guinea coast, a negative bias with moderate to high magnitude was predominant, varying from −6 to −30 mm/day for the ensemble mean, and ECMWF, CNRM, HADGEM, IPSL, MPI, and MRI models.
A deeper understanding of the performance of each CMIP6 model in reproducing the spatial pattern of extreme precipitation event was performed using the Taylor diagram (Figure 9). As observed in Figure 9, the majority of CMIP6 models and the ensemble mean showed a spatial correlation coefficient of 0.4 to 0.7, with the exception of HADGEM. The RMSEs of the CNRM, ECMWF, IPSL, MPI, and MRI models were less than 1, while the ratio of standard deviation between the observation and simulation data was also around 1. The contrast showed that the ensemble mean had the highest spatial correlation and lowest RMSE. The NICAM model appeared to perform better with regard the ratio of the standard deviation, having the closest value to the observation. This analysis shows that the majority of the seven HighResMIP models used can simulate the spatial pattern of extreme precipitation events over West Africa, and the ensemble mean outperformed any single model.
3.5. Return Level
The precipitation return level for the 30-year period of 1985–2014 is shown in Figure 10 for the observation and the GCMs with ensemble mean. The observational data showed return levels of the extreme events at up to 80 mm/day of precipitation over most of the Guinea Coast and the southernmost part of the Sahel, with the highest return level over the Guinea high ground. The ensemble mean, ECMWF, CNRM, HADGEM, IPSL, MPI, and MRI underestimated the return level over most regions, with the highest overestimation by the NICAM model for the Guinea coast. The MRI and HADGEM models performed well over the Guinea high ground. The deviation of the GCMs from observations of the extreme events’ return level based on grids is shown in Table 3. The IPSL model showed that 21% of the grids were underestimated and 77% of grids showed no significant change, while the MRI and HADGEM models both underestimated 22% of grids, while 78% showed no significant change. The ensemble mean did not perform well in this analysis because most of the GCMs failed to capture the extreme events (R95p) return levels.
4. Conclusions
In this study, we evaluated the precipitation simulation performance of seven models from the CMIP6 HighResMIP over the West African region. Several metrics were employed to determine the performance of the HighResMIP models over the study region. The main objective was to evaluate the impact of the models’ new high-resolution feature in representing the precipitation characteristics of the West African region. The evaluation results from the annual cycle showed that the ensemble mean and its constituent models adequately reproduced the annual precipitation pattern. Most models’ simulations underestimated the magnitude of precipitation, except for the IPSL and NICAM models, which appeared to overestimate precipitation over the Guinea high ground. Most of the models simulated August as the peak of precipitation over the two homogenous regions and the whole of West Africa. The ensemble mean most closely matched the observed annual pattern of precipitation, and therefore outperformed the individual models. In further analysis, a comparison of the simulated spatial distribution of precipitation with observational data showed that the ensemble mean and its members reproduced the pattern of precipitation over most of the rainy areas (Guinea high-ground and Nigeria’s coastal region). A Taylor diagram was used to examine quantitatively how the model simulations and observational data matched with each other. While the results showed that the capacity of individual models cannot be discarded, the ensemble mean outperformed its ensemble members. The performance of the HighResMIP in simulating reduced precipitation over some grid areas was also examined. In this aspect, NICAM outperformed other models. The standardized anomaly was used to determine precipitation trends and the result showed that the wet and dry periods are well simulated by the majority of the GCMs, while IPSL is the highest performing model among the ensemble members. The anomaly of R95p was used to plot a Taylor diagram to evaluate the performance of the HighResMIP GCMs in terms of simulating extreme events. Most of the models had a relatively low correlation with the observational dataset and a root-mean-square error of less than 1; in this analysis, the ensemble mean performed better than others. The spatial distribution of the extreme events and return level was also investigated, and most of the models underestimated the extreme events, except the NICAM model. This typical feature from NICAM suggests that the highly simulated extreme events might be closely related to the high resolution. Although attributing such an extreme behavior from NICAM goes beyond the scope of this paper, this result provides evidence that high-resolution GCMs without regional components such as topography, vegetation, or waterbodies may be biased in providing accurate and regionally resolved climate information. This study was limited to the seven available HighResMIP models; with the release of more models, there may be a more robust evaluation in the future. The unavailability of corresponding projection data for the climate models used precluded the assessment of future projections with respect to precipitation over West Africa, but this remains a highly relevant task for future studies in the region.
Author Contributions
Conceptualization, F.O.A. and B.Z.; methodology, F.O.A.; software, G.T.G. and A.O.; validation, B.Z. and G.T.G.; formal analysis, F.O.A.; investigation, B.Z. and F.O.A.; resources, B.Z.; data curation, F.O.A.; writing—original draft preparation, F.O.A.; writing—review and editing, B.Z. and F.O.A.; visualization, G.T.G. and A.O.; supervision, B.Z.; funding acquisition, B.Z. All authors have read and agreed to the published version of the manuscript.
Funding
This research was jointly supported by the National Natural Science Foundation of China (41675069) and the Startup Foundation for Introducing Talent of NUIST (2018r060).
Acknowledgments
We are grateful to the WCRP and institutions that made their results available to the public. We are also grateful to the Climate Research Unit (CRU), the University of Delaware (UDEL) and Global Precipitation Climatology Center (GPCC) for granting access to the observational datasets in accordance with their specific data use and citation policies. The first author especially acknowledges the Nigerian Meteorological Agency, World Meteorological Organization and Nanjing University of Information Science and Technology, China for granting him the scholarship that facilitated the completion of the present study.
Conflicts of Interest
The authors declare no conflict of interest.
References
- United Nations Department of Economic and Social Affairs: Population Division. World Population Prospects; United Nations Department of Economic and Social Affairs: New York, NY, USA, 2019. [Google Scholar]
- Janicot, S.; Moron, V.; Fontaine, B. Sahel droughts and Enso dynamics. Geophys. Res. Lett. 1996, 23, 515–518. [Google Scholar] [CrossRef]
- Sultan, B.; Janicot, S.; Diedhiou, A. The West African monsoon dynamics. Part I: Documentation of intraseasonal variability. J. Clim. 2003, 16, 3389–3406. [Google Scholar] [CrossRef]
- Omotosho, J.B.; Abiodun, B.J. A numerical study of moisture build-up and rainfall over West Africa. Meteorol. Appl. 2007, 14, 209–225. [Google Scholar] [CrossRef]
- Nikulin, G.; Jones, C.; Giorgi, F.; Asrar, G.; Buchner, M.; Cerezo-Mota, R.; Christensen, O.B.; Déqué, M.; Fernández, J.; Hänsler, A.; et al. Precipitation climatology in an ensemble of CORDEX-Africa regional climate simulations. J. Clim. 2012, 25, 6057–6078. [Google Scholar] [CrossRef] [Green Version]
- Sylla, M.B.; Gaye, A.T.; Jenkins, G.S. On the fine-scale topography regulating changes in atmospheric hydrological cycle and extreme rainfall over West Africa in a regional climate model projections. Int. J. Geophys. 2012, 2012, 1–15. [Google Scholar] [CrossRef]
- Kalognomou, E.-A.; Lennard, C.; Shongwe, M.; Pinto, I.; Favre, A.; Kent, M.; Hewitson, B.; Dosio, A.; Nikulin, G.; Panitz, H.-J.; et al. A diagnostic evaluation of precipitation in CORDEX models over Southern Africa. J. Clim. 2013, 26, 9477–9506. [Google Scholar] [CrossRef] [Green Version]
- Kim, J.; Waliser, D.E.; Mattmann, C.A.; Goodale, C.E.; Hart, A.F.; Zimdars, P.A.; Crichton, D.J.; Jones, C.; Nikulin, G.; Hewitson, B.; et al. Evaluation of the CORDEX-Africa multi-RCM hindcast: Systematic model errors. Clim. Dyn. 2014, 42, 1189–1202. [Google Scholar] [CrossRef]
- IPCC. Climate Change 2013: The Physical Science Basis. Contribution of Working Group I to the Fifth Assessment Report of the Intergovernmental Panel on Climate Change; Cambridge University Press: Cambridge, UK; New York, NY, USA, 2013; pp. 1–1535. [Google Scholar]
- Eyring, V.; Bony, S.; Meehl, G.A.; Senior, C.A.; Stevens, B.; Stouffer, R.J.; Taylor, K.E. Overview of the Coupled Model Intercomparison Project Phase 6 (CMIP6) experimental design and organization. Geosci. Model Dev. 2016, 9, 1937–1958. [Google Scholar] [CrossRef] [Green Version]
- Meehl, G.A.; Boer, G.J.; Covey, C.; Latif, M.; Stouffer, R.J. The Coupled Model Intercomparison Project (CMIP). Bull. Am. Meteorol. Soc. 2000, 81, 313–318. [Google Scholar] [CrossRef] [Green Version]
- Meehl, G.A.; Covey, C.; Delworth, T.; Latif, M.; Mcavaney, B.; John, F.B.; Mitchell, R.J.; Stoffer, K.; Taylor, E. The WCRP CMIP3 multimodel dataset-A new era in climate change research. Bull. Amer. Meteor. Soc. 2007, 88, 1383–1394. [Google Scholar] [CrossRef] [Green Version]
- Taylor, K.E.; Stouffer, R.J.; Meehl, G.A. An overview of CMIP5 and the experiment design. Bull. Am. Meteorol. Soc. 2012, 93, 485–498. [Google Scholar] [CrossRef] [Green Version]
- Hourdin, F.; Musat, I.; Guichard, F.S.; Ruti, P.M.; Favot, F.; Filiberti, M.-A.; Pham, M.; Grandpeix, J.-Y.; Polcher, J.; Marquet, P.; et al. AMMA-model intercomparison project. Bull. Am. Meteorol. Soc. 2010, 91, 95–104. [Google Scholar] [CrossRef]
- Xue, Y.; De Sales, F.; Lau, W.K.-M.; Boone, A.; Feng, J.; Dirmeyer, P.A.; Guo, Z.; Kim, K.-M.; Kitoh, A.; Kumar, V.; et al. Intercomparison and analyses of the climatology of the West African monsoon in the West African Monsoon Modeling and Evaluation project (WAMME) first model intercomparison experiment. Clim. Dyn. 2010, 35, 3–27. [Google Scholar] [CrossRef] [Green Version]
- Raj, J.; Bangalath, H.K.; Stenchikov, G.L. West African Monsoon: Current state and future projections in a high-resolution AGCM. Clim. Dyn. 2019, 52, 6441–6461. [Google Scholar] [CrossRef] [Green Version]
- Wu, W.; Lynch, A.H.; Rivers, A. Estimating the uncertainty in a regional climate model related to initial and lateral boundary conditions. J. Clim. 2005, 18, 917–933. [Google Scholar] [CrossRef]
- Laprise, R.; Kornic, D.; Rapaić, M.; Separovic, L.; LeDuc, M.; Nikiema, O.; Di Luca, A.; Diaconescu, E.; Alexandru, A.; Lucas-Picher, P.; et al. Considerations of Domain Size and Large-Scale Driving for Nested Regional Climate Models: Impact on Internal Variability and Ability at Developing Small-Scale Details; Springer: Berlin/Heidelberg, Germany, 2012; pp. 181–199. [Google Scholar]
- Gusain, A.; Ghosh, S.; Karmakar, S. Added value of CMIP6 over CMIP5 models in simulating Indian summer monsoon rainfall. Atmos. Res. 2020, 232, 104680. [Google Scholar] [CrossRef]
- Zhao, M.; Held, I.M.; Lin, S.-J.; Vecchi, G.A. Simulations of global hurricane climatology, interannual variability, and response to global warming using a 50-km resolution GCM. J. Clim. 2009, 22, 6653–6678. [Google Scholar] [CrossRef]
- Gent, P.R.; Yeager, S.G.; Neale, R.B.; Levis, S.; Bailey, D.A. Improvements in a half degree atmosphere/land version of the CCSM. Clim. Dyn. 2010, 34, 819–833. [Google Scholar] [CrossRef]
- Boyle, J.; Klein, S.A. Impact of horizontal resolution on climate model forecasts of tropical precipitation and diabatic heating for the TWP-ICE period. J. Geophys. Res. Atmos. 2010, 115. [Google Scholar] [CrossRef] [Green Version]
- Lau, N.-C.; Ploshay, J.J. Simulation of synoptic- and subsynoptic-scale phenomena associated with the East Asian Summer Monsoon using a high-resolution GCM. Mon. Wea. Rev. 2009, 137, 137–160. [Google Scholar] [CrossRef]
- Haarsma, R.; Roberts, M.; Vidale, P.L.; Senior, C.A.; Bellucci, A.; Bao, Q.; Chang, P.; Corti, S.; Fučkar, N.S.; Guemas, V.; et al. High Resolution Model Intercomparison Project (HighResMIP). Geosci. Model Dev 2016, 9, 4185–4208. [Google Scholar] [CrossRef] [Green Version]
- Alexander, L.; Zhang, X.; Peterson, T.C.; Caesar, J.; Gleason, B.; Tank, A.M.K.; Haylock, M.; Collins, D.; Trewin, B.; Rahimzadeh, F.; et al. Global observed changes in daily climate extremes of temperature and precipitation. J. Geophys. Res. Atmos. 2006, 111. [Google Scholar] [CrossRef] [Green Version]
- Tozer, C.R.; Kiem, A.S.; Verdon-Kidd, D.C. On the uncertainties associated with using gridded rainfall data as a proxy for observed. Hydro. Earth Syst. Sci. 2012, 16, 1481–1499. [Google Scholar] [CrossRef] [Green Version]
- Gnitou, G.T.; Ma, T.; Tan, G.; Ayugi, B.; Nooni, I.K.; Alabdulkarim, A.; Tian, Y. Evaluation of the Rossby Centre Regional Climate Model Rainfall Simulations over West Africa using large-scale spatial and temporal statistical metrics. Atmosphere 2019, 10, 802. [Google Scholar] [CrossRef] [Green Version]
- Schamm, K.; Ziese, M.; Becker, A.; Finger, P.; Meyer-Christoffer, A.; Schneider, U.; Schröder, M.; Stender, P. Global gridded precipitation over land: A description of the new GPCC First Guess Daily product. Earth Syst. Sci. Data 2014, 6, 49–60. [Google Scholar] [CrossRef] [Green Version]
- Abatan, A.A. West African Extreme Daily Precipitation in Observations and Stretched-Grid Simulations by CAM-EULAG. Master’ Thesis, Iowa State University, Ames, IO, USA, 2011. Available online: https://lib.dr.iastate.edu/etd/10401 (accessed on 21 September 2020).
- Udo, R.K. A Comprehensive Geography of West West Africa; Heinemann Educational Books: London, UK, 1978; pp. 1–50. [Google Scholar]
- Nicholson, S. Comments on “the south indian convergence zone and interannual rainfall variability over Southern Africa” and the question of ENSO’s influence on Southern Africa. J. Clim. 2003, 16, 555–562. [Google Scholar] [CrossRef]
- Afiesimama, E.A.; Pal, J.S.; Abiodun, B.J.; Gutowski, W.J.; Adedoyin, A. Simulation of West African monsoon using the RegCM3. Part I: Model validation and interannual variability. Theor. Appl. Clim. 2006, 86, 23–37. [Google Scholar] [CrossRef]
- Gbobaniyi, E.; Sarr, A.; Sylla, M.B.; Diallo, I.; Lennard, C.; Dosio, A.; Diedhiou, A.; Kamga, A.; Klutse, N.A.B.; Hewitson, B.; et al. Climatology, annual cycle and interannual variability of precipitation and temperature in CORDEX simulations over West Africa. Int. J. Clim. 2014, 34, 2241–2257. [Google Scholar] [CrossRef]
- Akinsanola, A.A.; Ogunjobi, K.O.; Ajayi, V.O.; Adefisan, E.A.; Omotosho, J.A.; Sanogo, S. Comparison of five gridded precipitation products at climatological scales over West Africa. Meteorol. Atmos. Phys. 2017, 129, 669–689. [Google Scholar] [CrossRef]
- Akinsanola, A.A.; Ajayi, V.; Adejare, A.; Oluwafemi, A.; Gbode, I.; Ogunjobi, K.; Nikulin, G.; Abolude, A.T. Evaluation of rainfall simulations over West Africa in dynamically downscaled CMIP5 global circulation models. Theor. Appl. Clim. 2018, 132, 437–450. [Google Scholar] [CrossRef]
- Taylor, K.E. Summarizing multiple aspect of model performance in a single diaram. J. Geophys. Res. 2001, 106, 7183–7192. [Google Scholar] [CrossRef]
- Racherla, P.N.; Shindell, D.T.; Faluvegi, G. The added value to global model projections of climate change by dynamical downscaling: A case study over the continental U.S. using the GISS-ModelE2 and WRF models. J. Geophys. Res. Atmos. 2012, 117, 8–15. [Google Scholar] [CrossRef] [Green Version]
- Shepard, D. A Two-Dimensional Interpolation Function for Irregularly-Spaced Data. In Proceedings of the 1968 23rd ACM National Conference, Las Vegas, NV, USA, 27–29 August 1968; Association for Computing Machinery (ACM): New York, NY, USA, 1968; pp. 517–524. [Google Scholar]
- Akinsanola, A.A.; Zhou, W. Understanding the variability of West African Summer Monsoon Rainfall: Contrasting tropospheric features and monsoon index. Atmosphere 2020, 11, 309. [Google Scholar] [CrossRef] [Green Version]
Figure 1.
Map of the study domain showing the elevation of the study area. The division between Sahel and Guinea Coast is outlined by the red line.
Figure 1.
Map of the study domain showing the elevation of the study area. The division between Sahel and Guinea Coast is outlined by the red line.

Figure 2.
Comparison of monthly spatial average precipitation (mm/month) over (a) Guinea Coast, (b) Sahel, and (c) West Africa from 1985 to 2014.
Figure 2.
Comparison of monthly spatial average precipitation (mm/month) over (a) Guinea Coast, (b) Sahel, and (c) West Africa from 1985 to 2014.
Figure 3.
Comparison of GCM simulation of daily climatology of precipitation (mm/day) from June to September with respect to Global Precipitation Climatology Centre (GPCC) data over West Africa.
Figure 3.
Comparison of GCM simulation of daily climatology of precipitation (mm/day) from June to September with respect to Global Precipitation Climatology Centre (GPCC) data over West Africa.
Figure 4.
Mean bias of the daily climatology of precipitation (mm/day) relative to GPCC data.
Figure 5.
Taylor diagram of mean daily precipitation from June to September of CMIP6, with GPCC as the observation data.
Figure 5.
Taylor diagram of mean daily precipitation from June to September of CMIP6, with GPCC as the observation data.
Figure 6.
The standardized precipitation anomaly in the simulation of (a) ensemble mean, (b) ECMWF, (c) CNRM, (d) HADGEM, (e) IPSL, (f) MPI, (g) MRI, and (h) NICAM models over West Africa. The observed results from CRU TS v.4.03 and UDEL v.5.01 are superimposed for comparison.
Figure 6.
The standardized precipitation anomaly in the simulation of (a) ensemble mean, (b) ECMWF, (c) CNRM, (d) HADGEM, (e) IPSL, (f) MPI, (g) MRI, and (h) NICAM models over West Africa. The observed results from CRU TS v.4.03 and UDEL v.5.01 are superimposed for comparison.
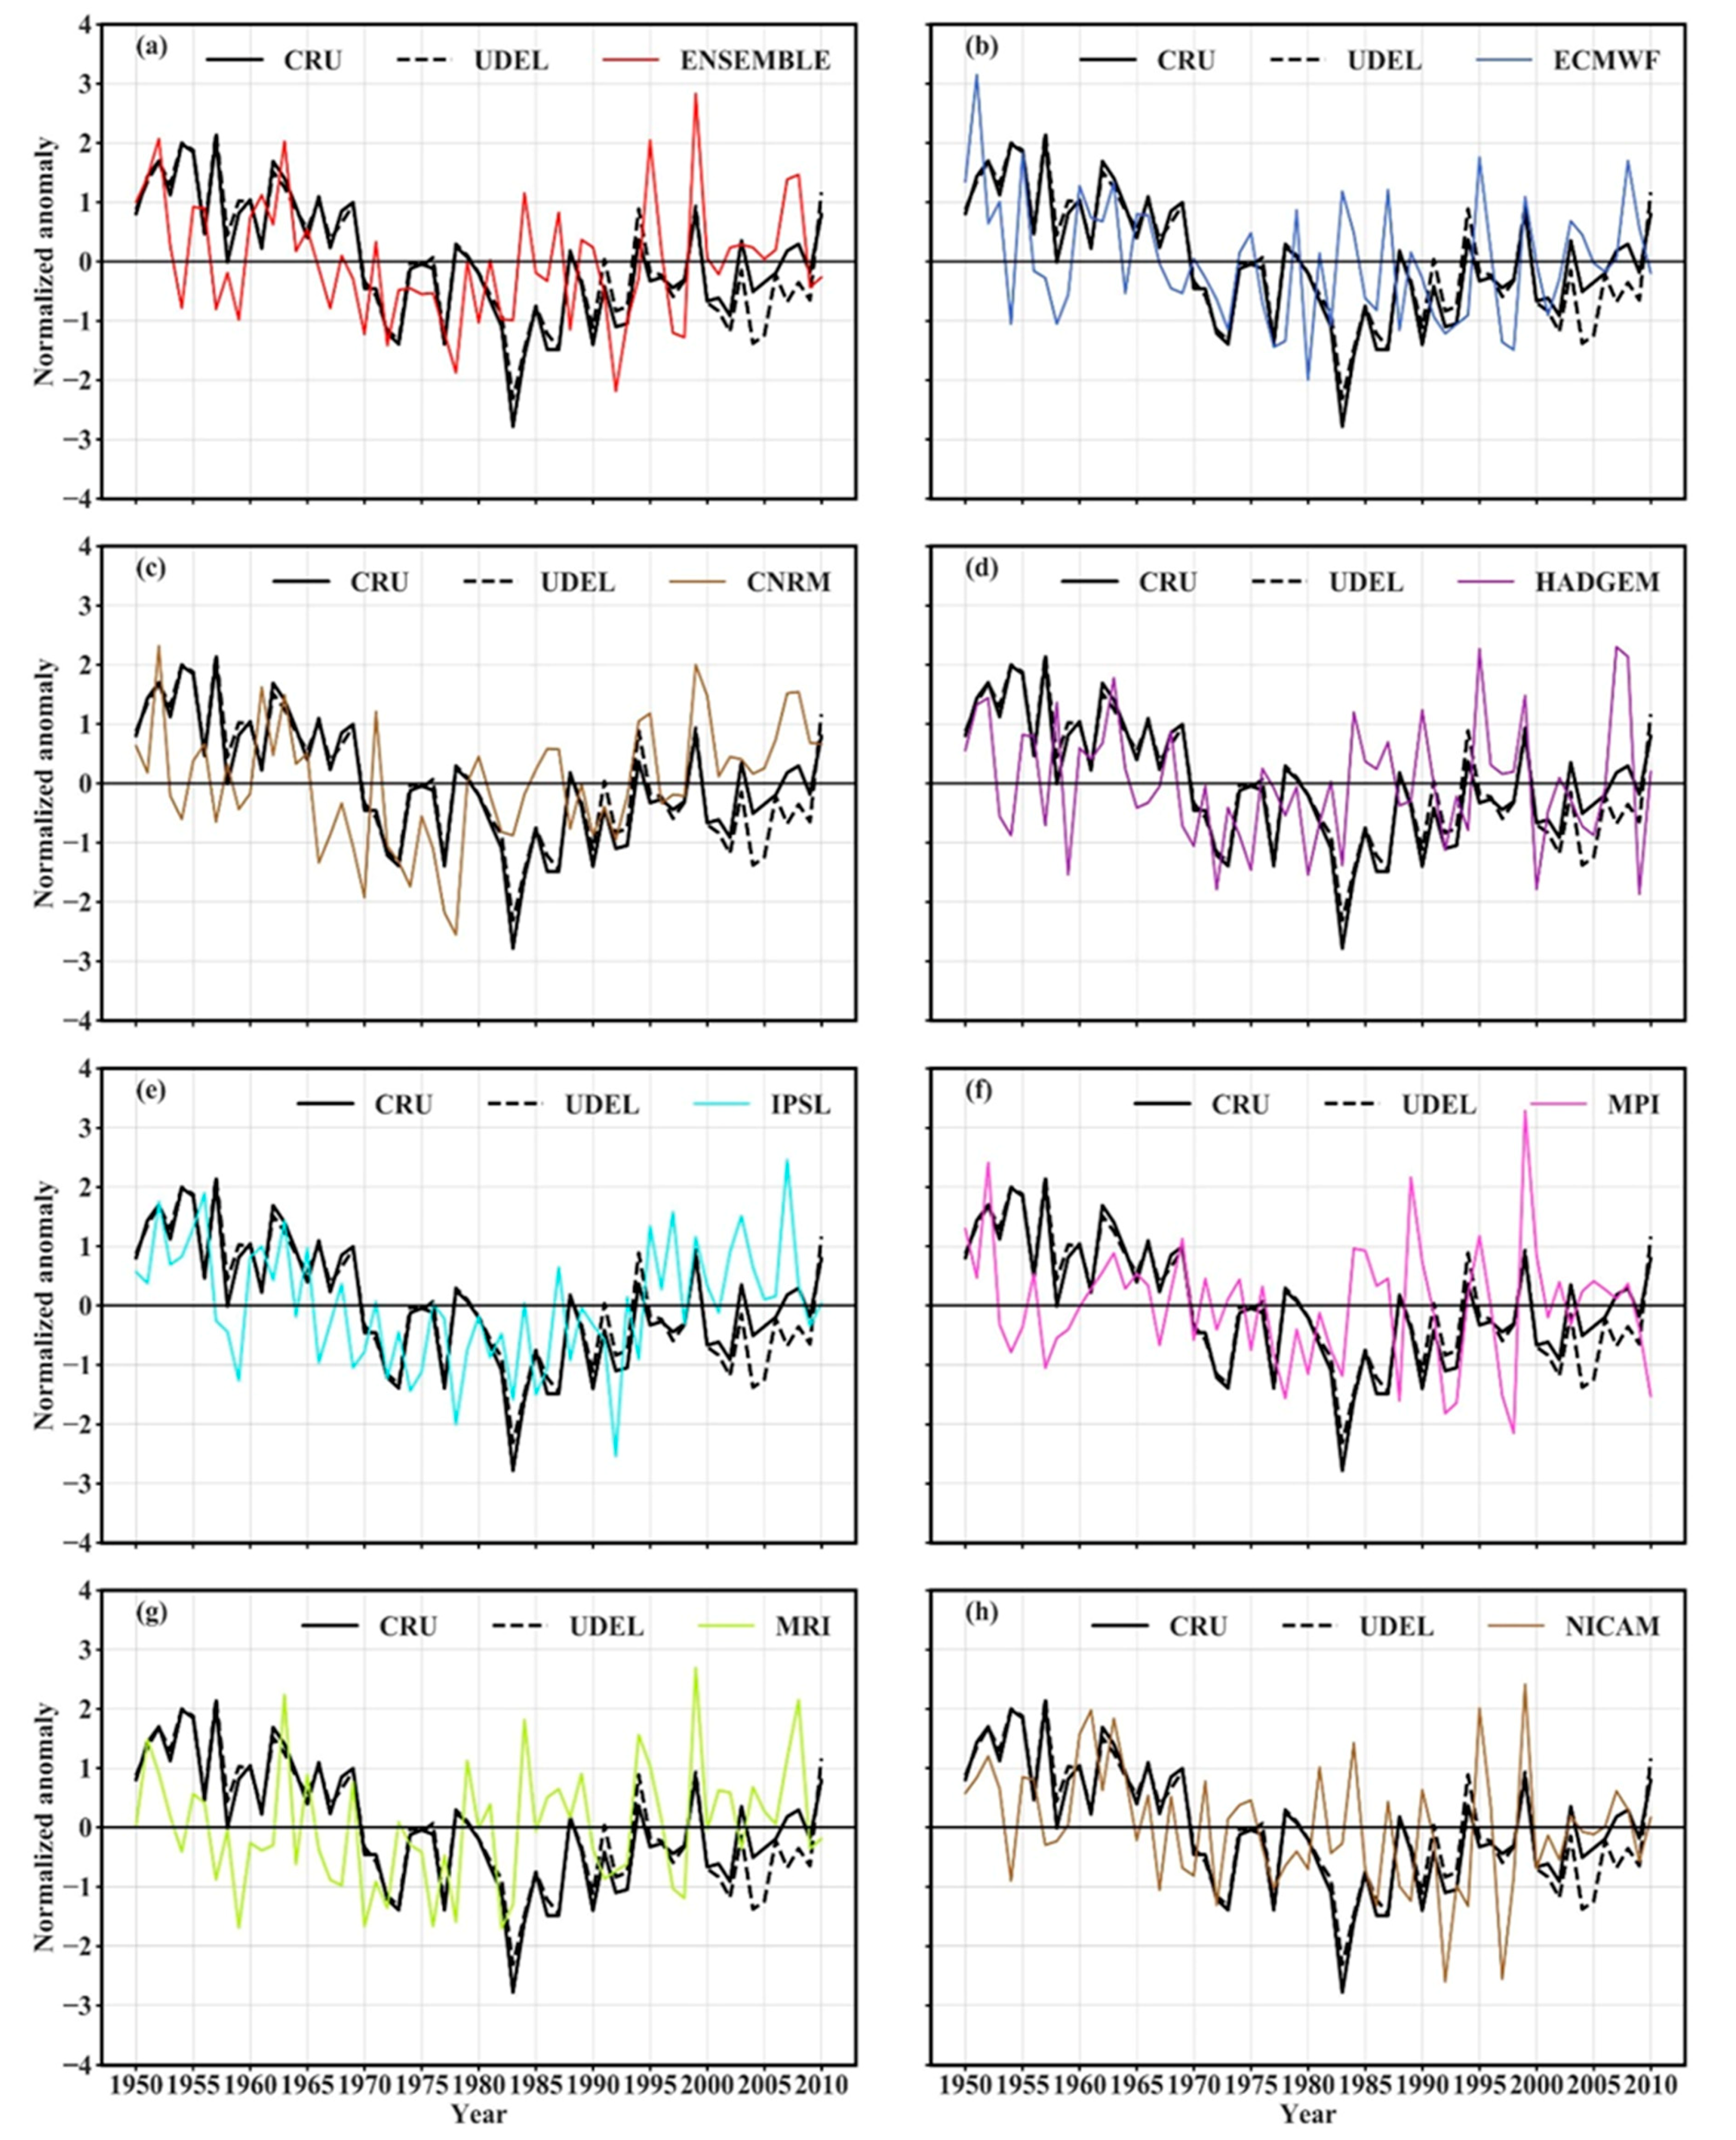
Figure 7.
The contrast of spatial pattern of 95th percentile mean precipitation (1985–2014) between GCM and the observation data (GPCC) over West Africa from June to September.
Figure 7.
The contrast of spatial pattern of 95th percentile mean precipitation (1985–2014) between GCM and the observation data (GPCC) over West Africa from June to September.
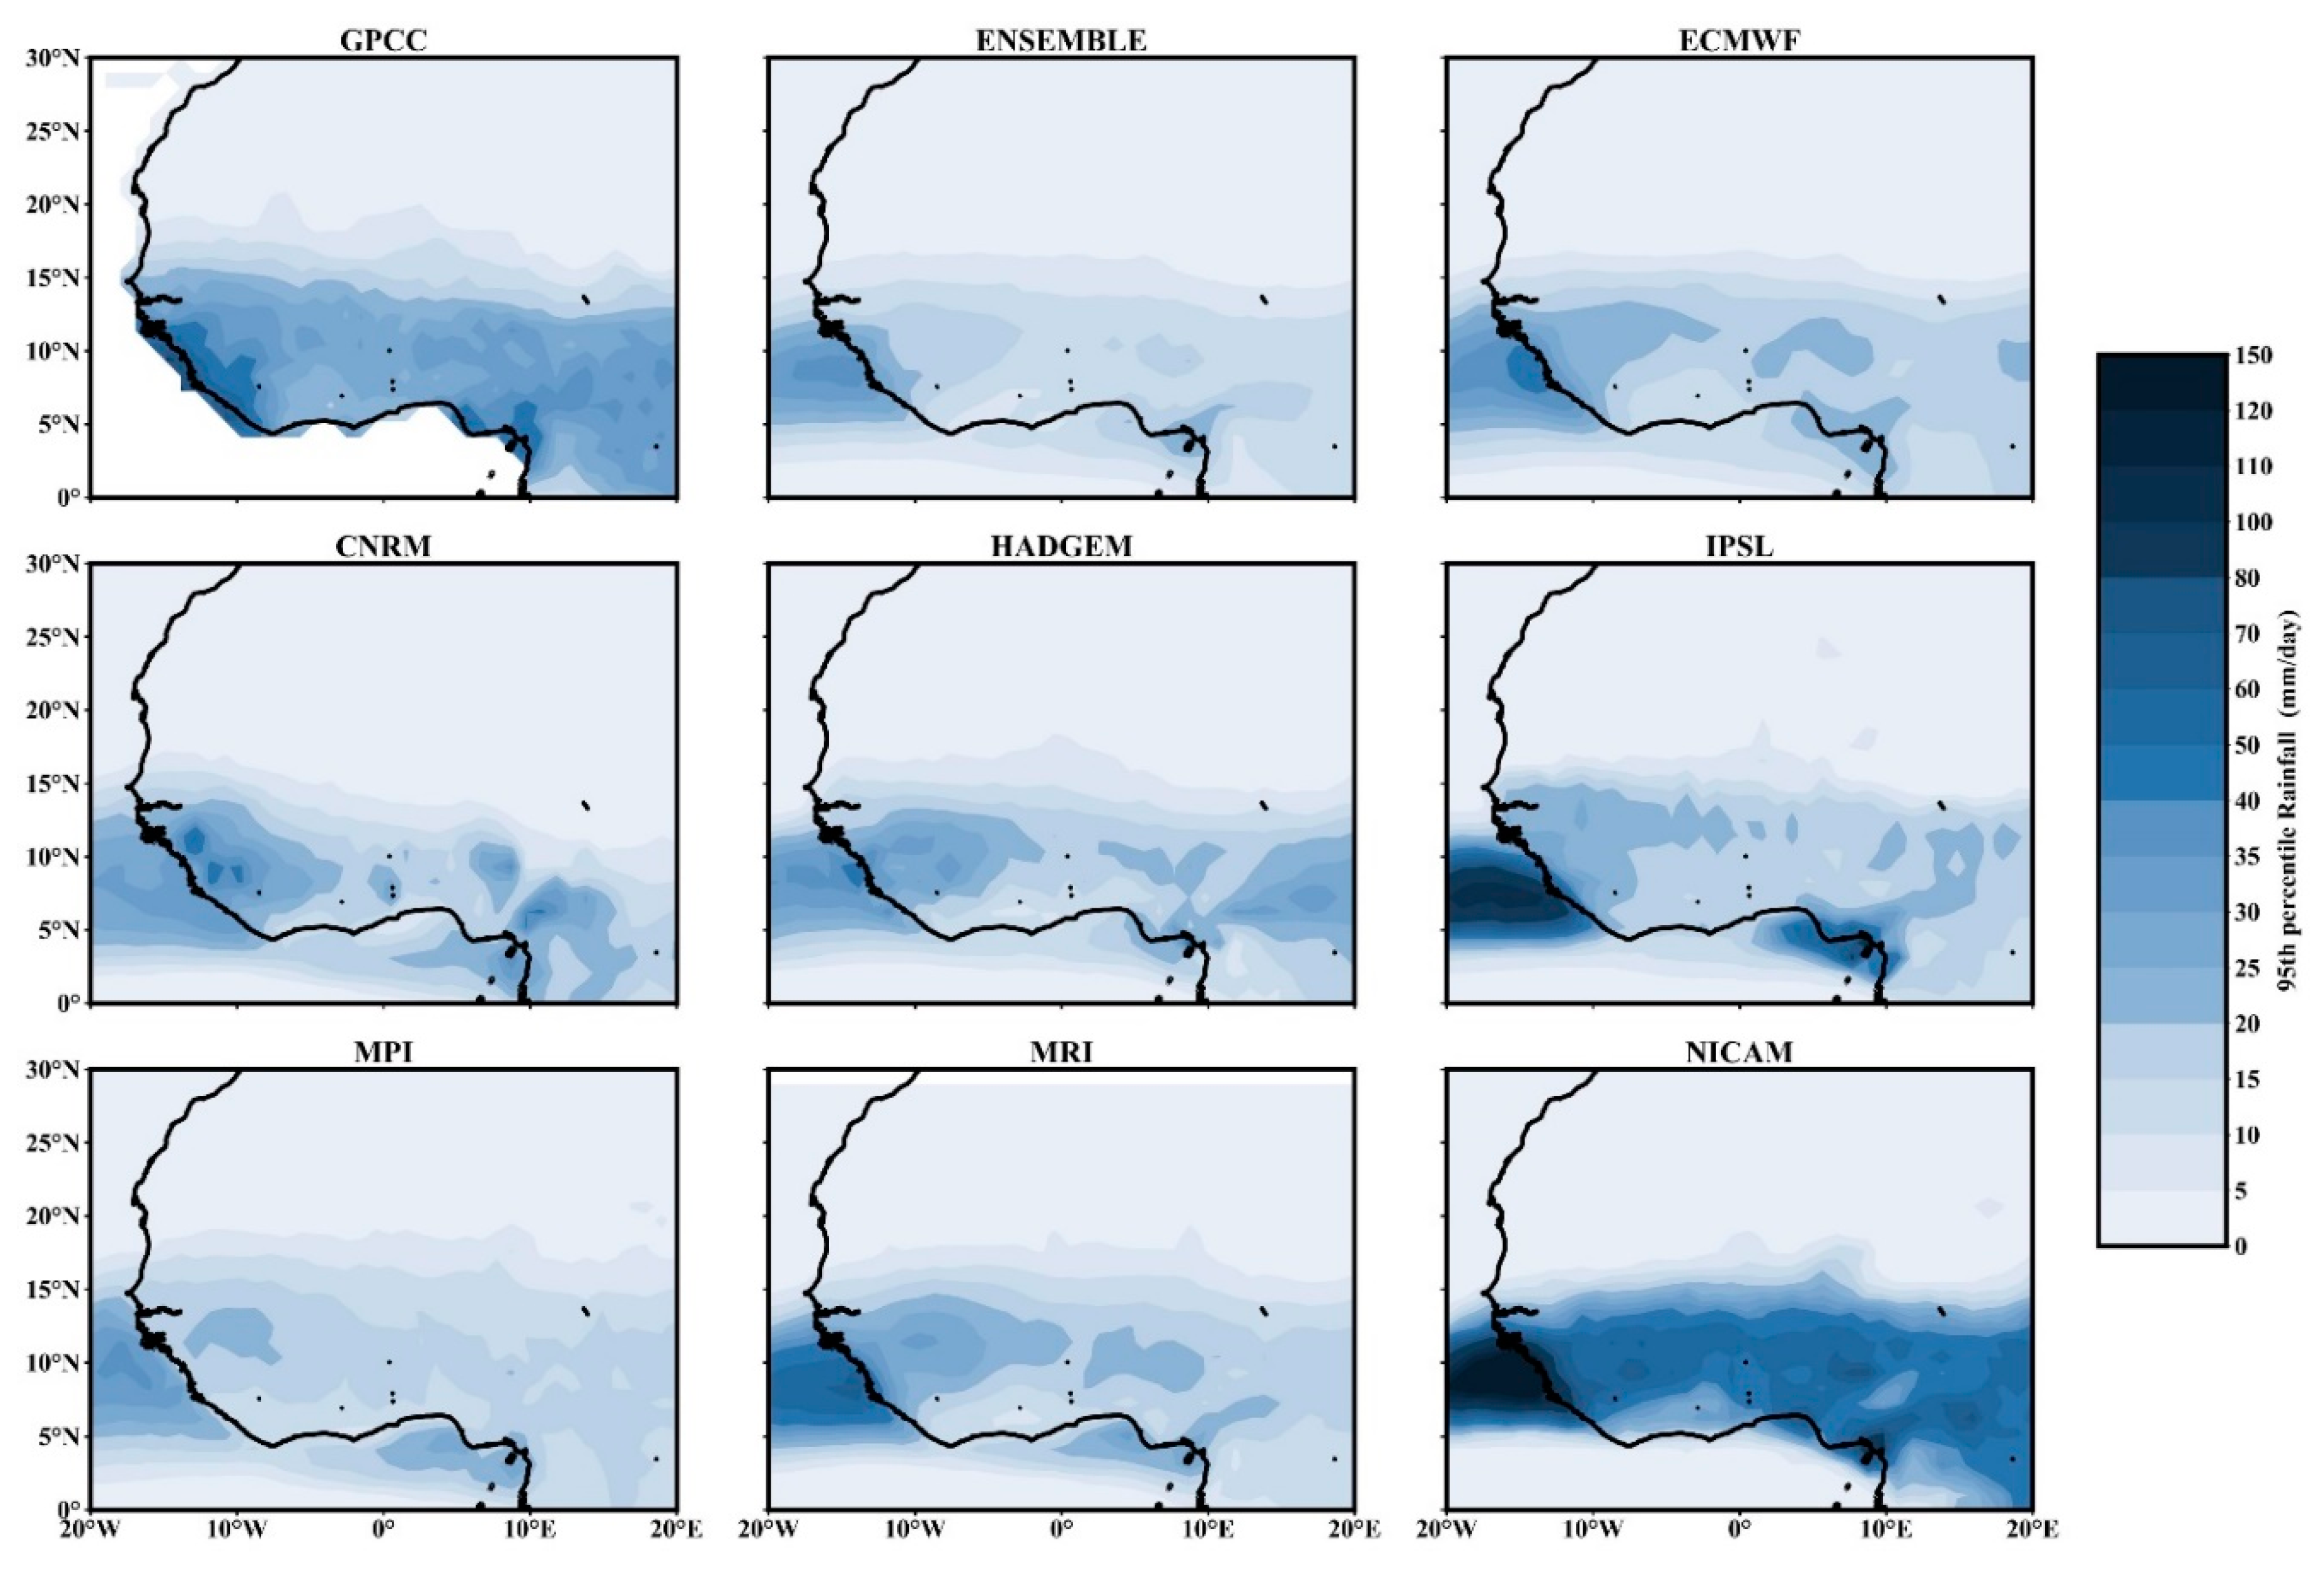
Figure 8.
The spatial pattern of mean bias of 95th percentile precipitation with respect to GPCC data.
Figure 8.
The spatial pattern of mean bias of 95th percentile precipitation with respect to GPCC data.
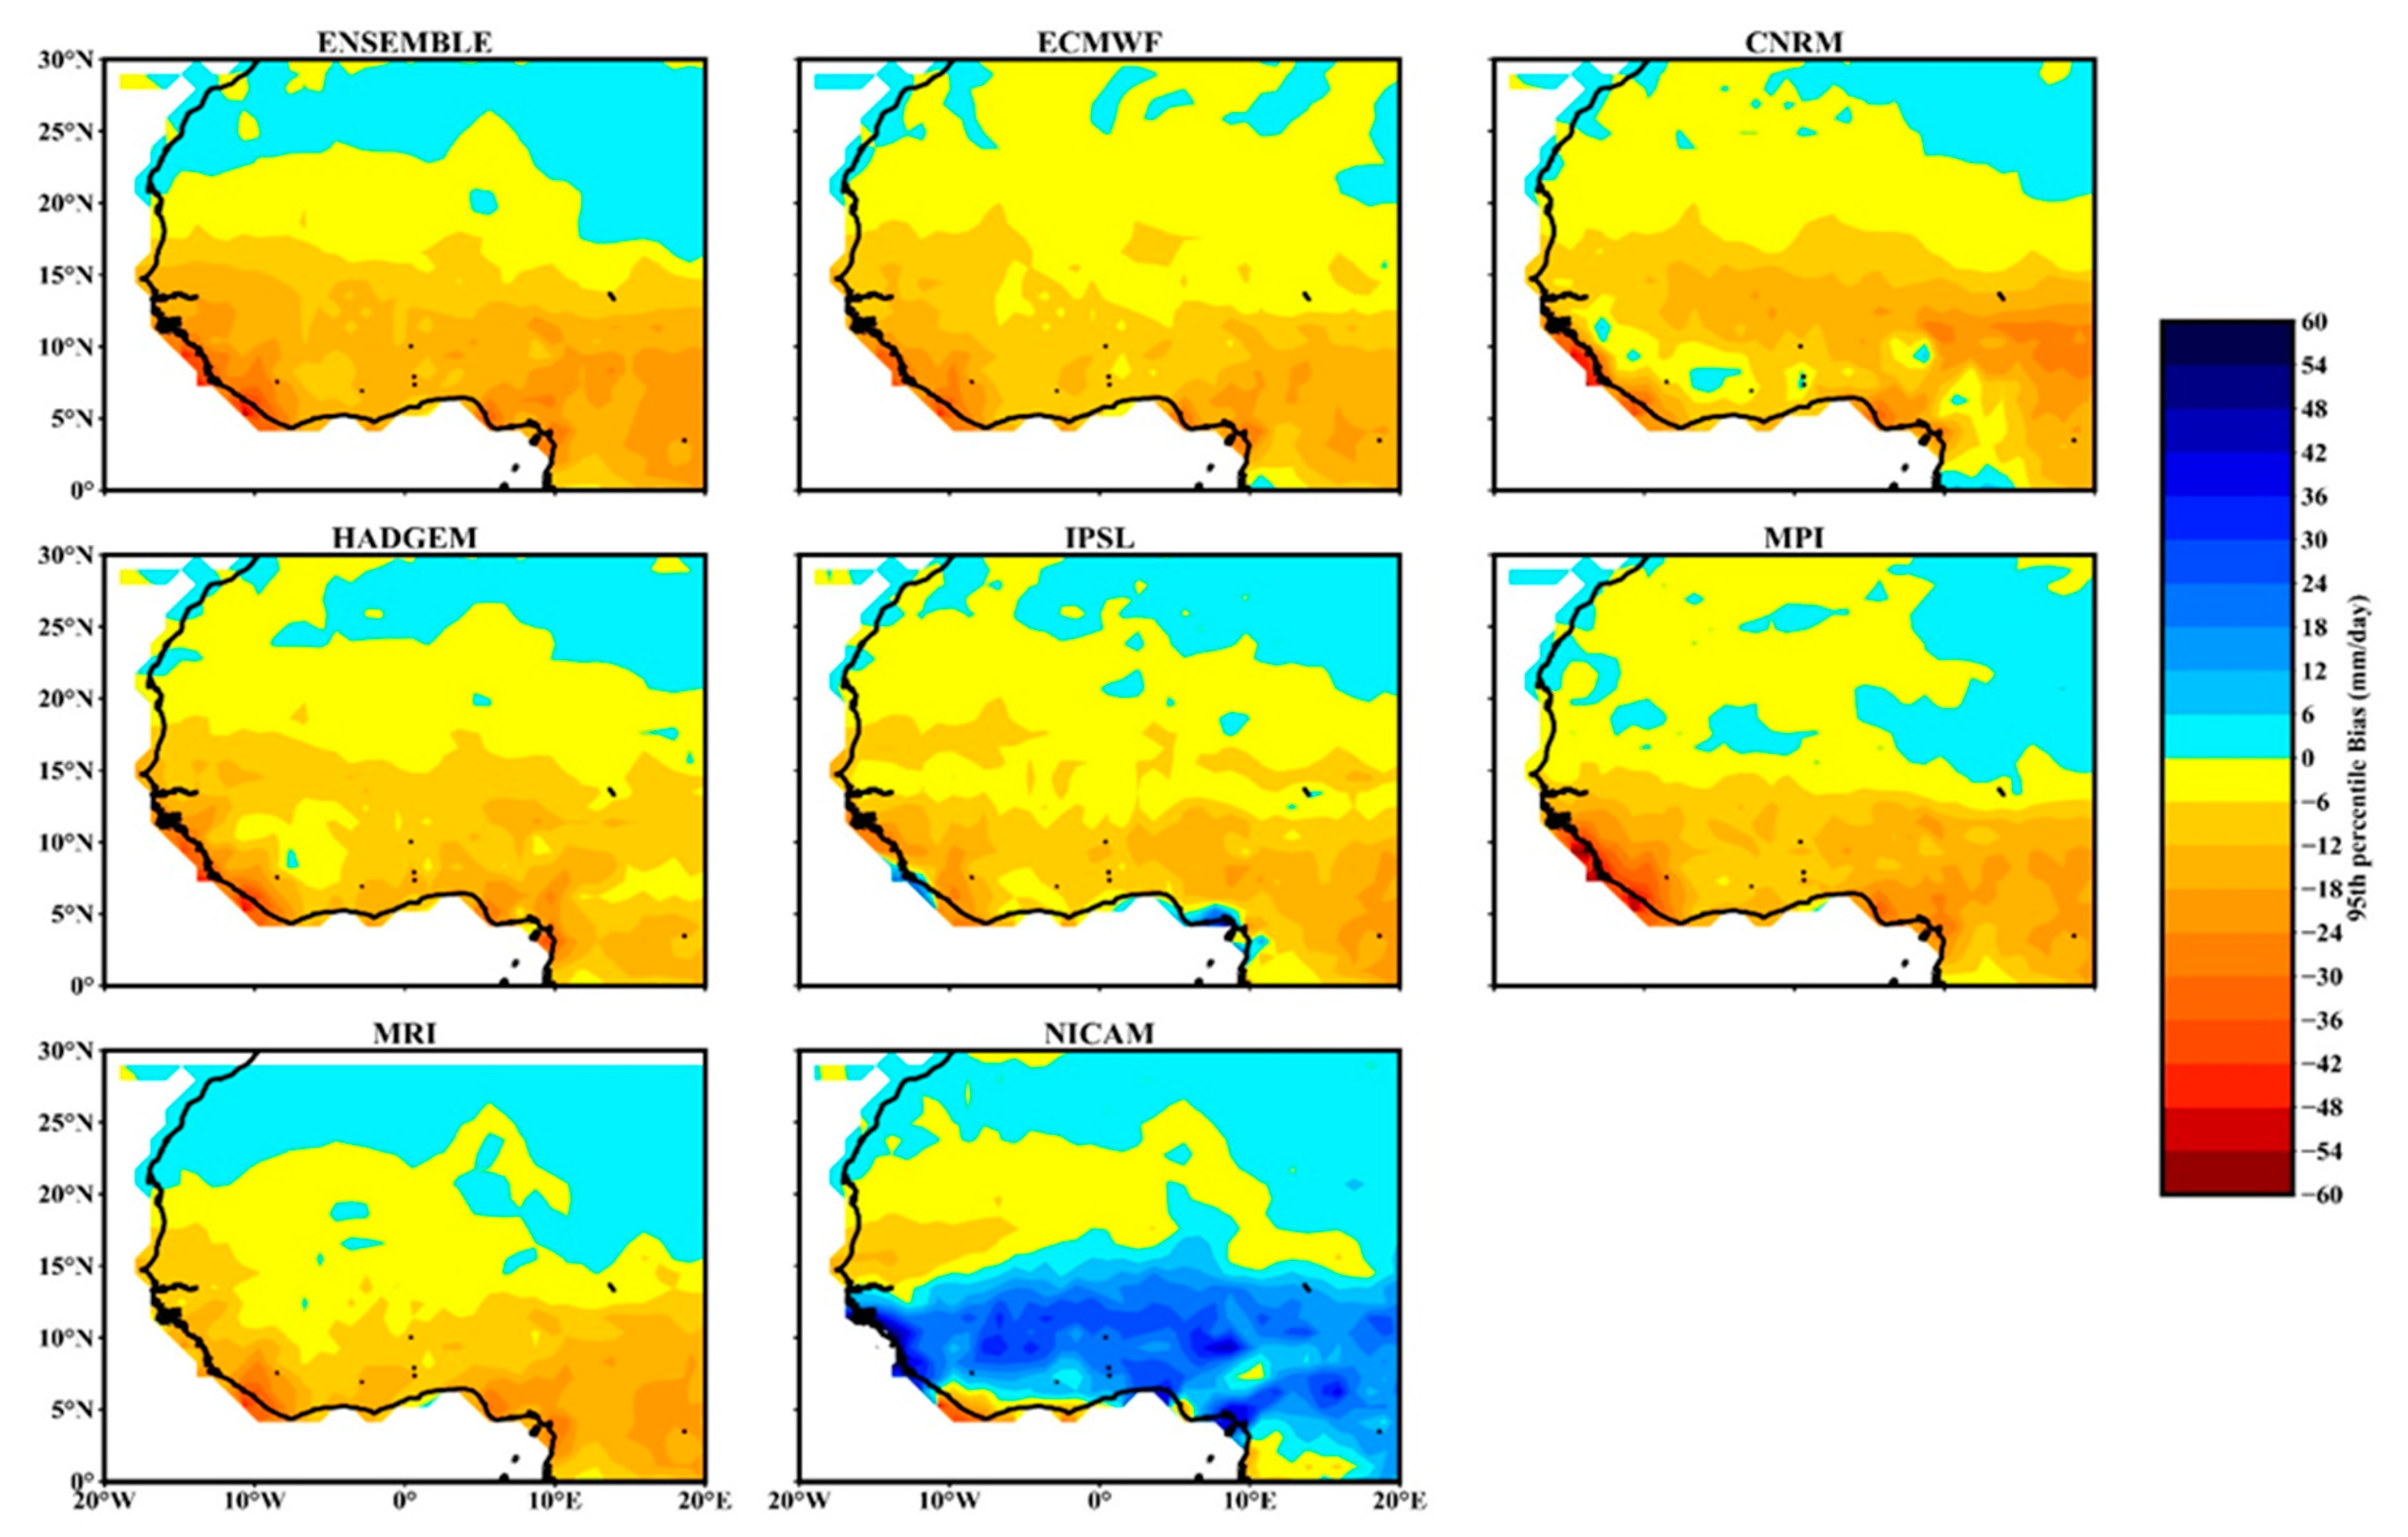
Figure 9.
Taylor diagram of extreme precipitation (R95p) anomaly over West Africa.
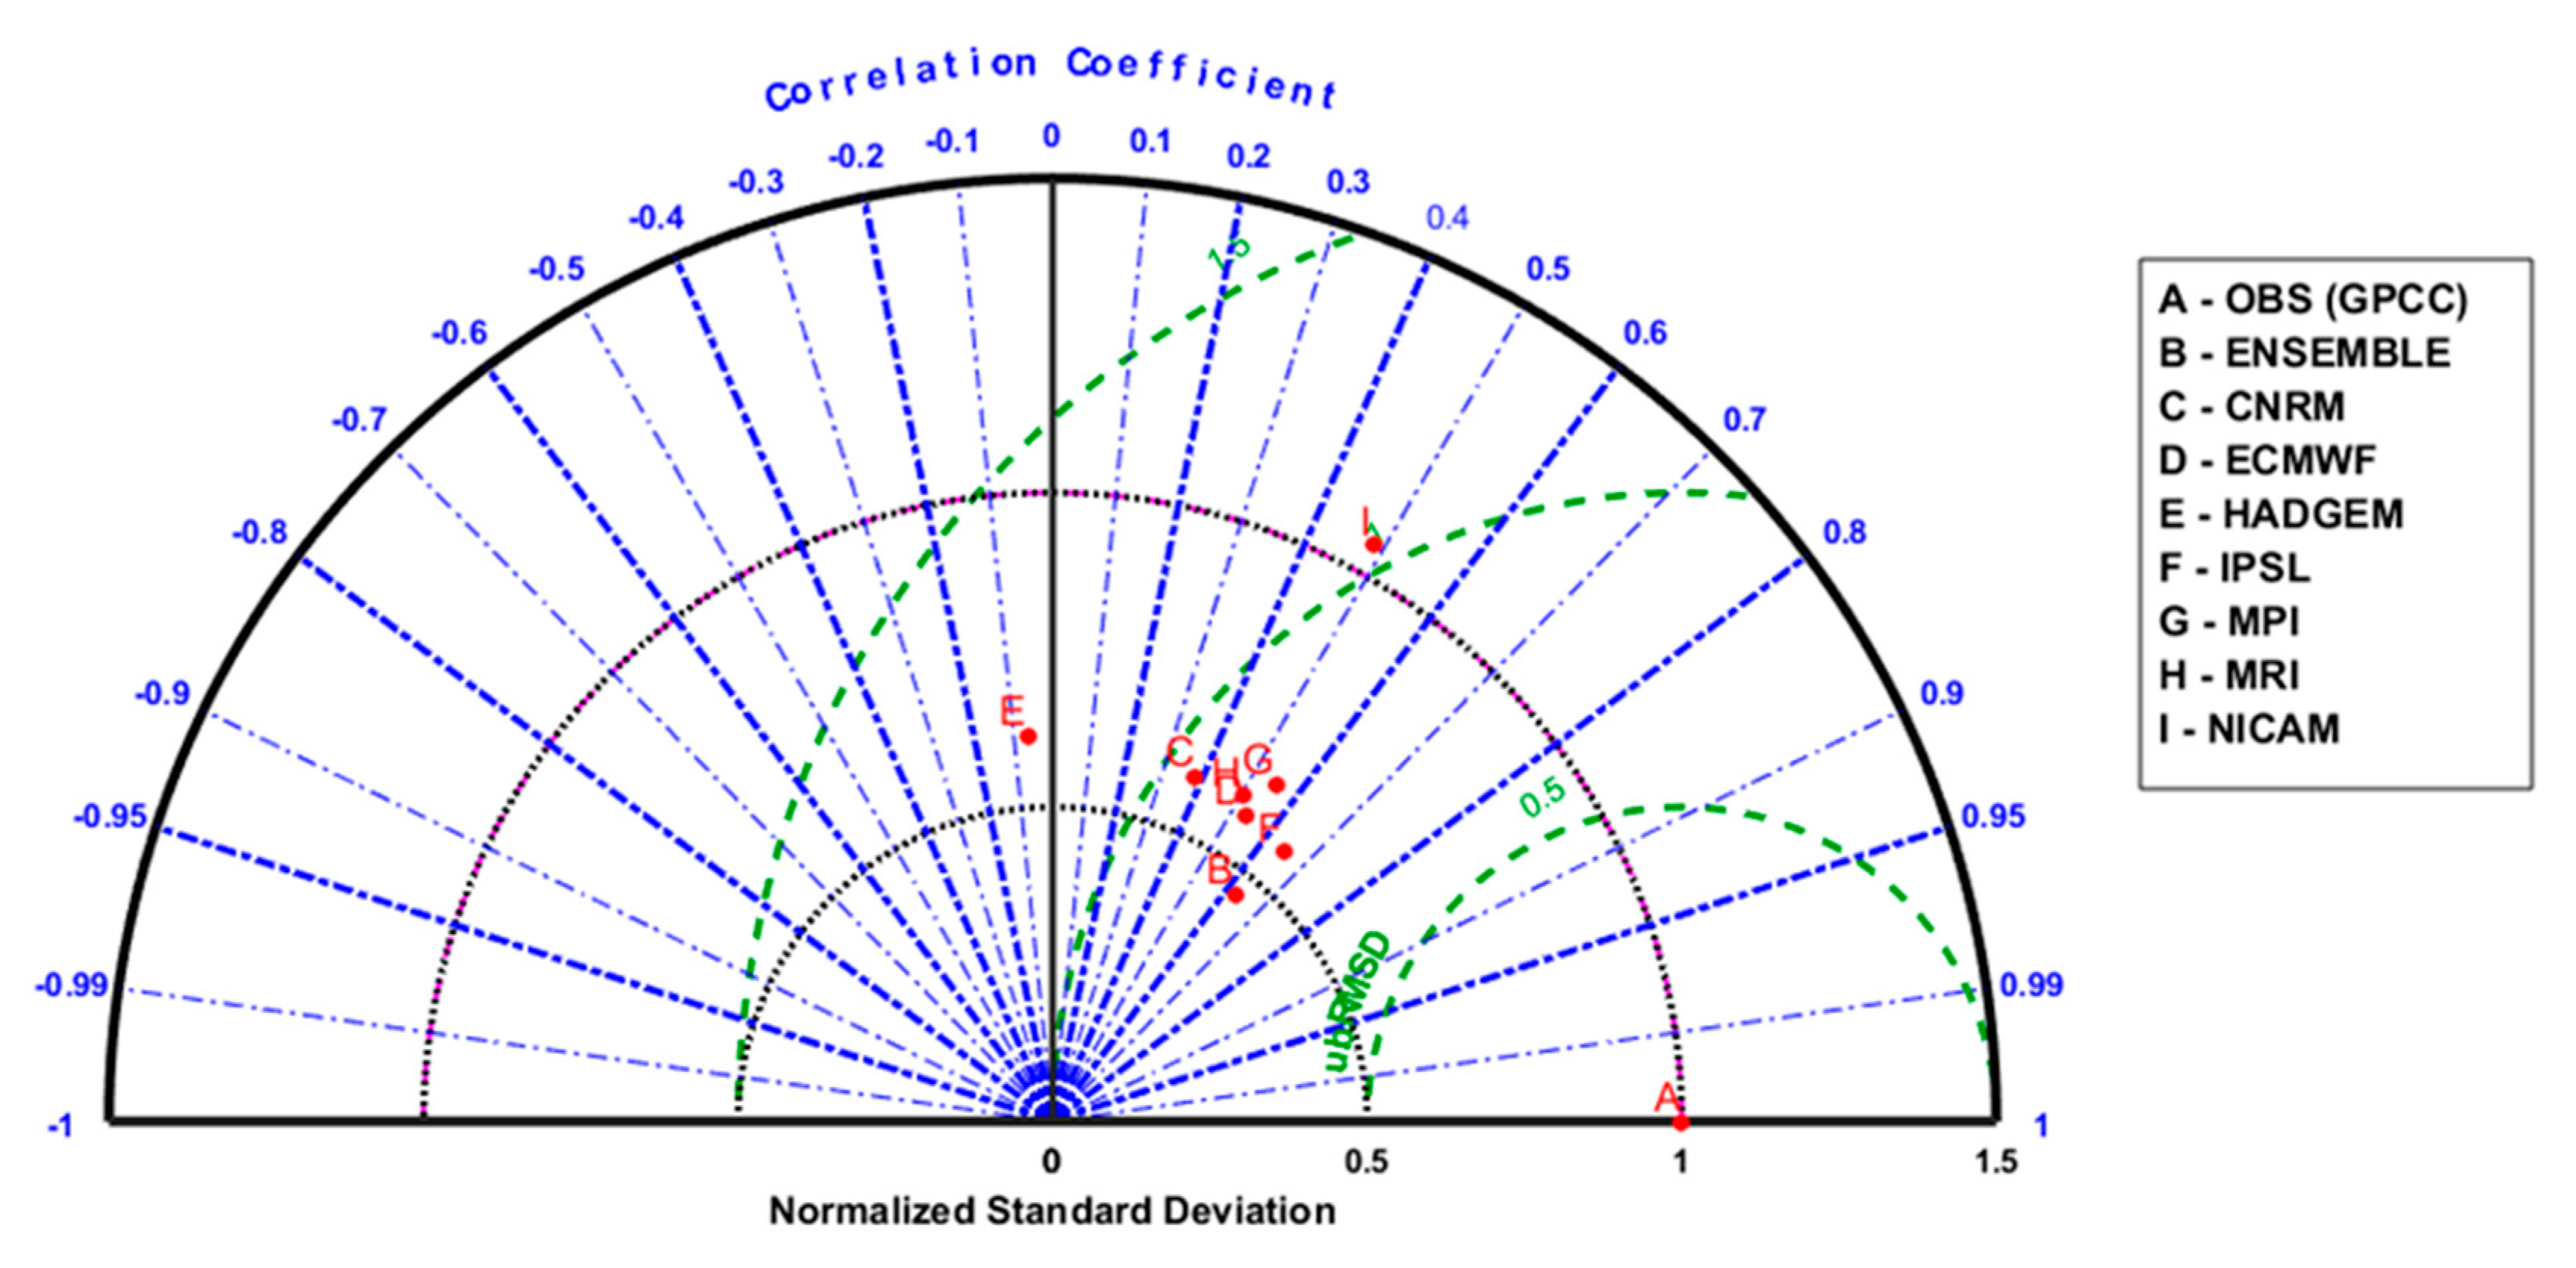
Figure 10.
The spatial pattern of a 30-year return level of extreme events among the GCMs and the GPCC observation data of precipitation over the June to September period between 1985–2014.
Figure 10.
The spatial pattern of a 30-year return level of extreme events among the GCMs and the GPCC observation data of precipitation over the June to September period between 1985–2014.

Table 1.
Brief description of the global climate models (GCMs) used in this study.
| Model Institute(s) | Model Name | Short Name | Country | Resolution |
|---|---|---|---|---|
| Centre National de Recherches Meteorologiques; Centre Europeen de Recherche et de Formation Avancee en Calcul Scientifique | CNRM-CM6-1 | CNRM | France | 0.5° × 0.5° |
| European Centre for Medium-Range Weather Forecasts | ECMWF-IFS-LR | ECMWF | UK | 1° × 1° |
| Institute Pierre Simon Laplace | IPSL-CM6A-ATM-HR | IPSL | France | 0.7° × 0.5° |
| Meteorological Research Institute | MRI-AGCM3-2-H | MRI | Japan | 0.56° × 0.56° |
| Max Planck Institute for Meteorology | MPI-M-MIP-ESM1.2-XR | MPI | Germany | 0.47° × 0.47° |
| Japan Agency For Marine-Earth Science and Technology; Atmosphere and Ocean Research Institute, University of Tokyo; National Institute for Environmental Studies; Riken Center for Computational Science | NICAM16-8S | NICAM | Japan | 0.28° × 0.28° |
| Met Office, Hadley Centre | MOHC-HadGEM3-GC31-HM | HADGEM | United Kingdom | 0.35° × 0.23° |
Table 2.
The difference in precipitation between 1955–1984 and 1985–2014 presented as a percentage.
| Models | Positive | Negative | No Change |
|---|---|---|---|
| CRU | 1.0 | 32.0 | 67.0 |
| UDEL | 0.0 | 18.0 | 82.0 |
| ENSEMBLE | 23.0 | 8.0 | 69.0 |
| ECMWF | 17.0 | 23.0 | 60.0 |
| CNRM | 39.0 | 2.0 | 59.0 |
| HADGEM | 12.0 | 8.0 | 80.0 |
| 1PSL | 17.0 | 8.0 | 75.0 |
| MPI | 25.0 | 10.0 | 65.0 |
| MRI | 45.0 | 3.0 | 52.0 |
| NICAM | 4.0 | 21.0 | 75.0 |
Table 3.
Return level percentage grid change between the observation and GCMs.
| GCM | Positive | Negative | No Change |
|---|---|---|---|
| Ensemble | 0.0 | 41.0 | 59.0 |
| ECMWF | 0.0 | 27.0 | 73.0 |
| CNRM | 0.0 | 33.0 | 67.0 |
| HADGEM | 0.0 | 22.0 | 78.0 |
| IPSL | 1.0 | 21.0 | 77.0 |
| MPI | 0.0 | 34.0 | 66.0 |
| MRI | 0.0 | 22.0 | 78.0 |
| NICAM | 45.0 | 1.0 | 54.0 |
© 2020 by the authors. Licensee MDPI, Basel, Switzerland. This article is an open access article distributed under the terms and conditions of the Creative Commons Attribution (CC BY) license (http://creativecommons.org/licenses/by/4.0/).
Share and Cite
MDPI and ACS Style
Ajibola, F.O.; Zhou, B.; Tchalim Gnitou, G.; Onyejuruwa, A. Evaluation of the Performance of CMIP6 HighResMIP on West African Precipitation. Atmosphere 2020, 11, 1053. https://doi.org/10.3390/atmos11101053
AMA Style
Ajibola FO, Zhou B, Tchalim Gnitou G, Onyejuruwa A. Evaluation of the Performance of CMIP6 HighResMIP on West African Precipitation. Atmosphere. 2020; 11(10):1053. https://doi.org/10.3390/atmos11101053
Chicago/Turabian StyleAjibola, Felix Olabamiji, Botao Zhou, Gnim Tchalim Gnitou, and Anselem Onyejuruwa. 2020. "Evaluation of the Performance of CMIP6 HighResMIP on West African Precipitation" Atmosphere 11, no. 10: 1053. https://doi.org/10.3390/atmos11101053
Note that from the first issue of 2016, this journal uses article numbers instead of page numbers. See further details here.