Article

Effects of Ozone and Clouds on Temporal Variability of Surface UV Radiation and UV Resources over Northern Eurasia Derived from Measurements and Modeling

by
Natalia E. Chubarova
1,*,
Anna S. Pastukhova
1,
Ekaterina Y. Zhdanova
1,
Elena V. Volpert
1,
Sergey P. Smyshlyaev
2 and
Vener Y. Galin
3
1
Faculty of Geography, Lomonosov Moscow State University, GSP-1, Leninskie Gory, 1119991 Moscow, Russia
2
Russian State Hydrometeorological University, Malookhtinsky Ave., 98, 195196 Saint-Petersburg, Russia
3
Institute of Numerical Mathematics RAS, Gubkina str., 8, 119991 Moscow, Russia
*
Author to whom correspondence should be addressed.
Atmosphere 2020, 11(1), 59; https://doi.org/10.3390/atmos11010059
Submission received: 25 November 2019 / Revised: 23 December 2019 / Accepted: 23 December 2019 / Published: 2 January 2020
(This article belongs to the Special Issue Ozone Evolution in the Past and Future)

Abstract

:
Temporal variability in erythemal radiation over Northern Eurasia (40°–80° N, 10° W–180° E) due to total ozone column (X) and cloudiness was assessed by using retrievals from ERA-Interim reanalysis, TOMS/OMI satellite measurements, and INM-RSHU chemistry–climate model (CCM) for the 1979–2015 period. For clear-sky conditions during spring and summer, consistent trends in erythemal daily doses (Eery) up to +3%/decade, attributed to decreases in X, were calculated from the three datasets. Model experiments suggest that anthropogenic emissions of ozone-depleting substances were the largest contributor to Eery trends, while volcanic aerosol and changes in sea surface temperature also played an important role. For all-sky conditions, Eery trends, calculated from the ERA-Interim and TOMS/OMI data over the territory of Eastern Europe, Siberia and Northeastern Asia, were significantly larger (up to +5–8%/decade) due to a combination of decrease in ozone and cloudiness. In contrast, all-sky maximum trends in Eery, calculated from the CCM results, were only +3–4%/decade. While Eery trends for Northern Eurasia were generally positive, negative trends were observed in July over central Arctic regions due to an increase in cloudiness. Finally, changes in the ultraviolet (UV) resources (characteristics of UV radiation for beneficial (vitamin D production) or adverse (sunburn) effects on human health) were assessed. When defining a “UV optimum” condition with the best balance in Eery for human health, the observed increases in Eery led to a noticeable reduction of the area with UV optimum for skin types 1 and 2, especially in April. In contrast, in central Arctic regions, decreases in Eery in July resulted in a change from “UV excess” to “UV optimum” conditions for skin types 2 and 3.

1. Introduction

Ultraviolet (UV) radiation is well-known for its significant influence on human health and the environment. High UV doses have negative effects on skin (erythema (sunburn), skin cancer), and cause eye diseases and immune suppression [1,2]. However, moderate UV doses have positive effects causing vitamin D production [3,4]. Apart from the solar elevation, ozone and cloudiness are the main factors affecting UV level [2,5] and providing significant year-to-year variability of UV radiation. Erythemal radiation, which is used for characterizing UV health effects, is the UV radiation, weighted by the erythemal action spectrum with maximum efficiency at 280–300 nm and integrated over 280–400 nm [1].
As stated in numerous publications and assessments [5,6,7,8], the decrease in stratospheric ozone resulting from anthropogenic emissions of ozone depleting substances (ODSs) into the atmosphere has led to the increase in erythemal radiation at the Earth’s surface in the 1980s and 1990s. Since the end of 1990s there is a small increase in total ozone content from 0.3% to 1.2% per decade due to the reduction of the ODSs in the stratosphere but this increase is not statistically significant [8]. However, there is no clear relationship between total ozone column (X) and erythemal radiation for many regions due to the influence of other factors like cloudiness, aerosols, minor gas species, and surface reflectivity [9,10]. The most important atmospheric factor is cloudiness, which significantly affects erythemal radiation and can enhance or mask its trends due to ozone changes.
There are a lot of studies devoted to the temporal and spatial variability of erythemal radiation over the globe or large spatial areas using the retrievals from satellite instruments, and model simulations [9,10,11], and references therein]. According to these data, different kinds of UV climatologies at various spatial scale have been obtained [12,13,14,15]. In addition to the UV climatologies, many publications are devoted to the analysis of temporal changes in Eery due to ozone and cloudiness. In [16] the analysis of satellite data over the globe has revealed an increase in erythemal radiation of about 8% at 50° S and of about 5% at 50° N over the 1978–2008 period due to decrease in X, while the combined effect of ozone and cloudiness led to the increase of about 2% at 50° S and 6% at 50° N. The changes in erythemal radiation, evaluated over the 1979–2010 period using TOMS/OMI retrievals, have also shown positive trends up to 5% at 45°–50° S in spring–summer seasons [17]. A statistically significant decrease in Lambertian Equivalent Reflectivity due to clouds (3.6 ± 0.02%) over the 1979–2011 period was derived from different satellite measurements [18,19]. However, satellite data have a large uncertainty due to problems with accounting for absorbing aerosol and due to the restrictions in UV retrievals over bright snow/ice surfaces [20,21] compared with direct ground-based measurements.
Many publications are devoted to the analysis of temporal variations in UV radiation obtained over local sites ([2] and references therein, [22,23,24,25,26,27,28,29,30,31,32,33]). According to these publications, an increase of UV radiation has been revealed over many European sites since the middle of 20 century, mainly due to ozone and cloud effects [28,29,31,33]. Over several locations (e.g., Thessaloniki) the increase in Eery to some extent can be also attributed to the decrease in aerosol optical thickness [34]. However, in the west Arctic area at Hornsund (77°00′ N, 15°33′ E) no pronounced trend in Eery has been found since 1983 due to complicated changes in cloud cover, which is one of the basic drivers of the long-term UV changes over this region [30].
Over Europe the UV climatology and long-term variability in erythemal radiation was analyzed within the framework of the COST Action 726 project [32] using accurate model simulations, the results of ERA-40 reanalysis over the five-decade period since 1950, and ground-based measurements. These data also demonstrate pronounced variations in Eery due to ozone and cloudiness with some specific features over different areas.
For evaluating variations in Eery in the past and future, global Earth-system models from the CMIP-5 (Coupled Model Intercomparison Project Phase 5) experiment, the ensemble mean of the Community Earth System Model version 1 (CESM1) and the Whole Atmosphere Community Climate Model (WACCM) with interactive chemistry ensemble of model ozone predictions have been used for estimating the UV variability over the 1955–2100 period [5]. Using this approach, the effects of various factors on future UV variations were estimated. Chemistry–climate models (CCMs) have also been used for estimating changes in UV radiation in the past and future [9,11,35,36,37,38]. In [35] the projections of erythemal irradiance from 1960 to 2100 have been made using radiative transfer calculations and projections of ozone, temperature and cloud change from 14 CCM, as part of the CCMVal-2 activity of SPARC (Stratosphere-troposphere Processes And their Role in Climate) project. According to this study annually mean erythemal radiation in the 2090s relative to 1980 will be on average approximately 12% lower at high latitudes in both hemispheres, and 3% lower at midlatitudes. At northern high latitudes, the increase in cloudiness towards the end of the 21st century will reduce the erythemal irradiance by 5% with respect to the 1960s.
In Ref. [37] the analysis of Eery variations has been made by using the clear-sky data from the first phase of the Chemistry–Climate Model Initiative (CCMI) as input to the TUV (Tropospheric Ultraviolet and Visible) radiation model. This analysis projects an increase in average Eery of about 2–4% in 2100 in the tropical belt (30° N–30° S) and a 1.8% to 3.4% increase in the midlatitudes in the Southern Hemisphere for RCP (Representative Concentration Pathway) 2.6, 4.5 and 6.0, compared to 1960s, which partly contradict to the results obtained in [35]. The projected increase in Eery reported in [37] results from the assumption that the atmospheric aerosol loading will decrease greatly over the course of the 21st century, which is debatable. The analysis of erythemal radiation according to the CCMI simulations [2] projects Eery to decrease by 5–15% in the northern hemisphere during summer and autumn mainly due to ozone recovery in 2085–2095 compared with 2010–2020 according to the RCP 6.0 scenario. However, some other factors like cloudiness, aerosol and surface reflectivity can also play a significant role over several regions. In [39] negative Eery changes over Northern midlatitudes of about 6–8% due to ozone and clouds were found by the end of 21 century, which are in agreement with [35].
For a wide range of biological and medical studies, it is important to interpret long-term changes in UV radiation from the point of health effects. The approach proposed in [14] distinguishes health effects between harmful and beneficial using the term “UV resources”. The UV resources characterize UV radiation from the point of beneficial (vitamin D production) or adverse (sunburn) effects on human health. Their classification is given in the categories of UV deficiency, UV optimum and UV excess and takes into account the skin type and the fraction of the skin surface that is exposed to UV radiation. A similar approach has been previously developed in [40]. Changes in UV resources over the 1979–2015 period were first simulated for Moscow conditions in [28], where a transition from the UV optimum to UV moderate excess conditions for the population with the most vulnerable skin type I has been obtained in spring.
The main aim of this study is to identify temporal variability in Eery and the change in UV resources due to ozone and cloudiness between 1979 and 2015 based on the TOMS/OMI satellite datasets, and UV retrievals from the reanalysis and a chemistry–climate model over Northern Eurasia (40° N–80° N, 10° W–180° E). We chose this period since it was characterized by the most pronounced changes in Eery, and the quality of data is the most reliable. In the analysis we used the updated TOMS and OMI satellite UV retrievals using the new Macv2 absorbing aerosol correction [41], as well as the ERA-Interim Reanalysis data [42]. For revealing the causes of changes in ozone we applied model runs of the Russian Chemistry–Climate Model (CCM), which was jointly developed by the Institute of Numerical Mathematics RAS (INM) and Russian State Hydrometeorological University (RSHU) [43,44].

2. Methods and the Data Description

Long-term variability in Eery over Northern Eurasia was estimated using different datasets, which include the UV data from model, reanalysis, and satellite measurements. For evaluating the UV variability and increasing the efficiency of the simulations, we estimated the relative anomalies Vi in Eery as a sum of anomalies due to total ozone amount (v1i,j (X)) and due to cloud variations (v2i,j (Cl)). The approach is appropriate, since ozone and cloudiness are located at different levels of the atmosphere. This simple additive method has been used in the UV reconstruction model described in [33], where a good agreement has been shown between results obtained with this method and the observed interannual Eery variations. It was also applied for reconstructing the long-term UV variability over Moscow in [10]. The total Eery anomalies Vi for year i can be estimated with the following equation:
V i = j ( W j ( h e )   ( ν 1 i , j ( X ) + ν 2 i , j ( C l ) ) / j W j ( h e ) ,
where index i and j correspond to a year and a month number respectively. Wj (he) is a weighting function, which is calculated using the effective solar elevation he.
For an accurate estimation of the effective solar elevation we used simulations of h with 1-hour resolution over a month. An effective solar elevation for each grid was estimated only for hours with h > 0. The annual solar elevation changes were accounted in W (he), using a power law dependence (Eery ~ he α), where α = 2 according to [45]. The same W (he) correction has been applied to all three datasets (INM-RSHU CCM, ERA-Interim, and TOMS/OMI). In our simulations, we calculated anomalies (v1i,j (X) and v2i,j (Cl)) relative to 2000.
To evaluate the interannual changes in Eery due to ozone, we used a well-known Radiation Amplification Factor (RAF) technique [46]:
log(Eeryi,j) = −RAF × log(Xi,j) + C,
where C is a constant.
In addition, we took into account that the RAF for erythemal irradiance depends on solar elevation. We used the following equation according to [47] to parameterize this relationship:
RAF(he) = −1.10 × 10⁻⁴he2 + 1.57 × 10⁻²he + 0.665
As a result, variations v1i,j can be written in the following way:
v 1 i , j ( X ) = ( X i , j X 2000 , j X 2000 , j ) R A F ( h e ( j ) ) ,
where the index 2000 indicates the year 2000, and, hence, X 2000 , j is a monthly total ozone column in 2000.
In order to characterize both cloud geometry and cloud optical properties effects on Eery we applied Cloud Modification Factor for UV spectral region (CMFUV), which is often used for this purpose [5,38] and can be estimated from the standard outputs (downward shortwave radiation in clear-sky and in cloudy conditions) of different CCMs and reanalysis datasets. Using these data, one can easily evaluate shortwave radiation cloud modification factor (CMF):
C M F = Q / Q 0 ,
where Q is the surface shortwave radiation in cloudy sky conditions, and Q0 is the surface shortwave radiation in the cloudless atmosphere.
The spectral correction of the cloud modification factor was obtained using accurate model simulations in UV and total shortwave spectrum according to the 8-stream discrete ordinate radiative transfer method in the TUV model [48] and Monte-Carlo simulations [49] for different atmospheric conditions and solar elevations. As a result, we showed that for optically thin cloudiness with CMF > 0.95 we can neglect its spectral dependence, while a correction should be used in other conditions. According to [28], this correction is the following:
CMFUV = (0.1417 × sin(he)2 − 0.175 × sin(he) + 1.054)CMF(−0.04 × sin(he)2 + 0.554 × sin(he) + 0.609)
The proposed method has been successfully tested against the long-term measurements of erythema radiation at the Moscow State University Meteorological Observatory over the 1999–2015 period [28].
To account for total ozone and cloud variations we applied the same method to the different datasets (INM-RSHU CCM, ERA-Interim reanalysis, satellite TOMS/OMI). We should note, that in this study we do not take into account changes in aerosol optical properties and surface reflectivity, which could have some direct and indirect radiative effect on variations in Eery, but at much smaller level comparing with ozone and cloudiness over the 1979–2015 period [28].
According to Equations (1) to (6) we evaluated anomalies in Eery relative to the year 2000 taking into account either only total ozone or only the cloud modification factor, and considering both of these parameters. After obtaining the Eery anomalies, the comparisons between the mean anomaly in Eery over the 2000–2015 period and over the 1979–1999 period were performed. For characterizing the statistical significance of the differences in Eery between the two periods, we applied a t-test for the means of two independent samples (Welch’s t-test) at p = 95%.
In addition, we performed a trend analysis for Eery anomalies using a linear regression model with the least squares approach and estimated its uncertainty using t-test at p = 95%.
The details of the UV resources estimations are given in Section 2.4.

2.1. The Description of INM-RSHU Chemical Climate Model

The INM-RSHU global three-dimensional chemistry–climate model consists of two modules: a dynamical module, which has been developed at the Institute of Numerical Mathematics (INM) of Russian Academy of Science (RAS) [44] and a photochemical module developed at the Russian State Hydrometeorological University (RSHU). Both modules were successfully applied in different international projects on climate and atmospheric gas composition variability [50,51,52].
The model resolution is 5° × 4° (longitude x latitude) with 39 vertical levels with variable spacing, up to 0.003 hPa at the model top [43]. The algorithm of the combined model accounts for the interaction between chemical and physical processes at each time step of the model. The chemical module accounts for 74 gas species interacting in 174 chemical reactions, and 46 reactions of photodissociation. A detailed description of the model can be found in [43,44]. For the numerical experiments we used the following datasets: the emissions of the ozone depleting substances were taken from [6]; the change in greenhouse gas emissions was parameterized according to the RCP4.5 scenario from the CMIP5 project; the data on extraterrestrial solar flux variability were taken according to [53], stratospheric aerosol concentrations followed [54]. The simulations were made using different datasets on SST/SIC (Sea Surface Temperature and Sea Ice Coverage, respectively): using the Met Office (as a default variant) [55], the ERA-Interim [42], and the CCM SOCOL (modeling tools for studies of SOlar Climate Ozone Links) datasets [56]. For evaluating CMFuv, a spectral correction was applied to the CMF data according to Equation (6).

2.2. The Description of ERA-Interim Reanalysis Dataset

The ERA-Interim reanalysis dataset [42] produced by the European Centre for Medium-Range Weather Forecasts (ECMWF) is a well-known reanalysis dataset available from 1979, continuously updated in real time. The ERA-Interim data-assimilation system utilizes a four-dimensional variational data-assimilation scheme (4D-Var) and a variational bias correction scheme (VarBC) for satellite radiances, that automatically detects and corrects for observation biases [57,58,59,60].
The ECMWF ERA-Interim reanalysis dataset, along with data on total ozone content, contains the data on solar radiation for cloudy and clear-sky conditions at the Earth’s surface. For calculating CMF, we used the following ERA-Interim parameters: daily dose of “surface net solar radiation, clear sky” (NSR, clear sky) and “surface net solar radiation” (NSR), synoptic monthly means. It is easy to show that these parameters can be used for estimating CMF using the equation:
C M F i , j = NSR i j NSR clear sky i j ,
the UV correction was made using the same approach by Equation (6), which has been applied to the CMF data obtained from model simulations.
Validation of the ECMWF ERA-Interim ozone dataset has been made for the 1989–2008 period by comparisons with independent ground-based ozone observations [57] and satellite data [58]. In addition to ground-based independent observations, ozone profiles from ozonesondes retrieved from the World Ozone and Ultraviolet Radiation Data Centre (WOUDC) archive were used to validate the ozone vertical distribution. The residuals between the ERA-Interim and the ground-based Dobson total ozone measurements were within ±10% at high latitudes, and within ±5% over other regions with the absence of temporal bias both in the stratosphere and in the troposphere [57]. The validation of ERA-Interim relative to satellite data included total ozone data from TOMS and OMI satellite instruments as well as SBUV and SBUV/2 and ozone profile retrievals from other satellite measurements [58,59]. The ERA-Interim total column ozone uncertainty is typically ±5 DU (about ±2%). As a result, in the latest Scientific Assessment of Ozone Depletion: 2018 [8] on page 3.8 it was stated that “recent reanalysis datasets (Dee et al., 2011; Dragani 2011; and Wargan et al., 2017) have been shown to produce a realistic representation of total ozone“.
ERA-Interim global solar irradiances at the ground have been validated with ground-based and satellite data [61,62,63]. According to a comparison of data from 674 sites, Era-Interim and ground-based measurements were highly correlated (R2 = 0.97) [61]. Biases relative to observations were smaller compared to other reanalysis data evaluated in this study. According to Table 2 from [61], the mean bias relative to solar radiation measurements from all stations was 11.25 W m−2, and the RMSE (Root-Mean-Square Error) was 27.7 W m−2, while for the best radiation measurements at BSRN (Baseline Surface Radiation Network) sites the mean bias was 4.15 W m−2 and the RMSE was 19.6 W m−2. A similarly small bias of 5.2 W m−2 was obtained over central Europe [62], while for the French radiation network the mean difference of 9.7 Wm−2 with R2 = 0.97 was estimated on a daily basis for the 1995–2006 period [63].
Therefore, the estimates of total ozone and solar radiation in the ERA-Interim dataset can be characterized as realistic and suitable for our study.

2.3. Description of the Combined TOMS/OMI Satellite Dataset

The TOMS and OMI satellite datasets were used for comparisons with the Eery retrievals from the INM-RSHU CCM and the ERA-Interim reanalysis. For characterizing Eery variability, we applied daily erythemal doses (J m−2) from the combined satellite dataset. Nimbus7/TOMS and EarthProbe/TOMS Level 3 data were downloaded from https://disc.gsfc.nasa.gov (date of access 01.02.2017) with a spatial resolution of 1° × 1.25° [64,65]. Level 3 AURA/OMI Erythemal Dose Daily product archives were downloaded from https://giovanni.sci.gsfc.nasa.gov (date of access 16.02.2017) with a spatial resolution of 1° × 1° [66]. The data were re-gridded to have similar spatial resolution. In addition, we made an updated correction on absorbing aerosol following the methodology described in [17,20,21]. For this purpose, we applied the new aerosol climatology Macv2 for 2005 [41]. The absorbing aerosol optical thickness (τabs) at λ = 320 nm was simulated using the following equation:
τ a b s = τ e x t ( 1 ω )
where τext is the extinction aerosol optical thickness; ω is the single scattering albedo.
According to [20,21,67], we evaluated aerosol correction factor CF, using the following equation:
C F = 1 1 + K τ a b s
where the slope K weakly depends on solar elevation and aerosol type, and for h > 30° with typical values of τabs < 0.1 an average value of K = 3 can be applied with an error of less than 5% [20].
We should note that in OMI UV retrievals the absorbing aerosol correction had been already applied using the old Macv1 aerosol dataset [20,68]. Hence, for the application of the new Macv2 climatology correction we first removed the previous Macv1 correction from the dataset. For the TOMS dataset the correction using the new aerosol Macv2 dataset has been applied directly to the standard Eery retrievals. We would like to emphasize that both the previous and the new Macv2 corrections do not take into account changes in aerosols over time. The monthly mean τabs distribution with 1° × 1° grid over the 1980–2015 period have been used as input data for the CF estimation. Figure 1 presents relative difference (in %) between the old (Macv1) and the new (Macv2) CF aerosol correction factor.
Due to smaller absorbing aerosol optical depth over Europe and China in the new aerosol climatology we have relatively higher CF’s of up to 10–20% compared with the old Macv1 correction, especially in April and July. The opposite tendency is observed over the Arctic regions due to the increase in τabs in the new climatology, which resulted in 20–30% CF decrease almost for all seasons, except January. In other areas there is a slight change in CF of about ±5%. Due to changes in absorbing aerosol, there are pronounced differences in UV indices of more than 1 over several regions of Europe, Central Asia and China in July (Figure 2).
In addition, for characterizing the variations in Eery due to total ozone changes, the extended observational assimilated database described in [69] has been applied. The assimilated database combines satellite-based ozone measurements from TOMS, GOME, SBUV, and OMI satellite ozone instruments with their corrections from ground-based measurements. Since the development of this database was mainly based on TOMS and OMI total ozone retrievals, we refer to it in this study as the TOMS/OMI ozone dataset. This assimilated database has been also actively used in [8] for ozone trend studies.
We also applied the CMFuv climatology obtained previously according to the TOMS Reflectivity measurements (1979–2002) with additional surface albedo correction as described in [14,70]. This dataset has been used for the comparisons with the CMFuv climatology evaluated from the INM-RSHU CCM and ERA-Interim datasets. We did not use satellite TOMS/OMI CMFuv retrievals for characterizing year-to-year variability, since they have large uncertainty at high latitudes due to high snow surface albedo and low solar elevations [21]. We should mention that the results, obtained using satellite data in other publications [17,18,19], have been also restricted to 50°–55° latitude to avoid significant uncertainties.

2.4. The UV Resources Simulations

For characterizing the changes in erythemal UV radiation over the 1979–2015 period and for qualifying the importance of such changes for human health we used the UV resources approach, which was described in details in [14]. As stated above, the UV resources characterize UV radiation from the point of beneficial (vitamin D production) or adverse (sunburn) effects on human health in the categories of UV deficiency, UV optimum and UV excess with the additional account for skin types and open body fraction. The main principle of the approach is in the application of two thresholds. The first threshold is defined by the Minimum Erythemal Dose, MED, which depends on skin type (k) according to the Fitzpatrick classification [71]. In this study we consider four skin types, which are typical for Northern Eurasia area. The MED for the most UV susceptible skin type 1 is 210 J m−2, for skin type 2–250 J m−2, for skin 3–350 J m−2, and for skin type 4–450 J m−2 [71]. For higher UV levels which exceed MED, in [14] we proposed to define several subclasses of UV excess. They are attributed to the thresholds depending on the WHO (World Health Organization) UV index (UVI) categories [72]: moderate UV excess category, high UV excess category, very high UV excess category, and extremely high UV excess category, which are respectively related to moderate, high, very high, and extremely high hourly UVI (see the details in [14]).
The second threshold is the minimum vitamin D dose production MvitDD. A detailed description of the method of its evaluation can be found in [14]. It has been estimated with account for a daily dietary vitamin-D intake of 1000 IU [73] and using an equivalent of vitamin D production of one MED of 10,000 IU [74]. Hence, taking into consideration an open body fraction S, a relationship between the two thresholds can be written as follows:
MvitDDk = 0.1 MEDk/S
These two thresholds were used for defining different classes of UV resources including the UV deficiency, when no vitamin D is possible to obtain, UV optimum, when it is possible to obtain vitamin D and not possible to get sunburn (erythema), and UV excess, when erythema is obtained. We should note that S was set to 0.25 in this study. This simplified approach provides an opportunity in a first approximation to quantify the UV resources and their spatial and temporal changes.
For evaluating UV resources, absolute Eery estimates are needed. For this purpose, we calculated the hourly Eery averages centered at noon with 3-min resolution, using the 8-stream discrete ordinate radiative transfer method in the TUV model [48] over the territory of 10.5° W–179.5° E, 40° N–80° N with 1° × 1° increments for year 2000 for clear-sky conditions. In these simulations we took into account total ozone as well as aerosol optical thickness and surface albedo for central days of each month of 2000. To simulate Eery in cloudy conditions, we applied the CMFUV values. Since Eery anomalies in Equation (1) were also simulated relative to 2000, we could easily reconstruct absolute Eery changes over the whole period.
Previously, the climatology of UV resources over Northern Eurasia has been obtained in [14]. In this paper we use this approach for evaluating possible changes in spatial distribution of the different UV resources classes since 1979 for different seasons and for various skin types due to ozone and cloud variations.

3. Results

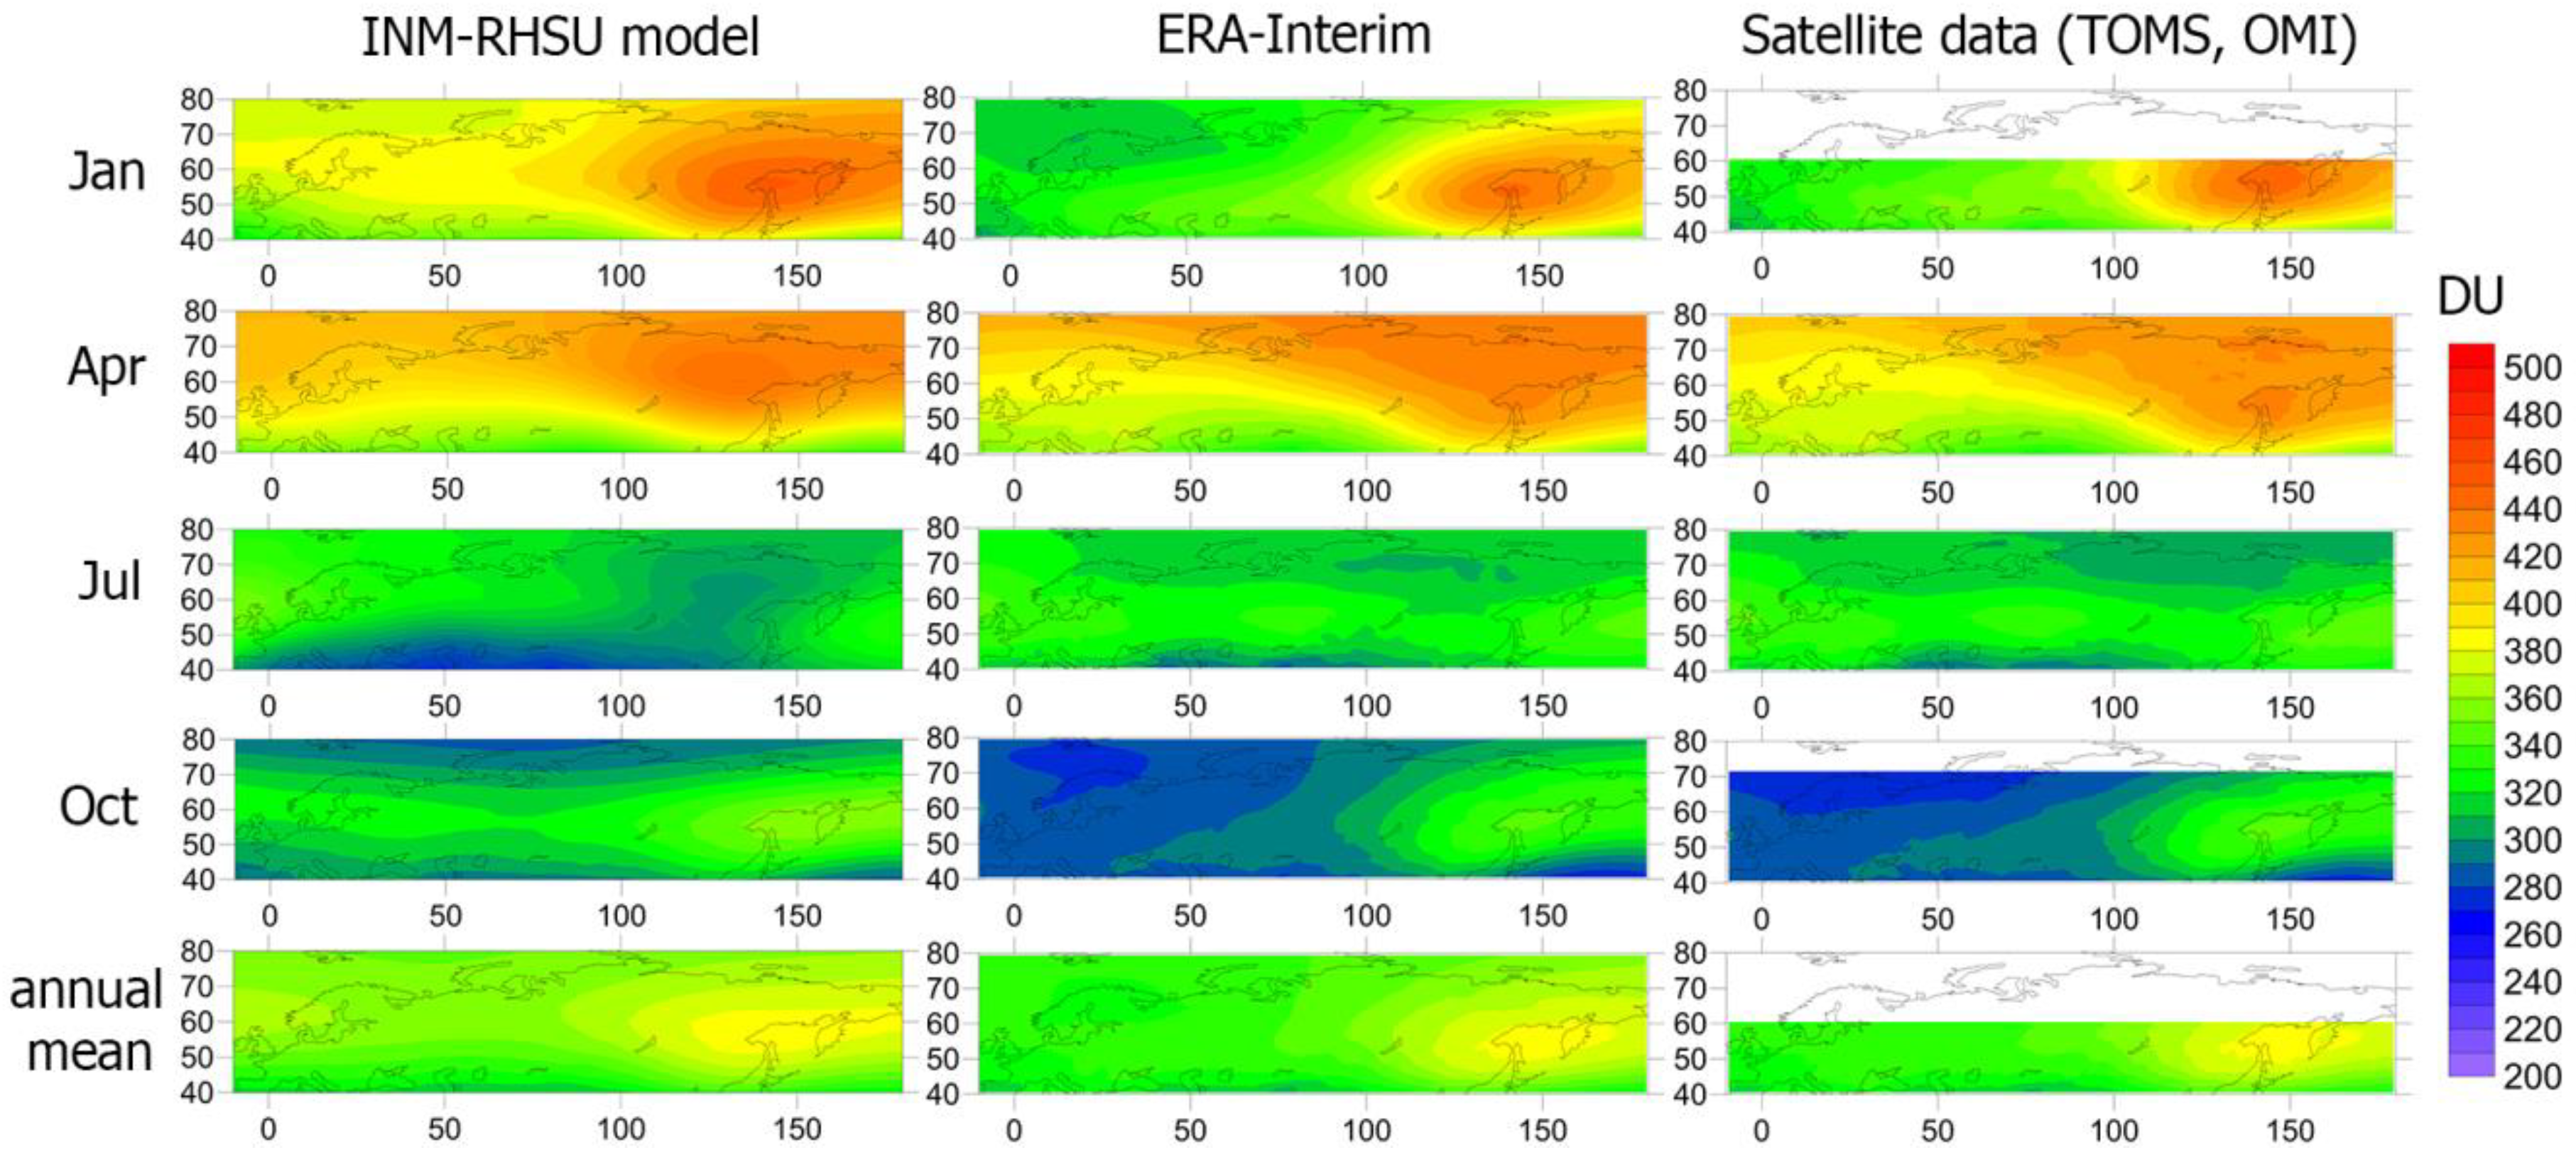
3.1. Climatologies of Total Ozone and Cloud Modification Factor over Northern Eurasia

Since total ozone is one of the main factors affecting erythemal UV radiation, it is necessary to calculate both the ozone climatology and its temporal variation with low uncertainty. The comparisons of different ozone climatologies over the 1979–2015 period obtained from INM-RSHU CCM, ERA-Interim Reanalysis and Satellite TOMS/OMI datasets are shown in Figure 3 and Table 1, where the main statistics of total ozone column are presented. The CCM adequately reproduces the absolute values of total ozone amount: the differences between monthly mean CCM total ozone values do not exceed 7% compared with TOMS/OMI ozone retrievals with mean annual difference of about 1% (see Table 1).
There is a good agreement between ERA-Interim and TOMS/OMI mean total ozone datasets with mean differences of 1% or less. There is also a satisfactory agreement in the representation of ozone spatial distribution in different seasons, except October, when a dipole structure of ozone maximum has been obtained with the centers over the Western and Eastern coast of Northern Eurasia, while according to the satellite TOMS/OMI dataset we see only one ozone maximum over Northeastern Asia. There is a high correlation between TOMS/OMI and ERA-Interim Reanalysis datasets since in ERA-Interim ozone is both modeled and assimilated from SBUV, OMI, TOMS, GOME, and SCIAMACHY datasets [57,58].
The effect of cloud on UV radiation is a combination of the effects of cloud optical properties and spatial cloud characteristics (cloud amount). As shown above, cloud modification factor (CMFuv) captures both effects simultaneously. Figure 4 shows the spatial distribution of CMFuv according to INM-RSHU CCM, ERA_INTERIM, and TOMS/OMI satellite datasets over the 1979–2015 period. Main statistics of CMFuv are shown in Table 1. Noticeable variability in CMFuv reflects significant changes of different synoptic processes over Northern Eurasia. In January in midlatitudes cloud modification factors over Europe are much smaller due to the enhanced cyclonic activity (CMFuv = 0.3–0.4) and over the central part of the continent the CMFuv can reach 0.8–0.9 due to the influence of the Siberian anticyclone, which is characterized mainly by cloudless conditions. In July over the southern European regions one can see high CMFuv > 0.9 due to the influence of Azores anticyclone. All datasets are in reasonably agreement, except satellite dataset over Arctic area, where in April and July there is a significant drop in CMFuv possibly due to the problems with dividing cloud/albedo effects in the satellite algorithm, that results in unrealistically low CMFuv values.
There is a good agreement between all three datasets in July, while in January we observe the CMFuv overestimation over the continental areas of Northern Eurasia in the INM–RSHU CCM.
Table 1 also demonstrates the low TOMS/OMI CMFuv values compared with the INM–RSHU CCM and ERA-Interim CMFuv retrievals, especially in January, in high snow albedo conditions, when the negative bias can reach 20–30%. On average, there is a satisfactory agreement between the mean CMFuv values in the INM-RSHU CCM and ERA-Interim datasets with the difference not exceeding 2.5%, except January, when it increased up to 8% (Table 1). We also should mention that previous comparisons with the direct CMFuv evaluation from the Moscow State University Meteorological Observatory dataset also demonstrate a satisfactory agreement with the INM–RSHU CCM CMFuv values with the exception of winter months [28].

3.2. Changes in Eery Daily Doses due to Ozone and Cloudiness

3.2.1. Eery due to Total Ozone Variations

There are several factors affecting ozone content in the atmosphere and, hence, noticeably change Eery at ground. Due to the Montreal Protocol with its Amendments and Adjustments the emissions of ozone depleting substances (ODS) have been restricted, however, due to significant life time of most of them, their concentrations in the atmosphere are getting lower only in recent years [6,8,10,38]. Along with the anthropogenic effects, the observed variability of some natural factors also could be important in assessing the total variability of ozone. We performed several numerical experiments for evaluating and comparing the role of the main ozone drivers in Eery variability over the 1979–2015 period. The detailed description of the numerical experiments is shown in Table 2.
In order to estimate the sensitivity of different factors we simulated the difference in Eery between the periods of 2000–2015 and 1979–1999 due to the changes in emissions of ODS, the changes in stratospheric aerosol, in SST/SIC, and solar activity separately and due to their combined effects according to the numerical experiment, when all factors are taken into account simultaneously. The results are shown in Figure 5. Over this period there is a noticeable enhancement in Eery due to the ozone loss related to the ODS increase. The largest ozone Eery growth of more than 4% is observed over polar regions, which is in accordance to other model simulations [7].
Solar activity provides the changes in solar radiation at wavelengths shorter than 242 nm, which influence the ozone photochemical processes. Due to a tendency of decreasing solar activity during the last decades, smaller ozone amount is generated providing small, but positive changes in Eery (<1%). The increase in concentration of stratospheric aerosol was mainly observed due to strong volcanic eruptions at the end of the 20th century—El-Chichon (1982) and Pinatubo (1991). They resulted in ozone loss initiated by the heterogeneous processes on the surface of sulphate volcanic aerosol particles in the stratosphere. The absence of intensive volcanic activity in the 21 century provided a small Eery decrease during the 2000–2015 period (less than 1%) compared with the 1979–1999.
The changes in SST/SIC have the strongest impact on ozone compared with other natural factors presumably due to their influence on the atmosphere dynamic processes. These changes provide increase in Eery up to 2% for annual means in 21th century (2000–2015), especially over the northern Arctic regions. The numerical experiment, which took into account for all factors influencing total ozone column, has revealed a positive change in Eery up to 1–2% over northern regions of Eurasia and some small negative effects (less 1%) at the southeastern Pacific Ocean region, which are not statistically significant.
Since the effects of sea surface temperature on ozone are important, we also analyzed the possible changes in Eery due to the application of the other SST/SIC datasets in the INM-RSHU CCM (the ERA-Interim [42], and the SOCOL SST/SIC datasets [56]). In these numerical experiments the total ozone column was simulated using the same datasets for ODS, stratospheric aerosol and solar activity as before, but the MetOffice SST/SIC dataset was replaced with ERA-Interim and SOCOL data.
The comparisons of the influence of different SST/SIC on variations in Eery have revealed small difference in annual Eery behavior, especially between the model runs with the Met Office and the SOCOL SST/SIC. All numerical experiments have a similar tendency of annual Eery growth of about 1–2% over the central part of Northern Siberia in 2000–2015 compared with 1979–1999, however, there are large differences in seasonal changes. We would like to emphasize that the influence of SST/SIC on variations in Eery should be studied further for understanding the physical mechanism of this phenomenon. We may assume that the changes in SST/SIC may influence the intensity of NAO/AO (North Atlantic Oscillation/Arctic Oscillation) and AAO (Antarctic Oscillation) indices, which is small in zonal averages [75], but according to [8], their variations can explain much of the variability in ozone over local areas [76,77].
In addition, we analyzed variations in Eery due to the anthropogenic and natural ozone drivers during the 1979–2015 period using linear trend analysis (Figure 6). Similar to Figure 5, statistically significant positive linear Eery trends at p = 95% of up to 3%/decade have been obtained according to the numerical experiment with the ODS change (marked as “anthropogenic effect”). The sign of the Eery trends due to other natural factors are also similar to Eery changes shown in Figure 5.
The numerical experiment, which accounted for all factors, was tested against different datasets. Figure 7 shows the difference in the average of Eery anomalies for the period 2000–2015 and the period 1979–1999 due to ozone factor using the Eery retrievals according to the INM-RSHU CCM, the ERA-Interim datasets, and TOMS/OMI satellite data. There is a satisfactory agreement between annual results with a 1–2% Eery increase due to lower ozone in the 2000–2015 period compared to the 1979–1999 period. The annual Eery changes were not statistically significant, except the Eery increase over Eastern Europe and Northeastern Asia according to the ERA-Interim Eery retrievals (up to 3%). The discrepancy in Eery changes due to ozone in different datasets is much higher for the seasons. While the results for the ERA-Interim and TOMS/OMI satellite datasets are in reasonable agreement for April and July, the agreement for January and October is poor. The Eery increase obtained in the INM-RSHU CCM in April is mainly in agreement in sign with ERA-Interim and satellite data with more than 5% increase due to lower ozone content in 2000–2015, however, the spatial pattern of changes in Eery does not match other datasets. In July and October large territories are characterized by the decrease in model Eery due to more rapid recovery of total ozone compared with that in the ERA-Interim and the TOMS/OMI datasets. Similar tendency in Eery change has been also obtained in the detailed analysis of trends in Eery over Moscow [28].
In addition, Figure 8 presents time series of Eery anomalies at 48° N for longitudes between 0° E and 150° E based on the INM-RSHU CCM, ERA-Interim, and TOMS/OMI satellite datasets. The results from the three datasets agree within a few percent and suggest that Eery has increased between 1979 and 1995. In contrast, Eery has not changed perceivably between 2000 and 2015. These results corroborate the conclusion from Figure 8 that Eery was lower during 1979–1999 compared to 2000–2015.
Figure 9 shows the spatial distribution of the decadal trend in Eery caused by changes in total ozone over the period 1979–2015, calculated from the INM-RSHU CCM, ERA-Interim, and TOMS/OMI satellite datasets. For annual means (last row in Figure 9), trends computed from the three datasets are generally consistent and range between −0.5% and 2% per decade. However, similar to the results shown in Figure 7, the discrepancy is much larger for the seasonal datasets. In April a pronounced increase in Eery (up to 3% per decade) is observed according to all datasets, which is statistically significant over vast areas. Results for the ERA-Interim and TOMS/OMI satellite datasets agree again reasonably well, while results from the INM-RSHU CCM model in most cases do not capture the spatial patterns of the observations.

3.2.2. Eery due to Cloud Variations

We analyzed CMFuv variations retrieved from the INM-RSHU CCM numerical experiments as well as from the ERA-Interim dataset. The seasonal and annual differences in the CMFuv values between the 2000–2015 and 1979–1999 periods are shown in Figure 10. In general, the CMFuv differences vary between these periods within ±5%. However, in April over Central and Eastern Europe and in July over the northern Atlantic, the European territory of Russia, Central Siberia and Northeastern Asia the difference is higher than 5% and sometimes exceeds 10% according to the ERA-Interim dataset. These estimates are in a good agreement with the CMFuv trends over Moscow [78]. Model simulations provide much smaller changes in CMFuv. Similar tendencies are observed only over the Atlantic and Northeastern Asia, but at much smaller level. In contrast, in July over the Northern Arctic region there is a statistically significant CMFuv decrease, which has been obtained both according to the INM-RSHU CCM and the ERA-Interim datasets. This may happen due to increasing temperature in this northern area as a result of global warming and intensification of the cyclonic processes and, hence, increase in water vapor content. We should emphasize that these results are also in agreement with the independent model simulations [11]. In addition, in [79] it was mentioned that by the end of the 21 century “cloud cover will increase at high latitudes by up to 5% but will decrease at low latitudes (<~30°) by up to 3%”. According to [80] a UV reduction of 10–15% is projected by 2100 due to increases in cloudiness over some northern high-latitude regions and over Antarctica. Hence, the tendency in increasing of cloud cover in summer Arctic conditions is successfully retrieved from INM-RSHU CCM. At the same time, the INM-RSHU CCM does not reproduce well positive changes in CMFuv over midlatitudes. For annual data, one can see even a prevailing small model CMFuv decrease compared with the CMFuv increase of up to 5% over vast midlatitude areas according to the ERA-Interim dataset.
The additional linear trend analysis also demonstrates high CMFuv increase (up to +4–6% per decade) over several areas (East-European Plain, Northeastern Asia, and local areas in Siberia) according to the ERA-Interim dataset (Figure 11), while model positive linear decadal trends are much smaller. Over the Arctic basin negative decadal trends of about 2–4%/decade have been revealed from both model and ERA-Interim CMFuv retrievals in April and July. This is also in agreement with the results obtained in [11]. We should also note that the model does not reproduce positive trends in CMFuv over Central Europe, Central Siberia and Northeastern Asia in July, and over the Northeastern Arctic regions in October.

3.2.3. Eery Changes due to Joint Influence of Total Ozone and Cloud Variations

According to the method, described in Section 2 (Equations (1) to (6)), we simulated variations in Eery due to both factors: ozone and cloudiness. We applied this approach for both ERA-Interim and INM-RSHU CCM datasets. In addition, we made the comparisons with TOMS/OMI daily erythemal doses dataset with the new Macv2 aerosol correction. Figure 12 shows seasonal and annual differences in Eery anomalies between the 2000–2015 and 1979–1999 periods due to the combined effects of total ozone and cloudiness. For annual means (last row in Figure 12), results for the CCM model show increases by 0–3% in 2000–2015, while changes for the ERA-Interim dataset range between −2% and 5%, with few exceptions. In July the spatial changes in Eery from the Era-Interim dataset exhibit a quasi-wave spatial structure in midlatitudes with a significant increase of about 10–15% over Europe, Central Siberia, and Northeastern Asia. A similar structure, albeit less pronounced, is also apparent in satellite retrievals, and the CCM model. The agreement in the spatial patterns of the datasets is generally poor for other months, except areas over oceans. This disagreement may partly be caused by the interaction between clouds and high surface albedo from snow cover (e.g., see discussion in [67]). This interaction is particularly a problem over northern areas that are affected by snow cover from October through June.
Figure 13 presents Eery decadal trends due to the combined effect of total ozone and cloudiness according to the INM-RSHU CCM, ERA-Interim simulations, and Eery retrievals from the TOMS/OMI satellite dataset with the additional aerosol Macv2 correction. For annual means (last row in Figure 13), trends calculated from the CCM and ERA-Interim datasets generally agree, range between 0% and 3% per decade, and are statistically significant over large areas. The noticeable positive trends in Eery of up to 8% per decade in July, and up to 5% per decade in April are observed in the ERA-Interim dataset over several areas in Eastern Europe, Central Siberia, and Northeastern Asia. In July, similar trends in Eery of up to 8% per decade can be found according to the satellite data over the Pacific Ocean. We also see a better agreement in July, when the spatial quasi-wave structure of positive Eery trends in midlatitudes from the ERA-Interim is similar to that obtained from the satellite data. Spatial patterns of the CCM and ERA-Interim results agree qualitatively, but trends calculated with the CCM model are generally smaller.

3.3. Changes in UV Resources due to the Changes in Ozone and Cloudiness over Northern Eurasia

Using the method described in Section 2.4, we simulated the UV resources for 1979 and 2015 and their changes over this period according to the retrievals from the ERA-Interim data for different skin types. The Eery retrievals from the ERA-Interim dataset were chosen for the following reasons. For estimating Eery, we need the reliable products for both total ozone and cloud modification factor. A large territory of Northern Eurasia is located in high latitudes with small solar elevations and snow cover dominating not only in winter, but during spring and fall, when satellite Eery retrievals cannot be used. In Section 2.2 the Era-Interim total ozone and downward shortwave radiation products were shown to have a good quality [57,58,59,60,61,62,63]. Therefore, we simulated UV resources using the Eery retrievals from this dataset. To avoid local features in Eery variations in 1979 and 2015, we applied a linear regression model to characterize the Eery changes from 1979 to 2015.
Figure 14 presents the UV resources distribution over Northern Eurasia for 1979 and 2015 and their difference for skin types 1–4. According to [72], skin type 1 is most susceptible to erythema, while skin type 4 is characterized by small sun-sensitivity. We revealed that for the all skin types due to the reduction of ozone and clouds, there is a noticeable geographical shift of UV categories over large areas, especially in April and July. A noticeable reduction of the UV optimum area and its replacement by the moderate UV excess conditions is observed in April for skin types 1 and 2. There is also a shift from moderate to high UV excess conditions at lower latitudes for these skin types. However, for skin types 3 and 4 in April we see favorable changes from UV deficiency to the UV optimum conditions over polar regions, and adverse change of UV optimum to UV excess conditions at the south (see Figure 14). In July in central Arctic region there is, on the contrary, a change from UV excess to UV optimum conditions for skin types 2 and 3, due to an increase in cloudiness. In October favorable changes are observed for skin types 3 and 4 with UV optimum area shift towards the north, while for skin types 1 and 2 there is the replacement of UV optimum by moderate UV excess conditions at the south.

4. Discussion

In this paper we evaluated the separate effects of total ozone and cloudiness and their combined effect on temporal variability of UV erythemal daily doses and UV resources according to the Eery retrievals from the ERA-Interim, the INM-RSHU CCM datasets, and TOMS/OMI satellite measurements with the Macv2 aerosol correction over Northern Eurasia for the 1979–2015 period.
The numerical experiments using INM-RSHU CCM model allowed us to estimate the role of main ozone drivers (ODS, stratospheric aerosol, sea surface temperature and ice coverage, solar activity) and to evaluate their impact on Eery. We showed that the most important factor affecting Eery is the concentration of ODS, the increase of which led to the significant ozone loss. Among natural factors, stratospheric aerosol and SST/SIC are the most important ones. The application of the Met Office and the SOCOL SST datasets in the INM-RSHU CCM provided the similar annual Eery increase in 2000–2015 over Central part of Northern Siberia, however, further studies should be conducted for understanding the physical mechanism of this phenomenon. On the whole, there is a positive change in the modeled Eery of up to 1–2% at the northern regions of Eurasia in 2000–2015 compared with the 1979–1999 period. Maximum positive linear Eery trends (up to 3% per decade) due to ozone loss were observed in April.
Linear Eery trends due to changes in cloudiness were much more pronounced and reached 4–8% per decade over some areas (East-European Plain, Northeastern Asia and local spots in Siberia) according to the ERA-Interim dataset. Both INM-RSHU CCM and ERA-Interim Eery retrievals have revealed negative Eery trends due to cloudiness of about 2–4% per decade in the central Arctic basin in April and July. This decrease in CMFuv during the last decades is connected with warming of the lower troposphere and large reduction of sea-ice-sheet, increasing evaporation and water vapor content [81]. Similar changes were obtained in [11], where it was mentioned that “the primary drivers of these changes are increasing concentrations of greenhouse gases (GHGs) and, for the southern hemisphere, the Antarctic ozone ‘hole’”. It should be emphasized that according to the model estimations CMFuv changes were much smaller than those obtained from ERA-Interim and satellite data. According to the ERA-Interim Eery retrievals, the joint ozone and cloud effect provided up to 6–8% increase in Eery per decade in July and April over several areas in Eastern Europe, Central Siberia, and Northeastern Asia. Annual Eery linear trends comprised about 2% per decade according to the ERA-Interim dataset and were statistically significant over large areas.
The analysis of the UV resources for 1979 and 2015 and their changes over this period showed a noticeable geographical shift of UV categories, especially in spring and summer over large areas due to the reduction of ozone and clouds. For skin types 1 and 2, which are most susceptible to sunburn, favorable UV optimum conditions were substituted by UV excess conditions over large areas. At the same time in April favorable UV optimum instead of UV deficiency conditions were observed for skin types 3 and 4 in the north but in the south the areas covered by the UV optimum have been replaced by the UV excess conditions. In some Arctic regions, in July, there was a change from UV excess to UV optimum for skin types 2 and 3, due to the increase in cloudiness.
In our assessment of UV resources, we did not take into account changes in the surface area of the skin that is exposed to sunlight or possible changes in the behavior of people, which could result from climate change and increasing temperatures. Instead, we focused on variations in UV resources due to the changes of the most important geophysical factors: total ozone and cloudiness.

5. Conclusions

We analyzed temporal variability of UV erythemal daily doses and UV resources due to ozone and cloudiness, according to different datasets, using Eery retrievals from the ERA-Interim reanalysis, INM-RSHU CCM, and the TOMS/OMI satellite measurements, with the updated aerosol correction over Northern Eurasia for the 1979–2015 period.
We showed that, according to all datasets for spring and summer clear-sky conditions, there was a pronounced trend in Eery of up to +3% per decade due to ozone loss, which was statistically significant over large areas in Northern Eurasia.
The INM-RSHU model experiments have confirmed that the largest effect on ozone and Eery stem from the largest impact of anthropogenic emissions of ozone-depleting substances. Additional factors include volcanic aerosol and the SST/SIC on ozone and, hence, on Eery changes. The utilization of the different SST/SIC datasets in the INM-RSHU CCM showed similar annual mean Eery increase over the polar region in Siberia.
The INM-RSHU CCM, as many other CCM models (see, for example, discussion in [37]), did not reproduce an observed significant positive change in CMFuv during the last decades, which can reach up to 4–8% per decade, according to the ERA-Interim dataset over several areas in Northern Eurasia.
According to the Eery retrievals from the ERA-Interim dataset positive Eery trends reached 6–8% per decade over Eastern Europe, several regions in Siberia and Northeastern Asia due to the joint impact of ozone and cloudiness. In the central Arctic region, negative Eery trends were observed in summer due to CMFuv decrease, which is in agreement with findings in other studies [11].
The simulations of changes in UV resources from 1979 to 2015 have shown that there is a shift toward higher UV categories, especially in April and July, for skin types 1 and 2, which are most susceptible to sunburn. In April, this phenomenon was expressed in a noticeable reduction of the UV optimum area and its replacement by the moderate UV excess conditions. In addition, a shift from moderate to high UV excess conditions is observed. However, during summer months in the central Arctic region, there is a change from UV excess to UV optimum conditions for the skin types II and III due to a decrease in CMFuv.
This work is a part of an on-going project, within which we plan to perform additional numerical experiments with the INM-RSHU-CCM taking into the account temporal changes in aerosol and surface reflectivity as well as aerosol–cloud interaction, which possibly help in evaluating real CMFuv long-term changes over 1979–2015 period.

Author Contributions

The paper was initiated and written by N.E.C. All other authors had valuable contribution in visualization of the results and data analysis (A.S.P., E.Y.Z., and E.V.V.) and in providing the data of model experiments with the INM-RSHU CCM (S.P.S. and V.Y.G.); E.V.V. and E.Y.Z. helped with the technical preparation of the manuscript. All authors have read and agreed to the published version of the manuscript.

Funding

This research was partly supported in part by the Russian Foundation for Basic Research, grant no. #18-05-00700, and state budget program AAAA-A16-116032810086-4.

Acknowledgments

We would like to thank A. Arola for providing the aerosol dataset, which was used in the standard OMI Eery retrievals. We would also like to thank Bodeker Scientific, funded by the New Zealand Deep South National Science Challenge, for providing the combined NIWA-BS total column ozone database. In addition, the useful comments of the anonymous reviewers are highly acknowledged.

Conflicts of Interest

The authors declare no conflict of interest.

References

  1. Robinson, S.A.; Wilson, S.R. Environmental Effects of Ozone Depletion and Its Interactions with Climate Change: 2010 Assessment; United Nations Environment Programme: Nairobi, Kenya, 2010; p. 328. [Google Scholar]
  2. Environmental Effects Assessment Panel (EEAP). Environmental Effects and Interactions of Stratospheric Ozone Depletion, UV Radiation, and Climate Change: 2018 Assessment Report; United Nations Environment Programme (UNEP): Kenya, Nairobi, 2019; p. 390. Available online: https://ozone.unep.org/science/assessment/eeap (accessed on 1 October 2019).
  3. Holick, M.F. Vitamin D: A millenium perspective. J. Cell. Biochem. 2003, 88, 296–307. [Google Scholar] [CrossRef]
  4. Webb, A.R.; Engelsen, O. Ultraviolet exposure scenarios: Risks of erythema from recommendations on cutaneous vitamin D synthesis. In Sunlight, Vitamin D and Skin Cancer; Reichrath, J., Ed.; Advances in Experimental Medicine and Biology; Springer: New York, NY, USA, 2008; pp. 72–85. [Google Scholar]
  5. Bornman, J.F.; Paul, N.; Shao, M. Environmental Effects of Ozone Depletion and Its Interactions with Climate Change: 2014 Assessment; United Nations Environment Programme: Kenya, Nairobi, 2014; p. 312. [Google Scholar]
  6. World Meteorological Organization (WMO). Scientific Assessment of Ozone Depletion: 2010; Global Ozone Research and Monitoring Project—Report No. 52; World Meteorological Organization: Geneva, Switzerland, 2011; p. 516. [Google Scholar]
  7. World Meteorological Organization (WMO). Scientific Assessment of Ozone Depletion: 2014; Global Ozone Research and Monitoring Project—Report No. 53; Meteorological Organization: Geneva, Switzerland, 2015; p. 416. [Google Scholar]
  8. World Meteorological Organization (WMO). Scientific Assessment of Ozone Depletion: 2018; Global Ozone Research and Monitoring Project—Report No. 58; Meteorological Organization: Geneva, Switzerland, 2018; p. 588. [Google Scholar]
  9. Bekki, S.; Bodeker, G.E.; Bais, A.F.; Butchart, N.; Eyring, V.; Fahey, D.W.; Kinnison, D.E.; Langematz, U.; Mayer, B.; Portmann, R.W.; et al. Future ozone and its impact on surface UV. In Scientific Assessment of Ozone Depletion: 2010; Global Ozone Research and Monitoring Project—Report 52; World Meteorological Organization: Geneva, Switzerland, 2011; Chapter 3; p. 516. [Google Scholar]
  10. Bais, A.F.; Lubin, D.; Arola, A.; Bernhard, G.; Blumthaler, M.; Chubarova, N.; Erlick, C.; Gies, H.P.; Krotkov, N.; Mayer, B.; et al. Surface ultraviolet radiation: Past, present, and future. In Scientific Assessment of Ozone Depletion: 2006, Global Ozone Research and Monitoring Project—Report No. 50; World Meteorological Organization: Geneva, Switzerland, 2007; Chapter 7; p. 572. [Google Scholar]
  11. Bais, A.F.; Bernhard, G.; McKenzie, R.L.; Aucamp, P.J.; Young, P.J.; Ilyas, M.; Jöckel, P.; Deushi, M. Ozone-climate interactions and effects on solar ultraviolet radiation. Photochem. Photobiol. Sci. 2019, 18, 602–640. [Google Scholar] [CrossRef] [PubMed] [Green Version]
  12. Bodeker, G.; Burrowes, J.; Scott-Weekly, R.; Nichol, S.E.; McKenzie, R.L. A UV atlas for New Zealand. In Proceedings of the Workshop on UV Radiation and its Effects: An Update (2002), Auckland, New Zealand, 26–28 March 2002; pp. 26–28. [Google Scholar]
  13. Fioletov, V.E.; Kimlin, M.G.; Krotkov, N.; McArthur, L.J.B.; Kerr, J.B.; Wardle, D.I.; Herman, J.R.; Meltzer, R.; Mathews, T.W.; Kaurola, J. UV index climatology over the United States and Canada from ground-based and satellite estimates. J. Geophys. Res. Atmos. 2004, 109. Available online: https://agupubs.onlinelibrary.wiley.com/doi/10.1029/2004JD004820 (accessed on 1 September 2019).
  14. Chubarova, N.; Zhdanova, Y. Ultraviolet resources over Northern Eurasia. J. Photochem. Photobiol. B Biol. 2013, 127, 38–51. [Google Scholar] [CrossRef] [PubMed]
  15. Lee-Taylor, J.; Madronich, S.; Fischer, C.; Mayer, B. A climatology of UV radiation, 1979–2000, 65S–65N. In UV Radiation in Global Climate Change: Measurements, Modeling and Effects on Ecosystems; Gao, W., Schmoldt, D.L., Slusser, J., Eds.; Springer: Dordrecht, The Netherlands; Tsinghua University Press: Beijing, China, 2009; Chapter 1; pp. 1–20. [Google Scholar]
  16. Herman, J.R. Global increase in UV irradiance during the past 30 years (1979 to 2008) estimated from satellite data. J. Geophys. Res. Atmos. 2010, 115, D04203. [Google Scholar] [CrossRef] [Green Version]
  17. Ialongo, I.; Arola, A.; Kujanpää, J.; Tamminen, J. Use of satellite erythemal UV products in analysing the global UV changes. Atmos. Chem. Phys. 2011, 11, 9649–9658. [Google Scholar] [CrossRef] [Green Version]
  18. Herman, J.R.; Labow, G.; Hsu, N.C.; Larko, D. Changes in cloud and aerosol cover (1980–2006) from reflectivity time series using SeaWiFS, N7-TOMS, EP-TOMS, SBUV-2, and OMI radiance data. J. Geophys. Res. Atmos. 2009, 114. Available online: https://agupubs.onlinelibrary.wiley.com/doi/10.1029/2007JD009508 (accessed on 1 September 2019). [CrossRef] [Green Version]
  19. Herman, J.; DeLand, M.T.; Huang, L.-K.; Labow, G.; Larko, D.; Lloyd, S.A.; Mao, J.; Qin, W.; Weaver, C. A net decrease in the Earth’s cloud, aerosol, and surface 340 nm reflectivity during the past 33 yr (1979–2011). Atmos. Chem. Phys. 2013, 13, 8505–8524. [Google Scholar] [CrossRef] [Green Version]
  20. Arola, A.; Kazadzis, S.; Lindfors, A.; Krotkov, N.; Kujanpää, J.; Tamminen, J.; Bais, A.; di Sarra, A.; Villaplana, J.M.; Brogniez, C.; et al. A new approach to correct for absorbing aerosols in OMI UV. Geophys. Res. Lett. 2009, 36. Available online: https://agupubs.onlinelibrary.wiley.com/doi/10.1029/2009GL041137 (accessed on 1 October 2019).
  21. Krotkov, N.A.; Bhartia, P.K.; Herman, J.R.; Fioletov, V.; Kerr, J. Satellite estimation of spectral surface UV irradiance in the presence of tropospheric aerosols: 1. Cloud-free case. J. Geophys. Res. Atmos. 1998, 103, 8779–8793. [Google Scholar] [CrossRef] [Green Version]
  22. Bernhard, G. Trends of solar ultraviolet irradiance at Barrow, Alaska, and the effect of measurement uncertainties on trend detection. Atmos. Chem. Phys. 2011, 11, 13029–13045. [Google Scholar] [CrossRef]
  23. Cabrera, S.; Ipiña, A.; Damiani, A.; Cordero, R.R.; Piacentini, R.D. UV index values and trends in Santiago, Chile (33.5° S) based on ground and satellite data. J. Photochem. Photobiol. B Biol. 2012, 115, 73–84. [Google Scholar] [CrossRef]
  24. Outer, P.N.; Slaper, H.; Kaurola, J.; Lindfors, A.; Kazantzidis, A.; Bais, A.F.; Feister, U.; Junk, J.; Janouch, M.; Josefsson, W. Reconstructing of erythemal ultraviolet radiation levels in Europe for the past 4 decades. J. Geophys. Res. Atmos. 2010, 115. Available online: https://agupubs.onlinelibrary.wiley.com/doi/10.1029/2009JD012827 (accessed on 15 September 2019).
  25. Fitzka, M.; Simic, S.; Hadzimustafic, J. Trends in spectral UV radiation from long-term measurements at Hoher Sonnblick, Austria. Theor. Appl. Climatol. 2012, 110, 585–593. [Google Scholar] [CrossRef]
  26. Lemus-Deschamps, L.; Makin, J.K. Fifty years of changes in UV Index and implications for skin cancer in Australia. Int. J. Biometeorol. 2012, 56, 727–735. [Google Scholar] [CrossRef] [PubMed]
  27. Zhdanova, E.Y.; Chubarova, N.Y.; Blumthaler, M. Biologically active UV-radiation and UV-resources in Moscow (1999–2013). Geogr. Environ. Sustain. 2014, 7, 71–85. [Google Scholar] [CrossRef] [Green Version]
  28. Chubarova, N.E.; Pastukhova, A.S.; Galin, V.Y.; Smyshlyaev, S.P. Long-term variability of UV irradiance in the Moscow region according to measurement and modeling data. Izv. Atmos. Ocean. Phys. 2018, 54, 139–146. [Google Scholar] [CrossRef]
  29. Čížková, K.; Láska, K.; Metelka, L.; Staněk, M. Reconstruction and analysis of erythemal UV radiation time series from Hradec Králové (Czech Republic) over the past 50 years. Atmos. Chem. Phys. 2018, 18, 1805–1818. [Google Scholar] [CrossRef] [Green Version]
  30. Krzyścin, J.W.; Sobolewski, P.S. Trends in erythemal doses at the Polish Polar Station, Hornsund, Svalbard based on the homogenized measurements (1996–2016) and reconstructed data (1983–1995). Atmos. Chem. Phys. 2018, 18, 1–11. [Google Scholar] [CrossRef] [Green Version]
  31. Román, R.; Bilbao, J.; de Miguel, A. Erythemal ultraviolet irradiation trends in the Iberian Peninsula from 1950 to 2011. Atmos. Chem. Phys. 2015, 15, 375–391. [Google Scholar] [CrossRef] [Green Version]
  32. Litynska, Z.; Koepke, P.; De Backer, H.; Groebner, J.; Schmalwieser, A.; Vuilleumier, L. Long term changes and climatology of UV radiation over Europe. In Final Scientific Report COST Action 726: UV Climatology for Europe; European Cooperation in Science and Technology, COST 726 Project; 2010; Available online: http://www.meteoschweiz.admin.ch/web/en/research/completed_projects/cost_726.Par.0011.DownloadFile.tmp/finalreport.pdf (accessed on 1 May 2019).
  33. Chubarova, N.Y. UV variability in Moscow according to long-term UV measurements and reconstruction model. Atmos. Chem. Phys. 2008, 8, 3025–3031. [Google Scholar] [CrossRef] [Green Version]
  34. Fountoulakis, I.; Bais, A.F.; Fragkos, K.; Meleti, C.; Tourpali, K.; Zempila, M.M. Short- and long-term variability of spectral solar UV irradiance at Thessaloniki, Greece: Effects of changes in aerosols, total ozone and clouds. Atmos. Chem. Phys. 2016, 16, 2493–2505. [Google Scholar] [CrossRef] [Green Version]
  35. Bais, A.F.; Tourpali, K.; Kazantzidis, A.; Akiyoshi, H.; Bekki, S.; Braesicke, P.; Chipperfield, M.P.; Dameris, M.; Eyring, V.; Garny, H.; et al. Projections of UV radiation changes in the 21st century: Impact of ozone recovery and cloud effects. Atmos. Chem. Phys. 2011, 11, 7533–7545. [Google Scholar] [CrossRef] [Green Version]
  36. Watanabe, S.; Takemura, T.; Sudo, K.; Yokohata, T.; Kawase, H. Anthropogenic changes in the surface all-sky UV-B radiation through 1850–2005 simulated by an Earth system model. Atmos. Chem. Phys. 2012, 12, 5249–5257. [Google Scholar] [CrossRef] [Green Version]
  37. Lamy, K.; Portafaix, T.; Josse, B.; Brogniez, C.; Godin-Beekmann, S.; Bencherif, H.; Revell, L.; Akiyoshi, H.; Bekki, S.; Hegglin, M.I.; et al. Clear-sky ultraviolet radiation modelling using output from the chemistry climate model initiative. Atmos. Chem. Phys. 2019, 19, 10087–10110. [Google Scholar] [CrossRef] [Green Version]
  38. Egorova, T.; Rozanov, E.; Gröbner, J.; Hauser, M.; Schmutz, W. Montreal protocol benefits simulated with CCM SOCOL. Atmos. Chem. Phys. 2013, 13, 3811–3823. [Google Scholar] [CrossRef] [Green Version]
  39. Pastukhova, A.S.; Chubarova, N.E.; Zhdanova, Y.Y.; Galin, V.Y.; Smyshlyaev, S.P. Numerical simulation of variations in ozone content, erythemal ultraviolet radiation, and ultraviolet resources over Northern Eurasia in the 21st century. Izv. Atmos. Ocean. Phys. 2019, 55, 242–250. [Google Scholar] [CrossRef]
  40. McKenzie, R.L.; Liley, J.B.; Björn, L.O. UV radiation: Balancing risks and benefits. Photochem. Photobiol. 2009, 85, 88–98. [Google Scholar] [CrossRef]
  41. Kinne, S. The Macv2 aerosol climatology. Tellus B Chem. Phys. Meteorol. 2019, 71, 1–21. [Google Scholar] [CrossRef] [Green Version]
  42. Dee, D.P.; Uppala, S.M.; Simmons, A.J.; Berrisford, P.; Poli, P.; Kobayashi, S.; Andrae, U.; Balmaseda, M.A.; Balsamo, G.; Bauer, P.; et al. The ERA-Interim reanalysis: Configuration and performance of the data assimilation system. Q. J. R. Meteorol. Soc. 2011, 137, 553–597. [Google Scholar] [CrossRef]
  43. Galin, V.Y.; Smyshlyaev, S.P.; Volodin, E.M. Combined chemistry-climate model of the atmosphere. Izv. Atmos. Ocean. Phys. 2007, 43, 399–412. [Google Scholar] [CrossRef]
  44. Volodin, E.M.; Mortikov, E.V.; Kostrykin, S.V.; Galin, V.Y.; Lykossov, V.N.; Gritsun, A.S.; Diansky, N.A.; Gusev, A.V.; Iakovlev, N.G. Simulation of the present-day climate with the climate model INMCM5. Clim. Dyn. 2017, 49, 3715–3734. [Google Scholar] [CrossRef]
  45. Chubarova, N.Y.; Nezval, Y.I. Ozone, aerosol and cloudiness impacts on biologically effective radiation and UV radiation less 380nm. In Proceedings of the IRS’96 Current Problems in Atmospheric Radiation; Smith, S., Ed.; A Deepak Publishing: Hampton, VA, USA, 1997; pp. 886–889. [Google Scholar]
  46. Booth, C.R.; Madronich, S. Radiation amplification factors: Improved formulation accounts for large increases in ultraviolet radiation associated with antarctic ozone depletion. In Ultraviolet Radiation in Antarctica: Measurements and Biological Effects; American Geophysical Union (AGU): Washington, DC, USA, 2013; pp. 39–42. ISBN 978-1-118-66794-1. [Google Scholar]
  47. Chubarova, N.; Zhdanova, Y.; Nezval, Y. A new parameterization of the UV irradiance altitude dependence for clear-sky conditions and its application in the on-line UV tool over Northern Eurasia. Atmos. Chem. Phys. 2016, 16, 11867–11881. [Google Scholar] [CrossRef] [Green Version]
  48. Madronich, S.; Flocke, S. The role of solar radiation in atmospheric chemistry. In Handbook of Environmental Chemistry Reactions and Processes; Boule, P., Hutzinger, O., Eds.; Springer: Berlin/Heidelberg, Germany, 1998; Volume 2, pp. 1–26. [Google Scholar]
  49. Rublev, A.; Trembach, V. 3D Monte-Carlo models and radiative transfer online tools. Intercomparison of three-dimensional radiation codes. In Proceedings of the Three-Dimensional Radiation Codes: Abstracts of the First and Intercomparison Second International Workshops; Cahalan, R.F., Davies, R., Eds.; University of Arizona Press: Tucson, AZ, USA, 2000; pp. 14–18. ISBN 0-9709609-0-5. [Google Scholar]
  50. WMO (World Meteorological Organization). Scientific Assessment of Ozone Depletion: 2006; Global Ozone Research and Monitoring Project—Report No. 50; WMO: Geneva, Switzerland, 2007; p. 572. [Google Scholar]
  51. Intergovernmental Panel on Climate Change (IPCC). Climate change 2001: The scientific basis. In Contribution of Working Group I to the Third Assessment Report of the Intergovernmental Panel on Climate Change; Houghton, J.T., Ding, Y., Griggs, D.J., Noguer, M., van der Linden, P.J., Dai, X., Maskell, K., Johnson, C.A., Eds.; Cambridge University Press: Cambridge, UK; New York, NY, USA, 2001; p. 881. [Google Scholar]
  52. Intergovernmental Panel on Climate Change (IPCC). Climate change 2013: The physical science basis. In Contribution of Working Group I to the Fifth Assessment Report of the Intergovernmental Panel on Climate Change; Stocker, T.F., Qin, D., Plattner, G.-K., Tignor, M., Allen, S.K., Boschung, J., Nauels, A., Xia, Y., Bex, V., Midgley, P.M., Eds.; Cambridge University Press: Cambridge, UK; New York, NY, USA, 2013; p. 1535. [Google Scholar]
  53. Dewolfe, W.A.; Wilson, A.; Lindholm, D.M.; Pankratz, C.K.; Snow, M.A.; Woods, T.N. Solar irradiance data products at the LASP interactive solar irradiance datacenter (LISIRD). AGU Fall Meet. Abstr. 2010, 21, GC21B-0881. [Google Scholar]
  54. Thomason, L.; Peter, T. (Eds.) SPARC: SPARC Assessment of Stratospheric Aerosol Properties (ASAP). SPARC Report No. 4, WCRP-124, WMO/TD—No. 1295. 2006. Available online: www.sparc-climate.org/publications/sparc-reports/ (accessed on 1 October 2019).
  55. Rayner, N.A.; Parker, D.E.; Horton, E.B.; Folland, C.K.; Alexander, L.V.; Rowell, D.P.; Kent, E.C.; Kaplan, A. Global analyses of sea surface temperature, sea ice, and night marine air temperature since the late nineteenth century. J. Geophys. Res. Atmos. 2003, 108. Available online: https://agupubs.onlinelibrary.wiley.com/doi/10.1029/2002JD002670 (accessed on 1 October 2019). [CrossRef]
  56. Stenke, A.; Schraner, M.; Rozanov, E.; Egorova, T.; Luo, B.; Peter, T. The SOCOL version 3.0 chemistry–climate model: Description, evaluation, and implications from an advanced transport algorithm. Geosci. Model Dev. 2013, 6, 1407–1427. [Google Scholar] [CrossRef] [Green Version]
  57. Dragani, R. On the Quality of the ERA-Interim Ozone Reanalyses. Part I: Comparisons with In Situ Measurements; ERA Report Series, No. 2; ECMWF: Reading, UK, 2010; Available online: https://www.ecmwf.int/node/9111 (accessed on 11 October 2019).
  58. Dragani, R. On the Quality of the ERA-Interim Ozone Reanalyses. In Part II: Comparisons with Satellite Data; ERA Report Series, No. 3; ECMWF: Reading, UK, 2010; Available online: https://www.ecmwf.int/node/9112 (accessed on 11 October 2019).
  59. Dragani, R. On the quality of the ERA-Interim ozone reanalyses: Comparisons with satellite data. Q. J. R. Meteorol. Soc. 2011, 137, 1312–1326. [Google Scholar] [CrossRef]
  60. Davis, S.M.; Hegglin, M.I.; Fujiwara, M.; Dragani, R.; Harada, Y.; Kobayashi, C.; Long, C.; Manney, G.L.; Nash, E.R.; Potter, G.L.; et al. Assessment of upper tropospheric and stratospheric water vapor and ozone in reanalyses as part of S-RIP. Atmos. Chem. Phys. 2017, 17, 12743–12778. [Google Scholar] [CrossRef] [Green Version]
  61. Zhang, X.; Liang, S.; Wang, G.; Yao, Y.; Jiang, B.; Cheng, J. Evaluation of the reanalysis surface incident shortwave radiation products from NCEP, ECMWF, GSFC, and JMA using satellite and surface observations. Remote Sens. 2016, 8, 225. [Google Scholar] [CrossRef] [Green Version]
  62. Träger-Chatterjee, C.; Müller, R.W.; Trentmann, J.; Bendix, J. Evaluation of ERA-40 and ERA-interim re-analysis incoming surface shortwave radiation datasets with mesoscale remote sensing data. Meteorol. Z. 2010, 19, 631–640. [Google Scholar] [CrossRef]
  63. Szczypta, C.; Calvet, J.-C.; Albergel, C.; Balsamo, G.; Boussetta, S.; Carrer, D.; Lafont, S.; Meurey, C. Verification of the new ECMWF ERA-interim reanalysis over France. Hydrol. Earth Syst. Sci. 2011, 15, 647–666. [Google Scholar] [CrossRef] [Green Version]
  64. TOMS Science Team (Unrealeased), TOMS Nimbus-7 Total Ozone Aerosol Index UV-Reflectivity UV-B Erythemal Irradiances Daily L3 Global 1 deg × 1.25 deg V008; Goddard Earth Sciences Data and Information Services Center (GES DISC): Greenbelt, MD, USA, 2017. Available online: https://disc.gsfc.nasa.gov/datacollection/TOMSN7L3_008.html (accessed on 17 January 2017).
  65. TOMS Science Team (Unrealeased), TOMS Earth-Probe Total Ozone (O3) Aerosol Index UV-Reflectivity UV-B Erythemal Irradiance Daily L3 Global 1 deg × 1.25 deg V008; Goddard Earth Sciences Data and Information Services Center (GES DISC): Greenbelt, MD, USA, 2017. Available online: https://disc.gsfc.nasa.gov/datacollection/TOMSEPL3_008.html (accessed on 17 January 2017).
  66. Jari, H.; Antii, A.; Johanna, T. OMI/Aura Surface UVB Irradiance and Erythemal Dose Daily L3 Global Gridded 1.0 degree × 1.0 degree V3; NASA Goddard Space Flight Center: Greenbelt, MD, USA; Goddard Earth Sciences Data and Information Services Center (GES DISC): Greenbelt, MD, USA, 2013. Available online: http://www.10.5067/Aura/OMI/DATA3009 (accessed on 16 January 2017).
  67. Krotkov, N.A.; Herman, J.R.; Bhartia, P.K.; Seftor, C.J.; Arola, A.; Kaurola, J.; Kalliskota, S.; Taalas, P.; Geogdzhayev, I.V. Version 2 total ozone mapping spectrometer ultraviolet algorithm: Problems and enhancements. Opt. Eng. 2002, 41, 3028–3040. [Google Scholar]
  68. Arola, A.; Kazadzis, S.; Krotkov, N.; Bais, A.; Gröbner, J.; Herman, J.R. Assessment of TOMS UV bias due to absorbing aerosols. J. Geophys. Res. Atmos. 2005, 110. Available online: https://agupubs.onlinelibrary.wiley.com/doi/10.1029/2005JD005913 (accessed on 15 November 2019). [CrossRef] [Green Version]
  69. Bodeker, G.E.; Shiona, H.; Eskes, H. Indicators of Antarctic ozone depletion. Atmos. Chem. Phys. 2005, 5, 2603–2615. [Google Scholar] [CrossRef] [Green Version]
  70. Zhdanova, Y.; Chubarova, N.; Nezval, Y. A method of estimating cloud transmission in the UV spectral range using data from different satellite measurements and reanalysis. In AIP Conference Proceedings; AIP: College Park, MD, USA, 2013; Volume 1531, pp. 911–914. [Google Scholar]
  71. Fitzpatrick, T.B. The Validity and practicality of sun-reactive skin types I through VI. Arch. Dermatol. 1988, 124, 869–871. [Google Scholar] [CrossRef] [PubMed]
  72. World Health Organization; World Meteorological Organization; United Nations Environment Programme, International Commission on Non-Ionizing Radiation Protection. Global Solar UV Index: A Practical Guide: A JOINT RECOMMENDATION of World Health Organization; WHO: Geneva, Switzerland, 2002; p. 28. [Google Scholar]
  73. Rationalizing Nomenclature for UV Doses and Effects on Humans; Joint Publication of CIE and WMO. CIE 209:2014, WMO/GAW Report No. 211. 2014, p. 14. Available online: https://library.wmo.int/doc_num.php?explnum_id=7176 (accessed on 1 October 2019).
  74. Holick, M.F.; Jenkins, M. The UV Advantage: New Medical Breakthroughs Reveal Powerful Health Benefits from Sun Exposure and Tanning; Ibook: New York, NY, USA, 2003. [Google Scholar]
  75. Petropavlovskikh, I.; Godin-Beekmann, S.; Hubert, D.; Damadeo, R.; Hassler, B.; Sofieva, V.; Commission, I.O. GAW Report, 241. SPARC/IO3C/GAW Report on Long-Term Ozone Trends and Uncertainties in the Stratosphere; World Meteorological Organization (WMO): Geneva, Switzerland, 2018. [Google Scholar]
  76. Petropavlovskikh, I.; Evans, R.; McConville, G.; Manney, G.L.; Rieder, H.E. The influence of the North Atlantic Oscillation and El Niño—Southern oscillation on mean and extreme values of column ozone over the United States. Atmos. Chem. Phys. 2015, 15, 1585–1598. [Google Scholar] [CrossRef] [Green Version]
  77. Vigouroux, C.; Blumenstock, T.; Coffey, M.; Errera, Q.; García, O.; Jones, N.B.; Hannigan, J.W.; Hase, F.; Liley, B.; Mahieu, E.; et al. Trends of ozone total columns and vertical distribution from FTIR observations at eight NDACC stations around the globe. Atmos. Chem. Phys. 2015, 15, 2915–2933. [Google Scholar] [CrossRef] [Green Version]
  78. Nezval, E.I.; Chubarova, N.E. Long-term variability of UV radiation in the spectral range of 300–380 nm in Moscow. Russ. Meteorol. Hydrol. 2017, 42, 693–699. [Google Scholar] [CrossRef]
  79. Trenberth, K.E.; Fasullo, J.T. Global warming due to increasing absorbed solar radiation. Geophys. Res. Lett. 2009, 36. Available online: https://agupubs.onlinelibrary.wiley.com/doi/10.1029/2009GL037527 (accessed on 1 October 2019). [CrossRef] [Green Version]
  80. Eyring, V.; Shepherd, T.G.; Waugh, D.W. (Eds.) SPARC CCMVal Report on the Evaluation of Chemistry-Climate Models. SPARC Report No. 5, WCRP-30, WMO/TD-No. 400. 2010. Available online: http://www.atmosp.physics.utoronto.ca/SPARC/ccmval_final/index.php (accessed on 1 October 2019).
  81. Liu, Y.; Key, J.R.; Liu, Z.; Wang, X.; Vavrus, S.J. A cloudier Arctic expected with diminishing sea ice. Geophys. Res. Lett. 2012, 39. Available online: https://agupubs.onlinelibrary.wiley.com/doi/10.1029/2012GL051251 (accessed on 1 October 2019).
Figure 1. Relative difference (in %) between the new (Macv2) and the old (Macv1) aerosol correction factors, CF for the central months of the seasons: January (A), April (B), July (C), October (D).
Atmosphere 11 00059 g001
Figure 2. Absolute difference between the UV indices in 2005 with the application of the updated Macv2 CF factor minus UV indices with the standard OMI CF factor correction [68] for central months of the seasons: January (A), April (B), July (C), October (D). UV index is a widely used unitless quantity, defined by multiplying erythemal irradiance by 40 [1].
Atmosphere 11 00059 g002
Figure 3. Climatology of the total ozone content (in Dobson units) over 1979–2015 according to the INM-RSHU CCM, ERA-Interim reanalysis, and TOMS/OMI satellite data. X-axis—is longitude, Y-axis—is latitude.
Atmosphere 11 00059 g003
Figure 4. Climatology of the cloud modification factor (CMFuv) according to different datasets over the 1979–2015 period. Note, that the satellite CMFuv climatology has been obtained according to the TOMS data for the 1979–2002 period according to [14]. X-axis—is longitude, Y-axis—is latitude.
Atmosphere 11 00059 g004
Figure 5. Difference in the average of annual Eery anomalies for the period 2000–2015 and the period 1979–1999, due to changes in total ozone column according to effects of different anthropogenic and natural factors. INM-RSHU CCM simulations. Statistically significant difference at p = 95% are shown by white hatching. X-axis—is longitude, Y-axis—is latitude.
Atmosphere 11 00059 g005
Figure 6. Decadal trends in annually averaged Eery anomalies (%/decade) due to changes in total ozone column according to the effects of anthropogenic (ODS) and different natural factors. INM-RSHU CCM simulations, 1979–2015. Statistically significant trends at 95% are shown by white hatching. X-axis—is longitude, Y-axis—is latitude.
Atmosphere 11 00059 g006
Figure 7. Difference in the average of Eery anomalies for the period 2000–2015 and the period 1979–1999 due to total ozone changes calculated from the different datasets. Statistically significant differences at 95% are shown by white hatching. Note that the left-bottom panel is identical to the bottom panel of Figure 5. X-axis—is longitude, Y-axis—is latitude.
Atmosphere 11 00059 g007
Figure 8. The time series of the Eery relative anomalies against 2000 at 48° N from 0° E to 150° E according to the INM-RSHU CCM, ERA-Interim, and TOMS/OMI satellite datasets.
Atmosphere 11 00059 g008
Figure 9. Spatial distribution of the decadal trend in Eery caused by changes in total ozone over the period 1979–2015, calculated from the INM-RSHU CCM, ERA-Interim, and TOMS/OMI satellite datasets. Statistically significant differences at 95% are shown by white hatching. Note that the left-bottom panel is identical to bottom panel of Figure 6. X-axis—is longitude, Y-axis—is latitude.
Atmosphere 11 00059 g009
Figure 10. Difference in the average of CMFuv anomalies for the period 2000–2015 and the period 1979–1999 according to the INM-RSHU CCM simulations and the retrievals from the ERA-Interim dataset. Statistically significant differences at p = 95% are shown by white hatching. X-axis—is longitude, Y-axis—is latitude.
Atmosphere 11 00059 g010
Figure 11. The decadal trends in Eery due to changes in cloudiness according to the INM-RSHU CCM simulations and the retrievals from the ERA-Interim dataset over the 1979–2015 period. Statistically significant trends at 95% level are shown by hatching. X-axis—is longitude, Y-axis—is latitude.
Atmosphere 11 00059 g011
Figure 12. Seasonal and annual differences in Eery anomalies between the 2000–2015 and 1979–1999 periods due to combined effects of changes in total ozone column and cloudiness according to the INM-RSHU CCM model, the ERA-Interim dataset, and Eery retrievals from the TOMS/OMI satellite dataset with the additional Macv2 aerosol correction. Statistically significant difference at 95% are shown by hatching. Note, that we do not present UV retrievals from the TOMS/OMI dataset for January and for annual mean due to the problems in UV retrievals in conditions with high surface snow/ice albedo. X-axis—is longitude, Y-axis—is latitude.
Atmosphere 11 00059 g012
Figure 13. Spatial distribution of the decadal trend in Eery caused by the combined effect of total ozone and cloudiness calculated from the INM-RSHU CCM, ERA-Interim, and TOMS/OMI satellite datasets. Statistically significant differences at 95% are shown by hatching. Note, that we do not present UV retrievals from the TOMS/OMI dataset for January and for annual mean due to the problems in UV retrievals in conditions with high surface snow/ice albedo. X-axis—is longitude, Y-axis—is latitude.
Atmosphere 11 00059 g013
Figure 14. UV resources for 1979 and 2015 and changes in their distribution between 2005 and 1979 according to the retrievals from the ERA-Interim data for different skin types. X-axis—is longitude, Y-axis—is latitude.
Atmosphere 11 00059 g014aAtmosphere 11 00059 g014bAtmosphere 11 00059 g014c
Table 1. Main statistics of total ozone column X (DU) and cloud modification factor CMFuv over Northern Eurasia for the 1979–2015 period *.
JanuaryAprilJulyOctoberYear
Total Ozone Column, X, DU
Mean ± confidence interval at p = 95%
INM-RSHU CCM390 ± 4384 ± 4306 ± 2320 ± 2350 ± 3
ERA-Interim365 ± 1387 ± 1326 ± 0.3302 ± 1346 ± 1
TOMS/OMI370 ± 1386 ± 1326 ± 0.4302 ± 1346 ± 1
Median
INM-RSHU CCM385385304320352
ERA-Interim350381327293336
TOMS/OMI354380327293336
Standard Deviation
INM-RSHU CCM3228171721
ERA-Interim402591820
TOMS/OMI3826111920
Case Number (Number of Pixels)
INM-RSHU CCM234234234234234
ERA-Interim39903990399039903990
TOMS/OMI31923192319231923192
Cloud Modification Factor, CMFuv
Mean
INM-RSHU CCM0.83 ± 0.010.80 ± 0.010.79 ± 0.010.80 ± 0.010.80 ± 0.01
ERA-Interim0.77 ± 0.0030.82 ± 0.0020.79 ± 0.0030.78 ± 0.0030.78 ± 0.002
TOMS (1979–2002)0.64 ± 0.0030.73 ± 0.0030.73 ± 0.0030.69 ± 0.0030.69 ± 0.002
Median
INM-RSHU CCM0.820.800.780.790.81
ERA-Interim0.750.820.780.770.77
TOMS (1979–2002)0.640.730.730.670.68
Standard Deviation
INM-RSHU CCM0.070.060.110.050.07
ERA-Interim0.100.060.080.090.07
TOMS (1979–2002)0.100.080.100.090.07
Case Number (Number of Pixels)
INM-RSHU CCM234234234234234
ERA-Interim41584158415841584158
TOMS (1979–2002)41584158415841584158
* For comparison purpose the calculations were made only over the same areas.
Table 2. The description of the numerical INM-RSHU CCM experiments shown in Figure 5 and Figure 6.
NamesFactorsAll Factors Together
Anthropogenic EffectSolar ActivityStratospheric AerosolSST/SIC
DescriptionODS changes were accounted over the 1979–2015 period according to [6]. All other parameters were set for 1979.The changes in extraterrestrial solar fluxes were accounted over the 1979–2015 period according to [53]. All other parameters were set for 1979.The changes in stratospheric aerosol were accounted over the 1979–2015 period according to [54]. All other parameters were set for 1979.The changes in SST/SIC were accounted over the 1979–2015 period according to [55]. All other parameters were set for 1979.The changes of all factors were accounted over the 1979–2015 period.

