Change-Point Analysis of Precipitation and Drought Extremes in China over the Past 50 Years
by
 ,
,
Min Liu
1,* ,
,
Pengfei Liu
1,
Ying Guo
2,
Yanfang Wang
3,
Xinxin Geng
1,
Zhenlong Nie
1,* and
Yang Yu
4 1
Institute of Hydrology and Environmental Geology, Chinese Academy of Geological Sciences, Shijiazhuang 050061, China
2
Center for Agricultural Resources Research, Institute of Genetics and Developmental Biology, Chinese Academy of Sciences, Shijiazhuang 050021, China
3
College of Land Resource and Urban and Rural Planning, Hebei GEO University, Shijiazhuang 050031, China
4
School of Civil and Environmental Engineering, University of Technology Sydney, Sydney, NSW 2007, Australia
*
Authors to whom correspondence should be addressed.
Atmosphere 2020, 11(1), 11; https://doi.org/10.3390/atmos11010011
Submission received: 3 December 2019
/
Revised: 14 December 2019
/
Accepted: 17 December 2019
/
Published: 20 December 2019
(This article belongs to the Special Issue Precipitation and Climate Change: Accomplishments and Challenges)
Abstract
:Increases in climate extremes and their impacts have attracted global attention recently. In this study, the change-point years of precipitation extremes (PEs) and drought extremes (DEs) were investigated by Moving t-Test at 500 stations across the six regions in China. The detailed temporal change processes of them were demonstrated by the cumulative deviation method based on the data from nine typical stations. The results showed that: 1) DEs were more significantly and widely increased than PEs, the stations with increasing trends of PEs and DEs accounted for greater than 52.6% and 61.6% of the total, respectively; 2) increasing trends of DEs were mainly distributed in the east of Hu Huanyong Line. In this area, the increasing change-point years of DEs often occurred in the early 1980s in the south of the Yangzi River, while occurred in the 1990s in the north of the Yangzi River; 3) increasing trends of PEs were mainly distributed in Qing-Tibet Platen, Northwest China, and the southeastern area of Hu Huanyong Line. In these areas, the increasing change-point years of PEs often occurred around 1990 in the southeast of Hu Huanyong Line, while often occurred in the early 1980s in Qing-Tibet Platen. The results indicated that the area in the southeast of Hu Huanyong Line was under the threats of both PEs and DEs, this may produce severe impacts on agriculture, environment, water resources management, human society, etc.
1. Introduction
The increase in frequency, intensity, and duration of extreme climate events is one of the important features of global change, and one of the most serious challenges facing human society [1]. The fifth Intergovernmental Panel on Climate Change assessment report (IPCC AR5) documented that the frequency of global extreme climate events would increase rapidly and the scope of their impacts would be enlarged in the 21st century [2]. This has aroused widespread concern of the scientific community, the government, and the public globally.
Extreme climate event is defined as the occurrence of an extreme weather or climate event with a weather or climate variable having a value above (or below) a threshold near the upper (or lower) end of the range of observed values of the variable [3]. In the last couple of decades, studies on climate extremes under climate changes increased sharply all over the world [3,4,5,6,7,8,9,10,11,12,13,14], especially in the researches concentrated on the precipitation extremes (PEs) [8,9,10,12,14,15,16,17,18,19,20,21,22,23] and drought extremes (DEs) [9,13,24,25,26,27], most of which were focused on the definition, related indices, change trends, attribution, and their impacts. Frich et al. (2002) [7] found that under the background of global warming, the range of increasing precipitation in the middle and high latitudes of the Northern Hemisphere was widened, and extreme precipitation events may be more frequent. Overall, though precipitation extremes varied in different regions of the world, the frequency of precipitation extremes increased in more than half of the global land area [2,28,29]. For example, precipitation extremes were found to occurred more in many areas of USA [10,18], China [30,31,32,33,34,35,36], Argentina [37], South Africa [15], Romania [22], New Zealand [38], etc. In the meantime, a series of drought extremes were reported all over the world, which have attracted wide attention. For example, the severe drought in the Amazon in 2005 and 2010 [39,40], the worst droughts in Australia in the last 200 years [25,26] and the Mediterranean basin [9,13,41,42]. The increases in extreme precipitation and drought events produced severe impacts on agriculture, environment, water resources management, and so on.
Precipitation in China is uneven in spatial and temporal scales, high variability in precipitation increased not only precipitation extremes but also drought extremes. Among all the extreme climate events, precipitation and drought extremes may be the first two that have severe and lasting disastrous impacts on the agriculture, ecological environment, and human society. In the past two decades, there have been more and more studies [14,24,27,30,31,32,33,34,35,43,44,45,46,47,48] in this field, in China since 1999, the researcher Zhai et al. [6] published their article about the changes of climate extremes in China. Regionally in precipitation extremes, in Southeast China, an increasing frequency trend was detected [30,32,34,36,45,46], especially in the middle and lower reaches of the Yangtze River [14,30,45] and in the coastal areas [34]. While PEs in Northeast China was also detected a decreasing trend [45,49]. However, the PE trends in some regions were in dispute, in Northwest China, Wang et al. (2009) [32] found the frequency of precipitation extreme increased, while Yang et al. (2008) [45] concluded that PEs increased in western part of Northwest China but decreased in eastern part of Northwest China. In Southwest China, a decreasing trend in PEs was reported by Wang et al. (2009) [32], while in Hengduan Mountains of this region, Li et al. (2011) [46] found a nonsignificant increasing trend for 1960–2008. In North China, PE was identified as a decreasing trend by many researchers [32,36,45], while Li et al. (2010) [33] found a not significant increasing trend in Loess Plateau of China. In studies concentrated on DE trends, increasing tendency was reported in North China, Southwest China, and Southeast China, by indices of short or long dry days [44], daily precipitation [24], and consecutive dry days [36]. However, the DE trend in Northeast China was in dispute, Wang et al. (2013) [48] found the consecutive dry days decreased while Liang et al. (2016) [49] reported an increase in consecutive dry days. In summary, there were more studies focus on PEs, while fewer ones focused on DEs, especially in Southeastern part of China, and in some regions the trends were still in dispute due to high regional variability of precipitation and drought extremes and the complex and diverse climatic types in China. More, there were more contributions in regional while less in the whole China. Besides, most of studies were focused on the changing trend while few were focused on the change-point analysis and the concrete change process of the PE and DE series.
The objective of this study is: 1) to calculate the accurate change-point years of PEs and DEs at each meteorological station across China, based on the time series of the frequency and intensity of PEs and DEs in our previous paper [36]; 2) to then investigate the spatial distribution of their increasing change-point years of PEs and DEs by dividing the whole China into six climatic regions; and 3) in the end, nine typical stations were selected based on the regions and the spatial distribution pattern of the change-point years to demonstrate the concrete temporal change processes of the frequency and intensity of PEs and DEs by the cumulative deviation. The expected results would provide data for risk management of climate changes.
2. Data and Methods
2.1. Study Area and Data
Located on the west coast of the Pacific Ocean and in the eastern part of Eurasia, China has a total land area of about 9.6 million square kilometers. The terrain is high in the west, and low in the east. China has a complex and diverse topography. The mountains, highlands and hills account for about 67% of the land area, while the basins and plains account for about 33%. Influenced by the special geographical location, topography and other factors, a variety of climate types have been formed, such as the tropical and subtropical monsoon climate, the temperate monsoon climate, the temperate continental climate, the plateau mountain climate and so on. Annual precipitation increases from northwest to southeast, with the minimum less than 50 mm in the desert region of northwest, and the maximum greater than 1600 mm in the southeast coastal region (Figure 1). Regionally, annual precipitation showed increasing trends in Southeast China, Southwest China, Qing-Tibet Platen, and Northwest China while decreasing trends in the areas around the Hu Huanyong Line, i.e., the line of Northeast China, North China and the border area between Qing-Tibet Platen and Southwest China [50,51]. Based on the hydrogeographic and climatic characteristics, China was divided into six regions for change-point analysis in this study, i.e., Northeast China, North China, Southeast China, Southwest China, Qing-Tibet Platen, and Northwest China (Figure 1).
Data for this study were provided by the China Meteorological Administration from 680 stations across China from 1 January 1961 to 31 January 2008. Observations mainly include daily precipitation, Observation type, data quality control, and data processing were the same as our previous paper [36]. After data quality control, 500 stations were adopted in this study (Figure 1a).
2.2. Methods
2.2.1. Thresholds of Precipitation and Drought Extremes
In this study, the 95th percentile was chosen as the PE threshold grade. This is a fraction of total daily precipitation that exceeds the 95th percentile of the distribution for daily amounts (daily precipitation greater than or equal to 0.1 mm) from 1971 to 2000, and the corresponding precipitation value is the PE threshold value. Using this method, PE thresholds at each meteorological station can be determined.
In the threshold determination of DEs [36], a supposed level of consecutive dry days (CDD) was determined as the DE threshold for each meteorological station. That is, if an observed CDD is longer than the supposed CDD, it can be called a DE event. CDD in this study refers to consecutive days with daily rainfall less than 0.1 mm, which are climatically nonprecipitation days. We put the daily data in a time-consecutive order so that the CDD would not be split by the end of the year when counting the length of the CDD. The threshold value was obtained in the following ways. The CDD series were obtained by arithmetic progression, i.e., 2, 5, 8, …, and the corresponding times of occurrence of each CDD element during 1971 to 2000 were computed based on the relationship between the CDD series and its frequency occurrence series, the probability density function of CDD could be established, and then the cumulated distribution function be established. The 95th percentile was also chosen as the DE threshold, i.e., if an observed CDD was longer than the corresponding 95th percentile CDD value, it could be called a DE event.
The number of PE occurrences per year and the annual maximum daily precipitation (MDP) were selected as the frequency and intensity indices of the precipitation extremes respectively, and the number of DE occurrences per year and the annual maximum consecutive dry days (MCDD) were chosen as the frequency and intensity indices of the drought extreme respectively. Based on these indices, the series of frequencies of PEs and DEs were obtained by the annual number of threshold exceedance respectively, and the series of intensities of them were obtained by annual MDP and MCDD respectively.
2.2.2. Change-Point Analysis
Moving t-Test was employed to detect the trends and change-point years of PEs and DEs in this study. It is one of the most commonly used methods for testing a hypothesis based on a difference between sample means [52]. The formula for calculation is as follows:
in which,
where , si and ni are the mean, standard deviation and length of two sub-samples. The numerator of equation (1) is the difference between the two subsequences, the denominator of Equation (1) is the estimate of the dispersion, is the degrees of freedom.
Moving t-Test is done by selecting two adjacent sub-samples of fixed length, then slide backwards in turn, finally take the best change-point [53]. Compared to the Student’s t-Test, Moving t-Test could estimate multiple change-points, and estimate the main trend of the series according to the property (positive or negative) of the maximum change-point , i.e., when the t value of the maximum change-point is negative, it indicates an increasing change-point, while positive indicates a decreasing one. Let the length of the sub-sample series be 10, for a fixed significance level = 0.1 in the present paper, the corresponding critical value = 1.73. If the calculated value > , it indicates a significant trend, while describes a nonsignificant trend.
2.2.3. Cumulative Deviation Analysis
Cumulative deviation method is highly recommended for intuitively judging the trend of a series from the changing curve [54]. For a series x, the cumulative deviation of at a given time t could be expressed as:
in which, . When the cumulative deviation values are all calculated, the cumulative deviation curve could be obtained. The cumulative deviation curve is more intuitive than the original series, from the obvious ups and downs of the curve, we can judge its changing trend of the long-term evolution process, and even diagnose the approximate time of change-points.
3. Results
It is reported that large-scale climate background had changed greatly in the early 1980s, and PEs occurred more and more since the 1980s in China [43]. The changing trends of precipitation and drought extremes were analyzed with relative changes rate method by dividing the whole period into two sub-periods, taking 1984 as the point in our previous paper [36]. In this study, the accurate change-point years of the precipitation and drought extremes were detected by Moving t-Test, their trends (increase or decrease) and significance were determined by the positive or negative sign of the maximum change-point and the value of , respectively. The analysis focused on the areas where precipitation extremes (PEs) and drought extremes (DEs) increased because of the potential threats of disasters it may produce. For the convenience of comparison with the previous results [36], the stations were divided into four types: 1) significant change-point year after 1984, 2) significant change-point year before 1985, 3) nonsignificant change-point year before 1985, and 4) nonsignificant change-point year after 1984. Based on the spatial distribution pattern of their increasing change-point year, typical stations were selected from each typical area, and the concrete change process was analyzed.
3.1. Spatial Distribution of Change-Point Years of Increasing Precipitation Extremes
The stations with increasing change-point of frequency of PEs accounted for 59.8% of the total stations (Table 1). This is in accordance to the result of the trend analysis in Liu et al. (2019) [36], and the distributions of them (Figure 2) were similar to that with relative change rate greater than 1% in Liu et al. (2019) [36]. It manifested that positive or negative sign of the maximum change-point could indicate the general trend of a time series.
Regionally, the stations with increasing change-point of frequency of precipitation extremes (FPEs) were distributed in most of Southeast China, Southwest China, Qing-Tibet Plateau and Northwest China (Figure 2a), the stations of them accounted for 70.8%, 60.7%, 69.8%, and 69.2% of the total, respectively. And the significant tests of them were all exceeded half of the total number with increasing changes (Table 1). These regions were mostly in accordance with the conclusion of Wang et al. (2009) [32]. However, there were fewer stations with increasing change-point of FPE in North China and Northeast China, the stations of the two regions accounted for only 43.3% and 49%, respectively. Spatially, there were seldom stations in most of North China (including Shaanxi, Shanxi, Hebei, and Shandong province), in part of Shenyang and Jilin province of Northeast China, and in parts of Eastern Sichuan province of Southwest China. The stations with change-point years before 1985 were mainly distributed in Heilongjiang province and north Inner Mongolia of Northeast China, in the southeastern coastal areas and parts of the lower reaches of the Yangtze River of Southeast China, and in the Tibet area of Qing-Tibet Plateau. While the stations with change-point years after 1984 were mainly distributed in most of Southeast China and Southwest China (Figure 2a).
The increasing change-point year spatial distribution of the intensity of precipitation extremes (IPEs) was similar to that of the frequency, but it’s not exactly the same. It had a slightly higher spatial variability, and the number of stations was fewer than that of frequency in most of the regions except for Northeast China and North China (Figure 2b). However, it still accounted for more than half of total stations, 52.6% of the total number (Table 1). The obvious difference from frequency was Northwest China, whose stations with increasing change-point of IPEs accounted for only 38.5% of the total stations of the region, far less than that of frequency. Specifically, compared to FPEs, the stations with increasing change-point of IPEs were fewer in Heilongjiang province and more in Shenyang and Jilin province of Northeast China, fewer in northern parts of Inner Mongolia, and more in Shandong, Hebei, and Shanxi province of North China. they were fewer in Yunnan province while more in eastern part of Sichuan province of Southwest China and fewer in Xizang province of Qing-Tibet Plateau (Figure 2b). Similar, but not exactly the same to FPEs, the stations with increasing change-point year after 1984 were mainly distributed in most of Southeast China and southeastern part of North China (Figure 2b).
3.2. Spatial Distribution of Change-Point Years of Increasing Drought Extremes
The stations with increasing change-point of frequency of drought extremes (FDEs) accounted for 71.8% of the total stations (Table 2). Regionally, they were distributed in most of Southwest China, Southeast China, North China, and Northeast China (Figure 3a), the stations accounted for 89.3%, 87.0%, 84.5%, and 62.2% of their total stations, respectively, and the significant test of them were all exceeded 60% of the total number with increasing changes (Table 2). While, there were fewer stations with increasing change-point of FDE in Qing-Tibet Plateau and Northwest China. The stations of the two regions accounted for only 25.6% and 40.4%, respectively. These results were in accordance with many previous reports, e.g., the results of DE relative change rate analysis in Liu et al. (2019) [36], the results of the consecutive dry days increased in most of Northeast China in Liang et al. (2016), and the conclusion of Gong et al. (2005) that dry spell increased in Southwest China, North China, and Northeast China. The stations with change-point years before 1985 were mainly distributed in Southeast China, in the southern part of Southwest China, and in most of Northeast China. While the stations with change-point years after 1984 were mainly distributed in most of North China and in the northern part of Southwest China. Besides, there were also a few stations with change-point years after 1984 in the southeast coastal areas of Southeast China and in the southern part of Northeast China (Figure 3a).
The increasing change-point year spatial distribution of the intensity of drought extremes (IDEs) was similar to that of the frequency, but the number of stations was fewer than that of frequency in most of the regions (Figure 3b), except for Southwest China, where the stations with increasing change-points accounted for 94.6% of its total number. However, the stations with increasing change-points of IDEs in the whole China still accounted for more than half of the total stations, 61.6% of the total number (Table 2). Regionally, the stations with increasing change-points of IDEs were mainly distributed in Southwest China, Southeast China, and North China. While there were much fewer stations with increasing change-points IDEs in Qing-Tibet and Northwest China. The obvious difference from frequency was Northeast China, where stations with increasing change-points of IDEs accounted for only 44.9% of the total stations of the region, much less than 62.2% of the frequency. Similar but not exactly the same to FDEs, the stations with increasing change-point years before 1985 of IDEs were mainly distributed in most of Southeast China, while the stations with increasing change-point year after 1984 were mainly distributed in most of North China and Northeast China (Figure 3b).
3.3. Temporal Changes of PE and DE at the Typical Stations of the Regions
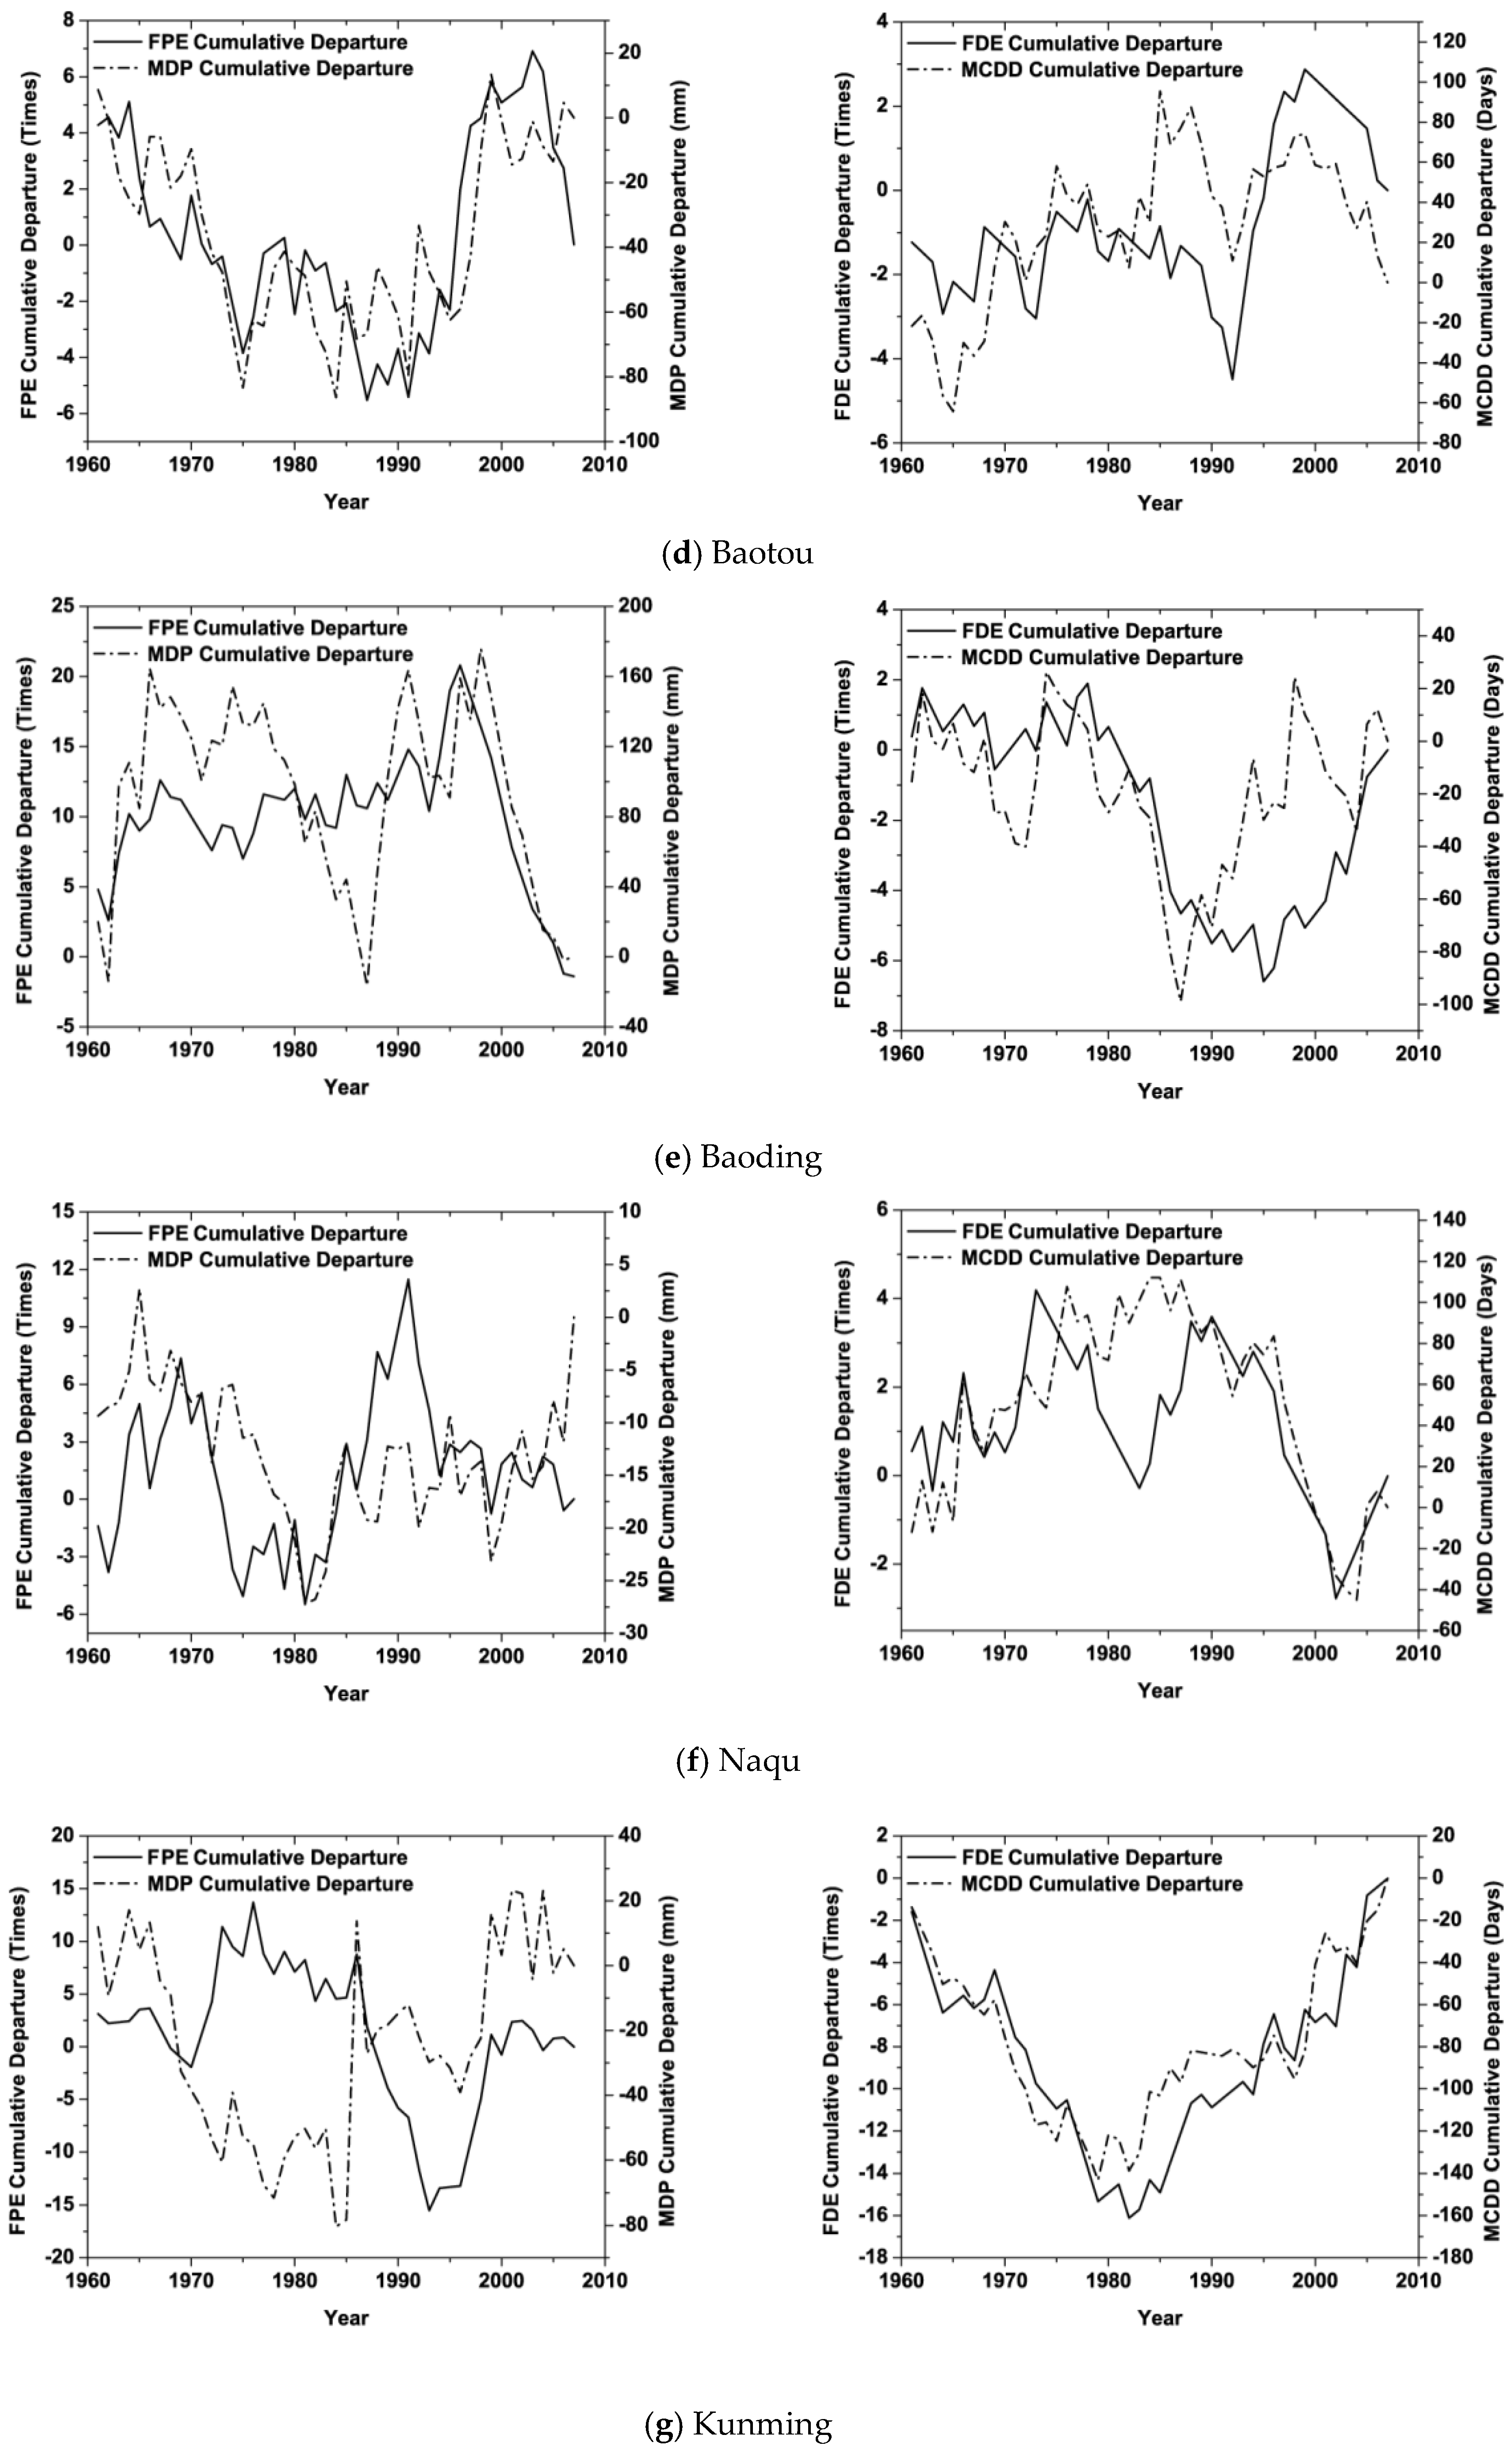
Based on the spatial distribution pattern analysis of the change-point years of PEs and DEs, nine typical stations (Figure 1) were selected from the six regions to demonstrate the concrete temporal change processes of the PE and DE by the cumulative deviation and Moving t-Test methods in this section. The change processes of PEs and DEs at the typical stations could represent most of that in the same regions. Actually, there were many other alternative stations, however, we may not show all of the stations due to the length of the manuscript. Besides, one more typical station was selected from the southeastern coastal regions of South China, the northern part of North China, and the southeastern part of Northwest China, respectively. Because the areas of these three regions, had the change-point years and the changing process show some different patterns to most of the stations in their regions. Cumulative deviations of the frequency and intensity of PEs and DEs at the typical stations were shown in Figure 4, in which the maximum daily precipitation (MDP) represented the intensity of precipitation extremes and the maximum consecutive dry days (MCDD) represented the intensity of drought extremes. The t-values and their corresponding change-point years of the typical stations calculated by Moving t-Test were shown in Table 3.
Harbin, the typical station in Northeast China, entered increasing FPE and IPE periods from around 1976 and 1979, respectively, until around 2000 a decrease period showed. While it entered an increasing FDE and IDE period from around 1995 (Figure 4a and Table 3). Urumqi, the typical station in the western part of Northwest China, entered an increasing FPE period from around 1976 and an increasing IPE period from around 1981. However, decreasing FDE and IDE trends were detected in most of the study period, until around 1994 (FDE) and 2004 (IDE) increasing periods showed (Figure 4b). Zhangye, the typical station of southeastern part of Northwest China, entered a fluctuated increasing period in FPEs from around 1976 and an increasing IPE period from around 1982. FDE and IDE trends showed almost fluctuated increasing trend during the whole period, or from 1980 for FDE and 1970 for IDEs (Figure 4c). So several stations in the southeastern part of Northwest China were under both the threats of PEs and DEs, for it has a similar PE trend to Northwest China but a similar DE trend to North China.
Baotou is the typical station in northern part of North China. Baotou entered increasing FPE and IPE periods from around 1992 (Figure 4d). It also entered an increasing FDE period from around 1991, while a fluctuated decreasing IDE period from around 1985 (Figure 4d). Thus, the northern part of North China may be also under the threats of both PEs and FDEs. Baoding, the typical station of North China, though a fluctuation was detected in 1980 decades due to its double-peak curve of FPEs, there’s no obvious increasing or decreasing trend from the whole time process, but a decreasing period was detected from around 1990 decade (Figure 4e). While FDEs and IDEs showed increasing trends from around 1987 and 1995, respectively (Figure 4e). Naqu, in the Qing-Tibet Platen, entered slightly increasing periods of FPEs and IPEs from around 1982 (Figure 4f), while decreasing periods of FDEs and IDEs from around 1990 (Figure 4f).
Kunming, the typical station in Southwest China, was detected an increasing FPE period from around 1993, and an increasing IPE period from around 1985 (Figure 4g). FDE and IDE figures showed an obviously increasing trend period from early 1980s (Figure 4g). So Southwest China was under the threats of both EPs and DEs. Nanyue, the typical station of Southeast China, entered the increasing FPE and IPE periods from around 1990 (Figure 4h) and the increasing FDE and IDE periods from around 1980 (Figure 4h). Xiamen is in the southeastern coastal region of Southeast China, the FPEs of Xiamen showed a fluctuated continuing increasing trend in the entire time period, IPEs entered an increasing period from late 1990 decade (Figure 4i). While FDEs and IDEs entered increasing periods from late 1980s (Figure 4i).
The analysis of the typical stations was in agreement with that in Section 3.1 and Section 3.2, so the temporal changing process of PEs and DEs in typical stations could represent the most stations with the same spatial pattern in the same climatic regions. The change-point years calculated by Moving t-Test (Table 3) were mostly in accordance with cumulative deviation. And most of them have passed the t-Test at significant level of = 0.1, except for very few stations with the small difference in -values of the two maximum increasing and decreasing change-points. The analysis of typical stations gave us a concrete temporal change process of the PEs and DEs. It not only demonstrated the main present threats of PEs and DEs, but also may indicate the short-term future threats based on the cumulative deviation curve.
The results indicated that the area to the southeast of Hu Huanyong Line was under the threats of both DEs and PEs, since the early 1980s and about 1990, respectively. The area to the southeast of Hu Huanyong Line is the most densely populated and economically developed area in China, so the increases of PEs and DEs may produce severe impacts on agriculture, environment, water resources management, economy, and human society. Besides, North China, which was one of the most important grain-production regions in China, was under significant increasing frequency and intensity of drought extremes, this may lead to tremendous consequences for agricultural activity and the over-exploited groundwater environment.
4. Discussion
The spatial distribution pattern of PE showed a relatively mixed pattern with a higher heterogeneity than that of DEs. The most important reason was that the DE increasing trend was more widespread and significant than that of PEs. The number of stations with increasing frequency and intensity of DEs accounted for 71.8% and 61.6% of the total number in the whole China, respectively, they were more than the stations with increasing frequency and intensity of PEs, which were 59.8% and 52.6%, respectively (Table 1 and Table 2). This was more evident in the six regions, where the maximums of the frequency and intensity have reached 89.3% and 94.6%, far more than that of DEs of 70.8% and 60.5%, respectively, and there were more of them passed the significant test (Table 1 and Table 2). The second reason may be the differences in the variability of the indices themselves. Analysis of changes in PEs was based on daily precipitation amount, which itself has higher variability than that of CDDs, both in spatial and temporal scale. The last reason may partly relate to that meteorological stations are distributed more densely in the eastern area of China. The stations with increasing drought extremes were distributed more in the east of the Hu Huanyong Line, i.e., in North China and Northeast China, while the stations with increasing PEs were distributed more in Qing-Tibet Plateau and Northwest China, except for the same regions of Southeast China and Southwest China. The spatial change pattern of a climate variable often show a relatively higher variability in the uneven and fewer station distributed regions.
Compared to intensity, there were more stations detected with increasing frequencies. For PEs, the stations with increasing frequency accounted for 59.8% of the total, while that of intensity accounted for only 52.6%. For DE, stations with increasing frequency exceeded 70% of the total, while that of intensity accounted for 61.8%. The same was true for the regions, there were four of the six regions with increasing frequency stations exceeded half of the total number, while there were only three of the six regions with increasing intensity exceeded half, in both of PEs and DEs. This illustrated that increasing intensity trends in PEs and DEs were not as widely distributed as frequencies. In the circumstance of climate extremes occurred more with increasing intensity in many reports [1,2,23], This was a minor relief in China, because, the intensity indices of PEs and DEs in this study were MDP (maximum daily precipitation) and MCDD (maximum consecutive dry days), these represent the most extreme events, but the increasing of them accounted for only about half of the total stations, it may indicate a nonsignificant increasing trend in the intensity of PEs and DEs in China as a whole, but in some of the regions, the intensity of PEs and DEs still need to be concerned.
Though change-point analysis of drought extremes at most of the stations (or precipitation extremes at more than half of the stations) have passed the significant test in Moving t-Test, there were still parts of them which have not passed the significant test, this was more evident in precipitation extremes (Table 1 and Table 2). This may indicate a nonsignificant increasing trend, or partly be due to there were multiple change-points with the -values with small difference in the study period. However, combined with the cumulative deviation analysis, the concrete temporal change process could be clearly demonstrated. Besides, the temporal change process only represented most of the stations, but not all of the stations, especially in precipitation extremes, due to the high heterogeneity in the spatial distribution of the precipitation and extreme climate events.
Trends of PEs and DEs were closely related to changes in annual precipitation, rainfall days, lower intensity precipitation and mid-intensity precipitation [36]. Rainfall days decreased without significant changes in annual precipitation may indicate a more concentrated precipitation, lead to both the increases in PEs and DEs [6]. Regionally, an increasing trend of annual precipitation was detected in the humid region and in the arid region [50,51], while a decrease in North China. However, with the decrease in rainfall days [55], lower intensity and mid-intensity precipitation [36] in most of the southeastern area of Hu Huanyong Line—the humid region—the precipitation occurred more concentrated, so PEs and DEs both increased, especially extreme drought events increased significantly and widely in this area, which has the densest population, the most developed economy and the most intensive agricultural activities of China.
The increase of PEs may produce severe floods, bring damage to the environments and human society. In the meantime, the significantly increased DEs may also bring tremendous disaster to agriculture and grain security, and may lead to the over-exploited of groundwater and the declining of the regional groundwater depth, eventually cause a series of ecological and geological environment problems. Actually, the effects of increase in DEs was grave in North China which was one of the top three major groundwater depletion areas of the world [56] and also one of the important grain production in China. In the future, the author therefore would analyze the impact of drought extremes on the agriculture, grain security and variety of groundwater based on some indices combined the daily precipitation and the characteristics of water demanded by main crops in different growth periods in North China Plain.
5. Conclusions
In this study, trend analysis and change-point detection of precipitation and drought extremes were carried out by Moving t-Test at 500 stations over six regions of China, the spatial distribution patterns of their increasing change-point years of PEs and DEs were identified, and the concrete temporal change processes of PEs and DEs were demonstrated by the cumulative deviation method at nine typical stations. The main conclusions were as follows:
1) PEs and DEs increased in more stations than they have decreased generally. The stations with increasing trends of frequency and intensity of the extremes accounted for 71.8% and 61.6% of the total, respectively for DEs, and 59.8% and 52.6% of the total, respectively for PEs.
2) DEs were more significantly and widely increased than that of PEs, the stations with increasing trends of DEs were mainly distributed in the east of Hu Huanyong Line. In this area, the increasing change-point years of drought extremes in the south of the Yangzi River often occurred in the early 1980s; while that in the north of the Yangzi River often occurred in 1990s.
3) Increasing trends of PEs were mainly distributed in the southeastern area of Hu Huanyong Line, Qing-Tibet Platen, and Northwest China. The increasing change-point years of PEs in the southeastern area of Hu Huanyong Line often occurred around 1990, except for several stations in the southeastern coastal region which entered the increasing FPE period from early 1980s; while that in Qing-Tibet Platen often occurred in the early 1980s.
4) Trends of DEs and PEs were closely related to changes in annual precipitation, rainfall days, lower intensity precipitation, and mid-intensity precipitation. With the increase in annual precipitation and the decrease in rainfall days, lower intensity and mid-intensity precipitations, most of the southeastern area of Hu Huanyong Line was under the threats of both PEs and DEs. This may produce severe impacts on flood regime, agriculture and environment. In the future, further thorough analysis would be conducted about the influences of PEs and DEs on flood regime, water resources management, agriculture, grain security, environment and human society in different regions of China.
Author Contributions
Conceptualization, M.L. and P.L.; Data curation, P.L. and Y.W.; Formal analysis, M.L. and P.L.; Funding acquisition, M.L., Y.G., Z.N. and X.G.; Investigation, M.L.; Methodology, M.L. and Y.W.; Supervision, X.G.; Writing—original draft, M.L.; Writing—review & editing, Y.G., Z.N., and Y.Y. All authors have read and agreed to the published version of the manuscript.
Funding
This research was funded by National Key Research and Development Plan of China (No. 2017YFC0406103), the National Natural Science Foundation of China (No. 41902262), the Natural Science Foundation of Hebei Province—China (No. D2019503028), the Geological Survey Project of China (No. DD20190349), and Fundamental Research Fund (No. YYWF201728) of Central Scientific and Research Institutes, Chinese Academy of Geological Sciences.
Acknowledgments
We acknowledge the support of the China Meteorological Administration for the dataset. We also thank the three anonymous reviewers for their comments and suggestions. We are grateful to Yang Yu at University of Technology Sydney and the anonymous reviewers for their great help in English editing.
Conflicts of Interest
The authors declare no conflict of interest.
References
- Field, C.B.; Barros, V.; Stocker, T.F.; Qin, D.; Dokken, D.J.; Ebi, K.L.; Mastrandrea, M.D.; Mach, K.J.; Plattner, G.K. Special report on managing the risks of extreme events and disasters to advance climate change adaptation (SREX). J. Epidemiol. Community Health 2012, 66, 759. [Google Scholar]
- Stocker, T.F.; Qin, D.; Plattner, G.K.; Tignor, M.; Allen, S.K.; Boschung, J.; Nauels, A.; Xia, Y.; Bex, V.; Midgley, P.M. Climate Change 2013: The Physical Science Basis. Contribution of Working Group I to the Fifth Assessment Report of the Intergovernmental Panel on Climate Change; Cambridge University Press: Cambridge, UK; New York, NY, USA, 2013. [Google Scholar]
- Seneviratne, S.I.; Nicholls, N.; Easterling, D.; Goodess, C.M.; Kanae, S.; Kossin, J.; Luo, Y.; Marengo, J.; Mcinnes, K.; Rahimi, M. Changes in Climate Extremes and Their Impacts on the Natural Physical Environment: An Overview of the IPCC SREX Report; Cambridge University Press: Cambridge, UK; New York, NY, USA, 2012. [Google Scholar]
- Nicholls, N. Long-term climate monitoring and extreme events. Clim. Chang. 1995, 31, 231–245. [Google Scholar] [CrossRef]
- Frei, C.; Schär, C. Detection probability of trends in rare events: Theory and application to heavy precipitation in the Alpine region. J. Clim. 1999, 14, 1568–1584. [Google Scholar] [CrossRef]
- Zhai, P.; Sun, A.; Ren, F.; Liu, X.; Bo, G.; Qiang, Z. Changes of Climate Extremes in China. Clim. Chang. 1999, 42, 203–218. [Google Scholar] [CrossRef]
- Frich, P.; Alexander, L.V.; Della-Marta, P.; Gleason, B.; Haylock, M.; Klein Tank, A.; Peterson, T. Observed coherent changes in climatic extremes during the second half of the twentieth century. Clim. Res. 2002, 19, 193–212. [Google Scholar] [CrossRef] [Green Version]
- Alexander, L.V.; Zhang, X.B.; Peterson, T.C.; Caesar, J.; Gleason, B.A.; Tank, A.; Haylock, M.; Collins, D.; Trewin, B.; Rahimzadeh, F. Global observed changes in daily climate extremes of temperature and precipitation. J. Geophys. Res. Atmos. 2006, 111, 1042–1063. [Google Scholar] [CrossRef] [Green Version]
- Nastos, P.T.; Zerefos, C.S. Spatial and temporal variability of consecutive dry and wet days in Greece. Atmos. Res. 2009, 94, 616–628. [Google Scholar] [CrossRef]
- Re, M.; Barros, V.R. Extreme rainfalls in SE South America. Clim. Chang. 2009, 96, 119–136. [Google Scholar] [CrossRef]
- Mittal, N.; Mishra, A.; Singh, R. Combining climatological and participatory approaches for assessing changes in extreme climatic indices at regional scale. Clim. Chang. 2013, 119, 603–615. [Google Scholar] [CrossRef]
- Hawcroft, M.; Walsh, E.; Hodges, K.; Zappa, G. Significantly increased extreme precipitation expected in Europe and North America from extratropical cyclones. Environ. Res. Lett. 2018, 13, 124006. [Google Scholar] [CrossRef]
- Tabari, H.; Willems, P. More prolonged droughts by the end of the century in the Middle East. Environ. Res. Lett. 2018, 13, 104005. [Google Scholar] [CrossRef] [Green Version]
- Wang, Y.; Xu, Y.; Tabari, H.; Wang, J.; Wang, Q.; Song, S.; Hu, Z. Innovative trend analysis of annual and seasonal rainfall in the Yangtze River Delta, eastern China. Atmos. Res. 2020, 231, 104673. [Google Scholar] [CrossRef]
- Mason, S.J.; Waylen, P.R.; Mimmack, G.M.; Rajaratnam, B.; Harrison, J.M. Changes in Extreme Rainfall Events in South Africa. Clim. Chang. 1999, 41, 249–257. [Google Scholar] [CrossRef]
- Klein Tank, A.M.G.; Können, G.P. Trends in Indices of Daily Temperature and Precipitation Extremes in Europe, 1946–99. J. Clim. 2002, 16, 3665–3680. [Google Scholar] [CrossRef]
- Zhai, P.; Zhang, X.; Wan, H.; Pan, X. Trends in total precipitation and frequency of daily precipitation extremes over china. J. Clim. 2005, 18, 1096–1108. [Google Scholar] [CrossRef]
- Figdor, E. When It Rains, It Pours: Global Warming and the Rising Frequency of Extreme Precipitation in the United States; Environment America Research and Policy Center: Boston, MA, USA, 2007. [Google Scholar]
- Yao, C.; Qian, W.; Yang, S.; Lin, Z. Regional features of precipitation over Asia and summer extreme precipitation over Southeast Asia and their associations with atmospheric—Oceanic conditions. Meteorol. Atmos. Phys. 2010, 106, 57–73. [Google Scholar] [CrossRef]
- Boccolari, M.; Malmusi, S. Changes in temperature and precipitation extremes observed in Modena, Italy. Atmos. Res. 2013, 122, 16–31. [Google Scholar] [CrossRef]
- Long, D.; Scanlon, B.R.; Fernando, D.N.; Meng, L.; Quiring, S.M. Are Temperature and Precipitation Extremes Increasing over the U.S. High Plains? Earth Interact. 2015, 16, 1–20. [Google Scholar] [CrossRef]
- Croitoru, A.E.; Piticar, A.; Burada, D.C. Changes in precipitation extremes in Romania. Georev. Sci. Ann. Stefan Cel Mare Univ. Suceava Geogr. 2016, 415, 325–335. [Google Scholar] [CrossRef]
- Alexander, L.V. Global observed long-term changes in temperature and precipitation extremes: A review of progress and limitations in IPCC assessments and beyond. Weather Clim. Extrem. 2016, 11, 4–16. [Google Scholar] [CrossRef] [Green Version]
- Gong, D.Y.; Shi, P.J.; Wang, J.A. Daily precipitation changes in the semi-arid region over northern China. J. Arid Environ. 2004, 59, 771–784. [Google Scholar] [CrossRef]
- Heberger, M. Australia’s Millennium Drought: Impacts and Responses; Island Press: Washington, DC, USA, 2012. [Google Scholar]
- Dijk, A.I.J.M.; Beck, H.E.; Crosbie, R.S.; Jeu, R.A.M.D.; Liu, Y.Y.; Podger, G.M.; Timbal, B.; Viney, N.R. The Millennium Drought in southeast Australia (2001–2009): Natural and human causes and implications for water resources, ecosystems, economy, and society. Water Resour. Res. 2013, 49, 1040–1057. [Google Scholar] [CrossRef]
- Wu, J.; Chen, X. Spatiotemporal trends of dryness/wetness duration and severity: The respective contribution of precipitation and temperature. Atmos. Res. 2019, 216, 176–185. [Google Scholar] [CrossRef]
- Mitchell, D.; Achutarao, K.; Allen, M.; Bethke, I.; Zaaboul, R. Half a degree additional warming, prognosis and projected impacts (HAPPI): Background and experimental design. Geosci. Model Dev. 2017, 10, 571–583. [Google Scholar] [CrossRef] [Green Version]
- Allen, M.R.; Dube, O.P.; Solecki, W.; Aragón-Durand, F.; Cramer, W.; Humphreys, S.; Kainuma, M.; Kala, J.; Mahowald, N.; Mulugetta, Y.; et al. Framing and Context. In Global Warming of 1.5 °C. An IPCC Special Report on the Impacts of Global Warming of 1.5 °C above Pre-industrial Levels and Related Global Greenhouse Gas Emission Pathways, in the Context of Strengthening the Global Response to the Threat of Climate Change; Masson-Delmotte, V., Zhai, P., Pörtner, H.-O., Roberts, D., Skea, J., Shukla, P.R., Pirani, A., Moufouma-Okia, W., Péan, C., Pidcock, R., et al., Eds.; World Meterological Organization: Geneva, Switzerland, 2018; p. 46. [Google Scholar]
- Su, B.; Gemmer, M.; Jiang, T. Spatial and temporal variation of extreme precipitation over the Yangtze River Basin. Quat. Int. 2008, 186, 22–31. [Google Scholar] [CrossRef]
- Ning, L.; Qian, Y. Interdecadal Change in Extreme Precipitation over South China and its Mechanism. Adv. Atmos. Sci. 2009, 26, 109–118. [Google Scholar] [CrossRef]
- Wang, Z.; Qian, Y. Frequency and intensity of extreme precipitation events in China. Adv. Water Sci. 2009, 20, 1–9. [Google Scholar]
- Li, Z.; Zheng, F.; Liu, W. Spatial distribution and temporal trends of extreme temperature and precipitation events on the Loess Plateau of China during 1961–2007. Quat. Int. 2010, 226, 92–100. [Google Scholar] [CrossRef]
- Wang, X.; Hou, X.; Wang, Y. Spatiotemporal variations and regional differences of extreme precipitation events in the Coastal area of China from 1961 to 2014. Atmos. Res. 2017, 197, 94–104. [Google Scholar] [CrossRef]
- Tong, S.; Li, X.; Zhang, J.; Bao, Y.; Bao, Y.; Na, L.; Si, A. Spatial and temporal variability in extreme temperature and precipitation events in Inner Mongolia (China) during 1960–2017. Sci. Total Environ. 2019, 649, 75–89. [Google Scholar] [CrossRef]
- Liu, M.; Shen, Y.; Qi, Y.; Wang, Y.; Geng, X. Changes in Precipitation and Drought Extremes over the Past Half Century in China. Atmosphere 2019, 10, 203. [Google Scholar] [CrossRef] [Green Version]
- Viglizzo, E.F.; Roberto, Z.E.; Filippin, M.C.; Pordomingo, A.J. Climate variability and agroecological change in the Central Pampas of Argentina. Agric. Ecosyst. Environ. 1995, 55, 7–16. [Google Scholar] [CrossRef]
- Plummer, N.; Salinger, M.J.; Nicholls, N.; Suppiah, R.; Hennessy, K.J.; Leighton, R.M.; Trewin, B.; Page, C.M.; Lough, J.M. Changes in Climate Extremes Over the Australian Region and New Zealand During the Twentieth Century. Clim. Chang. 1999, 42, 183–202. [Google Scholar] [CrossRef]
- Ning, Z.; Yoon, J.H.; Marengo, J.A.; Subramaniam, A.; Nobre, C.A.; Mariotti, A.; Neelin, J.D. Causes and impacts of the 2005 Amazon drought. Environ. Res. Lett. 2008, 3, 14002. [Google Scholar]
- Lewis, S.L.; Brando, P.M.; Phillips, O.L.; Heijden, G.M.F.V.; Nepstad, D. The 2010 Amazon Drought. Science 2011, 331, 554. [Google Scholar] [CrossRef]
- Cardoso Pereira, S.; Marta Almeida, M.; Carvalho, A.C.; Rocha, A. Extreme precipitation events under climate change in the Iberian Peninsula. Int. J. Climatol. 2019. [Google Scholar] [CrossRef]
- Hoegh-Guldberg, O.; Jacob, D.; Taylor, M.; Bindi, M.; Brown, S.; Camilloni, I.; Diedhiou, A.; Djalante, R.; Ebi, K.L.; Engelbrecht, F.; et al. Impacts of 1.5 °C Global Warming on Natural and Human Systems. In Global Warming of 1.5 °C. An IPCC Special Report on the Impacts of Global Warming of 1.5 °C above Pre-industrial Levels and Related Global Greenhouse Gas Emission Pathways, in the Context of Strengthening the Global Response to the Threat of Climate Change; Masson-Delmotte, V., Zhai, P., Pörtner, H.-O., Roberts, D., Skea, J., Shukla, P.R., Pirani, A., Moufouma-Okia, W., Péan, C., Pidcock, R., et al., Eds.; World Meterological Organization: Geneva, Switzerland, 2018; p. 138. [Google Scholar]
- Liu, X. Climatic Characteristic of Extreme Rainstorm Events in China. J. Catastrophol. 1999, 42, 203–218. [Google Scholar]
- Gong, D.Y.; Wang, J.A.; Han, H. Trends of summer dry spells in China during the late twentieth century. Meteorol. Atmos. Phys. 2005, 88, 203–214. [Google Scholar] [CrossRef]
- Yang, J.H.; Jiang, Z.H.; Wang, P.X. Temporal and Spatial Characteristic of Extreme Precipitation Event in China. Clim. Environ. Res. 2008, 13, 75–83. [Google Scholar]
- Li, Z.; He, Y.; Wang, C.; Wang, X.; Xin, H.; Wei, Z.; Cao, W. Spatial and temporal trends of temperature and precipitation during 1960–2008 at the Hengduan Mountains, China. Quat. Int. 2011, 236, 127–142. [Google Scholar] [CrossRef]
- Fu, G.; Yu, J.; Yu, X.; Ouyang, R.; Zhang, Y.; Wang, P.; Liu, W.; Min, L. Temporal variation of extreme rainfall events in China, 1961–2009. J. Hydrol. 2013, 487, 48–59. [Google Scholar] [CrossRef]
- Wang, B.; Zhang, M.; Wei, J.; Wang, S.; Li, X.; Li, S.; Zhao, A.; Li, X.; Fan, J. Changes in extreme precipitation over Northeast China, 1960–2011. Quat. Int. 2013, 298, 177–186. [Google Scholar] [CrossRef]
- Liang, F.; Liu, D.; Wang, W.; Zhang, F.; Yu, F. Temporal and spatial variability of summer extreme precipitation events in Northeast China during 1961–2013. Arid Land Geogr. 2016, 39, 565–572. [Google Scholar]
- Liu, M.; Shen, Y.; Yan, Z.; Liu, C. Trend in pan evaporation and its attribution over the past 50 years in China. J. Geogr. Sci. 2010, 20, 557–568. [Google Scholar] [CrossRef]
- Shen, Y.J.; Liu, C.M.; Liu, M.; Zeng, Y.; Tian, C.Y.; Liu, C.M.; Chen, Y.N.; Xu, Z.X. Change in pan evaporation over the past 50 years in the arid region of China. Hydrol. Process 2010, 24, 225–231. [Google Scholar] [CrossRef]
- Brown, L. The Conditional Level of Student’s t Test. Ann. Math. Stat. 1967, 38, 1068–1071. [Google Scholar] [CrossRef]
- Xu, L.; Guo, Y.; Liu, M.; Hu, Q.; Chen, F.; Yang, S.; Shen, Y. Analysis of Temperature Trends and Change Points in the Haihe River Basin Over the Last 50 Years. Resour. Sci. 2011, 33, 995–1001. [Google Scholar]
- Lin, Y.; Lye, L.M. Modelling long-term dependence based on cumulative departures of annual flow series. J. Hydrol. 1994, 160, 105–121. [Google Scholar] [CrossRef]
- Feng, X.; Luo, L.; Feng, Z.; Liu, P.; Qiu, L. Fractal research on rainy day change trend in China. J. Nat. Disasters 2009, 18, 112–117. [Google Scholar]
- Siebert, S.; Burke, J.; Faures, J.M.; Frenken, K.; Hoogeveen, J.; Döll, P.; Portmann, F.T. Groundwater use for irrigation—A global inventory. Hydrol. Earth Syst. Sci. 2010, 14, 1863–1880. [Google Scholar] [CrossRef] [Green Version]
Figure 1.
Meteorological station distribution (a) and annual precipitation spatial distribution from 1971 to 2000 (b). 1–6 represent Northeast China, North China, Southeast China, Southwest China, Qing-Tibet Platen, and Northwest China, respectively, in Figure 1b. The six regions, with their corresponding typical meteorological stations, were for change-point analysis of PEs and DEs.
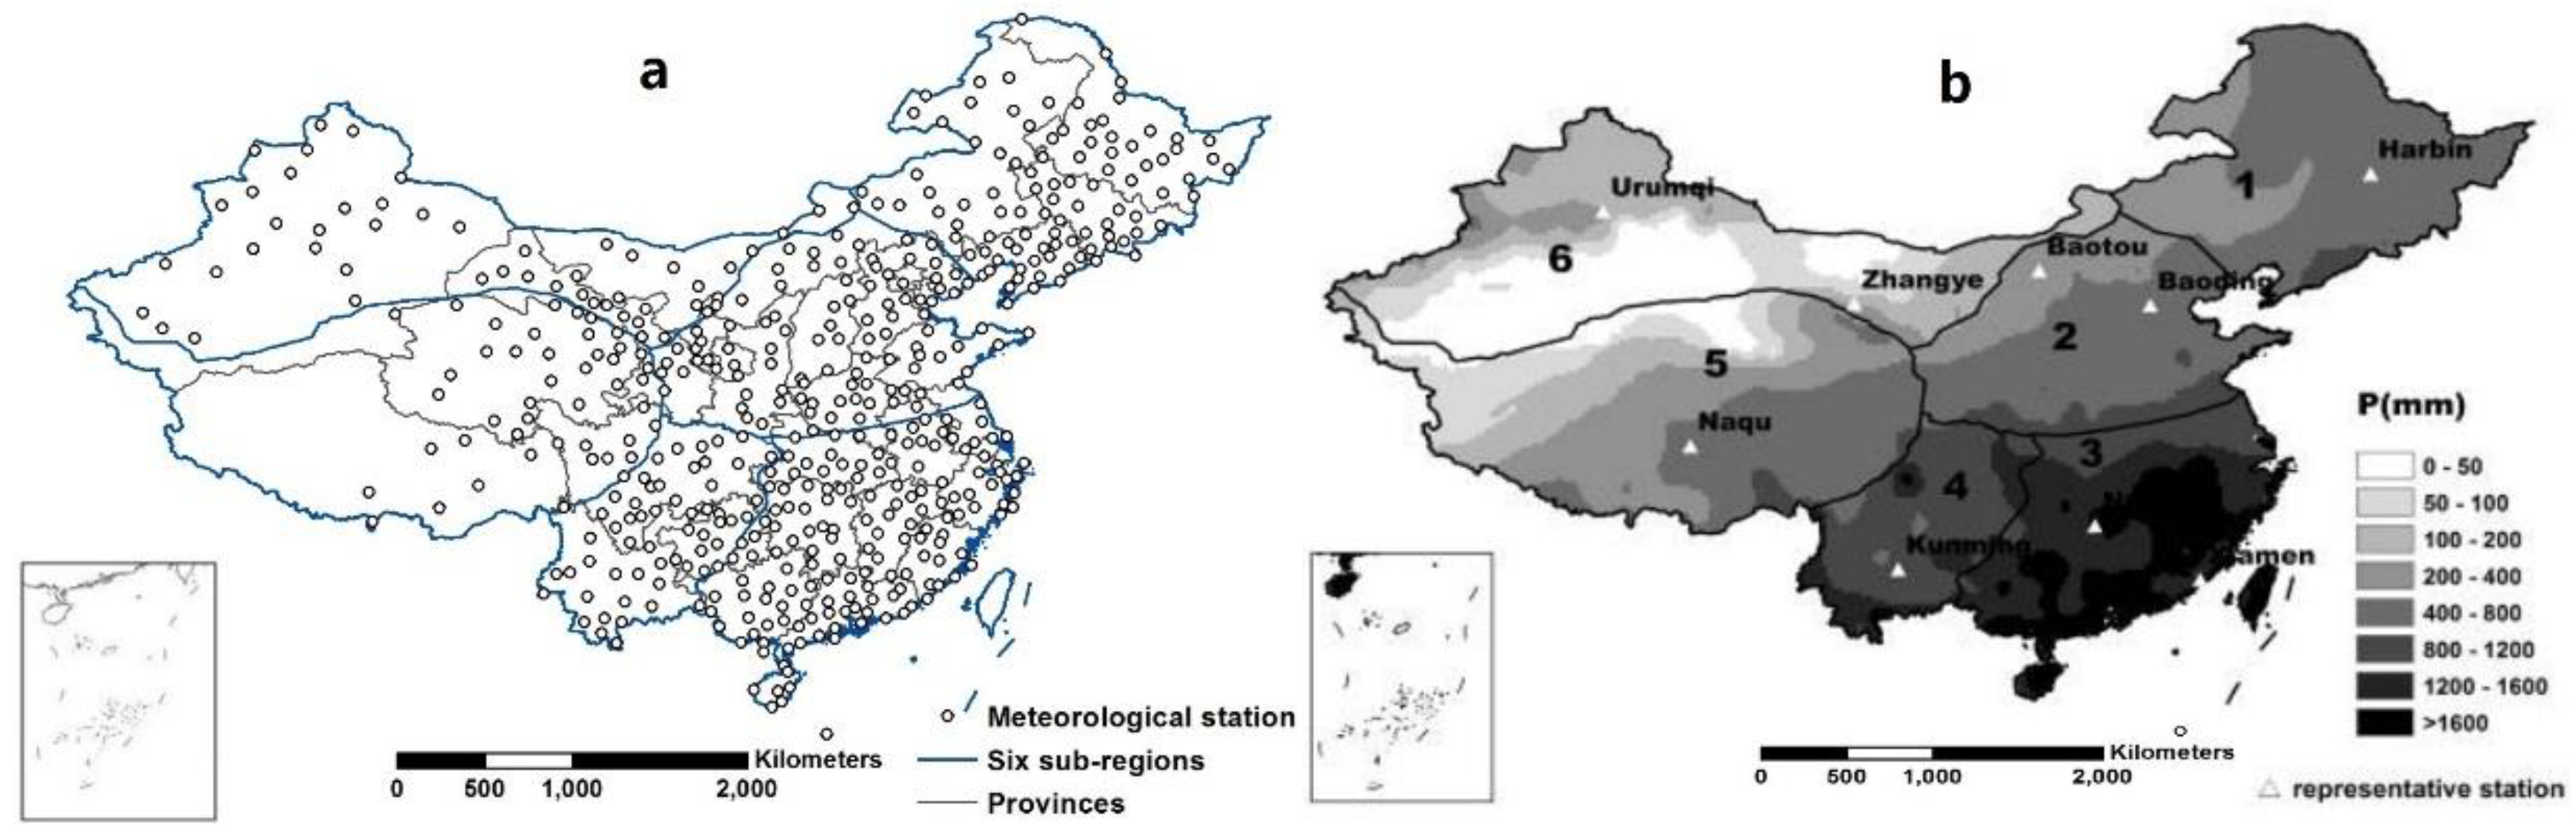
Figure 2.
Spatial distribution of increasing change-point years of extreme precipitation frequency (a) and intensity (b).
Figure 2.
Spatial distribution of increasing change-point years of extreme precipitation frequency (a) and intensity (b).
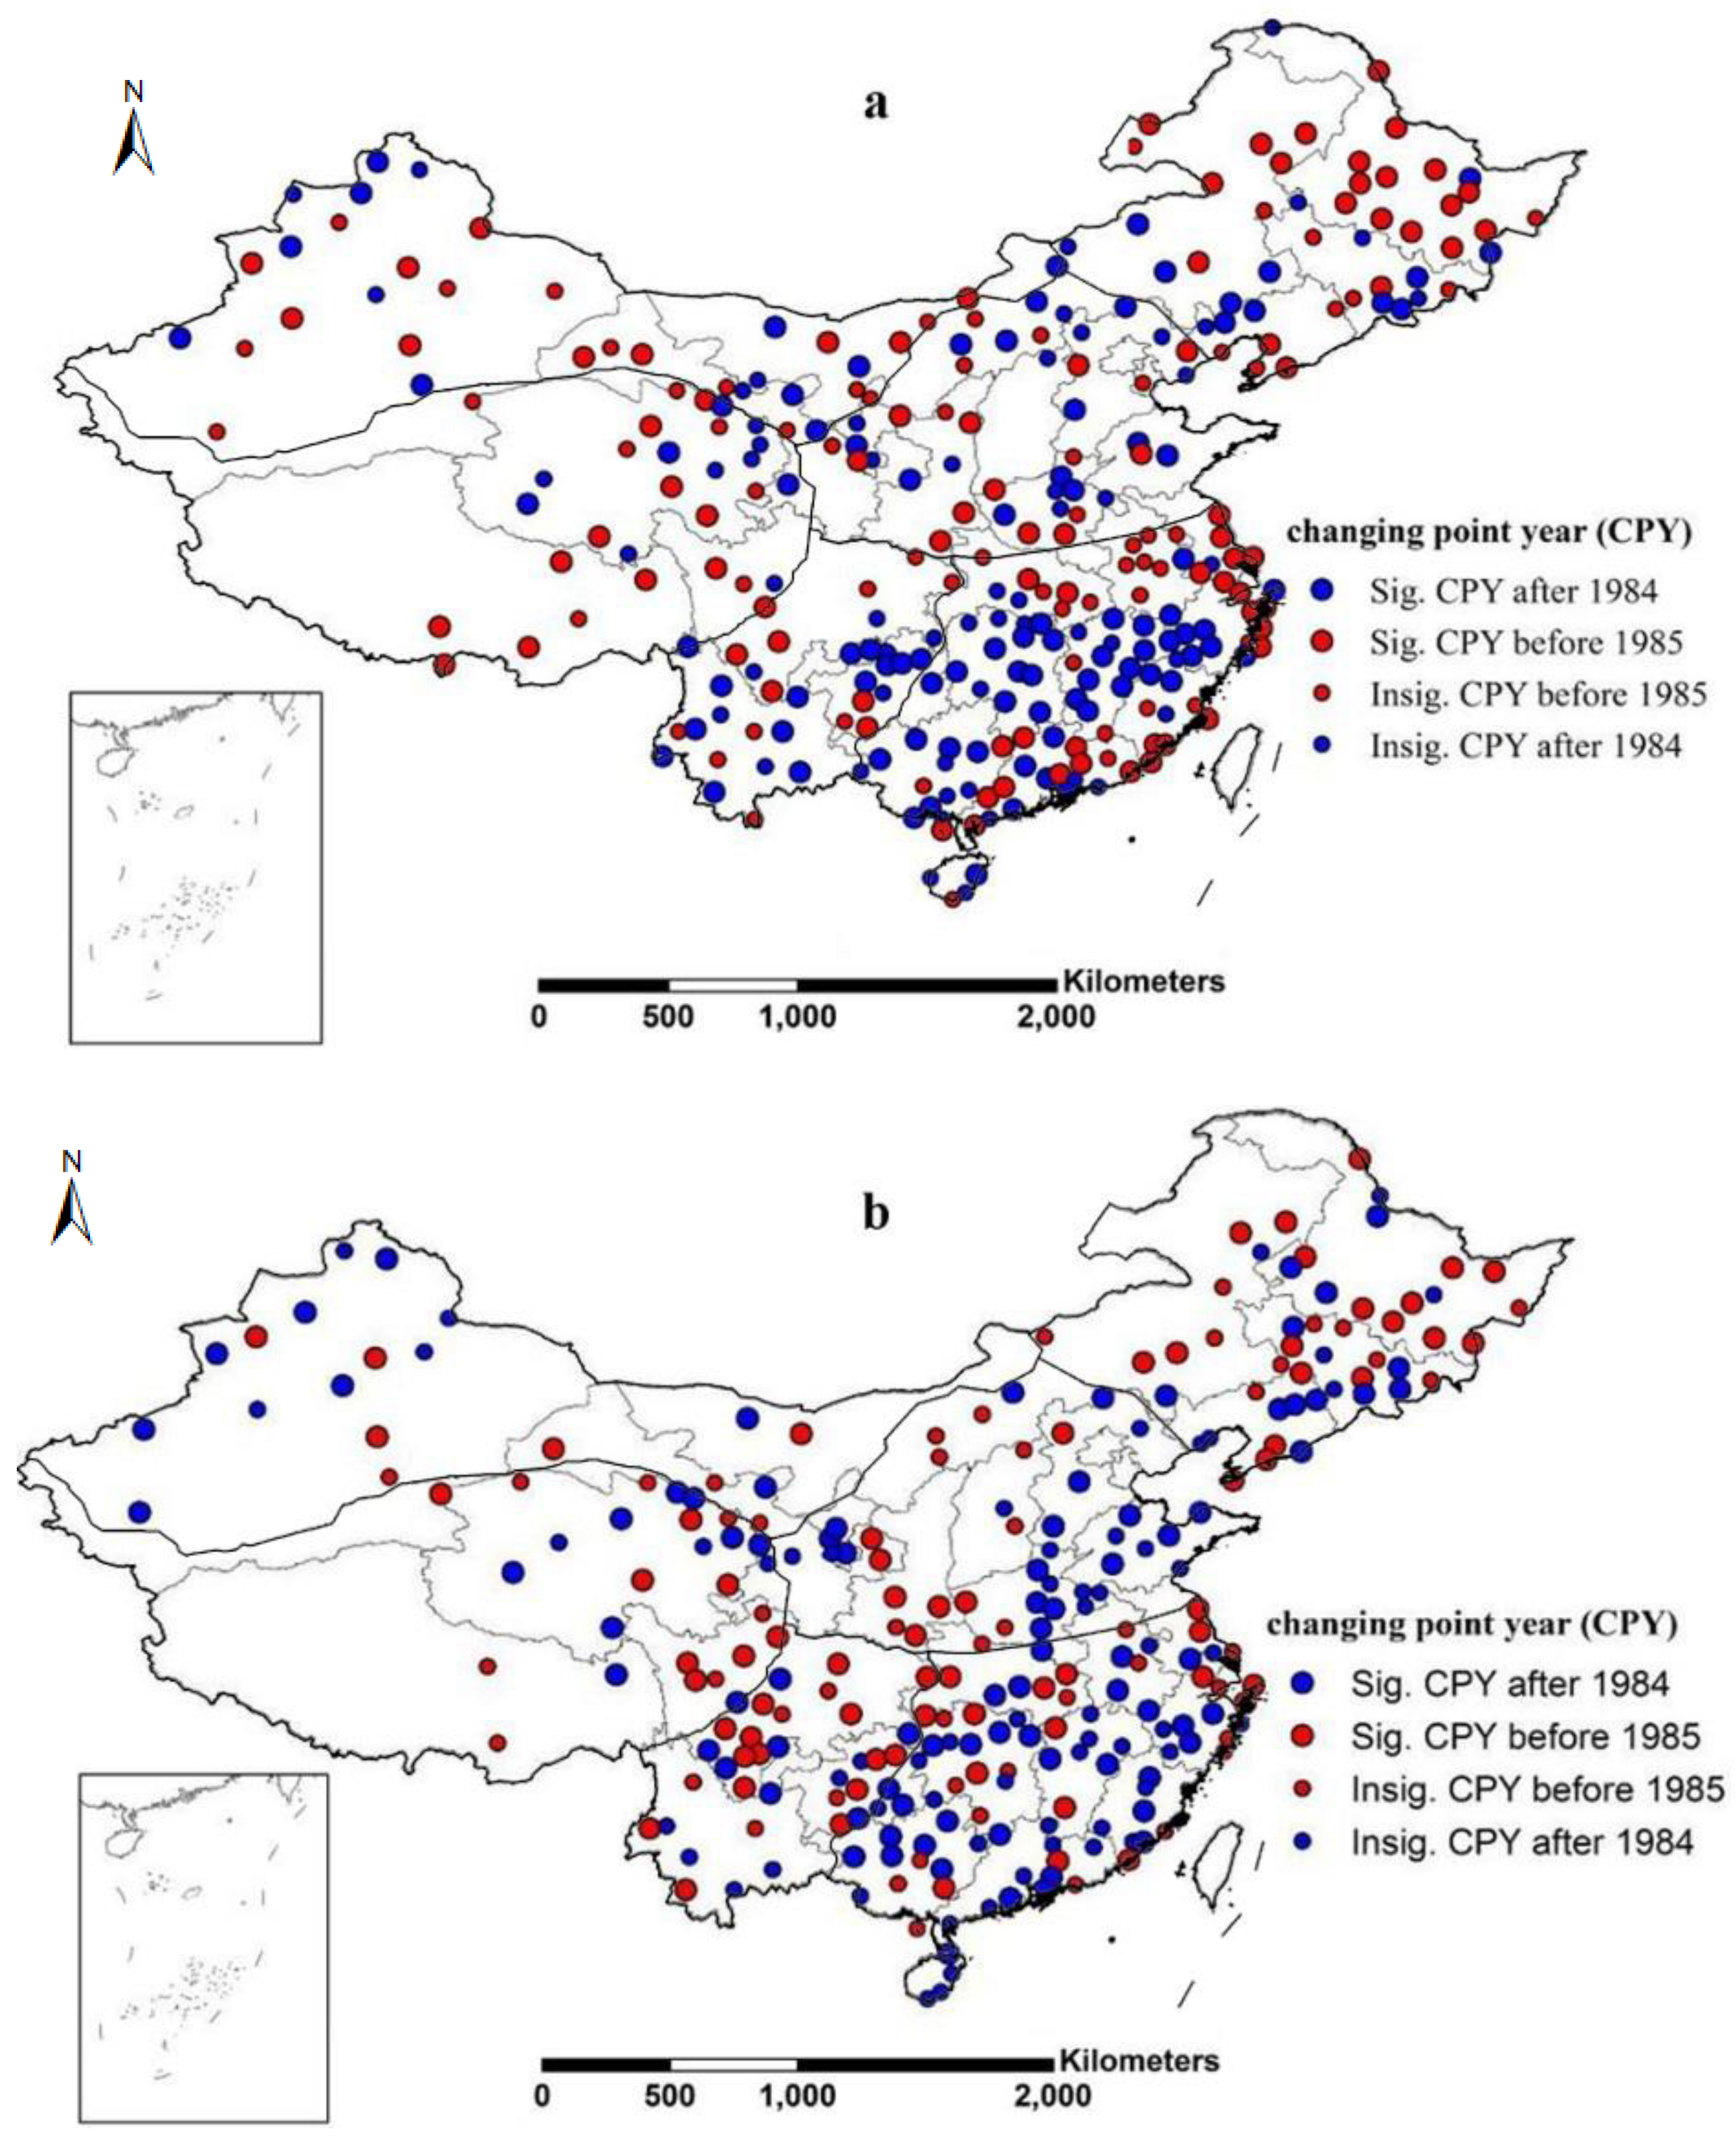
Figure 3.
Spatial distribution of increasing change-point years of extreme drought frequency (a) and intensity (b).
Figure 3.
Spatial distribution of increasing change-point years of extreme drought frequency (a) and intensity (b).
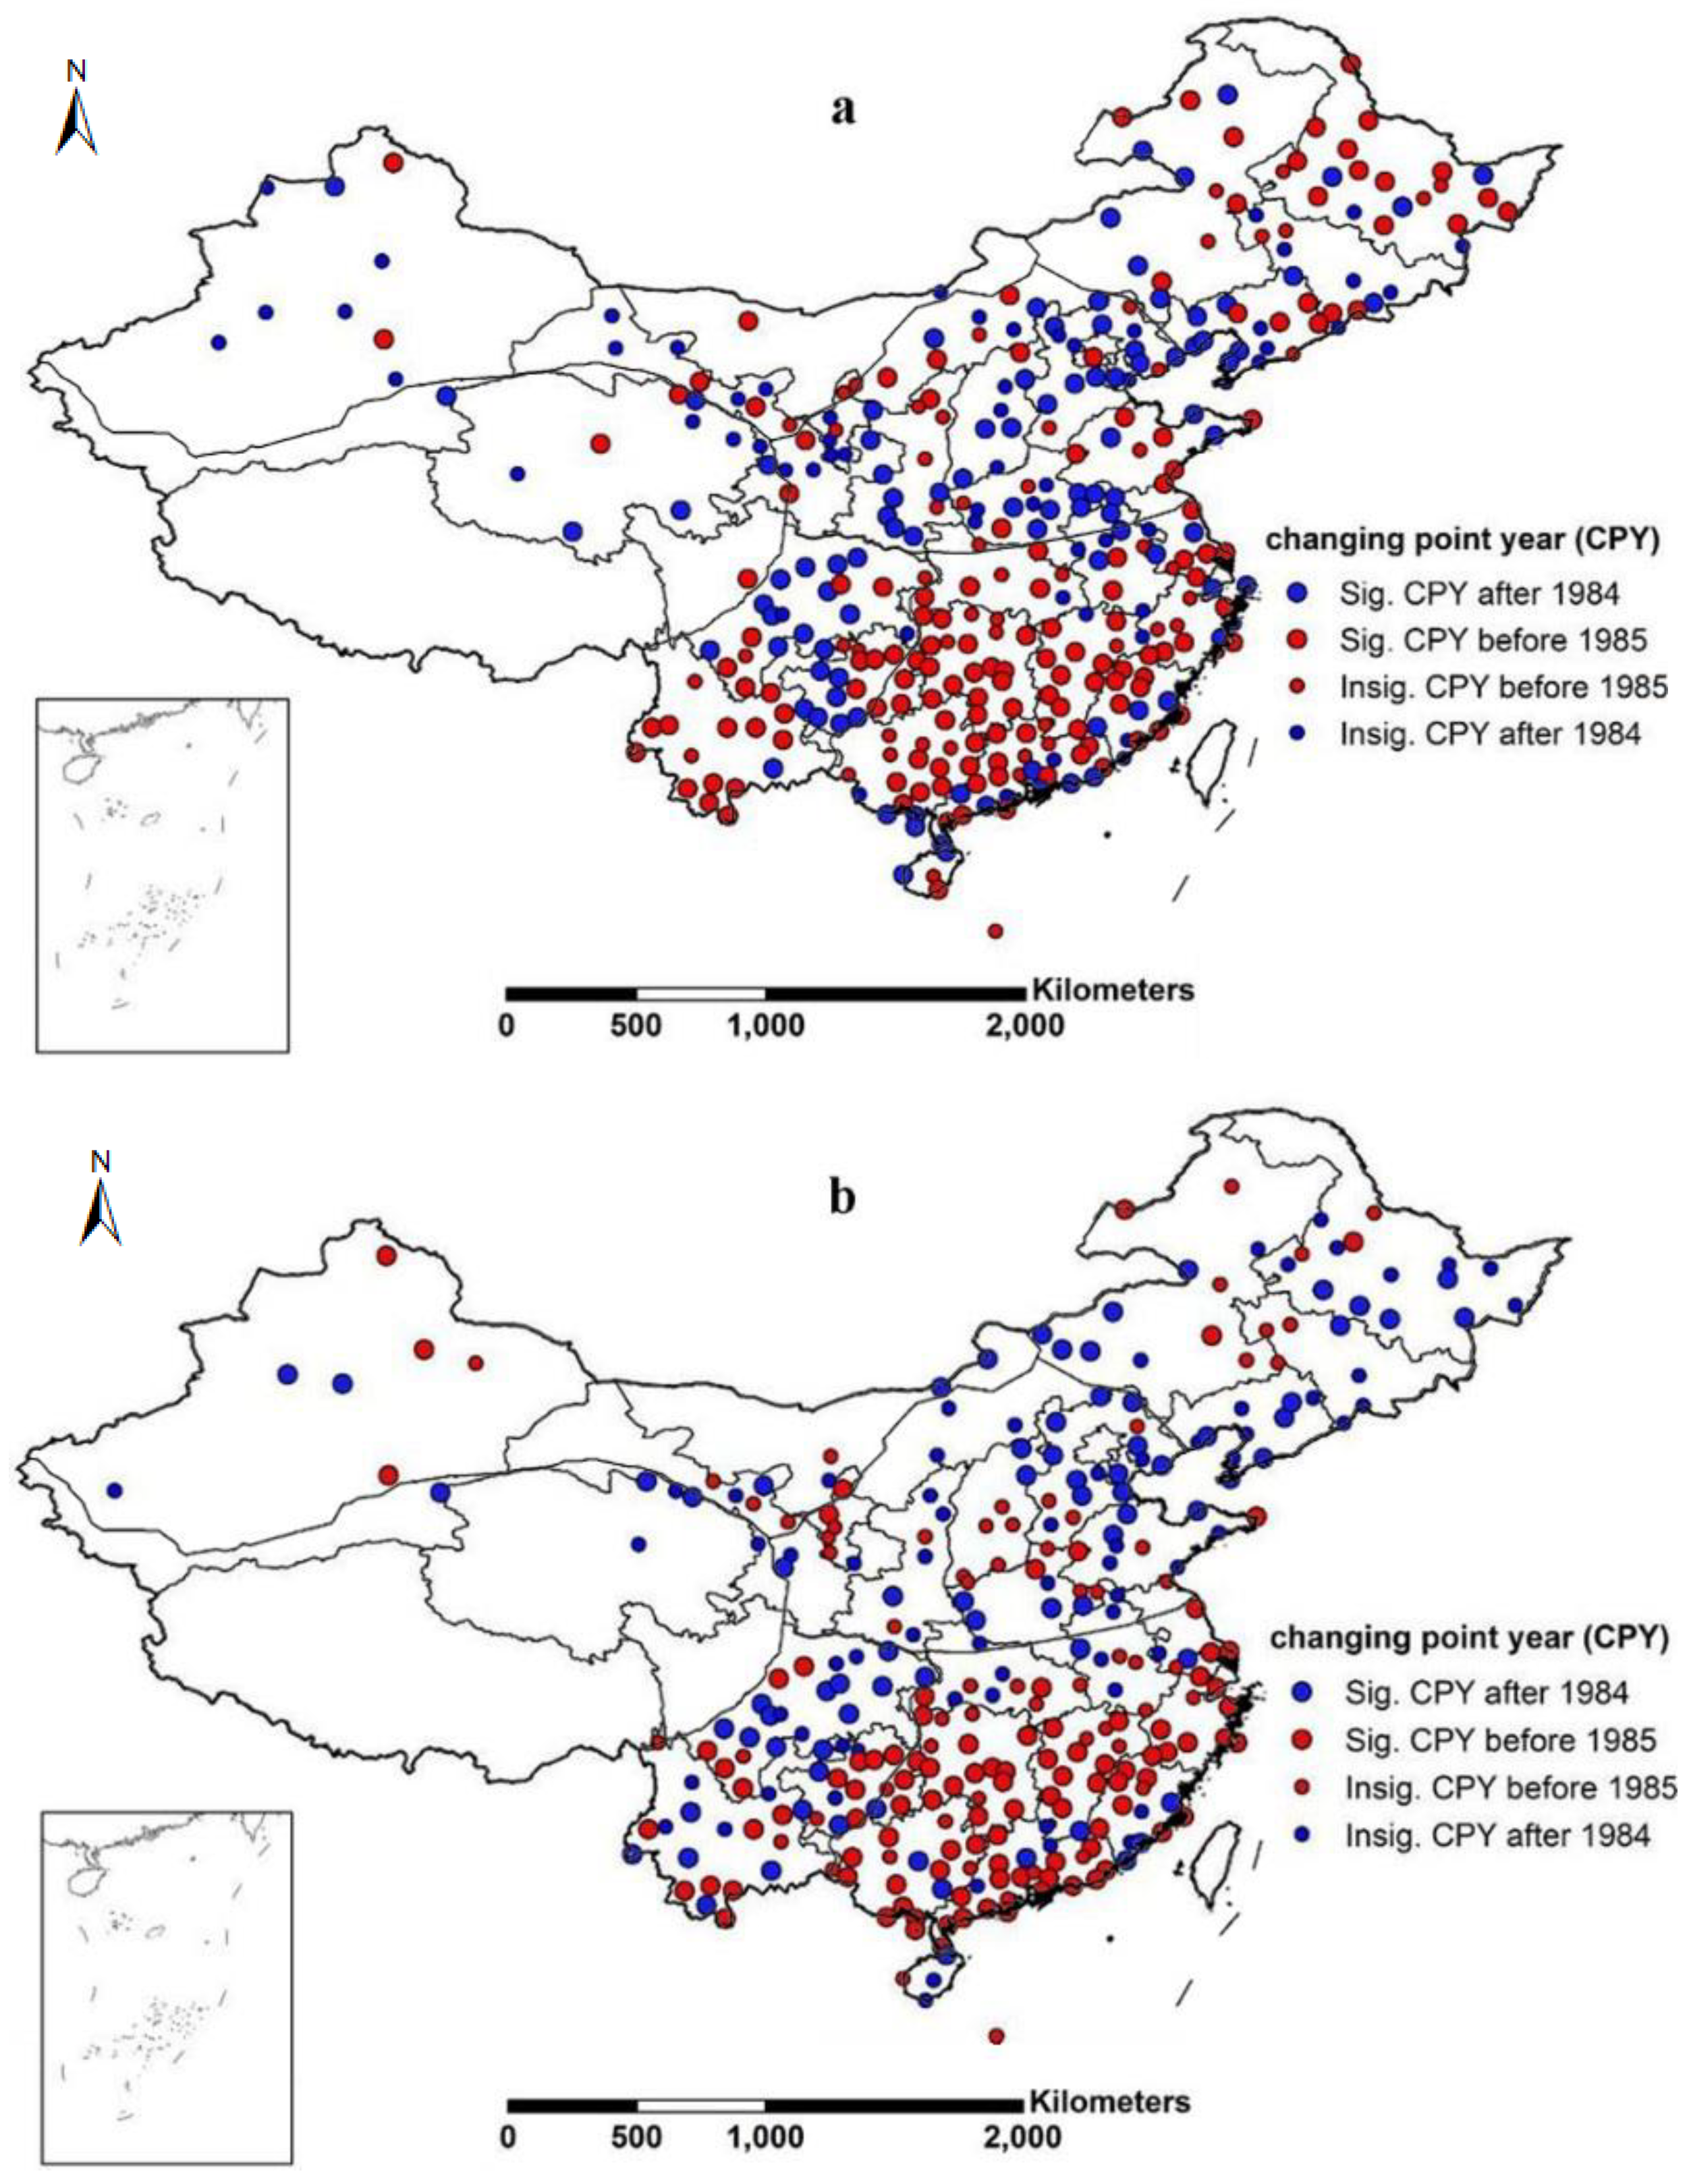
Figure 4.
Cumulative deviations of frequency and intensity of precipitation and drought extremes at typical stations. FPE—frequency of precipitation extreme; MDP—maximum daily precipitation (intensity index of precipitation extreme); FDE—frequency of drought extreme; MCDD—maximum consecutive dry days (intensity index of drought extreme).


Table 1.
Change-point analysis (CPY) of precipitation extremes based on station statistics.
| Regions | No. of Stations | Frequency of Precipitation Extreme | Intensity of Precipitation Extreme | ||
|---|---|---|---|---|---|
| Increase CPY (%) | Sig. Increase CPY (%) | Increase CPY (%) | Sig. Increase CPY (%) | ||
| NE | 98 | 49.0 | 68.8 | 49.0 | 64.6 |
| NC | 97 | 43.3 | 54.8 | 43.3 | 52.4 |
| SE | 154 | 70.8 | 63.3 | 60.4 | 51.6 |
| SW | 56 | 60.7 | 58.8 | 58.9 | 66.7 |
| QT | 43 | 69.8 | 53.3 | 60.5 | 61.5 |
| NW | 52 | 69.2 | 55.6 | 38.5 | 65.0 |
| China | 500 | 59.8 | 60.5 | 52.6 | 58.0 |
NE—Northeast China; NC—North China; SE—Southeast China; SW—Southwest China; QT—Qing–Tibet Plateau; NW—Northwest China; CPY—change-point year, Sig.—significant, No.—number.
Table 2.
Change-point analysis of drought extremes based on station statistics.
| Regions | No. of Stations | Frequency of Drought Extreme | Intensity of Drought Extreme | ||
|---|---|---|---|---|---|
| Increase CPY (%) | Sig. Increase CPY (%) | Increase CPY (%) | Sig. Increase CPY (%) | ||
| NE | 98 | 62.2 | 68.9 | 44.9 | 43.2 |
| NC | 97 | 84.5 | 61.0 | 66.0 | 39.1 |
| SE | 154 | 87.0 | 72.4 | 81.2 | 68.0 |
| SW | 56 | 89.3 | 82.0 | 94.6 | 73.6 |
| QT | 43 | 25.6 | 72.7 | 11.6 | 60.0 |
| NW | 52 | 40.4 | 28.6 | 32.7 | 52.9 |
| China | 500 | 71.8 | 68.0 | 61.6 | 58.4 |
NE—Northeast China; NC—North China; SE—Southeast China; SW—Southwest China; QT—Qing–Tibet Plateau; NW—Northwest China; CPY—change-point year; Sig.—significant.
Table 3.
t-values and their corresponding change-point years of the representative stations.
| Representative Stations | FPE | IPE | FDE | IDE | ||||
|---|---|---|---|---|---|---|---|---|
| T | CPY | T | CPY | T | CPY | T | CPY | |
| Harbin | −2.12 | 1976 | −2.11 | 1979 | −1.26 | 1996 | −1.73 | 1995 |
| Urumqi | −3.29 | 1975 | −2.15 | 1977 | −1.00 | 1994 | 1.57 | 1991 |
| Zhangye | −1.67 | 1970 | −1.41 | 1982 | −3.18 | 1978 | −1.12 | 1972 |
| Baotou | −1.86 | 1991 | −1.25 | 1976 | −2.13 | 1992 | 1.21 | 1975 |
| Baoding | 3.32 | 1997 | −2.09 | 1987 | −2.28 | 1996 | −2.19 | 1987 |
| Naqu | 2.09 | 1991 | −1.53 | 1982 | 2.40 | 1993 | 1.46 | 1995 |
| Kunming | −2.80 | 1996 | −1.18 | 1974 | −3.25 | 1980 | −2.21 | 1979 |
| Nanyue | −2.48 | 1993 | −1.00 | 1972 | −2.72 | 1982 | −2.42 | 1974 |
| Xiamen | −2.47 | 1983 | −2.00 | 1989 | −2.40 | 1977 | −2.40 | 1990 |
CPY—change-point year; FPE—frequency of precipitation extreme; IPE—intensity of precipitation extreme; FDE—frequency of drought extreme; IDE—intensity of drought extreme, T—t values.
© 2019 by the authors. Licensee MDPI, Basel, Switzerland. This article is an open access article distributed under the terms and conditions of the Creative Commons Attribution (CC BY) license (http://creativecommons.org/licenses/by/4.0/).
Share and Cite
MDPI and ACS Style
Liu, M.; Liu, P.; Guo, Y.; Wang, Y.; Geng, X.; Nie, Z.; Yu, Y. Change-Point Analysis of Precipitation and Drought Extremes in China over the Past 50 Years. Atmosphere 2020, 11, 11. https://doi.org/10.3390/atmos11010011
AMA Style
Liu M, Liu P, Guo Y, Wang Y, Geng X, Nie Z, Yu Y. Change-Point Analysis of Precipitation and Drought Extremes in China over the Past 50 Years. Atmosphere. 2020; 11(1):11. https://doi.org/10.3390/atmos11010011
Chicago/Turabian StyleLiu, Min, Pengfei Liu, Ying Guo, Yanfang Wang, Xinxin Geng, Zhenlong Nie, and Yang Yu. 2020. "Change-Point Analysis of Precipitation and Drought Extremes in China over the Past 50 Years" Atmosphere 11, no. 1: 11. https://doi.org/10.3390/atmos11010011
Note that from the first issue of 2016, this journal uses article numbers instead of page numbers. See further details here.