Article

On the ‘Divergence Problem’ in the Alatau Mountains, Central Asia: A Study of the Responses of Schrenk Spruce Tree-Ring Width to Climate under the Recent Warming and Wetting Trend

1
Institute of Desert Meteorology, China Meteorological Administration, Urumqi 830002, China
2
Key Laboratory of Tree-Ring Physical and Chemical Research of China Meteorological Administration, Urumqi 830002, China
3
Key Laboratory of Tree-ring Ecology of Uigur Autonomous Region, Urumqi 830002, China
4
Almaty Branch of Kazakh Scientific Research Institute of Forestry, Ministries of Agriculture, Almaty 050010, Kazakhstan
5
Kazakh National Agrarian University (KazNAU), Ministry of Education and Science, Almaty 050010, Kazakhstan
*
Authors to whom correspondence should be addressed.
Atmosphere 2019, 10(8), 473; https://doi.org/10.3390/atmos10080473
Submission received: 29 July 2019 / Revised: 14 August 2019 / Accepted: 15 August 2019 / Published: 17 August 2019

Abstract

:
The divergence problem, which manifests as an unstable response relationship between tree-ring growth and climatic factors under the background of global warming, poses a challenge to both the traditional theory of dendroclimatology and the reliability of climatic reconstructions based on tree-ring data. Although Schrenk spruce, as the dominant tree species in the Tianshan Mountains, is frequently applied in the dendrochronological studies, the understanding of the divergence problem of this tree species is still limited. This study conducted correlation analysis between climatic factors and tree-ring width chronologies from 51 living and healthy specimens of Schrenk spruce at sites of high and low elevation in the Alatau Mountains to determine the stability of the response. The results revealed that the tree-ring width of the spruce specimens was correlated positively with precipitation and correlated negatively with temperature. Although the variations of the two tree-ring chronologies were similar, the radial growth of the spruce at the low elevation was found more sensitive to climatic factors. Furthermore, the sensitivity of tree growth to climate demonstrated an obvious increase after an abrupt change of climate under the background of the recent warming and wetting trend. Increased drought stress, calculated based on climatic data, was regarded as the main reason for this phenomenon. The results supply the gap of the stability of climatic response of tree growth in Central Asia to some extent.

1. Introduction

The effect of climate conditions to forest ecosystem is a hot research spot under the background of globe warming [1,2,3]. The radial growth of trees is actualized primarily by differentiation of cambium parenchyma cells between the bark and the secondary xylem. These cells, which respond sensitively to climatic elements in the process of differentiation, form secondary xylem to the inside and secondary phloem and phellogen to the outside. Traditional dendroclimatology suggests there is a stable linear relationship between the radial growth of trees and the main climatic limiting factor. However, previous studies in high latitude and high elevation regions of the Northern Hemisphere have revealed that the sensitivity of tree growth to the main climatic limiting factor has changed under the effects of global warming [4,5,6]. Briffa et al. [7] noticed that the temperature-sensitive of tree-ring-density in different regions of the northern boreal forest has an obvious reduction after 1960. Moreover, this variability in climatic response has been found to extend to coniferous forests in middle–low elevation regions [8]. Various reasons have been proposed to account for this phenomenon, e.g., physiological differences among tree species [9], spatial separation between tree sampling sites and meteorological stations [10], different types of tree-ring parameter [11], conditions at tree sampling sites [12], threshold variations of tree growth response to climate change [13], and selection of detrending methods [14].
Central Asia, located in the heart of Eurasia, is not only a sensitive climatic area but it is also a fragile environmental area [15]. Tree cores from the mountainous area in Central Asia have been collected systematically since the 1990s [16]. The long-lived (more than 200 years) Schrenk spruce (Picea schrenkiana), an evergreen coniferous species, was frequently used in the dendrochronological studies [17]. However, previous dendrochronological studies have focused mainly on ring-width variations [18,19,20], tree growth response to climate [21,22,23], and hydroclimatic reconstruction [24,25,26]. Consequently, there is still little understanding of whether the sensitivity of tree growth in response to climatic elements has changed in Central Asia under the background of climatic change. Based on spatiotemporal analyses of precipitation variation in the arid region of Central Asia using monthly gridded precipitation data from the Climatic Research Unit (CRU), it has been determined that annual precipitation and winter precipitation have both increased significantly over the past 80 years [27]. Furthermore, an abrupt transition of precipitation occurred in the western arid lands of Central Asia in the early 1950s [28]. In addition, Wang et al. [29] found that there was no single response to an initial period of warming from the 1920s to the 1940s in the arid region of Central Asia, whereas the entire area demonstrated an overall response to a second period of warming after the 1970s. Furthermore, this significant trend of increasing temperature extending into the early 1980s has also been confirmed by Shen et al. [30]. Thus, if the divergence phenomenon exists under the background of the recent warming and wetting trend, the unstable relationship between the radial growth of trees and the main climatic limiting factor will affect both the reliability of reconstruction models based on tree-ring width and the accuracy of historical climate series in Central Asia.
To address the above knowledge gaps and to build on the existing knowledge base, this study was conducted with the following objectives: (1) to assess whether or not the relationship between climatic factors and the radial growth of spruce in low and high elevation sites is stability, and (2) to explore the possible reasons for the manifestation of the ‘divergence problem’ in the study area.

2. Materials and Methods

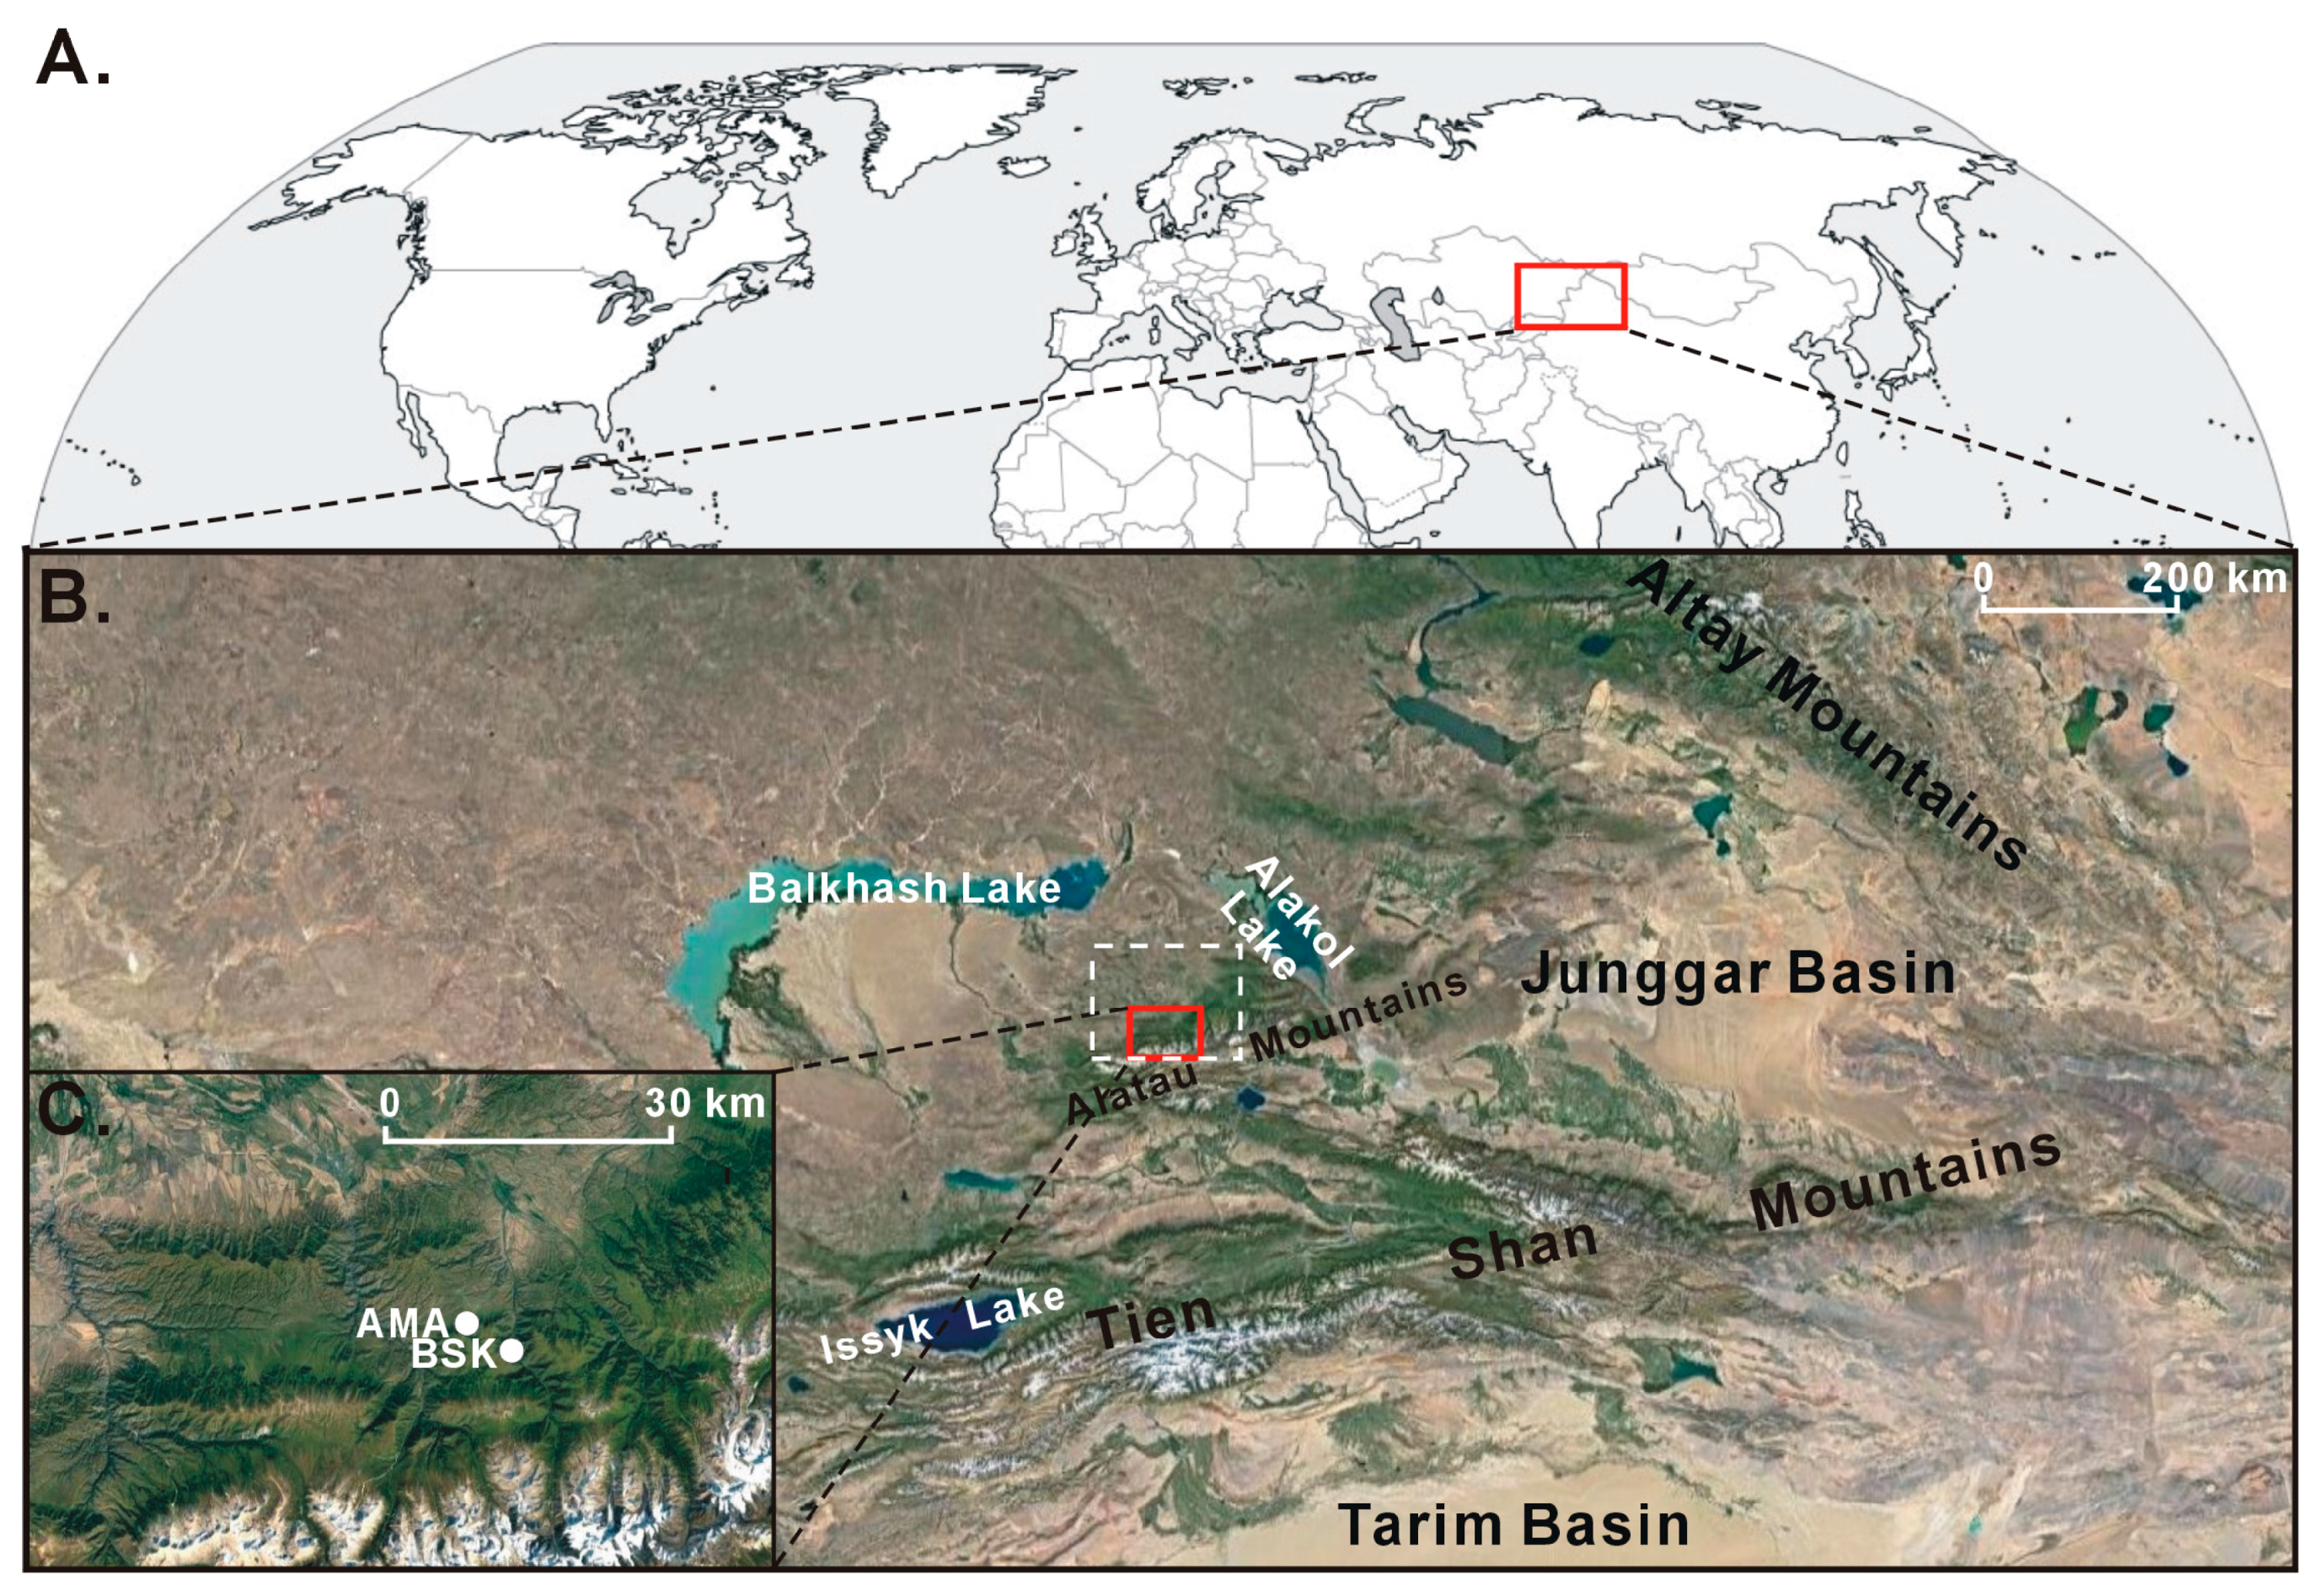
2.1. Sample Collection

The Alatau Mountains (44°40′–45°20′ N, 80°30′–82°45′ E), which form the boundary between the Dzungaria region of China and the Zhetysu region of Kazakhstan, are part of the Western Tianshan Mountains in Central Asia. The principal range runs northeast to southwest, and it extends approximately 450 km from east to west and 50–190 km from north to south. The average elevation of the Alatau Mountains is in the range 1500–3000 m, and the maximum elevation is approximately 4464 m. The Alatau Mountains have a temperate continental climate, and the northern slopes receive more annual precipitation (900–1000 mm) and have a lower snowline (3600 m) than the southern slopes.
Specimens of Schrenk spruce often grow to 40 m in height and 70–100 cm in radius. Roots of this type of spruce are distributed shallowly (soil thickness: 40–60 cm), with strong morphological plasticity, and horizontal roots are numerous [31]. More than 90% of the forest (from 1200–3000 m. in the Tianshan Mountains) contains Schrenk spruce—the dominant tree species in the forests of the mountain zone. A few broad-leaf tree species, such as Sorbus tianschanica Rupr., Salix xerophila, B. pendula, Betula tianschanica Ruprecht, are found with Schrenk spruce in the low altitude areas [32]. This widespread coniferous species provides a prime opportunity for performing dendrochronological studies to assess the response of tree growth to climate and to evaluate long-term climate variation [33]. Tree-ring cores from the above coniferous species were sampled in July 2016 in two sampling sites at high and low elevation in the northern Alatau Mountains of Kazakhstan. A map of the study area showing the locations of the sampling sites is presented in Figure 1.
The forest stands of the sampling sites are moderately open and the canopy density is reasonably low. The type of dominant soil at the sampling sites is a Mollic Leptosol [34]. The soil depth is about 30 cm and the topsoil texture is medium. To avoid interference from non-climatic effects on radial growth, we selected only healthy specimens of spruce with little evidence of damage from bushfires, landslides, earthquakes, human destruction, or animal invasion. For most sampled trees, two cores were extracted in parallel at breast height from opposite flanks of the tree. To collect tree cores that contained consistent climatic signals, the elevation difference between the highest and lowest locations of the trees sampled at each sampling site was < 100 m. Overall, 95 cores were obtained using increment borers (bore diameter: 10 mm) from 51 trees in both the high elevation site (Amanboktek, code: AMA) and the low elevation site (Basika, code: BSK). Further information regarding the two sampling sites is listed in Table 1.

2.2. Tree-Ring Core Treatments and Ring-Width Measurements

Following standard dendrochronological techniques [35], the sampled tree-ring cores were dried naturally and mounted on a grooved wooden plank. Each core was sanded using abrasive paper with low–high mesh number until the tree-ring cells were clearly distinguishable under a microscope. Then, the decadal, half-century, and century tree-rings in each core were marked with different signs using needles under a microscope. Finally, the width of every ring was measured under a binocular microscope (LINTAB Measuring Systems: The standard of North America’s Dendrological Research Community. The systems is produced by Rinntech, Germany.) at 0.001-mm resolution [36].

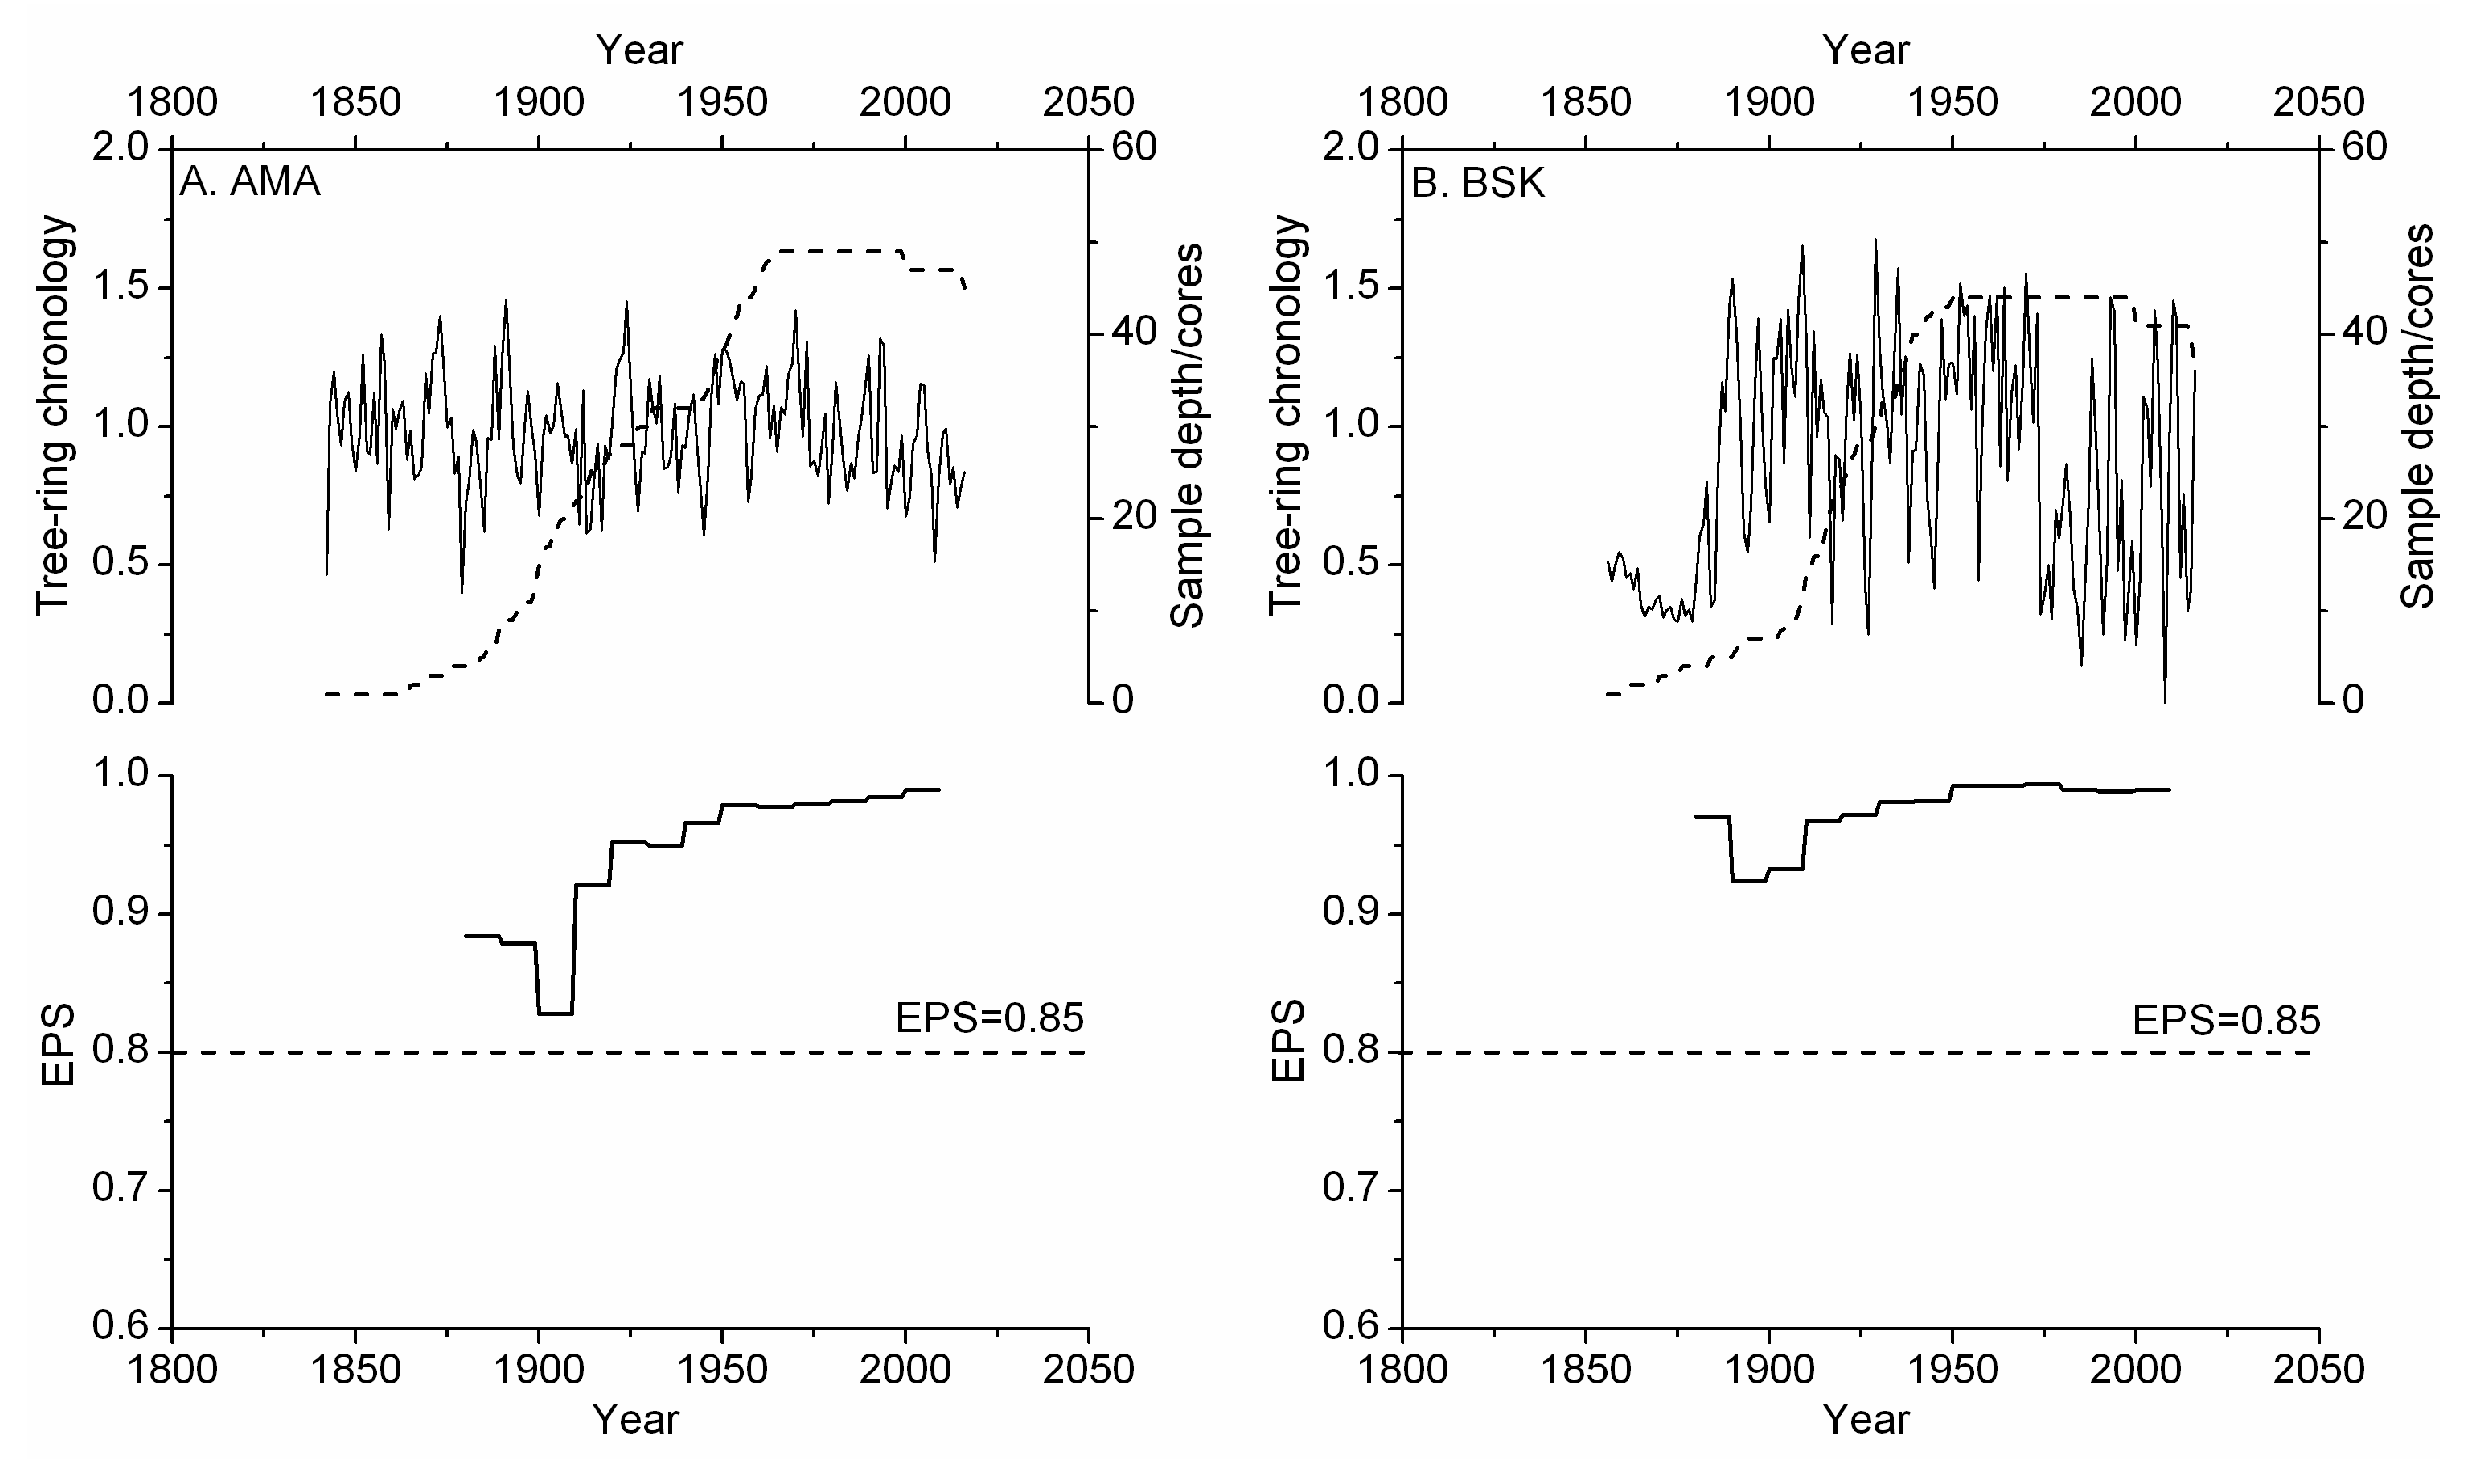
2.3. Tree-Ring Width Chronology Development

Two programs, COFECHA [37] and ARSTAN [38], were used for cross-dating quality control and for developing the chronologies. To eliminate the signals of tree ages that were affected by factors other than climate, the tree-ring width series were detrended using a negative exponential method, i.e., a conservative function [39]. Eventually, tree-ring width series were developed into three types of tree-ring chronology: standardized, residual, and autoregressive standardized chronologies [40]. The expressed population signal (EPS) was used to assess the reliable length of the tree-ring chronologies. Statistical analyses were performed at 20-year intervals with an overlap of 10 years across the chronology. An EPS of ≥ 0.8 was used to ensure a reliable length for the newly developed chronologies [41].

2.4. Climatic Data

For further analyses, we selected the mean monthly temperature and precipitation of the CRU time series [42], which is a gridded 0.5° × 0.5° dataset (45°–46° N, 79°–81° E). These climatic data from 1901–2016 were acquired from the Royal Netherlands Meteorological Institute (KNMI) Climate Explorer (http://climexp.knmi.nl) and they used to describe the climatic conditions in the study area. Many dendroclimatological studies have stressed that tree-ring formation is not only influenced by climate during the growing season but also by that in the period prior to the growing season in different climate regions [43,44,45]. Thus, different combinations of monthly climatic data from the previous year to the current year were used to reveal the relationship between tree growth and climatic conditions.

2.5. Statistical Analysis

Linear trend tests were used to evaluate trends in the meteorological data, and abrupt transitions in the climatic data were assessed using the Mann–Kendall test, which is more suitable for ordinal variable and is frequently used in the climatic statistics [46]. The main statistical characteristics of tree-ring chronologies, i.e., the standard deviation (SD), mean sensitivity (MS), signal-to-noise ratio (SNR), EPS, first principal component (PC#1), and the first-order autocorrelation (AC1) were compared to assess the climatic sensitivity of chronologies. To evaluate the patterns of variation in various frequency ranges, we used 13-year reciprocal filters to decompose the developed tree-ring chronologies and the reconstructed climatic series into high- and low-pass components [47]. The models used for the high- and low-pass filtering can be expressed by the following equations:
Xt = −0.0003 × xt+6 − 0.0030 × xt+5 − 0.0161 × xt+4 − 0.0537 × xt+3 − 0.1208 × xt+2 − 0.1933 × xt+1 + 0.7744 × xt − 0.1933 × xt−1 − 0.1208 × xt−2 − 0.0537 × xt−3 − 0.0161 × xt−4 − 0.0030 × xt−5 − 0.0003 × xt−6
Xt = 0.0003 × xt+6 + 0.0030 × xt+5 + 0.0161 × xt+4 + 0.0537 × xt+3 + 0.1208 × xt+2 + 0.1933 × xt+1 + 0.2256 × xt − 0.1933 × xt−1 + 0.1208 × xt−2 + 0.0537 × xt−3 + 0.0161 × xt−4 + 0.0030 × xt−5 + 0.0003 × xt−6
where Xt is the value of the chronology in year t after the high- or low-pass filter, and xt+6, xt+5, … … xt, … … xt−5, xt−6 refer to the values of the regional chronology in years t + 6, t + 5, … … t, … …t − 5, t − 6, respectively. Variation patterns in the original and decomposed chronologies were assessed using Pearson correlations for the original, high-frequency, and low-frequency domains. Similarity among the chronologies was also assessed using the Gleichläufigkeit index (GLK) [48]. Correlation analysis and moving correlation analysis were also used to quantify the strength of the climatic signals inherent in the chronologies from the spruces at the study sites. The significance level for the correlation coefficients was evaluated using the two-tailed test. Variations in correlation coefficients between the chronologies and the same climatic factors were evaluated using the u test [49]. Significant correlations between the tree-ring chronology and the climatic data were identified, and then a linear regression model was employed to simulate the variations of the tree-ring chronology as a dependent variable relying on monthly precipitation and mean temperature as predictors. Only the monthly precipitation and mean temperature correlated significantly with the tree-ring chronology were used to simulate the variations of tree-ring width in different periods using the method of backward stepwise regression; unsuitable predictors were removed from the model. Then, statistics of models were compared to assess the simulative effect of tree-ring width. The above analyses were performed using Statistical Product and Service Solutions, Data Processing System, and Microsoft Office Excel.

3. Results

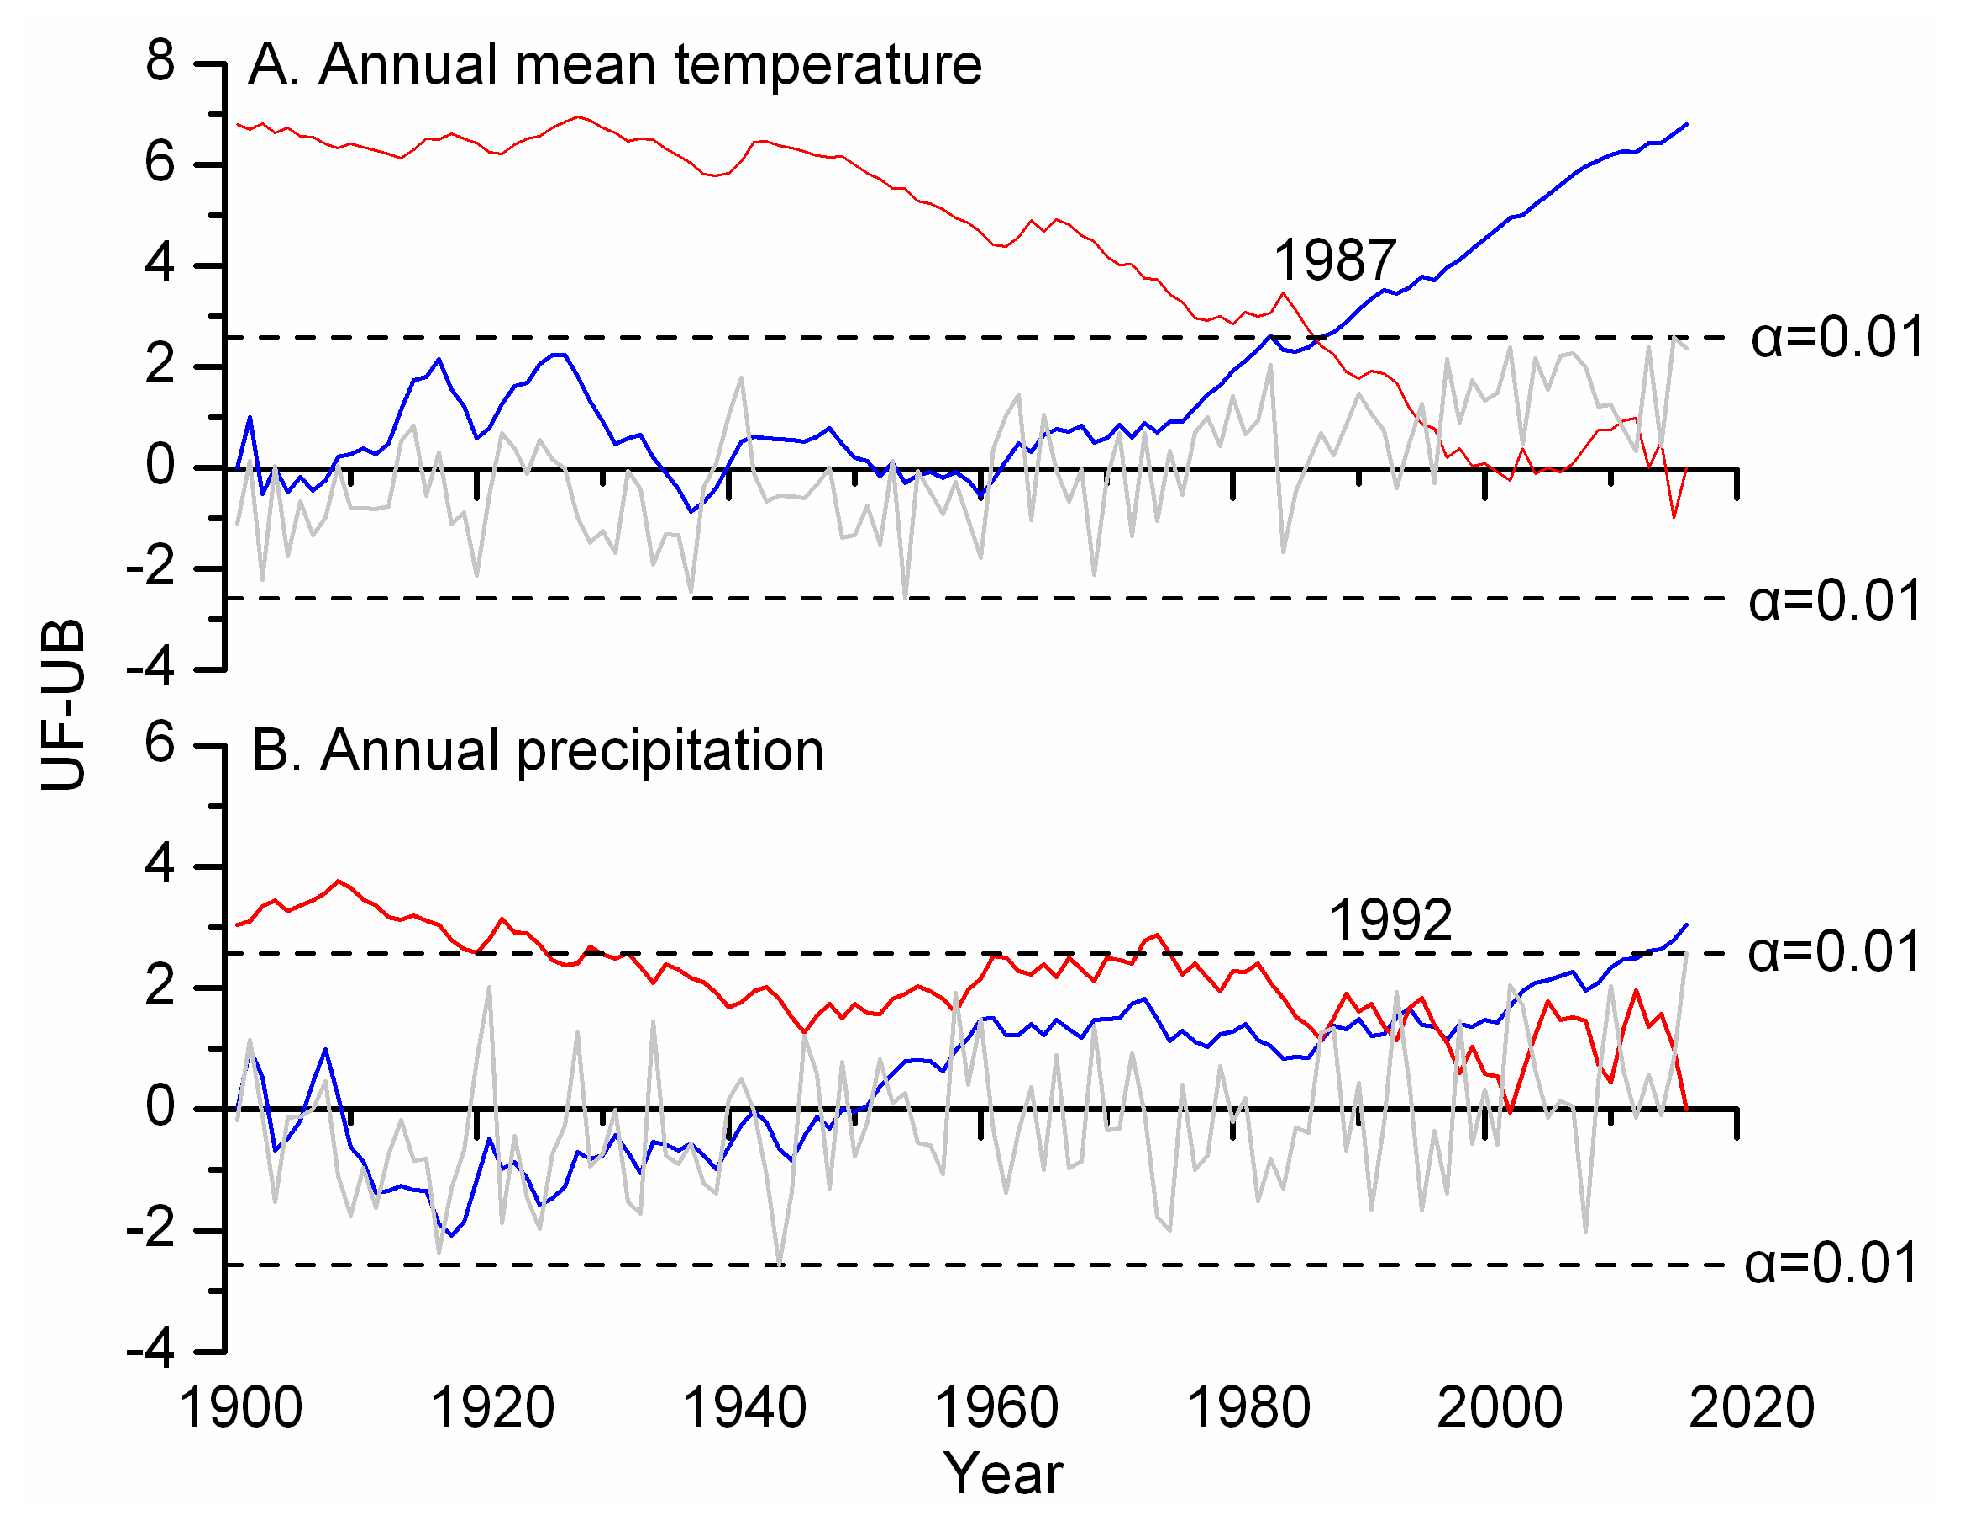
3.1. Variation Characteristics of the Meteorological Data

The period of highest temperature in the study area is in summer (June–August) and that the maximum temperature is in July (18.34 °C) (Figure 2a). There are two precipitation maxima: in May (42.4 mm) and November (30.4 mm), which represent 12.6% and 9.0%, respectively, of the total annual rainfall (Figure 2c). Analysis of the climate data for the period since 1901 shows a significant trend of increase in mean annual temperature (Y = 0.0172X − 30.708, R2 = 0.371, F = 67.29, p < 0.001; Figure 2b) and a less significant trend of increase in annual precipitation (Y = 0.6171X − 870.81, R2 = 0.081, F = 10.02, p < 0.01; Figure 2d). The results of the Mann–Kendall test show that the annual mean temperature and annual precipitation have abrupt transitions (from low to high) in 1987 (Figure 3a) and 1992 (Figure 3b), respectively. These abrupt transitions are consistent with the abrupt climatic changes observed in northwest China [50].

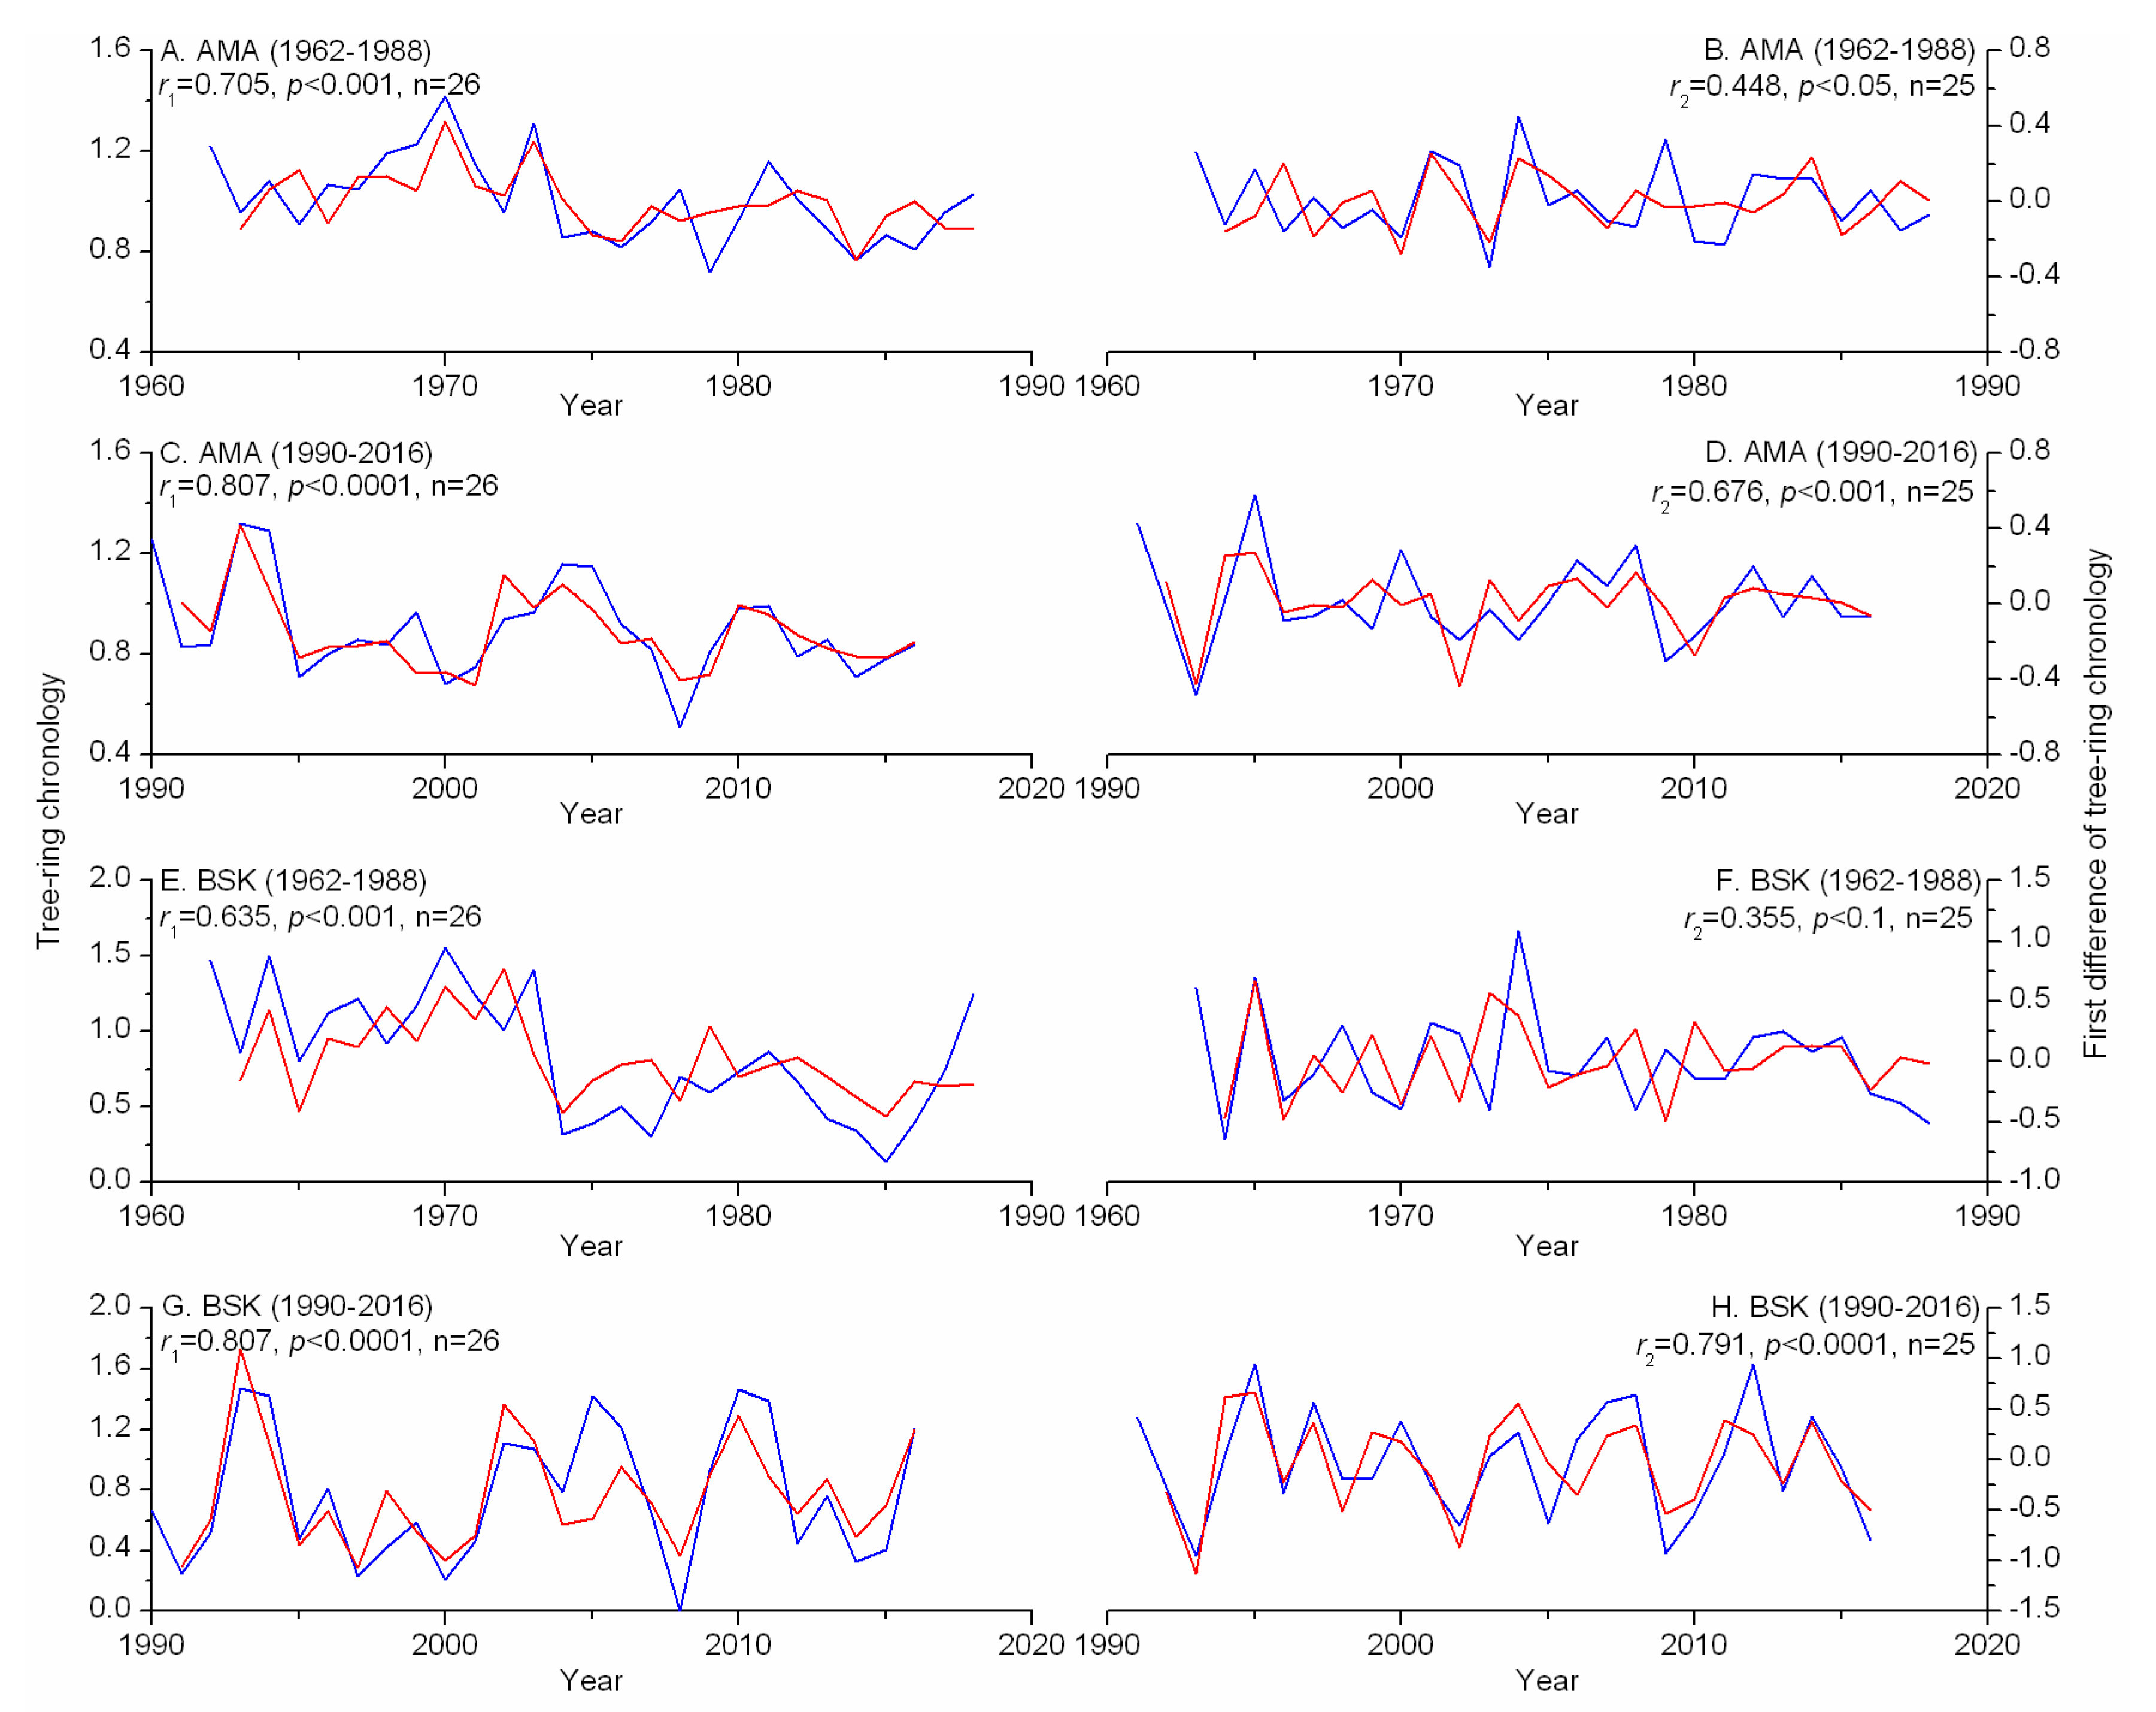
3.2. Comparative Analysis between Tree-Ring Chronologies

After cross-dating quality control, all the tree cores from the two sites were used to develop tree-ring chronologies. To proceed with the analysis, we utilized the standard chronologies that contained the common variations for series of tree samples and retained a low- to high-frequency common variance. This variance is hypothesized as being dependent on climate [51]. Two chronologies, the depths of their samples, and the EPS are illustrated in Figure 4. The general statistics for a common period of analysis (from 1900 to 1999) of the two chronologies are listed in Table 2. The reliable lengths of the AMA and BSK chronologies all started in 1880. Higher values of the interseries correlation among trees, interseries correlation among all ring-width series, and mean within-tree correlation for the BSK chronology reveal that the coherence of the radial growth of spruce trees at low elevation is better than at high elevation. The main statistical characteristics for the BSK chronology, i.e., SD, MS, SNR, EPS, and PC#1 obviously exceed the AMA chronology in the common period. These higher statistics indicate that the ring-width variation of trees in the low elevation area might contain more climatic signals than in the high elevation area. Furthermore, AC1 values of 0.577 and 0.396 at BSK and AMA, respectively, show that the two tree-ring chronologies from the high and low elevation sites contain low-frequency variance generated by climatic and tree-physiological lag effects.
In addition to the reciprocal filters, we also used Pearson correlation coefficients to analyze the three sets of data. These data comprised original unfiltered data, high-pass filtered data, and low-pass filtered data. The correlation between the two chronologies in the original, high-frequency, and low-frequency domains over the common period of 1880–2016 was 0.651, 0.647, and 0.545, respectively. The similarity between the two chronologies was also compared by assessing the GLK value. The GLK value (68.4%) exceeded the 0.001 significance level, indicating that the radial growth of the spruce trees at the two sampling sites was similar. The 10 highest-value years and 10 lowest-value years of the AMA and BSK chronologies within the common period (1880–2016) are shown in Table 3. Comparison of these extreme-value years reveals two high-value years (1970 and 1993) and four low-value years (1917, 1927, 2000, and 2008) in the two chronologies. The results indicate reasonable coherence of the extreme values between the two chronologies.

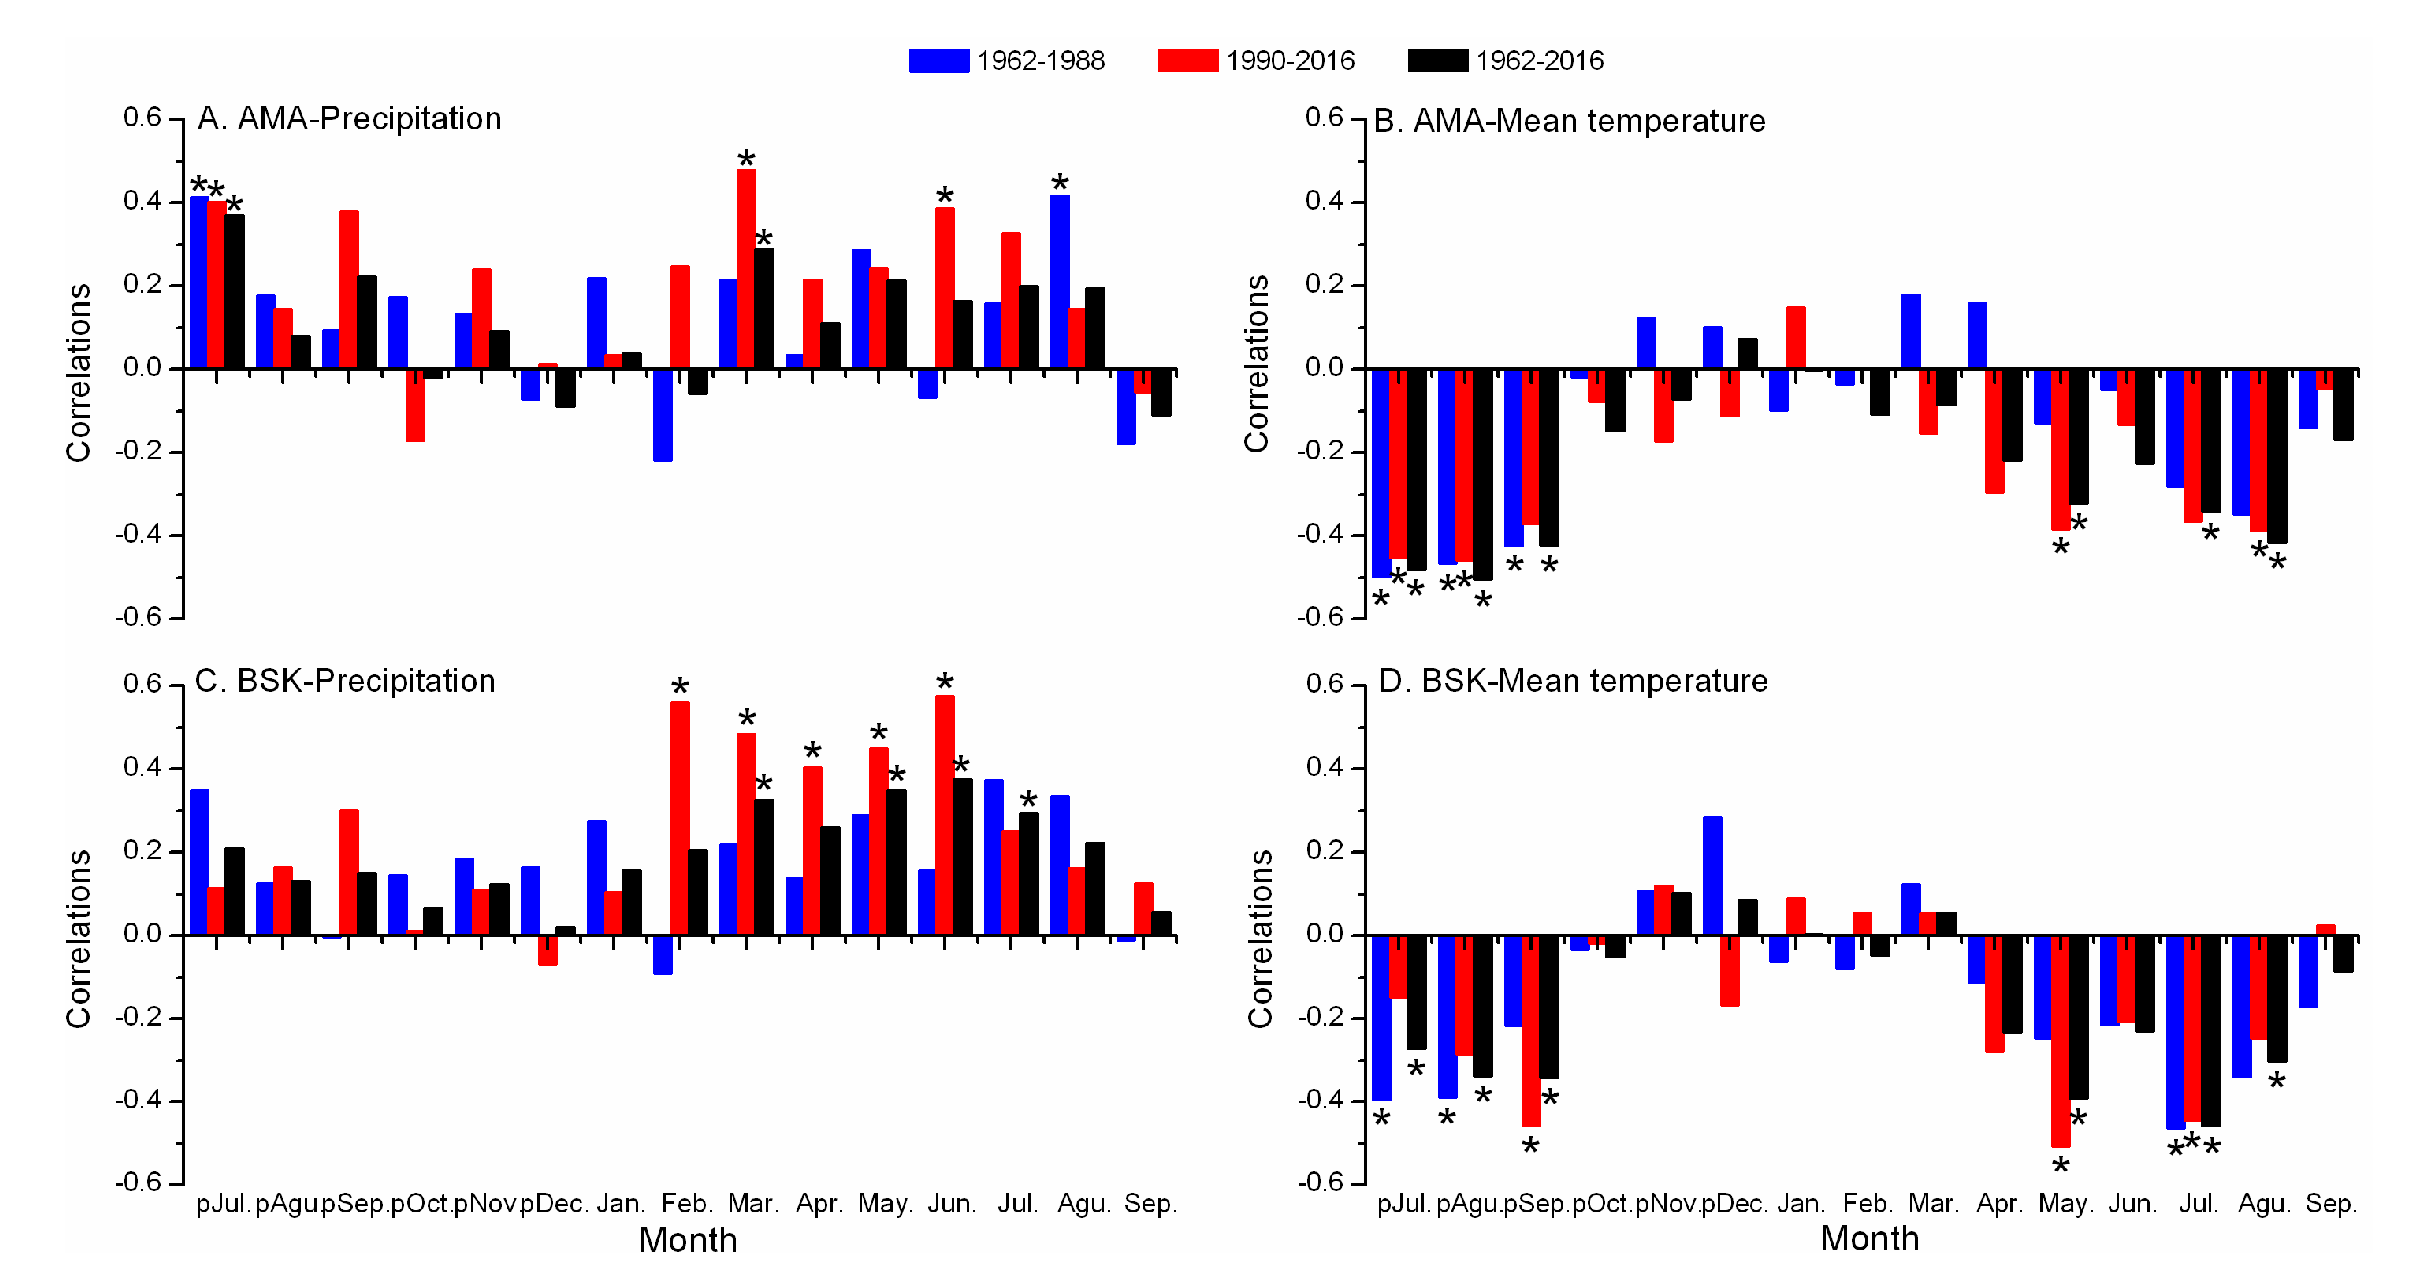
3.3. Correlations between Chronologies and Climatic Data

A strong biological lag effect was indicated by the high AC1 values (0.577 and 0.396) of the tree-ring chronologies (Table 2). Therefore, the monthly climatic data from July in the previous year to October in the current year (a 16-month period) were used to assess the influence of climatic factors on the radial growth of the spruce trees. The mid-year (1989) between the two abrupt climatic transitions (1987 and 1992) obtained by the Mann–Kendall test (Figure 3) was selected as the dividing point to separate two equal lengths of climatic data. Thus, the climatic data of three different periods, i.e., 1962–1988 (27 years), 1990–2016 (27 years), and 1962–2016 (55 years) were used for correlation with the tree-ring chronology. The results of the correlation analyses are shown in Figure 5.
The AMA chronology was found to have significant positive correlation with precipitation in both July (r = 0.371, p < 0.01) of the previous year and March (r = 0.287, p < 0.05) of the current year in the combined period of 1962–2016. In the comparison of correlation between the chronology and climatic data in the two different periods, significant correlation was found for the AMA chronology and precipitation in both July (r = 0.414, p < 0.05) of the previous year and August (r = 0.418, p < 0.05) of the current year in the period 1962–1988. Three correlation coefficients exceeded the 0.05 significance level in the period 1990–2016: July (r = 0.402) of the previous year, and March (r = 0.478) and June (r = 0.388) of the current year. The AMA chronology was found to have significant negative correlation with mean temperature in July (r = −0.482, p < 0.001), August (r = −0.504, p < 0.001), and September (r = −0.422, p < 0.01) of the previous year, and in May (r = −0.322, p < 0.05), July (r = −0.341, p < 0.05), and August (r = −0.415, p < 0.01) of the current year in the combined period 1962–2016. In the comparison of correlation between the chronology and climatic data in the two different periods, significant correlation was found for the AMA chronology and mean temperature in July (r = −0.499, p < 0.01), August (r = −0.467, p < 0.05), and September (r = −0.425, p < 0.05) of the previous year in the period 1962–1988. Four correlation coefficients exceeded the 0.05 significance level in the period 1990–2016: July (r = −0.453) and August (r = −0.459) of the previous year, and May (r = −0.384) and August (r = −0.388) of the current year.
The BSK chronology was found to have significant positive correlation with precipitation in March (r = 0.326, p < 0.05), May (r = 0.349, p < 0.01), June (r = 0.375, p < 0.01), and July (r = 0.294, p < 0.05) of the current year in the combined period 1962–2016. In the comparison of correlation between the chronology and climatic data in the two different periods, no significant correlation was found for the BSK chronology and the monthly precipitation in the period 1962–1988. Five correlation coefficients exceeded the 0.05 significance level in the period 1990–2016: February (r = 0.560), March (r = 0.485), April (r = 0.405), May (r = 0.450), and June (r = 0.576) of the current year. The BSK chronology exhibited significant negative correlation with mean temperature in July (r = −0.273, p < 0.05), August (r = −0.339, p < 0.05), and September (r = −0.342, p < 0.05) of the previous year, and May (r = −0.391, p < 0.01), July (r = −0.459, p < 0.001), and August (r = −0.302, p < 0.05) of the current year in the combined period 1962–2016. In the comparison of correlation between the chronology and climatic data in the two different periods, significant correlations were found for the BSK chronology and the mean temperature in July (r = −0.395, p < 0.05), and August (r = −0.389, p < 0.05) of the previous year, and July (r = −0.464, p < 0.05) of the current year in the period 1962–1988. Three correlation coefficients exceeded the 0.05 significance level in the period 1990–2016: September (r = −0.459, p < 0.05) of the previous year, and May (r= −0.508, p < 0.01) and July (r = −0.445, p < 0.05) of the current year.

4. Discussion

Heat stress and moisture stress are the main climatic stresses in the process of tree-ring formation. These stresses have been confirmed in dendroclimatological studies using tree-ring samples of both Schrenk spruce growing in different parts of the Tianshan Mountains [47,52,53,54] and northern spruce, pine, and juniper [19,55,56,57]. The tree-ring chronologies of specimens at both the high and low elevation sites revealed similar climatic responses (Figure 5). The results of the correlation analysis revealed the generally positive relationship between the radial growth of spruce and monthly precipitation, and the generally negative response between tree growth and monthly mean temperature. Enhanced rainfall in July of the previous year might increase the rate of photosynthesis of Schrenk spruce growing in the sampling sites, which would result in an abundance of larger leaves, buds, and roots and abundant nutrient storage [58,59]. This would increase the total photosynthetic and absorptive areas of the Schrenk spruce, which would then be able to absorb moisture or produce growth substances when favorable climatic conditions returned in the following year [44,60]. In the study area, March–July of the current year covers the period from the end of the dormant season to the fast growth season. Additional rainfall during this period would result in higher soil moisture that might reduce water stress and benefit cambial cell division in the spruce trees [61]. In contrast, higher temperature in the two periods could enhance evaporative water loss and aggravate moisture stress in this arid area because of the reasonably thin soil and the moderately open canopy; therefore, the radial growth of the spruce would be obviously restrained [62].
Based on dendroclimatological studies of trees at different elevations, it is generally considered that precipitation is the main limiting factor of tree growth at the lower forest limit, whereas the radial growth of trees at the upper forest limit is constrained principally by temperature [63,64,65,66]. However, some studies have claimed that this does not hold for some extremely arid or humid areas in which the main climatic limiting factors might not change with elevation [67,68]. To a certain extent, the result of the response of tree growth to climate in our study, under the background of an arid environment, was consistent with the latter conclusion. We found 10 correlation coefficients between the BSK chronology and climatic data at the 0.05 significance level, while only eight significant correlations were found between the AMA chronology and climatic data. Although the response of tree growth to climate was similar at the two sampling sites, the stronger relationship between the radial growth of spruce in the low elevation site and climate indicates that the influence of the moisture factor was greater in the low elevation area. Furthermore, the higher number of significant correlation coefficients between the BSK chronology and the climatic data suggests that the effect of additional climatic signals might be inherent in this chronology. These results are consistent with the comparative analysis between the main statistical characteristics of the two tree-ring chronologies.
In the period 1990–2016, there are 15 correlation coefficients between the two chronologies and the climatic data at the 0.05 significance level, whereas only eight significant correlations were found in the period 1962–1988 (Figure 5). The number of significant correlation coefficients indicates that the climate response of tree growth in the period 1990–2016 was stronger than in the period 1962–1988 in both the high and the low elevation sites. The results of the u test revealed that significant difference among these correlations in the two periods occurred only in February (u = −2.455, p < 0.05) of the current year for the BSK chronology, whereas there was no significant difference in the AMA chronology (Table 4). The correlation between the BSK chronology and precipitation in February of the current year changed from −0.091 to 0.560. Furthermore, the monthly climatic data, which correlated with the tree-ring chronologies at the 0.05 significance level, were applied to simulate the variations of tree-ring width in the periods 1962–1988 and 1990–2016. After removing some unsuitable months to avoid overfitting, four linear regression models were used to portray the relationship between the monthly climatic data and the tree-ring chronology in the two periods. These models were formulated as follows:
CAMA (1962–1988) = 2.866 + 0.004 × PAug. − 0.049 × TpJul. − 0.062 × TpAug
where n = 26, r1 = 0.705 (p < 0.001), r2 = 0.448 (p < 0.05), R2 = 49.7%, R2adj = 42.8%, SE = 0.128, F = 7.232, and D/W = 2.206.
CAMA (1990–2016) = 3.850 + 0.004 × PJun. − 0.088 × TpJul. − 0.058 × TpAug. − 0.036 × TMay
where n = 26, r1 = 0.807 (p < 0.0001), r2 = 0.676 (p < 0.001), R2 = 65.1%, R2adj = 58.5%, SE = 0.119, F = 9.797, and D/W = 2.140.
CBSK (1962–1988) = 7.004 − 0.139 × TpAug. − 0.207 × TJul
where n = 26, r1 = 0.635 (p < 0.001), r2 = 0.355 (p < 0.1), R2 = 40.3%, R2adj = 35.1%, SE = 0.325, F = 7.756, and D/W = 1.612.
CBSK (1990–2016) = 0.911 + 0.024 × PFeb. + 0.007 × PApr. + 0.008 × PJun. – 0.097 × TpSep
where n = 26, r1 = 0.807 (p < 0.0001), r2 = 0.791 (p < 0.0001), R2 = 65.2%, R2adj = 58.5%, SE = 0.291, F = 9.813, and D/W = 1.530, and where CAMA (1962–1988), CAMA (1962–1988), CBSK (1962–1988), and CBSK (1990–2016) represent the calculation of the AMA and BSK chronologies in the two periods 1962–1988 and 1990–2016, and P and T refer to monthly precipitation and mean temperature, respectively. The subscripts for P and T are abbreviations of given months and the p before the abbreviation denotes a month in the previous year. Statistics related to each model comprising the correlation coefficients of the original (r1) and the first difference (r2), R2, R2adj, standard error (SE), F-value (F), and Durbin–Watson (D/W) statistic are listed following the equations. Equations (4) and (6) accounted for 65.1% and 65.2% of the variance in the AMA and BSK chronologies during the calibration period 1990–2016; the variance explained by Equations (3) and (5) was 49.7% and 40.3% in the calibration period 1962–1988. Figure 6 shows that the simulated chronologies have a good match with the calibration in the original and first difference domains in the period 1990–2016, while the coherences between the simulation and the calibration for two tree-ring chronologies are obviously weak in the period 1962–1988, especially in the first difference domain. The above results of the correlation analysis, u test, and simulation of tree-ring chronologies indicate that the climate response of the radial growth of the spruce growing in the study area has obviously strengthened after the abrupt change of climate.
Jacoby and D’Arrigo [4] first proposed the ‘divergence problem’ based on the decreased climatic response of tree-ring width of white spruce (Picea glauca (Moench.) Voss) from Alaska. A similar phenomenon was confirmed in the Wrangell Mountain region of Alaska [11]. Furthermore, evidence of decreased sensitivity of tree-ring width to temperature was also found in other areas including Northern Siberia [69], central Japan [8], Mediterranean [70], and northeastern parts of the Qinghai–Tibetan Plateau [71]. In contrast, increased or even shifted climatic responses of the radial growth of trees were also found in other studies of Pinus koraiensis Sieb. Et Zucc in the Changbai Mountains [72], Picea meyeri at low elevation on Luya Mountain [73], and Picea obovata in the western Sayan Mountains of Siberia [74]. These findings indicate that the manifestation of the ‘divergence problem’ varies in different area under the background of global warming. The causes of the variation in response of tree growth to climate are not well understood and they are difficult to elucidate because of the combined influence of a number of covarying environmental factors [10].
Increased drought stress is regarded as the main reason for the increased climate sensitivity of tree-ring width in the study area. Although the recent warming and wetting trend of the climate is significant (Figure 2), there is an obvious difference between the scale of the trend of increase in precipitation and that of mean temperature. The average value of annual precipitation for the periods 1962–1988 and 1990–2016 was 333.4 and 371.8 mm, respectively, i.e., the scale of the difference in the increase of annual precipitation between the two periods is +11.5%. The average value of the annual mean temperature for the periods 1962–1988 and 1990–2016 was 3.02 and 3.96 °C, respectively, i.e., the scale of the difference in the increase of annual mean temperature between the two periods was +31.0%. Thus, the greater scale of the increase of annual mean temperature might offset the wetting trend, which would enhance evaporation and further aggravate drought stress. Barber et al. [13] showed that the combined action of increasing summer temperature and simultaneously decreasing precipitation, which triggers intensified water stress, has been the main reason for the consistent decrease in growth exhibited by some white spruce in Alaska over the past 90 years. Thus, the positive response to precipitation and the negative response to temperature, strengthened in the radial growth of the Schrenk spruce of our study, reflect the enhancement of temperature-induced drought stress over recent decades. Furthermore, similar divergent responses to climatic factors in the radial growth of Larix sibirica have also found in the Eastern Tianshan Mountains of Northwest China [75], although the distance between this region and our study area is almost 1000 km.

5. Conclusions

The stability of the response of the radial growth of Schrenk spruce to climate was verified based on two tree-ring width chronologies at high and low elevation sites in the Alatau Mountains. Comparative analysis revealed reasonable coherence between the two chronologies. Correlation analysis indicated that moisture was the main factor limiting the radial growth of these spruces, and that its influence was more evident in the low elevation area. Furthermore, the response of the radial growth of the spruces to climate increased significantly after an abrupt change in climate under the background of the warming and wetting trend. Increased drought stress was regarded as the main reason for the increased climate sensitivity of tree-ring width in the study area. The findings of this study supply a gap of the stability of climatic response of the radial growth of conifers to some extent and possibly provide a reference of climatic reconstruction based on tree-ring data for Central Asia. Although our findings regarding the response of radial growth to climate are consistent with results obtained in the Eastern Tianshan Mountains, further research based on multiple tree-ring sampling sites in different study areas is needed to confirm these conclusions and to extend the scope of the work to the entire Alatau Mountains or even all of Central Asia.

Author Contributions

T.Z., R.Z. and M.B.: sampling design and sample collection; S.J. and U.A.: sample treatment and data interpretation; T.Z. and S.Y.: conception of the study, analysis, and interpretation of data, and manuscript writing.

Funding

The research was supported by Key Laboratory Opening Subject of Xinjiang Uigur Autonomous Region (2018D04028), Shanghai Cooperation Organization of Science and Technology Partnership (2017E01032), National Natural Science Foundation of China (U1803245), and Tianshan Cedar Project of Xinjiang Uigur Autonomous Region (2017XS18).

Acknowledgments

We thank Bulkajyr T. Mambetov, Nurzhan Kelgenbayev, and Daniyar Dosmanbetov for their great help in the process of collecting samples. Particular thanks are extended to James Buxton MSc, from Liwen Bianji, Edanz Group China (www.liwenbianji.cn./ac), for editing the English text of this manuscript.

Conflicts of Interest

The authors declare no conflict of interest.

References

  1. Nabuurs, G.J.; Pussinen, A.; van Bruselen, J.; Schelhaas, M.J. Future harvesting pressure on European forests. Eur. J. For. Res. 2007, 126, 391–400. [Google Scholar] [CrossRef]
  2. Kolström, M.; Lindner, M.; Vilén, T.; Maroschek, M.; Seidl, R.; Lexer, M.J.; Netherer, S.; Kremer, A.; Delzon, S.; Barbati, A.; et al. Reviewing the Science and Implementation of Climate Change Adaptation Measures in European Forestry. Forests 2011, 2, 961–982. [Google Scholar] [CrossRef] [Green Version]
  3. Machar, I.; Vlckova, V.; Bucek, A.; Vozenilek, V.; Salek, L.; Jerabkova, L. Modelling of Climate Conditions in Forest Vegetation Zones as a Support Tool for Forest Management Strategy in European Beech Dominated Forests. Forests 2017, 8, 82. [Google Scholar] [CrossRef]
  4. Jacoby, G.C.; D’Arrigo, R.D. Tree ring width and density evidence of climatic and potential forest change in Alaska. Glob. Biogeochem. Cycles 1995, 9, 227–234. [Google Scholar] [CrossRef]
  5. Büntgen, U.; Frank, D.C.; Schmidhalter, M.; Neuwirth, B.; Seifert, M.; Esper, J. Growth/climate response shift in a long subalpine spruce chronology. Trees-Struct. Funct. 2006, 20, 99–110. [Google Scholar] [CrossRef]
  6. Pisaric, M.F.J.; Carey, S.K.; Kokelj, S.V.; Youngblut, D. Anomalous 20th century tree growth, Mackenzie Delta, Northwest Territories, Canada. Geophys. Res. Lett. 2007, 34, 247–260. [Google Scholar] [CrossRef]
  7. Briffa, K.R.; Jones, P.D.; Schweingruber, F.H.; Osborn, T.J. Influence of volcanic eruptions on Northern Hemisphere summer temperature over the past 600 years. Nature 1998, 393, 450–455. [Google Scholar] [CrossRef]
  8. Yonenobu, H.; Eckstein, D. Reconstruction of early spring temperature for central Japan from the tree-ring widths of Hinoki cypress and its verification by other proxy records. Geophys. Res. Lett. 2006, 33, 328–340. [Google Scholar] [CrossRef]
  9. Esper, J.; Frank, D.; Büntgen, U.; Verstege, A.; Hantemirov, A.M.; Kirdyanov, L.V. Trends and uncertainties in Siberian indicators of 20th century warming. Glob. Chang. Biol. 2010, 16, 386–398. [Google Scholar] [CrossRef]
  10. D’Arrigo, R.D.; Wilson, R.; Liepert, B.; Cherubini, P. On the ‘Divergence Problem’ in Northern Forests: A review of the tree-ring evidence and possible causes. Glob. Planet. Chang. 2008, 60, 289–305. [Google Scholar] [CrossRef]
  11. Davi, N.K.; Jacoby, G.C.; Wiles, G.C. Boreal temperature variability inferred from maximum latewood density and tree-ring width data, Wrangell Mountain region, Alaska. Quat. Res. 2003, 60, 252–262. [Google Scholar] [CrossRef]
  12. Driscoll, W.W.; Wiles, G.C.; D’Arrigo, R.D.; Wilmking, M. Divergent tree growth response to recent climatic warming, Lake Clark National Park and Preserve, Alaska. Geophys. Res. Lett. 2005, 32, 423–436. [Google Scholar] [CrossRef]
  13. Barber, V.A.; Juday, G.P.; Finney, B.P. Reduced growth of Alaskan white spruce in the twentieth century from temperature-induced drought stress. Nature 2000, 405, 668–673. [Google Scholar] [CrossRef] [PubMed]
  14. Cook, E.R.; Peters, K. Calculating unbiased tree-ring indices for the study of climatic and environmental change. Holocene 1997, 7, 361–370. [Google Scholar] [CrossRef]
  15. Becker, F.; Li, Z.L. Towards a local split window method over land surface. Int. J. Remote Sens. 1990, 11, 369–393. [Google Scholar] [CrossRef]
  16. Esper, J.; Frank, D.C.; Wilson, R.J.S.; Büntgen, U.; Treydte, K. Uniform growth trends among central Asian low- and high-elevation juniper tree sites. Trees-Struct. Funct. 2007, 21, 141–150. [Google Scholar] [CrossRef]
  17. Yang, C.Y.; Shen, K.M.; Mao, Z.M. Flora Xinjiangensis: Tomus 1; Xinjiang Science & Technology & Hygiene Publishing House: Urumqi, China, 1992. (In Chinese) [Google Scholar]
  18. Esper, J. Long-term tree-ring variations in Juniperus at the upper timber-line in the Karakorum (Pakistan). Holocene 2000, 10, 253–260. [Google Scholar] [CrossRef]
  19. Opała, M.; Niedźwiedź, T.; Rahmonov, O.; Owczarek, P.; Małarzewski, Ł. Towards improving the Central Asian dendrochronological network—New data from Tajikistan, Pamir-Alay. Dendrochronologia 2017, 41, 10–23. [Google Scholar] [CrossRef]
  20. Opała-Owczarek, M.; Owczarek, P.; Rahmonov, O.; Niedźwiedź, T. The first dendrochronological dating of timber from Tajikistan–Potential for developing a millennial tree-ring record. Tree-Ring Res. 2018, 74, 50–62. [Google Scholar] [CrossRef]
  21. Esper, J.; Shiyatov, S.G.; Mazepa, V.S.; Wilson, R.J.S.; Graybill, D.A.; Funkhouser, G. Temperature-sensitive Tien Shan tree ring chronologies show multi-centennial growth trends. Clim. Dynam. 2003, 21, 699–706. [Google Scholar] [CrossRef] [Green Version]
  22. Winter, M.B.; WolV, B.; Gottschling, H.; Cherubini, P. The impact of climate on radial growth and nut production of Persian walnut (Juglans regia L.) in Southern Kyrgyzstan. Eur. J. For. Res. 2009, 128, 531–542. [Google Scholar] [CrossRef]
  23. Zhang, T.W.; Yuan, Y.J.; He, Q.; Wei, W.S.; Diushen, M.; Shang, H.M.; Zhang, R.B. Development of tree-ring width chronologies and tree-growth response to climate in the mountains surrounding the Issyk-Kul Lake, Central Asia. Dendrochronologia 2014, 32, 230–236. [Google Scholar] [CrossRef]
  24. Fang, K.Y.; Davi, N.; Gou, X.H.; Chen, F.H.; Cook, E.; Li, J.B.; D’Arrigo, R. Spatial drought reconstructions for central High Asia based on tree rings. Clim. Dynam. 2010, 35, 941–951. [Google Scholar] [CrossRef]
  25. Chen, F.; He, Q.; Bakytbek, E.; Yu, S.L.; Zhang, R.B. Reconstruction of a long streamflow record using tree rings in the upper Kurshab River (Pamir-Alai Mountains) and its application to water resources management. Int. J. Water Resour. D 2017, 33, 976–986. [Google Scholar] [CrossRef]
  26. Panyushkina, I.P.; Meko, D.M.; Macklin, M.G.; Toonen, W.H.J.; Mukhamadiev, N.S.; Konovalov, V.G.; Ashikbaev, N.Z.; Sagitov, A.O. Runoff variations in Lake Balkhash Basin, Central Asia, 1779–2015, inferred from tree rings. Clim. Dynam. 2018, 51, 3161–3177. [Google Scholar] [CrossRef]
  27. Chen, F.H.; Huang, W.; Jin, L.Y.; Chen, J.H.; Wang, J.S. Spaiotemporal precipitation variations in the arid Central Asia in the context of global warming. Sci. China Earth Sci. 2011, 54, 1812–1821. [Google Scholar] [CrossRef]
  28. Huang, W.; Wu, X.; Chen, J.H.; Chen, F.H. Tropospheric biennial oscillations and abrupt changes of precipitation in the arid Central Asia. Adv. Clim. Chang. Res. 2012, 8, 448–455, (In Chinese, with English abstract). [Google Scholar]
  29. Wang, J.S.; Chen, F.H.; Jin, L.Y.; Wei, F. The response to two global warming periods in the 20th century over the arid Central Asia. J. Glaciol. Geocryol. 2008, 30, 224–233, (In Chinese, with English abstract). [Google Scholar]
  30. Shen, W.F.; Miao, Q.L.; Wei, T.X.; Kong, C.C. Analysis of temperature variation in recent 130 years in Central Asia. J. Arid Meteorol. 2013, 31, 32–36, (In Chinese, with English abstract). [Google Scholar]
  31. Lu, P.; Yan, G.X. Xinjiang Forests; Xinjiang People’s Press: Urumqi, China; China Forestry Publishing House: Beijing, China, 1989. (In Chinese) [Google Scholar]
  32. Pan, Y.F.; Yan, S.; Mu, G.J.; Kong, Z.C.; Ni, J.; Yang, Z.J. Changes in the concentrations of airborne Picea schrenkiana pollen in response to temperature changes in the Tianshan Mountain area. Acta. Ecol. Sin. 2011, 31, 6999–7006, (In Chinese, with English abstract). [Google Scholar]
  33. Sang, W.G.; Wang, Y.X.; Su, H.X.; Lu, Z.H. Response of tree-ring width to rainfall gradient along the Tianshan Mountains of northwestern China. Chin. Sci. Bull. 2007, 52, 2954–2962. [Google Scholar] [CrossRef]
  34. FAO; IIASA; ISRIC; ISSCAS; JRC. Harmonized World Soil Database (version 1.2); FAO: Rome, Italy; IIASA: Laxenburg, Austia, 2012. [Google Scholar]
  35. Speer, J.H. Fundamentals of Tree-Ring Research; The University of Arizona Press: Tucson, AZ, USA, 2010. [Google Scholar]
  36. Schöngart, J.; Piedade, M.T.F.; Wittmann, F.; Junk, W.J.; Worbes, M. Wood growth patterns of Macrolobium acaciifolium (Benth.) Benth. (Fabaceae) in Amazonian black-water and white-water floodplain forests. Oecologia 2005, 145, 454–461. [Google Scholar] [CrossRef] [PubMed]
  37. Grissino-Mayer, H.D. Evaluating crossdating accuracy: A manual and tutorial for the computer program COFECHA. Tree-Ring Res. 2001, 57, 205–221. [Google Scholar]
  38. Cook, E.R.; Krusic, P.J. Program ARSTAN: A Tree-Ring Standardization Program Based on Detrending and Autoregressive Time Series Modeling, with Interactive Graphics; Lamont-Doherty Earth Observatory, Columbia University: New York, NY, USA, 2005. [Google Scholar]
  39. Liu, Y.; Tian, H.; Song, H.M.; Liang, J.M. Tree ring precipitation reconstruction in the Chifeng-Weichang region, China, and East Asian summer monsoon variation since A.D. 1777. J. Geophys. Res. 2010, 115, 620–631. [Google Scholar] [CrossRef]
  40. Cook, E.R.; Kairiukstis, L.A. Methods of Dendrochronology: Applications in the Environmental Sciences; Kluwer Academic Publishers: Dordrecht, The Netherlands, 1990. [Google Scholar]
  41. Wigley, T.M.L.; Briffa, K.R.; Jones, P.D. On the average value of correlated time series, with applications in dendroclimatology and hydrometeorology. J. Clim. Appl. Meteorol. 1984, 23, 201–213. [Google Scholar] [CrossRef]
  42. Harris, I.; Jones, P.D.; Osborn, T.J.; Lister, D.H. Updated high-resolution grids of monthly climatic observations—The CRU TS3.10 Dataset. Int. J. Climatol. 2014, 34, 623–642. [Google Scholar] [CrossRef]
  43. D’Arrigo, R.; Mashig, E.; Frank, D.; Wilson, R.; Jacoby, G. Temperature variability over the past millennium inferred from Northwestern Alaska tree rings. Clim. Dynam. 2005, 24, 227–236. [Google Scholar] [CrossRef]
  44. Liu, Y.; Wang, C.Y.; Hao, W.J.; Song, H.M.; Cai, Q.F.; Tian, H.; Sun, B.; Linderholm, H.W. Tree-ring-based annual precipitation reconstruction in Kalaqin, Inner Mongolia for the last 238 years. Chin. Sci. Bull. 2011, 56, 2995–3002. [Google Scholar] [CrossRef] [Green Version]
  45. Opała, M.; Mendecki, M.J. An attempt to dendroclimatic reconstruction of winter temperature based on multispecies tree-ring widths and extreme years chronologies (example of Upper Silesia, Southern Poland). Theor. Appl. Climatol. 2014, 115, 73–89. [Google Scholar] [CrossRef]
  46. Wei, F.Y. Modern Climate Statistical Diagnosis and Prediction Technology; China Meteorological Press: Beijing, China, 2007. (In Chinese) [Google Scholar]
  47. Yuan, Y.J.; Zhang, T.W.; Wei, W.S.; Nievergelt, D.; Verstege, A.; Yu, S.L.; Zhang, R.B.; Esper, J. Development of tree-ring maximum latewood density chronologies for the western Tien Shan Mountains, China: Influence of detrending method and climate response. Dendrochronologia 2013, 31, 192–197. [Google Scholar] [CrossRef]
  48. Schweingruber, F.H.; Briffa, K.R.; Nogler, P. A tree-ring densitometric transect from Alaska to Labrador. Int. J. Biometeorol. 1993, 37, 151–169. [Google Scholar] [CrossRef]
  49. Wang, H.; Shao, X.M.; Jiang, Y.; Fang, X.Q.; Wu, S.H. The impacts of climate change on the radial growth of Pinus koraiensis along elevations of Changbai Mountain in northeastern China. For. Ecol. Manag. 2013, 289, 333–340. [Google Scholar] [CrossRef]
  50. Shi, Y.F.; Shen, Y.P.; Kang, E.S.; Li, D.L.; Ding, Y.J.; Zhang, G.W.; Hu, R.J. Recent and future climate change in northwest China. Clim. Chang. 2007, 80, 379–393. [Google Scholar] [CrossRef]
  51. Cook, E.R. A Time-Series Analysis Approach to Tree-Ring Standardization. Ph.D. Thesis, The University of Arizona, Tucson, AZ, USA, 1985. [Google Scholar]
  52. Li, J.B.; Gou, X.H.; Cook, E.R.; Chen, F.H. Tree-ring based drought reconstruction for the central Tien Shan area in northwest China. Geophys. Res. Lett. 2006, 33, L07715. [Google Scholar] [CrossRef]
  53. Zhang, T.W.; Zhang, R.B.; Yuan, Y.J.; Gao, Y.Q.; Wei, W.S.; Diushen, M.; He, Q.; Shang, H.M.; Wang, J. Reconstructed precipitation on a centennial timescale from tree rings in the western Tien Shan Mountains, Central Asia. Quat. Int. 2015, 358, 58–67. [Google Scholar] [CrossRef]
  54. Jiao, L.; Jiang, Y.; Wang, M.; Zhang, W.; Zhang, Y. Age-effect radial growth responses of Picea schrenkiana to climate change in the eastern Tianshan Mountains, Northwest China. Forests 2017, 8, 294. [Google Scholar] [CrossRef]
  55. Wilson, R.; D’Arrigo, R.; Buckley, B.; Büntgen, U.; Esper, J.; Frank, D.; Luckman, B.; Payette, S.; Vose, R.; Youngblut, D. A matter of divergence: Tracking recent warming at hemispheric scales using tree ring data. J. Geophys. Res. Atmos. 2007, 112, 107–114. [Google Scholar] [CrossRef]
  56. Sidorova, O.V.; Siegwolf, R.T.W.; Myglan, V.S.; Ovchinnikov, D.V.; Shishov, V.V.; Helle, G.; Loader, N.J.; Saurer, M. The application of tree-rings and stable isotopes for reconstructions of climate conditions in the Russian Altai. Clim. Chang. 2013, 120, 153–167. [Google Scholar] [CrossRef]
  57. Seim, A.; Tulyaganov, T.; Omurova, G.; Nikolyai, L.; Botman, E.; Linderholm, H.W. Dendroclimatological potential of three juniper species from the Turkestan range, northwestern Pamir-Alay Mountains, Uzbekistan. Trees-Struct. Funct. 2016, 30, 733–748. [Google Scholar] [CrossRef]
  58. Liang, E.; Shao, X.; Hu, Y.; Lin, J. Dendroclimatic evaluation of climate-growth relationships of Meyer spruce (Picea meyeri) on a sandy substrate in semi-arid grassland, north China. Trees-Struct. Funct. 2001, 15, 230–235. [Google Scholar] [CrossRef]
  59. Gou, X.; Gao, L.; Deng, Y.; Chen, F.; Yang, M.; Still, C. An 850-year tree-ring-based reconstruction of drought history in the western Qilian Mountains of northwestern China. Int. J. Climatol. 2015, 35, 3308–3319. [Google Scholar] [CrossRef]
  60. Fritts, H.C. Tree Rings and Climate; Academic Press, Inc. (London), Ltd.: New York, NY, USA, 1976. [Google Scholar]
  61. Liu, Y.; Shi, J.F.; Shishov, V.; Vaganov, E.; Yang, Y.K.; Cai, Q.F.; Sun, J.Y.; Wang, L.; Djanseitov, I. Reconstruction of May–July precipitation in the north Helan Mountain, Inner Mongolia since A.D. 1726 from tree-ring late-wood widths. Chin. Sci. Bull. 2004, 49, 405–409. [Google Scholar] [CrossRef]
  62. Yu, D.; Wang, G.G.; Dai, L.; Wang, Q. Dendroclimatic analysis of Betula ermanii forests at their upper limit of distribution in Changbai Mountain, Northeast China. For. Ecol. Manag. 2007, 240, 105–113. [Google Scholar] [CrossRef]
  63. Dittmar, C.; Zech, W.; Elling, W. Growth variations of Common beech (Fagus sylvatica L.) under different climatic and environmental conditions in Europe—A dendroecological study. For. Ecol. Manag. 2003, 173, 63–78. [Google Scholar] [CrossRef]
  64. Affolter, P.; Büntgen, U.; Esper, J.; Rigling, A.; Weber, P.; Luterbacher, J.; Frank, D. Inner Alpine conifer response to 20th century drought swings. Eur. J. For. Res. 2009, 129, 289–298. [Google Scholar] [CrossRef] [Green Version]
  65. Brookhouse, M.T.; Bi, H. Elevation-dependent climate sensitivity in Eucalyptus pauciflora Sieb. ex Spreng. Trees-Struct. Funct. 2009, 23, 1309–1320. [Google Scholar] [CrossRef]
  66. Lo, Y.-H.; Blanco, J.A.; Seely, B.; Welham, C.; Kimmins, J.P. (Hamish). Relationships between climate and tree radial growth in interior British Columbia, Canada. For. Ecol. Manag. 2010, 259, 932–942. [Google Scholar] [CrossRef]
  67. Kienast, F.; Schweingruber, F.H.; Bräker, O.U.; Schär, E. Tree-ring studies on conifers along ecological gradients and the potential of single-year analyses. Can. J. For. Res. 1987, 17, 683–696. [Google Scholar] [CrossRef]
  68. Grace, J.; Norton, D.A. Climate and growth of Pinus Sylvestris at its upper altitudinal limit in Scotland: Evidence from tree growth-rings. J. Ecol. 1990, 78, 601–610. [Google Scholar] [CrossRef]
  69. Jacoby, G.C.; Lovelius, N.V.; Shumilov, O.I.; Raspopov, O.M.; Karbainov, J.M.; Frank, D.C. Long-term temperature trends and tree growth in the Taymir region of northern Siberia. Quat. Res. 2000, 53, 312–318. [Google Scholar] [CrossRef]
  70. Büntgen, U.; Frank, D.; Trouet, V.; Esper, J. Diverse climate sensitivity of Mediterranean tree-ring width and density. Trees-Struct. Funct. 2009, 24, 261–273. [Google Scholar] [CrossRef] [Green Version]
  71. Shi, C.; Masson-Delmotte, V.; Daux, V.; Li, Z.; Zhang, Q.B. An unstable tree-growth response to climate in two 500 year chronologies, North Eastern Qinghai-Tibetan Plateau. Dendrochronologia 2010, 28, 225–237. [Google Scholar] [CrossRef]
  72. Yu, D.; Liu, J.; Lewis, B.J.; Zhou, L.; Zhou, W.; Fang, X.; Wei, Y.; Jiang, S.; Dai, L. Spatial variation and temporal instability in the climate–growth relationship of Korean pine in the Changbai Mountain region of Northeast China. For. Ecol. Manag. 2013, 300, 96–105. [Google Scholar] [CrossRef]
  73. Zhang, W.T.; Jiang, Y.; Wang, M.C.; Zhang, L.N.; Dong, M.Y.; Gou, Y.Y. Responses of radial growth to climate warming in Picea meyeri trees growing at different elevations on the southern slope of Luya Mountain. Chin. J. Plant. Ecol. 2013, 37, 1142–1152, (In Chinese, with English abstract). [Google Scholar] [CrossRef]
  74. Babushkina, E.; Belokopytova, L.; Zhirnova, D.; Barabantsova, A.; Vaganov, E. Divergent growth trends and climatic response of Picea obovata along elevational gradient in Western Sayan mountains, Siberia. J. Mt. Sci. 2018, 15, 2378–2397. [Google Scholar] [CrossRef]
  75. Jiao, L.; Jiang, Y.; Zhang, W.T.; Wang, M.C.; Zhang, L.N.; Zhao, S.D. Divergent responses to climate factors in the radial growth of Larix sibirica in the eastern Tianshan Mountains, northwest China. Trees-Struct. Funct. 2015, 29, 1673–1686. [Google Scholar] [CrossRef]
Figure 1. (A) Location of the study area. (B) Map of the study area. The area of the selected gridded climatic data (45°–46° N, 79°–81° E) is represented by the white dashed rectangle. (C) Sampling sites: Amanboktek (AMA) and Basika (BSK).
Atmosphere 10 00473 g001
Figure 2. Gridded climatic data for the study area during 1901–2016: (A) monthly and (B) annual mean temperature; (C) monthly and (D) annual precipitation. Dashed lines represent trends in climatic data.
Atmosphere 10 00473 g002
Figure 3. Results of Mann–Kendall tests for (A) annual mean temperature and (B) annual precipitation (1901–2016).
Atmosphere 10 00473 g003
Figure 4. Tree-ring chronologies (thin lines) with their sample depth (dashed lines). Thick lines represent EPS data: (A) AMA and (B) BSK.
Atmosphere 10 00473 g004
Figure 5. Pearson correlations between the tree-ring chronologies and climatic data (precipitation and mean temperature) in the periods 1962–1988 (blue bars), 1990–2016 (red bars), and 1962–2016 (black bars): (A) AMA and precipitation, (B) AMA and mean temperature, (C) BSK and precipitation, and (D) BSK and mean temperature.
Atmosphere 10 00473 g005
Figure 6. Comparison between simulated (red line) and calibrated (blue line) tree-ring chronologies in the original (A,C,E,G) and first difference (B,D,F,H) domains for two different periods 1962–1988 and 1990–2016.
Atmosphere 10 00473 g006
Table 1. Information of the two sampling sites in the Alatau Mountains, Central Asia.
Study AreaSite CodeLatitude (N)Longitude (E)Trees/CoresElevation (m)AspectSlopeMaximum Tree AgeThe Rate of Absent Rings (%)
Alatau MountainAMA45.26°80.08°28/50~2050N20°175 (1842–2016)0.246
BSK45.25°80.15°23/45~1450N20°161 (1856–2016)0.514
Table 2. Statistical characteristics of the two tree-ring chronologies for the common period 1900–1999.
StatisticAMABSK
Standard deviation (SD)0.1980.414
Mean sensitivity (MS)0.1800.379
First-order autocorrelation (AC1)0.3960.577
Interseries correlation (trees)0.4660.698
Interseries correlation (all series)0.4770.705
Mean within-tree correlation0.6950.771
Signal-to-noise ratio (SNR)13.68116.705
Expressed population signal (EPS)0.9320.944
The first principal component (PC#1)0.5190.749
First year EPS > 0.818801880
Table 3. Highest- and lowest-value years of tree-ring chronologies for the common period 1880–2016.
AMABSK
10 Highest-Value Years10 Lowest-Value Years10 HIGHEST-Value Years10 Lowest-Value Years
YearValueYearValueYearValueYearValue
18911.45920080.51119291.67820080.001
19241.45219450.60719091.65419850.137
19701.42119130.61419351.57320000.211
19931.31918850.62119701.55619970.226
19731.30719170.62518901.53619910.249
19941.29219140.63219521.51719270.249
18881.29119110.64519641.50219170.286
19501.28220000.67519601.47319770.304
19511.27519000.67819621.47319740.322
19231.2719270.69419931.46720140.334
Table 4. Differences in correlation coefficients for the two tree-ring chronologies and climatic data assessed by u test values.
BSKAMA
PrecipitationTemperaturePrecipitationTemperature
pJul.0.829−0.8930.05−0.196
pAgu.−0.132−0.3920.111−0.035
pSep.−1.0480.912−1.016−0.214
pOct.0.443−0.0461.1580.201
pNov.0.254−0.049−0.3750.996
pDec.0.7811.534−0.2830.71
January0.598−0.5170.643−0.843
February−2.455 *−0.457−1.613−0.131
March−1.0400.242−1.0191.144
April−0.9810.595−0.6221.584
May−0.6321.0460.1640.935
June−1.684−0.030−1.6200.282
July0.461−0.084−0.6130.317
August0.627−0.3531.0180.158
September−0.465−0.676−0.430−0.312
* Significant at p < 0.05.

