Article

Investigation of Aerosol Properties and Structures in Two Representative Meteorological Situations over the Vipava Valley Using Polarization Raman LiDAR

1
Center for Atmospheric Research, University of Nova Gorica, 5270 Nova Gorica, Slovenia
2
Department of Civil and Environmental Engineering, University of Iowa, Iowa City, IA 52242, USA
3
Jožef Stefan Institute, 1000 Ljubljana, Slovenia
4
Aerosol d.o.o., 1000 Ljubljana, Slovenia
*
Author to whom correspondence should be addressed.
Atmosphere 2019, 10(3), 128; https://doi.org/10.3390/atmos10030128
Submission received: 30 January 2019 / Revised: 1 March 2019 / Accepted: 5 March 2019 / Published: 8 March 2019
(This article belongs to the Special Issue Remote Sensing of Aerosols)

Abstract

:
Vipava valley in Slovenia is a representative hot-spot for complex mixtures of different aerosol types of both anthropogenic and natural origin. Aerosol loading distributions and optical properties were investigated using a two-wavelength polarization Raman LiDAR, which provided extinction coefficient, backscatter coefficient, depolarization ratio, backscatter Ångström exponent and LiDAR ratio profiles. Two different representative meteorological situations were investigated to explore the possibility of identifying aerosol types present in the valley. In the first case, we investigated the effect of strong downslope (Bora) wind on aerosol structures and characteristics. In addition to observing Kelvin–Helmholtz instability above the valley, at the height of the adjacent mountain ridge, we found new evidence for Bora-induced processes which inject soil dust aerosols into the free troposphere up to twice the height of the planetary boundary layer (PBL). In the second case, we investigated aerosol properties and distributions in stable weather conditions. From the observed stratified vertical aerosol structure and specific optical properties of different layers we identified predominant aerosol types in these layers.

1. Introduction

The Vipava valley, located in the southwestern part of Slovenia, about 30 km inlands from the Bay of Trieste in the Adriatic (Figure 1), represents a typical case of a complex Alpine terrain configuration. Due to the morphological structure of this region, characterized by a multitude of basin valleys surrounded by mountains, ventilation in these valleys is predominantly poor, which leads to the formation of strong vertical aerosol gradients in lower troposphere. In stable atmospheric conditions within the lower troposphere, especially in the winter, local emissions of anthropogenic aerosols (biomass burning and traffic) cause the Vipava valley to become a local air pollution hot-spot [1]. As a part of the Mediterranean region, the area is also frequently affected by long-range transport of Saharan dust from North Africa across the Mediterranean and the Adriatic Sea, as well as sea salt. The most important phenomenon in the region that ventilates the valleys are episodes of Bora [2], katabatic wind capable of inducing mixing particulate matter and trace gases from the surface into the free troposphere [3,4]. To monitor spatial loading distribution of different aerosol types and to understand the effects of various aerosol sources, experimental data with sufficiently high temporal and spatial resolution are needed. A variety of weather conditions with specific localized impacts on vertical mixing need to be investigated [5]. In comparison to air-based in situ measurements, high temporal and spatial resolution LiDAR measurements has proven to be very useful for identifying aerosol sources and transport mechanisms as well as the evolution of the PBL [6,7,8,9,10]. Although satellite-based global observation tools [11,12,13,14] could in principle be used, these measurements have considerable uncertainty and are available only in limited time slots, as satellites have typical revisit times of two weeks.
Aerosol optical properties, depending on aerosol size, shape and refractive index (for example LiDAR ratio and depolarization ratio) can however be reliably obtained using ground-based multiple wavelength polarization Raman LiDARs [15,16,17]. The investigation was therefore performed using a dedicated two-wavelength polarization Raman LiDAR system, developed for this study, which provided experimental data on aerosol optical properties not available in previous studies. The most important parameters that were used for aerosol identification are the particle depolarization ratio (PDR), available from the measurement of different polarizations of the back-scattered signal at 355 nm (PDR differs considerably for spherical particles such as water droplets or smoke soot and non-spherical particles such as ice crystals or mineral dust [15,18,19]), the backscatter Ångström exponent (BAE, related to aerosol size distribution [16,20,21,22]) and the LiDAR ratio (LR) between the backscattering and extinction coefficient (related to aerosol size distribution and their refractive index [17,23,24,25,26,27]). Aerosol identification was made using a combination of PDR, LR, and BAE [17,25,28,29,30,31]. The selection of the predominant aerosol type was additionally verified by in situ measurements and by modeling of backward airmass trajectories [32,33].
The aim of this paper is to reveal aerosol vertical structures and spatial distribution of specific aerosol types under two representative meteorological conditions for this region, during a Bora onset and in stable weather. In the first study of this kind in Slovenia, using a two-wavelength polarization Raman LiDAR as an aerosol identification tool, we attempted to reveal the properties and processes of aerosol vertical mixing induced by Bora, as well as investigate mixtures of different aerosol types of both anthropogenic and natural origin in the case of elevated aerosol concentrations in a local hot-spot location.

2. Methodology

The measurements took place between 31 August and 22 December 2017 at the Vipava valley floor, in the town of Ajdovščina (45.87 N, 13.90 E, 125 m a.s.l.), where the LiDAR system and a wind sensor were installed. Additionally, aerosol absorption coefficients were measured by an aethalometer at Otlica (951 m a.s.l., 5 km horizontally displaced from Ajdovščina), where the measuring site was located on the valley-side edge of the Trnovski gozd plateau (Figure 1). The purpose for setting up two measurement sites was to distinguish advected aerosols from local background, as well as to obtain information about aerosol vertical mixing. Radiosonde data from Rivolto (113 m a.s.l., about 67 km away from Ajdovščina) was also used. In total, we accumulated 192 h of LiDAR data in 32 days without precipitation or low clouds.

2.1. Lidar System

A two-wavelength polarization Raman LiDAR system developed at the University of Nova Gorica was used to simultaneously provide vertical profiles of aerosol backscatter coefficients at 355 nm and 1064 nm, LiDAR ratio at 355 nm, depolarization ratio at 355 nm and the backscatter Ångström exponent between 355 and 1064 nm. Combining this data facilitates improved detection of aerosol types, properties and origin.
In order be able to take data all-weather conditions, including operation during very strong winds, the LiDAR is deployed indoors and accessed the atmosphere through a rooftop UV transparent window. Two separate lasers with synchronized trigger were used to emit 355 nm (UV) and 1064 nm (IR) light. The ranges for the complete overlap between the field of view of the telescope and the divergence of the laser pulses were measured to be about 200 m for IR and about 300 m for the UV laser. Four separate backscattering channels (vibrational nitrogen Raman signal at 386.7 nm, two Mie-Rayleigh signals at 355 nm with different polarization planes and Mie-Rayleigh signal at 1064 nm) were used in this study. A half-wave plate was installed in front of the polarization channels to calibrate the volume depolarization ratio (VDR) using the so called ±45 method, and to correct the polarization plane offset [35]. Main components of the system are listed in Table 1. The configuration and optimization of the LiDAR system is described in detail in [36].

2.2. In Situ Measurements

The aerosol absorption coefficient and black carbon (BC) concentration were measured using an Magee Scientific aethalometer AE33 at Otlica. The device provides aerosol absorption coefficients at seven different wavelengths (370 nm, 470 nm, 520 nm, 590 nm, 660 nm, 880 nm and 950 nm) [37]. BC concentration is calculated based on the measurements of the rate of increase of light attenuation at the 880 nm wavelength with 1 min time resolution. The mass absorption cross section air of 7.77 m 2   g 1 at 880 nm and a multiple scattering parameter C = 1.57 were used to convert measurements of attenuation to BC mass concentration according to the supplement in [37].

2.3. Meteorological Data

Relevant vertical profiles of meteorological data (temperature, pressure, relative humidity, wind speed and direction) were obtained from two radiosonde launch stations closest to Ajdovščina, Ljubljana (50 km away) and Rivolto (67 km away). Both stations provide data on daily basis at 05:00 CET (Ljubljana) and between 00:00–01:00 (Rivolto). All the heights in radiosonde data were reprocessed to be relative to Ajdovščina. Despite moderate horizontal distance of both radiosonde sites from our measurement area, comparable results from the two indicate that atmospheric vertical structure in the free atmosphere above the Vipava valley, which is located between them, can be well described by the available radiosonde data [38,39]. Wind sensor (ultrasonic anemometer Vaisala WMT700) was co-located with the LiDAR and its data was used to select downslope wind cases. The HYSPLIT model [40] was used in its backward trajectory mode, setting the final point in time to the location of our LiDAR site. Backward trajectories were intended to suggest regions, in which lie the sources of the observed aerosol types. Backward airmass trajectories obtained from the HYSPLIT model [40] were used to identify long-range transport of airmasses into the Vipava valley region.

2.4. Data Processing

Aerosol backscatter coefficient profiles were extracted from IR and UV Mie-Rayleigh scattering signals using the Klett method [41,42]. Only data with signal-to-noise ratio more than 5 at least up to the reference height, which was above 5 km. In the nighttime, extinction and backscattering coefficient profiles at 355 nm were additionally retrieved from N 2 Raman signal and Mie-Rayleigh UV signal using the standard Raman method [43,44], which allowed us to determine the LiDAR ratio [27]. When available, backscatter coefficient profiles at 355 nm retrieved by Raman method were used in the subsequent atmospheric studies. While other methods to calculate the VDR exist [35], we selected the method used in [45] to be able to compare our results to previous measurements and to classify the aerosols we observed into established aerosol categories. The particle depolarization ratio (PDR) was separated from the VDR by evaluating the molecular backscatter coefficient using the properties of the standard atmosphere and radiosonde data [45]. The value of molecular depolarization ratio (MDR) depends on the temperature and the filter bandwidth in the corresponding detectors. The MDR in our system was taken to be between 0.007 and 0.008 for temperatures between 173 K and 273 K [46]. Backscatter related Ångström exponent (BAE) was calculated from the backscatter coefficients measured at 355 nm and 1064 nm. Small BAE values indicate large aerosol size, and zero is consistent with no wavelength dependence of scattering, which is true for particles much larger than either of the two wavelengths used. All LiDAR techniques used and their differences are reviewed in detail in [36].
The uncertainties of the retrieved atmospheric optical properties (backscatter coefficients, extinction coefficient, LiDAR ratio, Ångström exponent, depolarization ratio) were considered separately for each type of the investigated representative weather conditions. In the case of aerosol properties in Bora, which were studied during the day, only elastic scattering signals were available. Due to Bora-induced vertical mixing, mineral dust was identified to be the predominant aerosol type below 3 km and height dependence of dust LiDAR ratio was expected to be weak [45]. With the assumed LiDAR ratio for dust of 50 ± 10 sr, the uncertainty of the backscatter coefficients was taken to be 10% [22,47], and the uncertainty of the resulting backscatter Ångström exponent was taken to be 15%. In the case of stable atmosphere, where all LiDAR channels were available, main uncertainties arose from the assumption of the extinction Ångström exponent (5%) [27], the selection of the “aerosol-free” reference range value for signal normalization (5%) and the height dependent signal-to-noise level and applied smoothing (5%). Due to the use of a simultaneously available nearby radiosonde data the uncertainties of temperature and pressure profiles were neglected. The total uncertainty of the retrieved LiDAR ratio was thus assumed to be 10%. The uncertainty of the depolarization ratio was 20% after the calibration using the method described in [48,49].
The absorption Ångström exponent (AAE) for completely black spherical aerosols can be obtained from the absorption coefficients measured by an aethalometer. In our case, AAE was determined between 470 nm and 950 nm, which allowed for separation of primary aerosol sources from traffic and biomass burning [50]. BC aerosols were categorized based on the value of the AAE, where AAE 1 refers to pure traffic and AAE > 1.7 refers to pure biomass burning [50,51].

3. Results and Discussion

The retrieved remote sensing and in situ data was classified with respect to local wind conditions, which were previously categorized in a long-term statistical study of wind conditions in the valley [39]. In the 32 days, when both datasets were simultaneously available, two predominant categories were found. One category (29 days) refers to calm and stable atmospheric conditions, which are often accompanied by elevated aerosol concentrations within the valley and stratified atmospheric structure. To benefit from simultaneous measurements in all available LiDAR return channels, aerosol properties, and structures were studied during the night. The second (3 days) refers to Bora episodes, which are common in the Vipava valley. The case of Bora is characterized by strong and turbulent airflow close to the valley floor, and periodic structures can be found at the approximate height of the orographic barrier [39]. A typical case from each category was selected for detailed analysis.

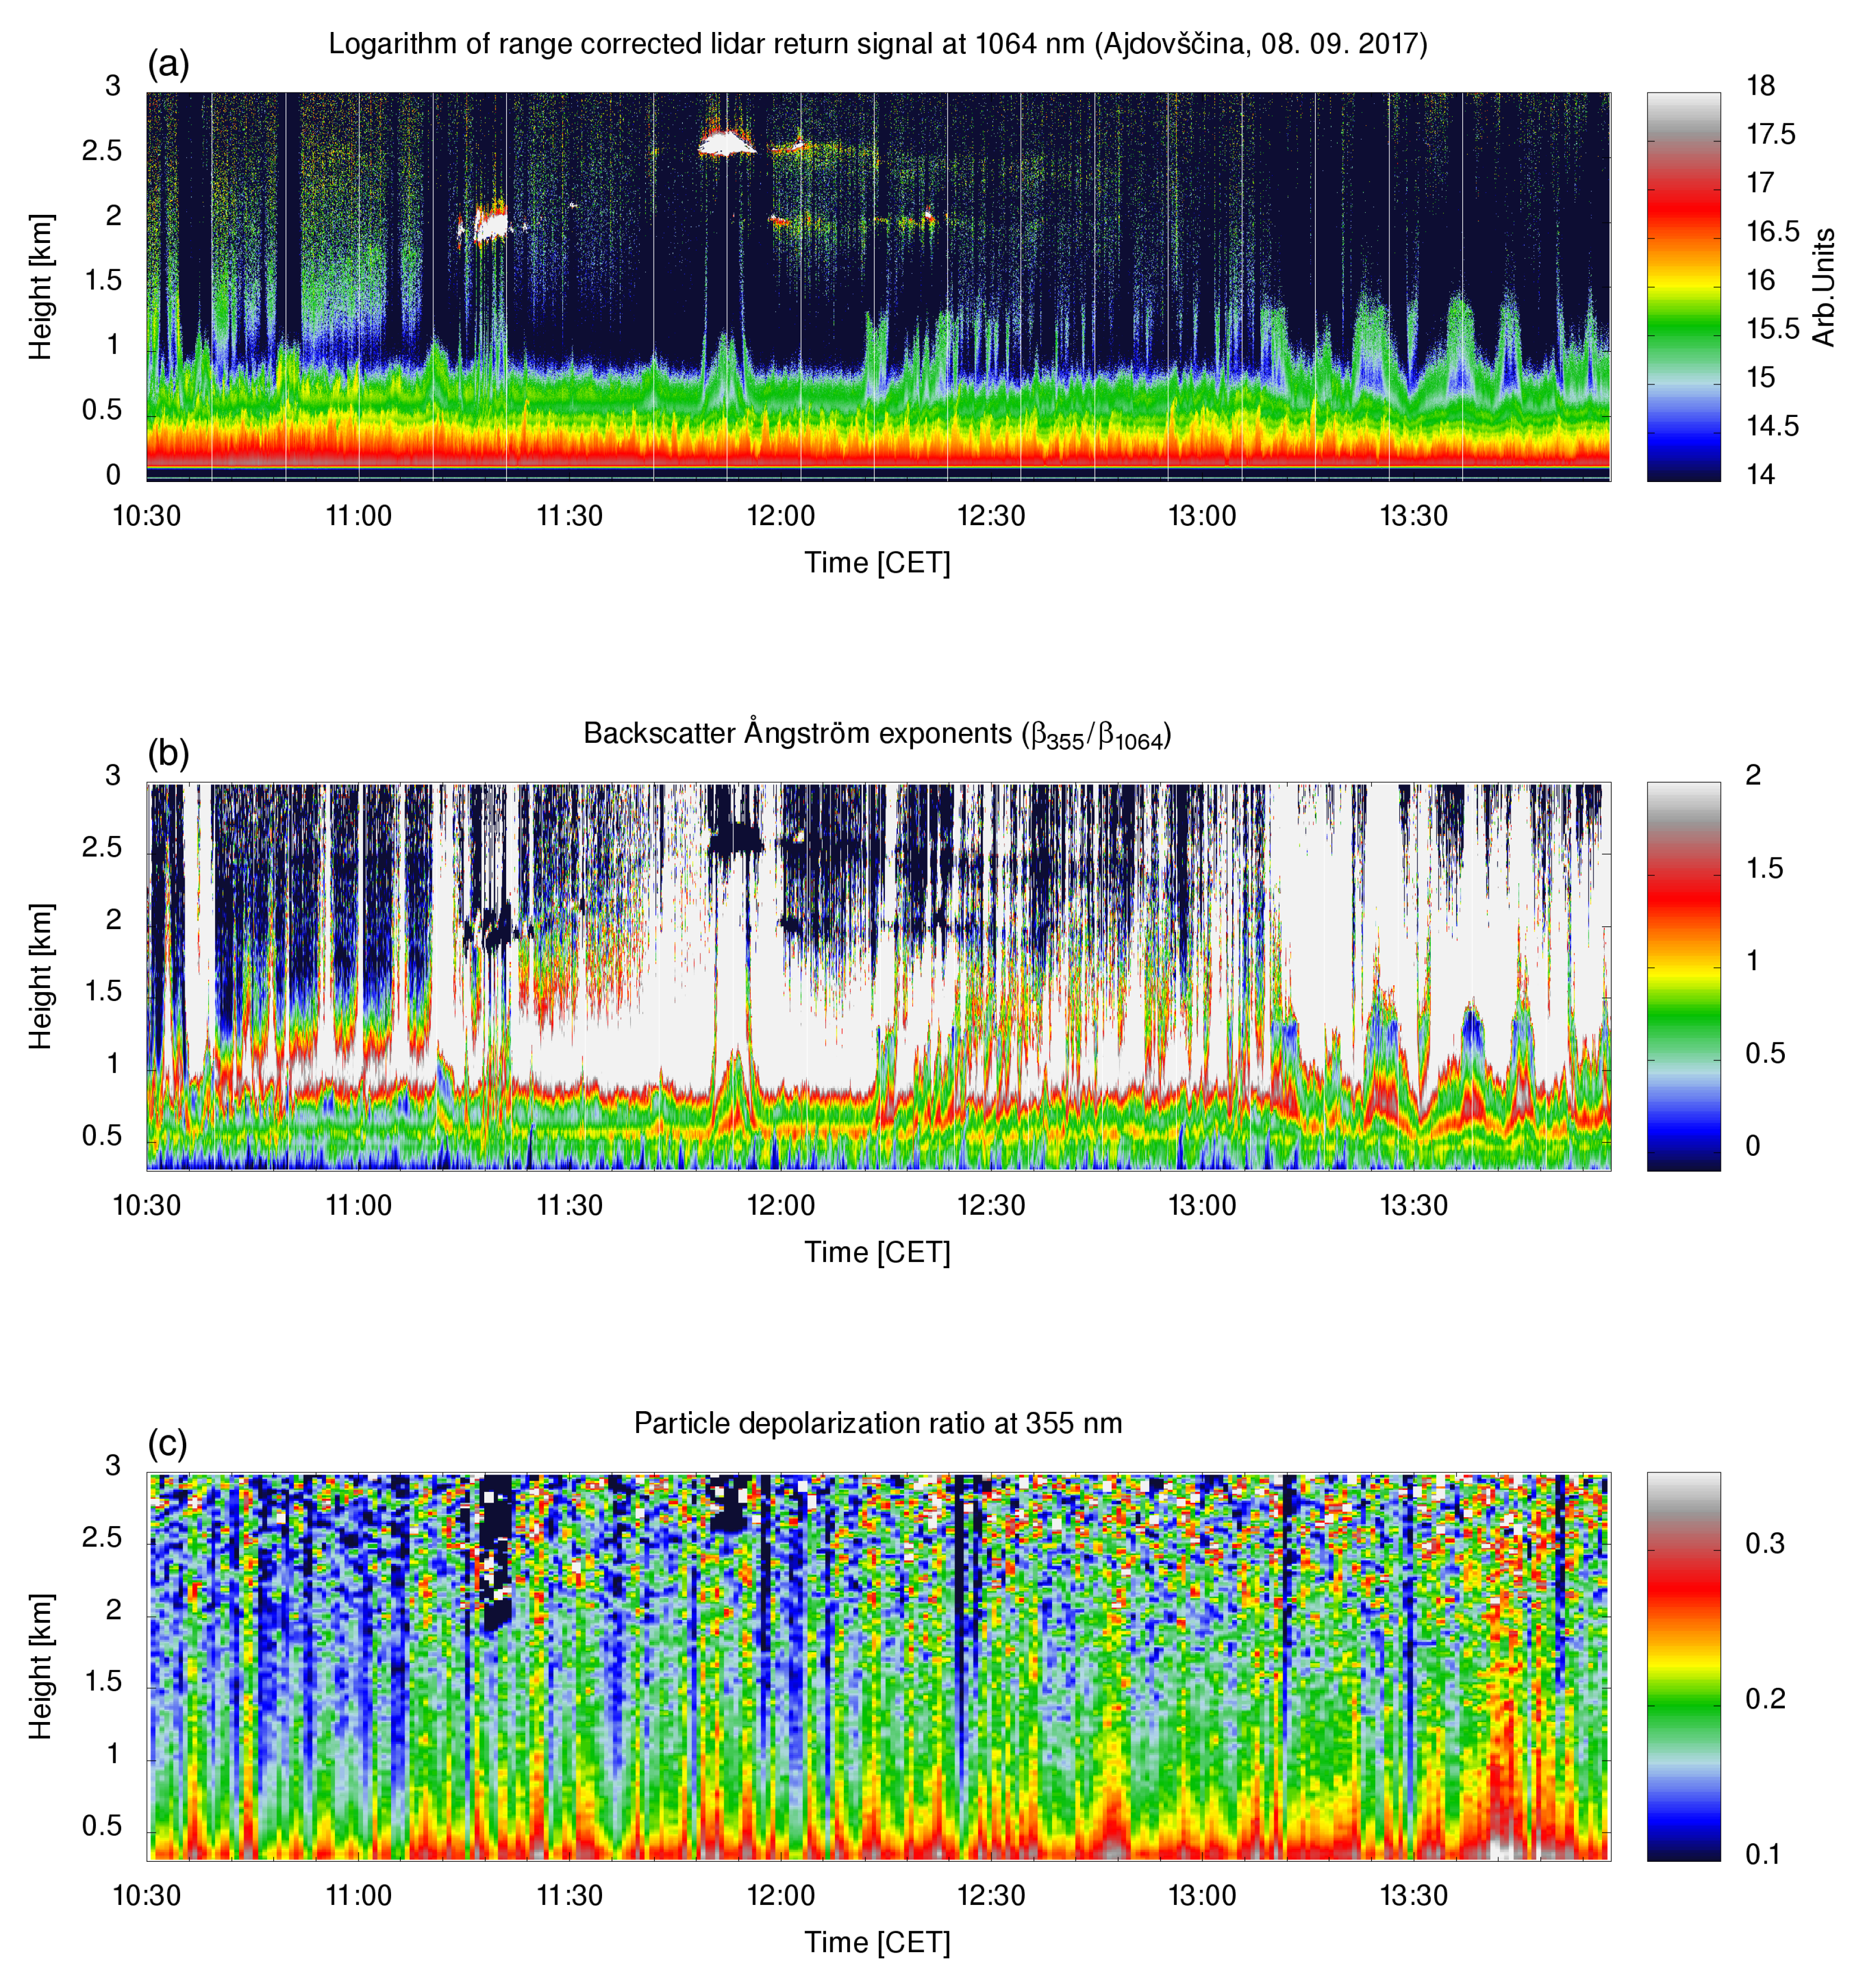
3.1. Aerosol Properties in Bora

Typical Bora conditions were present on 8 September 2017, with the downslope wind from the NE reaching peak velocities of about 16 m/s (Figure 1). Bora flow was accompanied by the presence of Kelvin–Helmholtz instability above the valley at the height of the barrier, as suggested by different ground (NE) and radiosonde (SW) wind directions above the barrier as well as by the periodicity of atmospheric structures retrieved by LiDAR (Figure 2). Due to differences in airmass density, wind speed and wind direction above and below the barrier, waves formed at the interface between the layers, pushing the denser air above the less dense air, leading to convective instability, wave breakdown and turbulence production [2]. The investigation of aerosol structures and properties above the valley is based on LiDAR data between 10:30 to 14:00 CET. As the measurements took place in the daytime, only elastic scattering data is available. The first occurrence of a large gradient in the IR LiDAR return signal was taken to correspond to the top of the PBL, which was in this case at about 1 km above the surface. Using aerosols as tracers, carried by the airmasses, elastic scattering information also provides insight into airflow properties, such as circulations that lift particles or trace gases into the free troposphere [3]. These circulations can be seen as distinct aerosol peaks with short duration above the PBL, especially after 13:00 CET in Figure 2a. With time, aerosol peaks grew stronger and reached higher above the PBL. They appear in 5–10 min intervals, which may be due to the Kelvin–Helmholtz instability and other Bora properties. The BAE, related to the size distribution of aerosols (Figure 2b), indicates that relatively large particles enter the PBL from the surface (blue) and are being driven above the PBL in the observed aerosol peaks. The performance of the BAE and PDR retrieval was in this case checked also using the layer of scattered water clouds, present at heights between 2 and 3 km. The BAE values in the cloud (Figure 2b at 12:00 CET) are almost zero and are the lowest in the entire measurement. The same is true for PDR values of 0.1 in the cloud (Figure 2c), which are typical for water droplets [52]. Two to three times larger PDR values (between 0.2 and 0.25) found elsewhere indicate the presence of non-spherical particles (such as dust, picked up from the surface), which agrees with the observed small BAE values.

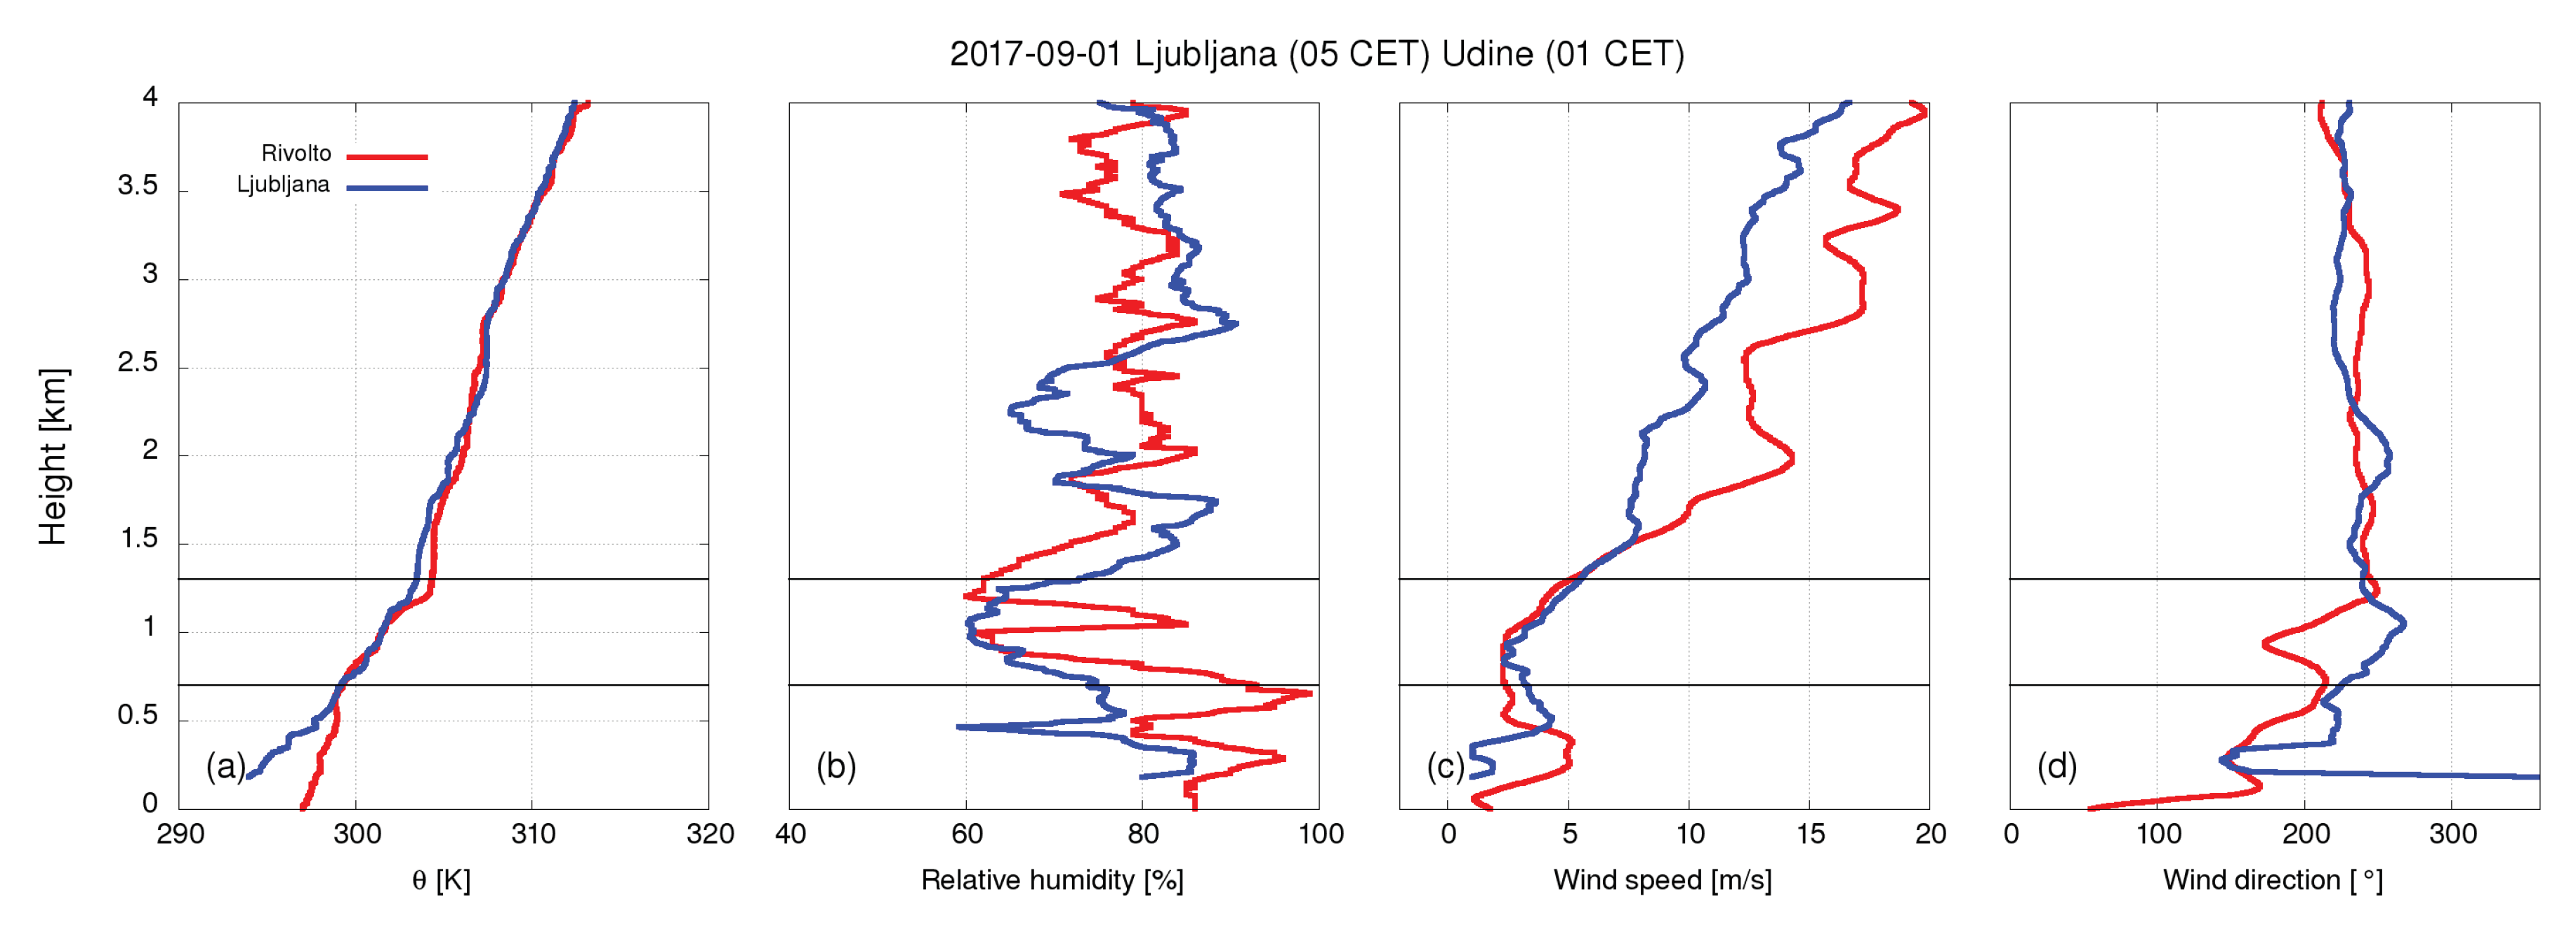
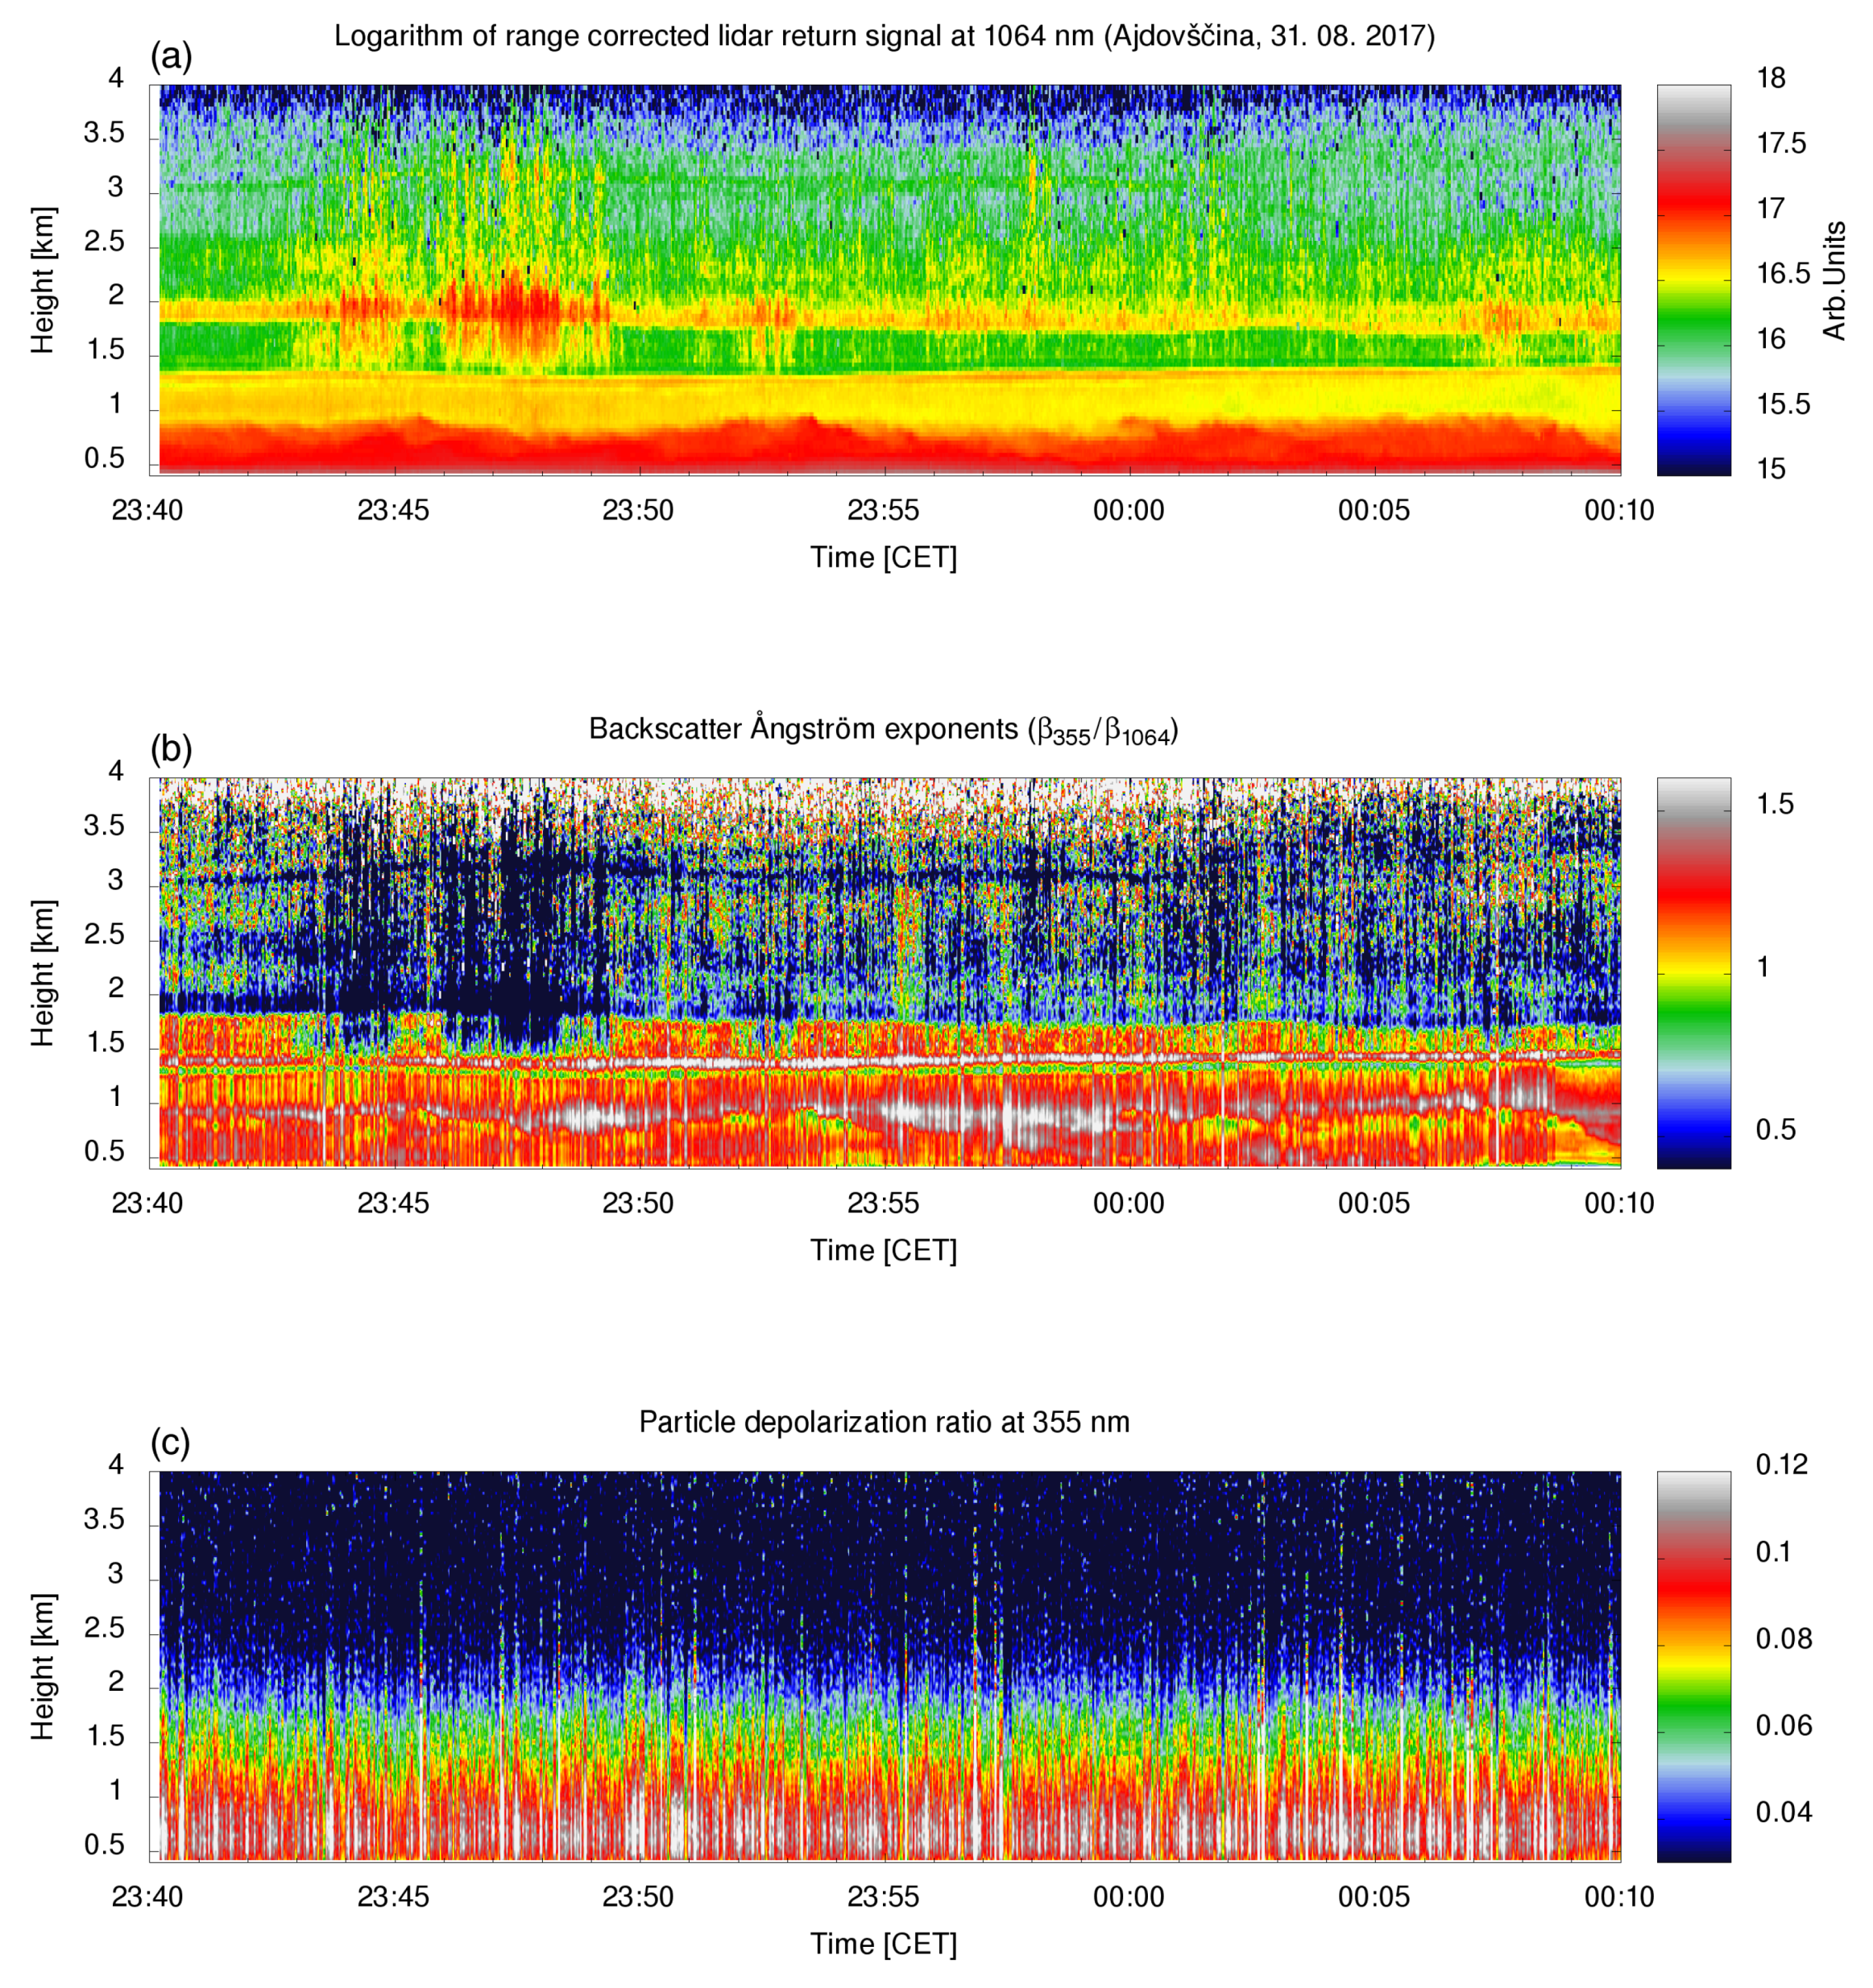
3.2. Aerosol Properties in Stable Atmosphere

Atmospheric stratification over complex terrain is common in stable weather conditions. As an example of the presence of different aerosol types from various sources, we present the conditions in a cloudless period of the night of 31 August 2017 between 23:40 CET and 00:10 CET on the next day. Presence of marine aerosols from the Adriatic and the Mediterranean was expected because of long-range aerosol transport, while local aerosols mainly originated from combustion emissions. Atmospheric stability was verified using the two radiosonde profiles (downstream profile at Ljubljana and upstream profile at Rivolto on 1 September 2017, Figure 3), which were found to be very similar. Increasing potential temperature with height indicates stably stratified conditions and the suppression of vertical air motion. SW wind above 1.4 km, obtained from radiosonde, indicates the arrival of airmasses from the Mediterranean, which carried marine aerosols. IR LiDAR return as well as the BAE and the PDR show distinct atmospheric stratification (Figure 4). The PBL is visible below 0.7 km, the residual layer (RL) between 0.7 km and 1.4 km and an elevated aerosol layer (EAL) above 1.4 km with peak aerosol concentration at about 2 km. The same stratification was observed in the radiosonde data as well, where the boundaries between the layers could be identified by large changes in the gradient of the relative humidity and potential temperature. In addition to lower relative humidity, the airmasses in the residual layer between 0.7 km and 1.4 km move in a different direction (Figure 3). This could cause some mixing at the top of PBL; however, it was inherently intermittent, so it did not influence the conditions in the PBL. Optical properties of the aerosols in each of the three layers were investigated based on the retrieved extinction coefficient, backscatter coefficients, depolarization ratio, BAE, and LR profiles (Figure 5). The backscatter coefficients (9 × 10 3 km 1 sr 1 at 355 nm and 8 × 10 3 km 1 sr 1 at 1064 nm) and the extinction coefficient (0.4 km 1 ) were found to be largest within the PBL. The values of the observables sensitive to aerosol characteristics (LR, PDR and BAE) were found to differ significantly between the layers (Table 2) and indicate the presence of different aerosol types.
Backscatter coefficients and the extinction coefficient were used for the estimation of aerosol loading, while LR, PDR, and BAE were used for the assessment of predominant aerosol types. The PDR was the most important parameter for the identification of long-range transport aerosols, which in the Mediterranean region often include mineral dust from Northern Africa. The predominant type of aerosols in each layer was assessed by comparing our LR, PDR, and BAE values to those from previous experiments (Table 2), where known aerosol sources were observed. The measured aerosol optical properties in the PBL correspond well to those from combustion. Due to atmospheric stability and absence of mineral dust in the PBL (PDR values were below 10%), the predominant source of aerosols was expected to be anthropogenic. Primary sources of these aerosols were determined based on in situ aethalometer measurements at Otlica. Increased AAE values during the night (when LiDAR measurements took place), reaching values of 1.6 after 21:00 CET, indicate predominant presence of biomass burning aerosols. Daytime AAE values are in contrast close to 1, which suggests that the predominant aerosol source in the PBL during the day was traffic. Daily evolution of BC concentration and AAE are shown in Figure 6 (right). Based on significantly (3 times) lower PDR and LR and 30% lower BAE, the predominant type of aerosols in the EAL was expected to be marine. This choice is supported by 48-h HYSPLIT backward airmass trajectories ending within the EAL, which were at heights well below 300 m above the Adriatic Sea (Figure 6, left), so they can be expected to carry sea-salt aerosols. The presence of well-mixed marine aerosols above 2 km is supported also by the radiosonde measurements. Relative humidity (Figure 3a), consistently exceeded 80%, and the modeled SW arrival direction agrees with the radiosonding wind data. In the RL, intermediate values of identification parameters suggest a mixture of biomass burning and marine aerosols.

4. Conclusions

Based on the remote sensing data, retrieved under two representative types of local weather conditions, we demonstrated that predominant aerosol types in specific atmospheric layers can be successfully identified using a combination of the information on aerosol optical properties and on vertical atmospheric structure. In the case of strong Bora, aerosol identification capability of the lidar system allowed us to make the first direct observation of the injection of dust aerosols from the ground into the free troposphere, as high as twice the PBL height. Vertical mixing, driven by turbulent Bora air-flows, is an important mechanism for long-range transport of local aerosols from the Vipava valley. The observed 5–10 min periodicity of aerosol peaks above the PBL may be related to atmospheric oscillations such as gravity waves or the Kelvin–Helmholtz instability, where the periodicity above the Vipava valley was found to be 2–12 min [4]. The obtained information on atmospheric structures may in the future be used to improve the representativeness of local-scale numerical airflow modeling during Bora episodes. In particular, the period of gravity waves or atmospheric structures indicating airmass motion may be used to evaluate model performance. In the case of stable atmospheric conditions and stratified atmosphere, predominant aerosols in the PBL were found to originate from local anthropogenic sources. The choice of predominant aerosol type was made based on other measurements of optical properties for well-known aerosol sources in Europe. The performance of the LiDAR-based aerosol identification was cross-checked using radiosonde data, BC measurements, and backward trajectory modeling. Long-range transport aerosols, such as the marine aerosols in the presented stable atmosphere case, appeared above the Vipava valley but did not significantly affect aerosol composition within the PBL. Results of the present study also indicate that systematic monitoring of aerosol characteristics retrievable from LiDAR data, in combination with weather information and in situ measurements of the properties of atmospheric particulate matter, could be used to investigate processes such as aerosol formation and aging mechanism and the extent of their vertical mixing, which would help to improve local air quality under unfavorable weather conditions.

Author Contributions

L.W., S.S. and W.E. contributed to LiDAR measurements, the discussion of the experiments, data analysis and manuscript preparation. G.M., L.D. and A.G. contributed to BC measurements and manuscript preparation.

Funding

This research was funded by the Slovenian Research Agency (grant number P1-0385) and Fulbright Scholar program.

Acknowledgments

We acknowledge the help of Aeronautica Militare, OSMER—ARPA FVG and Slovenian Environment Agency with sounding data from Rivolto and Ljubljana. Aethalometer instruments, used for black carbon measurements in this study were manufactured and provided by Aerosol d.o.o.

Conflicts of Interest

The authors declare no conflict of interest. At the time of the research, A.G., G.M. and L.D. were part time employed by Aerosol d.o.o., the manufacturer of the Aethalometer instruments, which were provided by them to measure black carbon in the study. Funding agencies or Aerosol d.o.o. had no role in the design of the study; in the collection, analyses, or interpretation of data; in the writing of the manuscript, and in the decision to publish the results.

References

  1. Wang, L.; Stanič, S.; Bergant, K.; Eichinger, W.; Močnik, G.; Drinovec, L.; Vaupotič, J.; Miler, M.; Gosar, M.; Gregorič, A. Retrieval of Vertical Mass Concentration Distributions—Vipava Valley Case Study. Remote Sens. 2019, 11, 106. [Google Scholar] [CrossRef]
  2. Šoljan, V.; Belušić, A.; Šarović, K.; Nimac, I.; Brzaj, S.; Suhin, J.; Belavić, M.; Večenaj, Ž.; Grisogono, B. Micro-Scale Properties of Different Bora Types. Atmosphere 2018, 9, 116. [Google Scholar] [CrossRef]
  3. Ding, K.; Liu, J.; Ding, A.; Liu, Q.; Zhao, T.; Shi, J.; Han, Y.; Wang, H.; Jiang, F. Uplifting of carbon monoxide from biomass burning and anthropogenic sources to the free troposphere in East Asia. Atmos. Chem. Phys. 2015, 15, 2843–2866. [Google Scholar] [CrossRef] [Green Version]
  4. Mole, M.; Wang, L.; Stanič, S.; Bergant, K.; Eichinger, W.; Ocaña, F.; Strajnar, B.; Škraba, P.; Vučković, M.; Willis, W. Lidar measurements of Bora wind effects on aerosol loading. J. Quant. Spectrosc. Radiat. Transf. 2017, 188, 39–45. [Google Scholar] [CrossRef]
  5. De Franceschi, M.; Zardi, D. Study of wintertime high pollution episodes during the Brenner-South ALPNAP measurement campaign. Meteorol. Atmos. Phys. 2009, 103, 237–250. [Google Scholar] [CrossRef]
  6. Sugimoto, N.; Huang, Z. Lidar methods for observing mineral dust. J. Meteorol. Res. 2014, 28, 173–184. [Google Scholar] [CrossRef]
  7. Stachlewska, I.; Samson, M.; Zawadzka, O.; Harenda, K.; Janicka, L.; Poczta, P.; Szczepanik, D.; Heese, B.; Wang, D.; Borek, K.; et al. Modification of local urban aerosol properties by long-range transport of biomass burning aerosol. Remote Sens. 2018, 10, 412. [Google Scholar] [CrossRef]
  8. Stachlewska, I.; Zawadzka, O.; Engelmann, R. Effect of Heat Wave Conditions on Aerosol Optical Properties Derived from Satellite and Ground-Based Remote Sensing over Poland. Remote Sens. 2017, 9, 1199. [Google Scholar] [CrossRef]
  9. Chazette, P.; Totems, J. Mini N2-Raman Lidar Onboard Ultra-Light Aircraft for Aerosol Measurements: Demonstration and Extrapolation. Remote Sens. 2017, 9, 1226. [Google Scholar] [CrossRef]
  10. Rosu, I.; Cazacu, M.; Prelipceanu, O.S.; Agop, M. A Turbulence-Oriented Approach to Retrieve Various Atmospheric Parameters Using Advanced Lidar Data Processing Techniques. Atmosphere 2019, 10, 38. [Google Scholar] [CrossRef]
  11. Prospero, J.; Ginoux, P.; Torres, O.; Nicholson, S.; Gill, T. Environmental characterization of global sources of atmospheric soil dust identified with the Nimbus 7 Total Ozone Mapping Spectrometer (TOMS) absorbing aerosol product. Rev. Geophys. 2002, 40, 1002. [Google Scholar] [CrossRef]
  12. Herman, J.; Bhartia, P.; Torres, O.; Hsu, C.; Seftor, C.; Celarier, E. Global distribution of UV-absorbing aerosols from Nimbus 7/TOMS data. J. Geophys. Res. Atmos. 1997, 102, 16911–16922. [Google Scholar] [CrossRef] [Green Version]
  13. Winker, D.; Hunt, W.; McGill, M. Initial performance assessment of CALIOP. Geophys. Res. Lett. 2007, 34. [Google Scholar] [CrossRef] [Green Version]
  14. Winker, D.; Vaughan, M.; Omar, A.; Hu, Y.; Powell, K.; Liu, Z.; Hunt, W.; Young, S. Overview of the CALIPSO mission and CALIOP data processing algorithms. J. Atmos. Ocean. Technol. 2009, 26, 2310–2323. [Google Scholar] [CrossRef]
  15. Sugimoto, N.; Lee, C. Characteristics of dust aerosols inferred from lidar depolarization measurements at two wavelengths. Appl. Opt. 2006, 45, 7468–7474. [Google Scholar] [CrossRef] [PubMed]
  16. Mona, L.; Amodeo, A.; D’Amico, G.; Giunta, A.; Madonna, F.; Pappalardo, G. Multi-wavelength Raman lidar observations of the Eyjafjallajökull volcanic cloud over Potenza, southern Italy. Atmos. Chem. Phys. 2012, 12, 2229–2244. [Google Scholar] [CrossRef] [Green Version]
  17. Müller, D.; Ansmann, A.; Mattis, I.; Tesche, M.; Wandinger, U.; Althausen, D.; Pisani, G. Aerosol-type-dependent lidar ratios observed with Raman lidar. J. Geophys. Res. Atmos. 2007, 112. [Google Scholar] [CrossRef] [Green Version]
  18. Sassen, K. The polarization lidar technique for cloud research: A review and current assessment. Bull. Am. Meteorol. Soc. 1991, 72, 1848–1866. [Google Scholar] [CrossRef]
  19. Weitkamp, C. Lidar: Range-Resolved Optical Remote Sensing of the Atmosphere; Springer Science & Business: Berlin, Germany, 2006; Volume 102. [Google Scholar]
  20. Althausen, D.; Müller, D.; Ansmann, A.; Wandinger, U.; Hube, H.; Clauder, E.; Zörner, S. Scanning 6-wavelength 11-channel aerosol lidar. J. Atmos. Ocean. Technol. 2000, 17, 1469–1482. [Google Scholar] [CrossRef]
  21. Papayannis, A.; Mamouri, R.; Amiridis, V.; Remoundaki, E.; Tsaknakis, G.; Kokkalis, P.; Veselovskii, I.; Kolgotin, A.; Nenes, A.; Fountoukis, C. Optical-microphysical properties of Saharan dust aerosols and composition relationship using a multi-wavelength Raman lidar, in situ sensors and modelling: A case study analysis. Atmos. Chem. Phys. 2012, 12, 4011–4032. [Google Scholar] [CrossRef]
  22. Lolli, S.; Welton, E.J.; Campbell, J.R. Evaluating light rain drop size estimates from multiwavelength micropulse lidar network profiling. J. Atmos. Ocean. Technol. 2013, 30, 2798–2807. [Google Scholar] [CrossRef]
  23. Cattrall, C.; Reagan, J.; Thome, K.; Dubovik, O. Variability of aerosol and spectral lidar and backscatter and extinction ratios of key aerosol types derived from selected Aerosol Robotic Network locations. J. Geophys. Res. Atmos. 2005, 110. [Google Scholar] [CrossRef] [Green Version]
  24. Alados-Arboledas, L.; Müller, D.; Guerrero-Rascado, J.; Navas-Guzmán, F.; Pérez-Ramírez, D.; Olmo, F. Optical and microphysical properties of fresh biomass burning aerosol retrieved by Raman lidar, and star-and sun-photometry. Geophys. Res. Lett. 2011, 38, L01807. [Google Scholar] [CrossRef]
  25. Groß, S.; Tesche, M.; Freudenthaler, V.; Toledano, C.; Wiegner, M.; Ansmann, A.; Althausen, D.; Seefeldner, M. Characterization of Saharan dust, marine aerosols and mixtures of biomass-burning aerosols and dust by means of multi-wavelength depolarization and Raman lidar measurements during SAMUM 2. Tellus B 2011, 63, 706–724. [Google Scholar] [CrossRef] [Green Version]
  26. Kanitz, T.; Ansmann, A.; Engelmann, R.; Althausen, D. North-south cross sections of the vertical aerosol distribution over the Atlantic Ocean from multiwavelength Raman/polarization lidar during Polarstern cruises. J. Geophys. Res. Atmos. 2013, 118, 2643–2655. [Google Scholar] [CrossRef] [PubMed] [Green Version]
  27. Lolli, S.; Madonna, F.; Rosoldi, M.; Campbell, J.R.; Welton, E.J.; Lewis, J.R.; Gu, Y.; Pappalardo, G. Impact of varying lidar measurement and data processing techniques in evaluating cirrus cloud and aerosol direct radiative effects. Atmos. Meas. Tech. 2018, 11, 1639–1651. [Google Scholar] [CrossRef] [Green Version]
  28. Qin, W.; Liu, Y.; Wang, L.; Lin, A.; Xia, X.; Che, H.; Bilal, M.; Zhang, M. Characteristic and driving factors of aerosol optical depth over mainland China during 1980–2017. Remote Sens. 2018, 10, 1064. [Google Scholar] [CrossRef]
  29. Ou, Y.; Zhao, W.; Wang, J.; Zhao, W.; Zhang, B. Characteristics of Aerosol Types in Beijing and the Associations with Air Pollution from 2004 to 2015. Remote Sens. 2017, 9, 898. [Google Scholar] [CrossRef]
  30. Dieudonné, E.; Chazette, P.; Marnas, F.; Totems, J.; Shang, X. Raman Lidar Observations of Aerosol Optical Properties in 11 Cities from France to Siberia. Remote Sens. 2017, 9, 978. [Google Scholar] [CrossRef]
  31. Groß, S.; Esselborn, M.; Weinzierl, B.; Wirth, M.; Fix, A.; Petzold, A. Aerosol classification by airborne high spectral resolution lidar observations. Atmos. Chem. Phys. 2013, 13, 2487–2505. [Google Scholar] [CrossRef] [Green Version]
  32. Zhou, T.; Xie, H.; Bi, J.; Huang, Z.; Huang, J.; Shi, J.; Zhang, B.; Zhang, W. Lidar Measurements of Dust Aerosols during Three Field Campaigns in 2010, 2011 and 2012 over Northwestern China. Atmosphere 2018, 9, 173. [Google Scholar] [CrossRef]
  33. Lolli, S.; Welton, E.J.; Benedetti, A.; Jones, L.; Suttie, M.; Wang, S. MPLNET lidar data assimilation in the ECMWF MACC-II Aerosol system: Evaluation of model performances at NCU lidar station. In Lidar Technologies, Techniques, and Measurements for Atmospheric Remote Sensing X; International Society for Optics and Photonics: Washington, DC, USA, 2014; Volume 9246, p. 92460I. [Google Scholar]
  34. Agency, S.E. Environmental Atlas of Slovenia. 2015. Available online: http://gis.arso.gov.si/atlasokolja (accessed on 30 January 2019).
  35. Di, H.; Hua, H.; Cui, Y.; Hua, D.; He, T.; Wang, Y.; Yan, Q. Vertical distribution of optical and microphysical properties of smog aerosols measured by multi-wavelength polarization lidar in Xi’an, China. J. Quant. Spectrosc. Radiat. Transf. 2017, 188, 28–38. [Google Scholar] [CrossRef]
  36. Wang, L. Study of Atmospheric Aerosol Properties in the Vipava Valley. Ph.D. Thesis, University of Nova Gorica, Nova Gorica, Slovenia, 2018. [Google Scholar]
  37. Drinovec, L.; Močnik, G.; Zotter, P.; Prévôt, A.; Ruckstuhl, C.; Coz, E.; Rupakheti, M.; Sciare, J.; Müller, T.; Wiedensohler, A.; et al. The “dual-spot” Aethalometer: An improved measurement of aerosol black carbon with real-time loading compensation. Atmos. Meas. Tech. 2015, 8, 1965. [Google Scholar] [CrossRef]
  38. Kitchen, M. Representativeness errors for radiosonde observations. Q. J. R. Meteorol. Soc. 1989, 115, 673–700. [Google Scholar] [CrossRef]
  39. Mole, M. Study of the Properties of Air Flow over Orographic Barrier. Ph.D. Thesis, University of Nova Gorica, Nova Gorica, Slovenia, 2017. [Google Scholar]
  40. Stein, A.; Draxler, R.; Rolph, G.; Stunder, J.; Cohen, M.; Ngan, F. NOAA’s HYSPLIT atmospheric transport and dispersion modeling system. Bull. Am. Meteorol. Soc. 2015, 96, 2059–2077. [Google Scholar] [CrossRef]
  41. Klett, J. Lidar calibration and extinction coefficients. Appl. Opt. 1983, 22, 514–515. [Google Scholar] [CrossRef] [PubMed]
  42. Fernald, F.G. Analysis of atmospheric lidar observations—Some comments. Appl. Opt. 1984, 23, 652–653. [Google Scholar] [CrossRef] [PubMed]
  43. Ansmann, A.; Riebesell, M.; Weitkamp, C. Measurement of atmospheric aerosol extinction profiles with a Raman lidar. Opt. Lett. 1990, 15, 746–748. [Google Scholar] [CrossRef] [PubMed]
  44. Whiteman, D.N. Examination of the traditional Raman lidar technique. II. Evaluating the ratios for water vapor and aerosols. Appl. Opt. 2003, 42, 2593–2608. [Google Scholar] [CrossRef] [PubMed]
  45. Tesche, M.; Ansmann, A.; Müller, D.; Althausen, D.; Engelmann, R.; Freudenthaler, V.; Groß, S. Vertically resolved separation of dust and smoke over Cape Verde using multiwavelength Raman and polarization lidars during Saharan Mineral Dust Experiment 2008. J. Geophys. Res. Atmos. 2009, 114. [Google Scholar] [CrossRef] [Green Version]
  46. Baars, H.; Ansmann, A.; Engelmann, R.; Althausen, D. Continuous monitoring of the boundary-layer top with lidar. Atmos. Chem. Phys. 2008, 8, 7281–7296. [Google Scholar] [CrossRef] [Green Version]
  47. Willis, W.B.; Eichinger, W.E.; Prueger, J.H.; Hapeman, C.J.; Li, H.; Buser, M.D.; Hatfield, J.L.; Wanjura, J.D.; Holt, G.A.; Torrents, A.; et al. Lidar method to estimate emission rates from extended sources. J. Atmos. Ocean. Technol. 2017, 34, 335–345. [Google Scholar] [CrossRef]
  48. Freudenthaler, V.; Esselborn, M.; Wiegner, M.; Heese, B.; Tesche, M.; Ansmann, A.; Müller, D.; Althausen, D.; Wirth, M.; Fix, A.; et al. Depolarization ratio profiling at several wavelengths in pure Saharan dust during SAMUM 2006. Tellus B 2009, 61, 165–179. [Google Scholar] [CrossRef] [Green Version]
  49. Engelmann, R.; Kanitz, T.; Baars, H.; Heese, B.; Althausen, D.; Skupin, A.; Wandinger, U.; Komppula, M.; Stachlewska, I.; Amiridis, V.; et al. The automated multiwavelength Raman polarization and water-vapor lidar PollyXT: The neXT generation. Atmos. Meas. Tech. 2016, 9, 1767–1784. [Google Scholar] [CrossRef]
  50. Sandradewi, J.; Prévôt, A.S.; Szidat, S.; Perron, N.; Alfarra, M.R.; Lanz, V.A.; Weingartner, E.; Baltensperger, U. Using aerosol light absorption measurements for the quantitative determination of wood burning and traffic emission contributions to particulate matter. Environ. Sci. Technol. 2008, 42, 3316–3323. [Google Scholar] [CrossRef] [PubMed]
  51. Zotter, P.; Herich, H.; Gysel, M.; El-Haddad, I.; Zhang, Y.; Močnik, G.; Hüglin, C.; Baltensperger, U.; Szidat, S.; Prévôt, A. Evaluation of the absorption Ångström exponents for traffic and wood burning in the Aethalometer-based source apportionment using radiocarbon measurements of ambient aerosol. Atmos. Chem. Phys. 2017, 17, 4229–4249. [Google Scholar] [CrossRef] [Green Version]
  52. Veselovskii, I.; Goloub, P.; Podvin, T.; Tanre, D.; Ansmann, A.; Korenskiy, M.; Borovoi, A.; Hu, Q.; Whiteman, D. Spectral dependence of backscattering coefficient of mixed phase clouds over West Africa measured with two-wavelength Raman polarization lidar: Features attributed to ice-crystals corner reflection. J. Quant. Spectrosc. Radiat. Transf. 2017, 202, 74–80. [Google Scholar] [CrossRef]
  53. Amiridis, V.; Balis, D.; Kazadzis, S.; Bais, A.; Giannakaki, E.; Papayannis, A.; Zerefos, C. Four-year aerosol observations with a Raman lidar at Thessaloniki, Greece, in the framework of European Aerosol Research Lidar Network (EARLINET). J. Geophys. Res. Atmos. 2005, 110. [Google Scholar] [CrossRef] [Green Version]
Figure 1. Terrain configuration of the Vipava valley [34] and its location in central Europe (inlay, licensed under https://creativecommons.org/licenses/by-sa/3.0 (CC BY-SA 3.0) by A. Mladenovic). Towards the Adriatic coast in the south-west, the valley (125 m above the sea level) is closed by the Karst plateau (up to 300 m a.s.l.), while to the north-east the terrain rises steeply to the Trnovski gozd plateau (up to 1200 m a.s.l.). Measurement sites, horizontally displaced by about 5 km, are marked by black points. The wind rose shows wind speed and direction distribution in Ajdovščina for the Bora outbreak on 8 September 2017. Predominant direction was NE, with speeds exceeding 16 m/s.
Atmosphere 10 00128 g001
Figure 2. Temporal variation of aerosol distribution over the Vipava valley during a Bora episode on 8 September 2017 from 10:30 to 14:00 CET. (a) Logarithm of range square corrected LiDAR return at 1064 nm (arbitrary units). (b) BAE based on the combination 355 nm and 1064 nm backscatter coefficients. (c) PDR. For all three figures the data was re-sampled to 18.75 m range resolution. The values are shown for heights within the complete LiDAR overlap range. The heights are relative to Ajdovščina.
Atmosphere 10 00128 g002
Figure 3. Radiosonde profiles from Ljubljana (blue) at 5:00 CET and Rivolto (red) at 1:00 CET on 1 September 2017. (a) Potential temperature ( θ ); (b) Relative humidity; (c) wind speed and (d) wind direction. Horizontal lines at 0.7 km and 1.4 km denote significant slope changes in the relative humidity, potential temperature, and wind speed profiles. The height is relative to Ajdovščina.
Atmosphere 10 00128 g003
Figure 4. Temporal variations of the IR LiDAR return (a), BAE (b) and PDR (c) in stable atmosphere conditions on 31 August 2017 between 23:40 CET and 00:10(+1) CET show stratified atmosphere with no apparent mixing between different layers. PBL was found to be below 0.7 km, the residual layer (RL) between 0.7 km and 1.4 km and an elevated aerosol layer (EAL) above 1.7 km with peak aerosol concentration at about 2 km. All data was re-sampled to 18.75 m range resolution. The values are shown for heights within the complete LiDAR overlap range. The heights are relative to Ajdovščina.
Atmosphere 10 00128 g004
Figure 5. Aerosol optical properties obtained from LiDAR data in stable atmosphere on 31 August 2017 at 23:40–00:10(+1) CET. (a) BS coefficients at 1064 nm (red) using Klett and at 355 nm (blue) using Raman method; (b) extinction coefficient at 355 nm; (c) VDR and PDR at 355 nm; (d) LR at 355 nm and (e) the BAE between 355 and 1064 nm. Error bars represent total uncertainty of each presented quantity. Horizontal lines (black and green) indicate the boundaries between different elevated aerosol layers.
Atmosphere 10 00128 g005
Figure 6. (a) HYSPLIT modeled 48 h airmass backward trajectories for Ajdovščina on 1 September 2017 at 00:00 CET (UTC+1). At higher altitudes (green), the trajectories mainly originated above the Mediterranean, while at lower altitudes (blue and red) they originated above the Adriatic. (b) Daily evolution of BC concentrations (red) and aerosol AAE (470/950) (blue) at Otlica on 31 August 2017. The data was sampled in one-minute intervals and averaged over 30 min. Error bars denote the averaging variance.
Atmosphere 10 00128 g006
Table 1. Main components of the custom-made polarization Raman-Mie LiDAR in Ajdovščina, which was the main device for the investigation of aerosol properties above the Vipava valley.
Transmitter
Quantel Q-Smart 450Nd:YAG (355 nm)
BigSky CFR UltraNd:YAG (1064 nm)
Receiver
Cassegrain telescopeDiameter 600 mm/Focal length 1800 mm
Borosilicate WindowSize 1 m 2 /Transmission >85%
Spectroscopic systemfilters/beam splitters/lenses
2 × Hamamatsu PMT H1949-50
Detectors 2 × Hamamatsu PMT H2341-50
1 × EG&G APD C30954/5E
Data acquisition
Transient recorder5 × Licel TR40-160
Range resolution3.75 m
Data storage and processingC++ code/ROOT (https://root.cern.ch/) under Linux
Table 2. Aerosols in the three observed atmospheric layers (PBL, RL and EAL) were characterized using observables sensitive to intrinsic aerosol properties. Particle depolarization ratio (PDR) and LiDAR ratio (LR) were obtained at 355 nm, while the backscatter Ångström exponent (BAE) was retrieved using both 355 nm and 1064 nm backscattering coefficients. Predominant aerosol type in each layer was chosen based on the values of aerosol optical properties of particular aerosol types, investigated in reference papers, listed in the last column.
LayerHeight [km]PDR [%]LR [sr]BAEAerosolsReference
PBL<0.79 ± 260 ± 50.9 ± 0.2combustion[24,25,26]
RL0.7–1.47 ± 235 ± 131.2 ± 0.2marine & biomass burning[17,23,31]
EAL1.4–3.53 ± 120 ± 30.7 ± 0.2marine[23,25,31,53]

