Article

Simulation of Miniature PDMA for Ultrafine-Particle Measurement

1
State Key Laboratory of Transducer Technology, Key Laboratory of Biomimetic Sensing and Advanced Robot Technology of Anhui Province, Institute of Intelligent Machines, Chinese Academy of Sciences, Hefei 230031, China
2
Science Island Branch of Graduate School, University of Science and Technology of China, Hefei 230026, China
3
Key Laboratory of Environmental Optics and Technology, Anhui Institute of Optics and Fine Mechanics, Chinese Academy of Sciences, Hefei 230031, China
4
Key Lab of Special Display Technology, Academy of Opto-Electronic Technology, Hefei University of Technology, Hefei 230009, China
5
Key Laboratory of Opto-Electronic Information Acquisition and Manipulation of Ministry of Education, Anhui University, Hefei 230601, China
*
Author to whom correspondence should be addressed.
Atmosphere 2019, 10(3), 116; https://doi.org/10.3390/atmos10030116
Submission received: 30 January 2019 / Revised: 25 February 2019 / Accepted: 27 February 2019 / Published: 4 March 2019

Abstract

:
The effect of the design and process parameters of a particle-classification zone on the sizing precision of a plate differential mobility analyzer (PDMA) was investigated by simulation software in this work. The design parameters consisted of the length, width, and height of the classification zone, and the process parameters could lead to height deviation and an uneven classification-zone wall. Prior to investigating the parameters, a comparison between experimental voltages and PDMA simulation results was applied to validate the simulation model. Thanks to velocity-field and particle-trajectory simulations, as well as experimental data from the former version of the PDMA, the dimensions of the classification zone and other key parameters were optimized. Our research shows that the dimensions of the classification zone influence the applied voltages and the measuring range of the PDMA, and range can be extended to 500 nm with low applied voltages after optimization. When the reasonable error range of the height is ±2% for the classification zone, the PDMA could basically achieve a classification role, and when it is ±1%, the PDMA has a better classifying effect.

1. Introduction

Haze is becoming one of the biggest issues for the vast majority of the world. It was reported that haze and other types of air pollution can invade our lungs and damage our brains [1]. Compared with large-size polluted-air particles, ultrafine particles (i.e., particles with diameters less than 100 nm), which have low mass concentration but high number concentration, are more harmful to human health [2,3]. Therefore, many researchers now pay more attention to number-concentration analysis for ultrafine particles [4,5]. Differential mobility analyzers (DMAs) have been the primary tool for characterizing fine and ultrafine aerosol particles in the atmosphere for a number of years [6,7]. Traditional DMAs are designed cylindrical for laboratory use, and are too large in volume to be suitable for outdoor, portable applications [7,8,9,10]. In contrast with cylindrical DMAs, PDMAs have higher resolution and a simpler manufacturing process, and there is almost no empty space inside them [11,12,13,14]. Alonso and Endo designed a PDMA with a very short particle-classification zone and high sheath flow rate to classify ions and large molecules, which proved the outstanding classification ability of PDMAs [15]. However, a higher sheath flow velocity requires a larger pump, which leads to huge volume.
A PDMA typically includes two inlets and two outlets for aerosol flow and sheath flow. Transfer function, which is the probability that particles exit PDMAs, is used to analyze PDMA performance. Many researchers have studied the transfer function and other types of PDMA performance. Rus, J. et al. discussed design criteria leading to high DMA, resolving power R and transmission efficiency η based on various DMA prototypes [16]. Liu and Chen implemented a small PDMA, similar in size to an iPhone 5 [10]. Liu and Chen focused on studying the design and performance of this small PDMA, and discussed its transfer function and other key factors to analyze performance.
In addition to using the experiment results to analyze PDAM performance, it is also very important to study its sizing precision by a simulation model, especially for those factors on which it is difficult to conduct experimental research. Steer et al. were devoted to modeling with Comsol Multiphysics Finite-Element software to select the suitable parameters for their PDMA, which measured particles in a size range from 6 to 400 nm [14]. The simulation model provided great help for the design of the PDMA. However, researchers often pay attention to the design but ignore the influence of the machining process on PDMA sizing precision. The machining process, especially the process of the two electrode plates inside a PDMA, has great influence on sizing precision, and it is also significant in future mass production. Regrettably, there is no systematic discussion on the PDMA modeling in Rus, J. et al. and Liu and Chen’s work, and there was no discussion on the influence of the machining process in Steer’s work. Few researchers have studied the process-parameter effects in detail.
Although transfer function and other types of PDMA performance have been studied in many papers, detailed guidelines for the machining-process parameters on how to influence PDMA performance, which is not easy to conduct only by experiments, have not yet been evaluated and reported. For some applications, this is also very important, especially when the designed PDMA will be commercially mass-produced, and quality control of the machining process is indispensable. In this work, Comsol was employed to investigate the effect of the design and process parameters of the particle-classification zone on PDMA sizing precision. Prior to parameter investigation, a comparison between the experimental voltages and simulation results of the PDMA was done to validate the simulation model. The design parameters consist of the length, width, and height of the classification zone. Moreover, as the machining process has great influence on PDMA sizing precision, process-parameter simulations were performed to analyze the effect on PDMAs. The reasonable error ranges of the classification-zone height were given in two different cases. The effect of the process parameters on PDMA sizing precision can guide future design and processing, and provides ideas when there are problems with performance, but the cause cannot be found.

2. PDMA Simulation Model

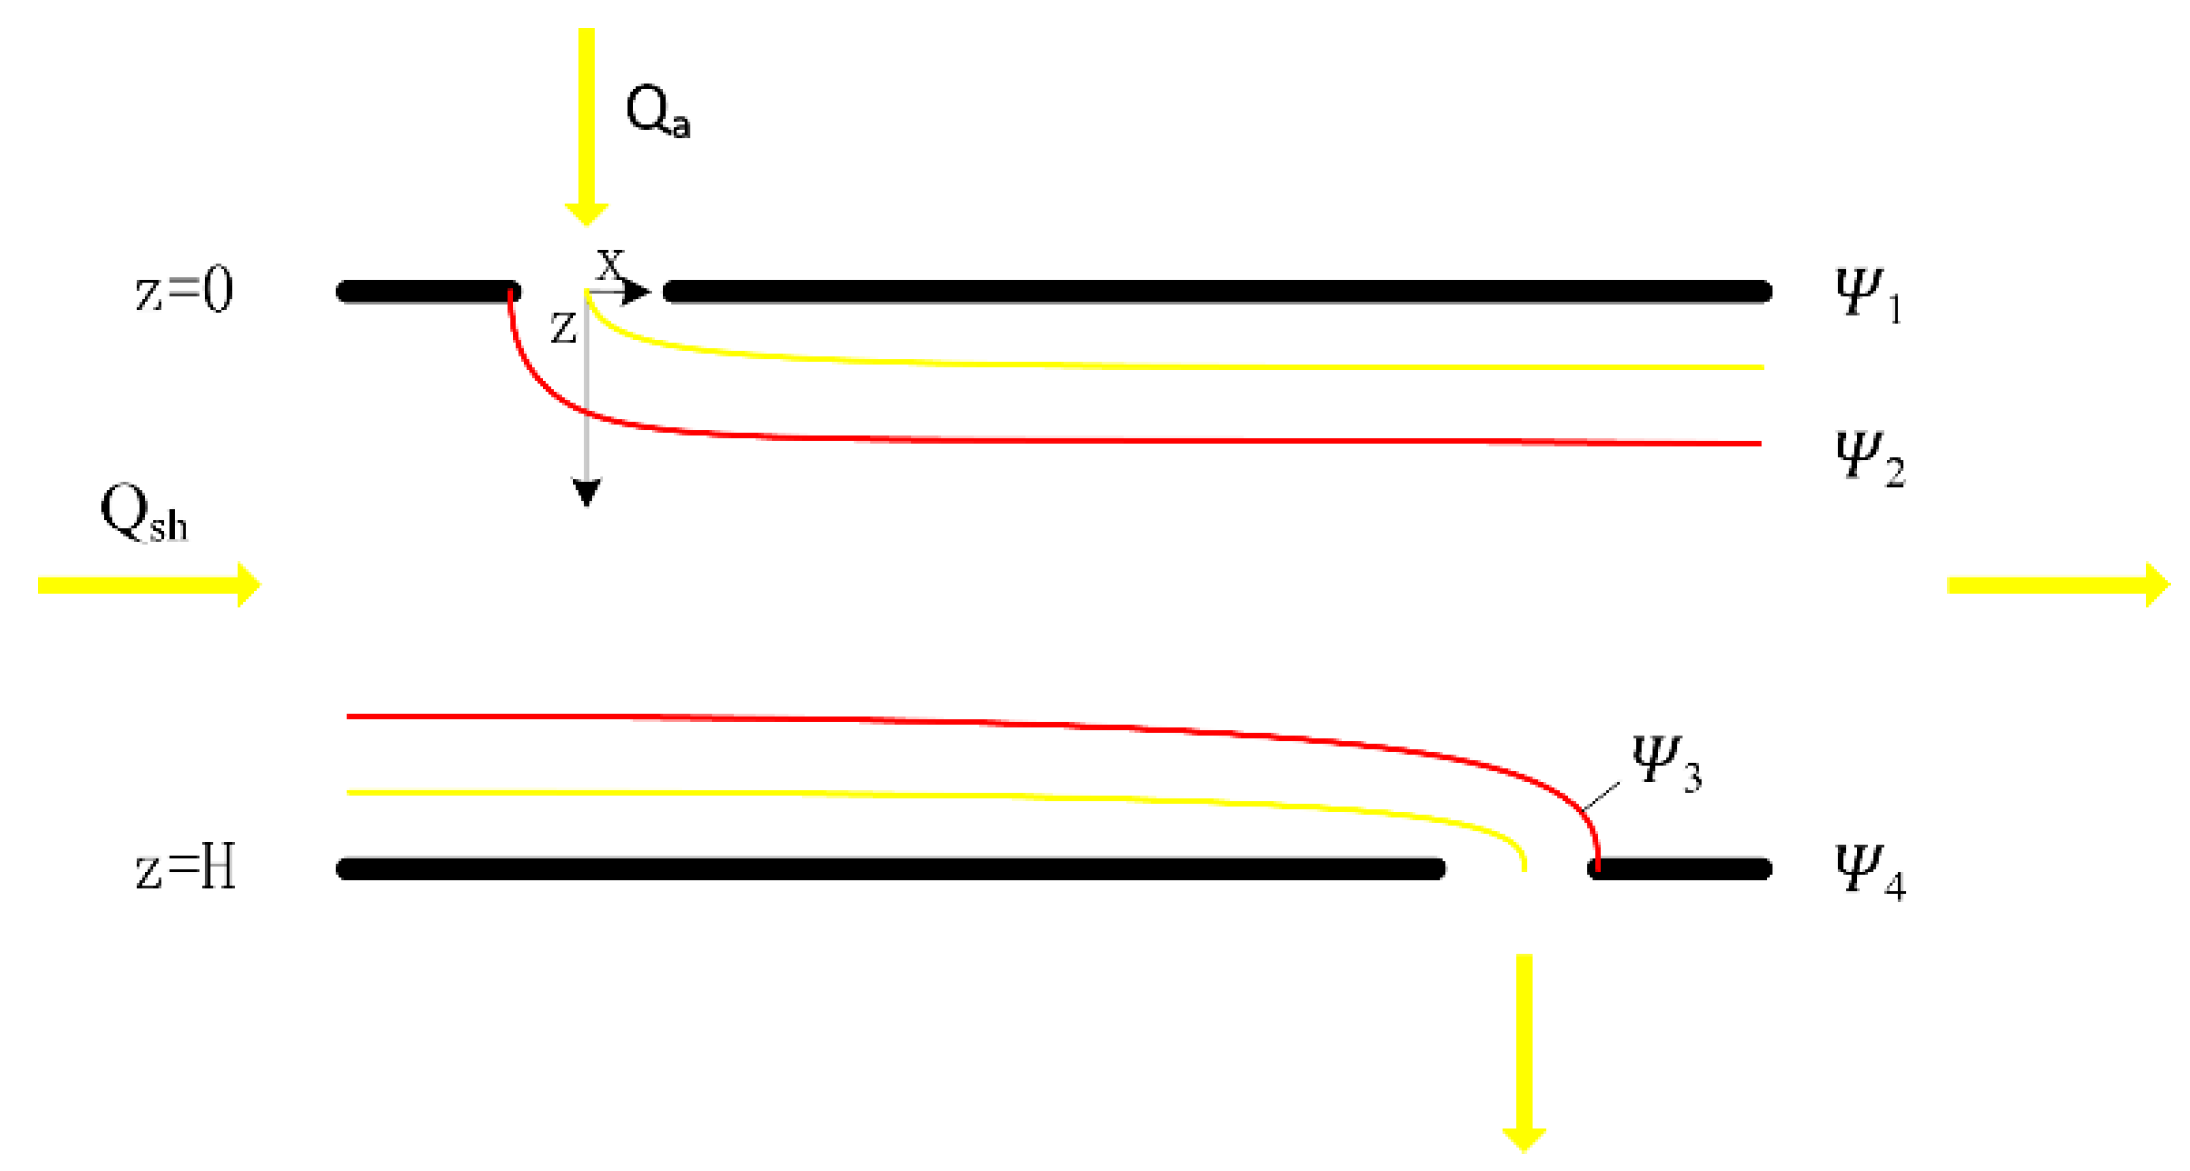
2.1. Working Principle

Figure 1 shows the streamlines inside the PDMA, where x and z represent the horizontal and vertical coordinates, respectively [17]. Sheath gas Q s h flows along the x-direction. Aerosol flow Q a meets the sheath gas in the slit at z = 0 m. The electric-field line is perpendicular to the mental plates. Particles of a specific size can be classified under the combined effect of the electric field and sheath gas.
The electrical mobility of charged particles is calculated as follows [18]:
Z P = n e C * 3 π μ D P
where Z P is the electrical mobility of a charged particle; n e is the particle charges; C * is the Cunningham correction factor; μ is the gas viscosity; D P is the particle size.
Assuming that particle inertia and diffusion effects are neglected, PDMA particle sizes and calculated voltages are as follows [19]:
D P = n e C * V W L 3 π μ H Q s h
V = 3 π μ Q s h D P H n e C * W L
where V is the calculated voltage,   W is the width of the classification zone, L is the distance between the aerosol entrance and exit slits (i.e., the length of the classification zone), H is the distance between the two parallel mental plates (i.e., the height of the classification zone), and Q s h is the sheath flow rate. It can be seen from Equation (3) that, when particle size is fixed, calculated voltage V   decreases as ratio of the classification zone H/WL decreases.
Figure 2 shows the three-dimensional graph and aerosol slits of the PDMA. The PDMA essentially includes two mental plates. Aerosol particles enter the PDMA from the buffer of a triangular-shaped flow channel. High DC voltage is applied to the electrode plates, which are separated by an insulating Teflon enclosure. The sheath gas flows into the PDMA from the left side and passes two laminar flowmeters, which are screen-type to make sheath gas evenly flow into and out of the PDMA. The width of the flowmeter is 8 mm, while the length and height of the flowmeter are the same as the classification zone.

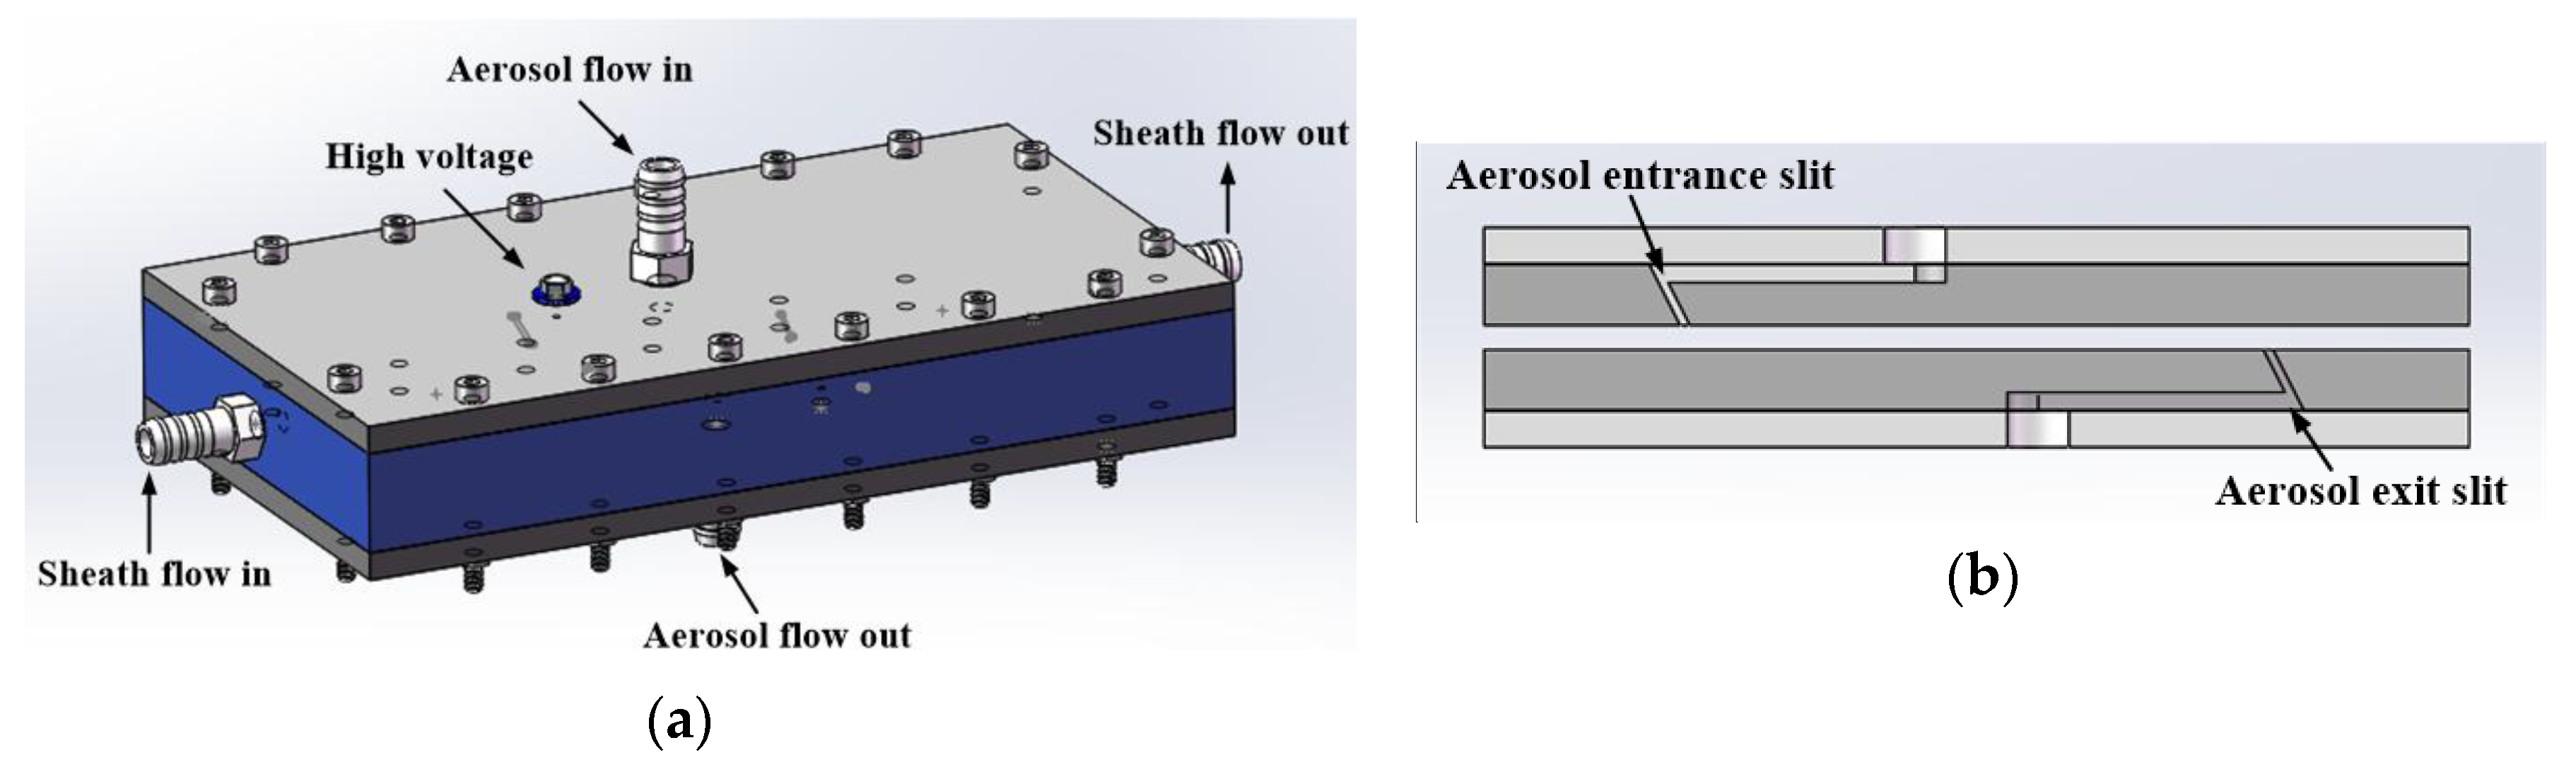
2.2. Simulation Model

In order to achieve the ideal classification effect for PDMAs, Comsol was used to model the velocity field for the sheath flow, and particle trajectories for the aerosol flow. The modeling can also help optimize the classification-zone dimensions and other key parameters, preparing theoretical knowledge for the PDMA.
Traditional cylindrical DMAs have a complex manufacturing process and large and empty internal space, while PDMAs have an easy manufacturing process and good space utilization, which means PDMAs are more suitable for portable applications. However, differing from the geometric shape of cylindrical DMAs, there are walls in PDMAs that have an effect on sheath-flow uniformity [14]. To analyze this problem, Comsol was employed to model the velocity field for the sheath flow. The rate of the sheath flow was set at 3 L·min−1. The governing equations of the velocity field conform to the Navier–Stokes equation [20]:
ρ ( u · ) u = · [ p I + μ ( u + ( u ) T ) ] + F ,
ρ · ( u ) = 0
where ρ is air density, u is the velocity vector, p is pressure, I is the unity tensor, μ is air dynamic viscosity, F is the force field, is a linear differential 3D operator, and T is the transposed matrix. Pressure at the outlet in the flow field is as follows:
[ p I + μ ( u + ( u ) T ) ] n = p 0 ^ n ,
p 0 ^ p 0
where p 0 is atmospheric pressure.
After entering the classification zone, particles move under the combined effect of the electric field and sheath gas. Only a drag force and electrical force were considered in the modeling. The drag force can be determined by the following governing equations [20]:
F d = 3 π μ D P C * ( u v )
where F d is the drag force, and u and v are particle velocity and air flow, respectively. The electrical force of the particle is as follows:
F e = e n E
where F e is the electrical force, e is the electric charge of the electron (i.e., 1.602 × 10⁻¹⁹ C), n is the charge amount of a particle, and E is electric-field intensity.

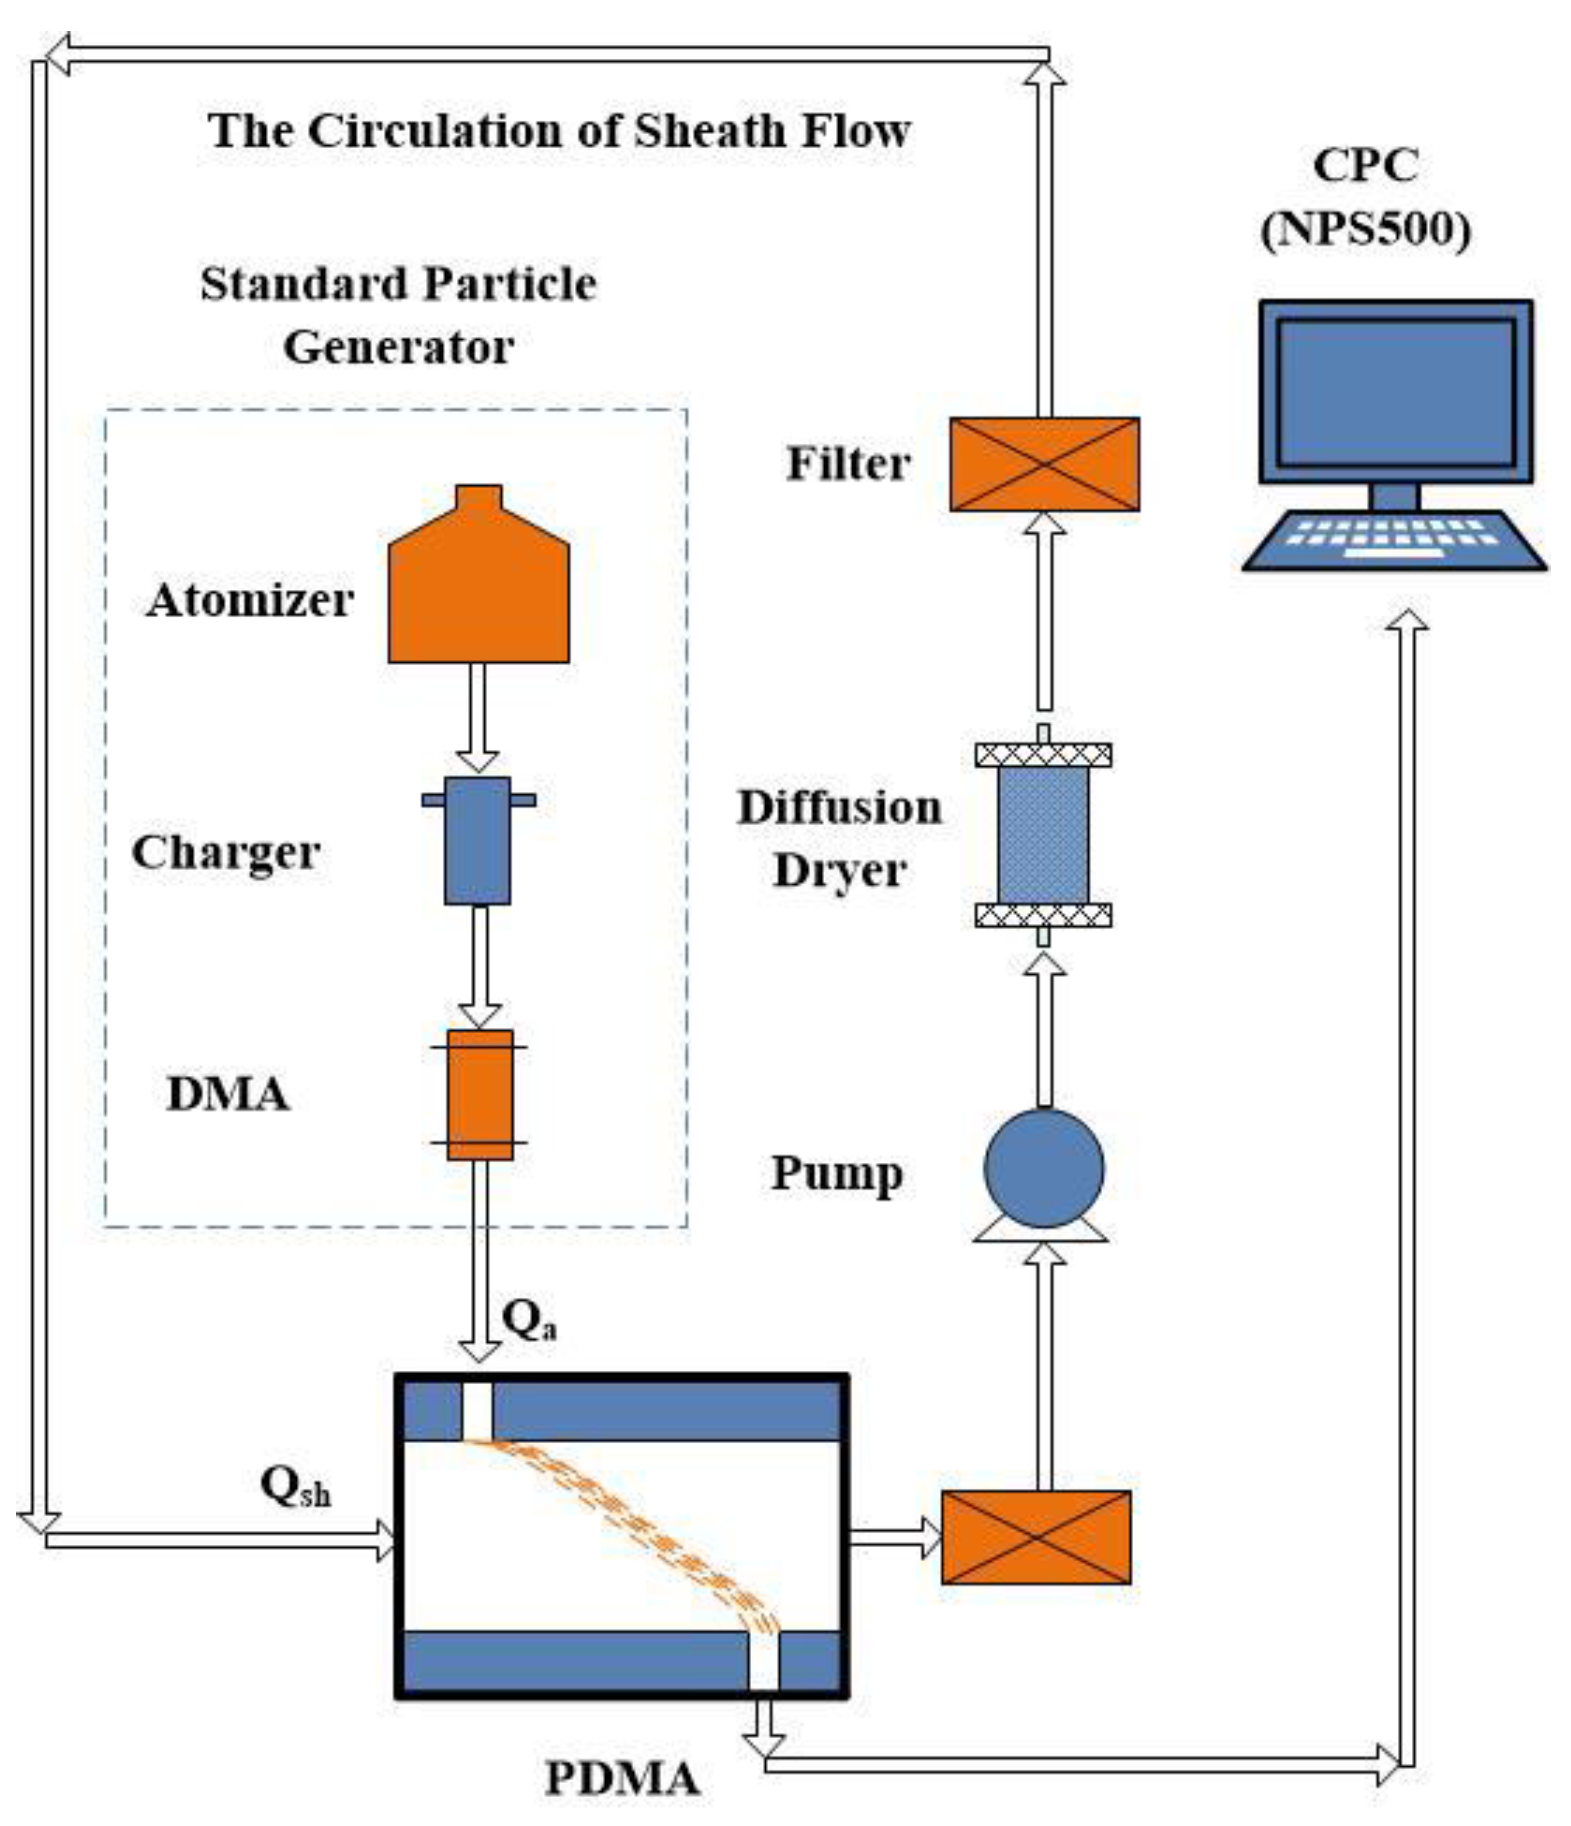
2.3. Validation Setup

The validation setup was constructed based on a standard particle generator (MSP model 7388L) and a condensation particle counter (CPC, ANCON model NPS500). Figure 3 shows the validation setup. The standard particle generator mixes ammonium sulfate particles with deionized water and atomizes them to obtain aerosol particles. The aerosol particles flow into the built-in charger of the generator for charging, and are then classified by the DMA inside the generator to generate monodisperse particles in selected sizes. A mass flowmeter is necessary to control the flow rate and uniformity of the aerosol flow before the PDMA. The sheath gas flows through two filters and a dryer to realize recycling use. A DC power-supply source is applied to produce high voltage. Particle-number concentration varied as the applied voltages changed. When the number concentration first reached the maximum and then decreased, the voltage corresponding to the maximum is the measured experimental voltage. As the goal was to verify the accuracy of the simulation model, the focus of the experiment was on voltage comparison rather than other performance aspects.

3. Results and Discussion

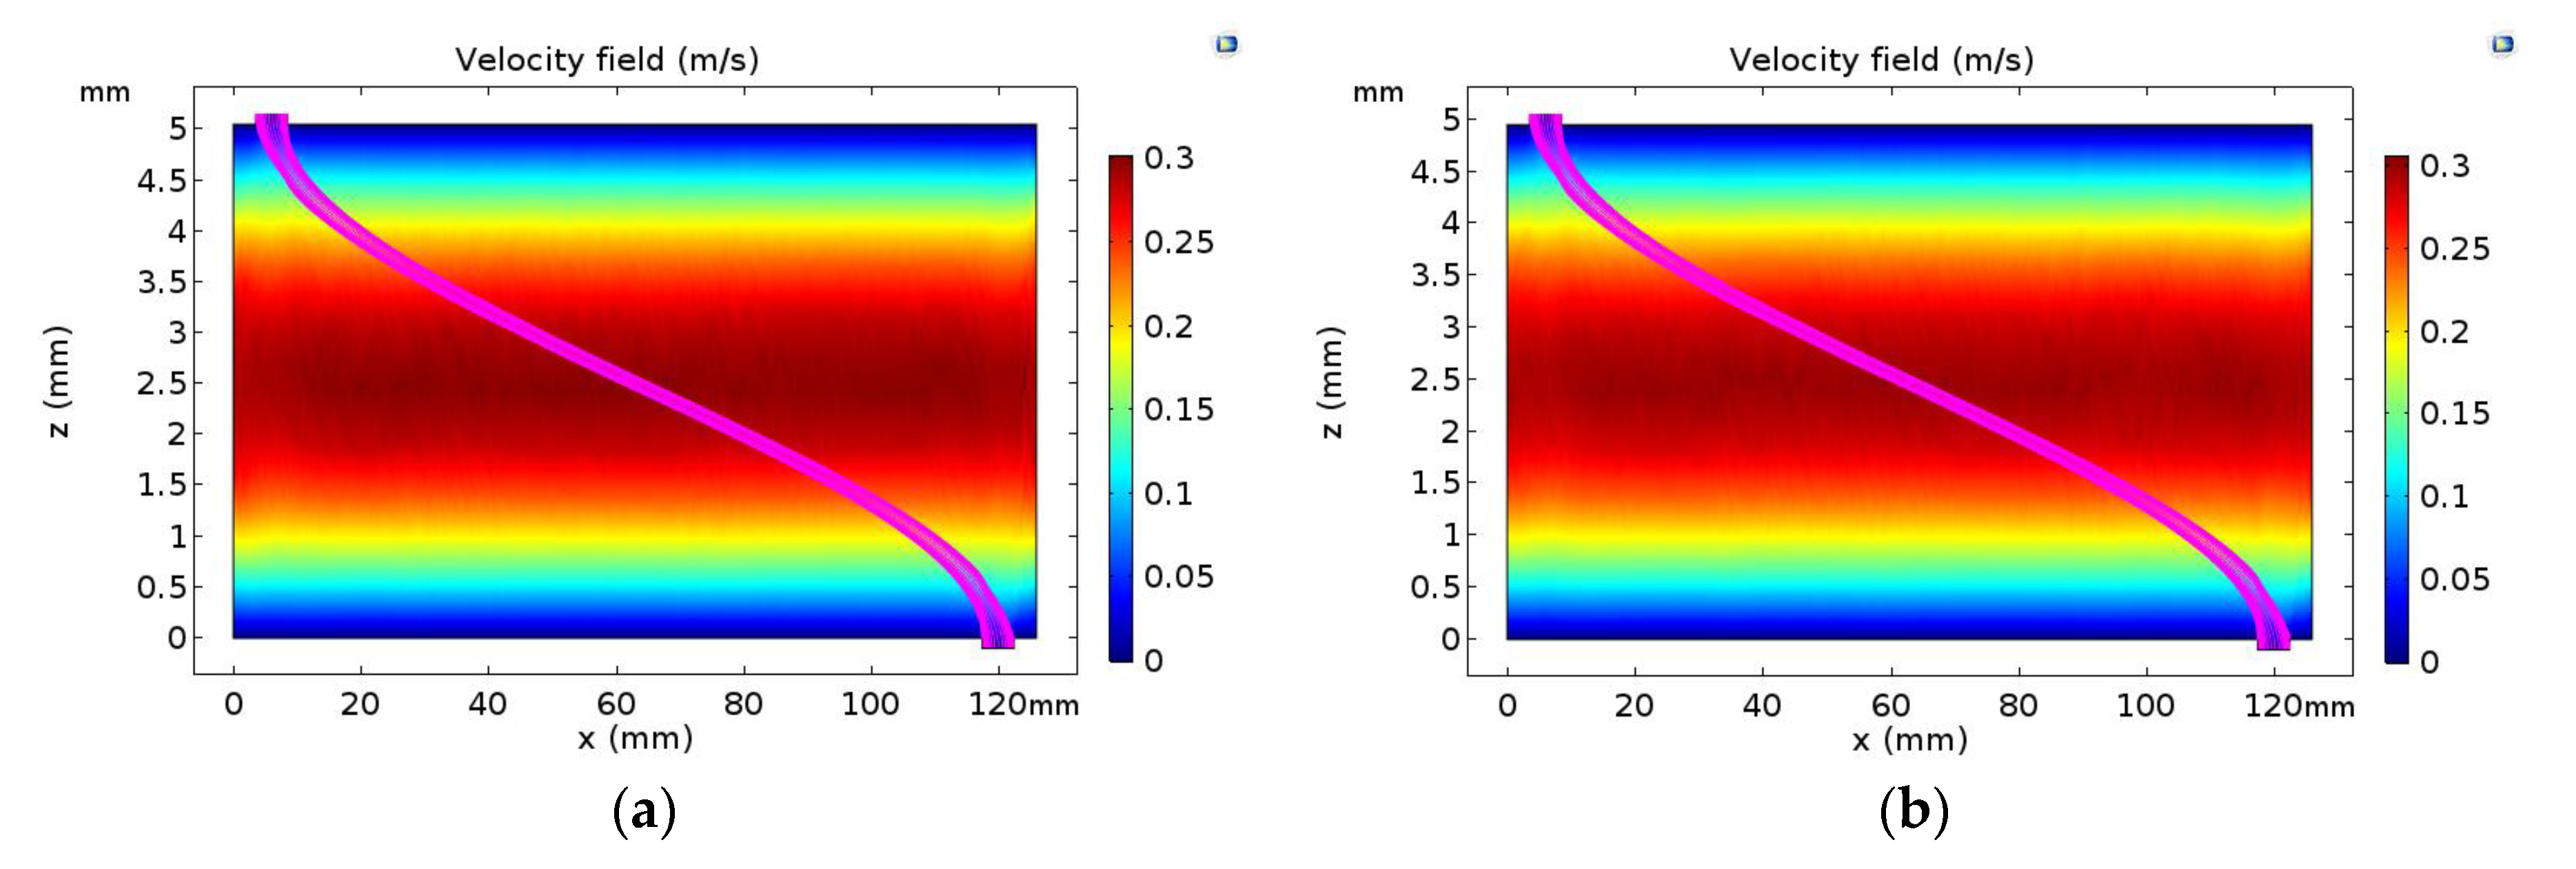
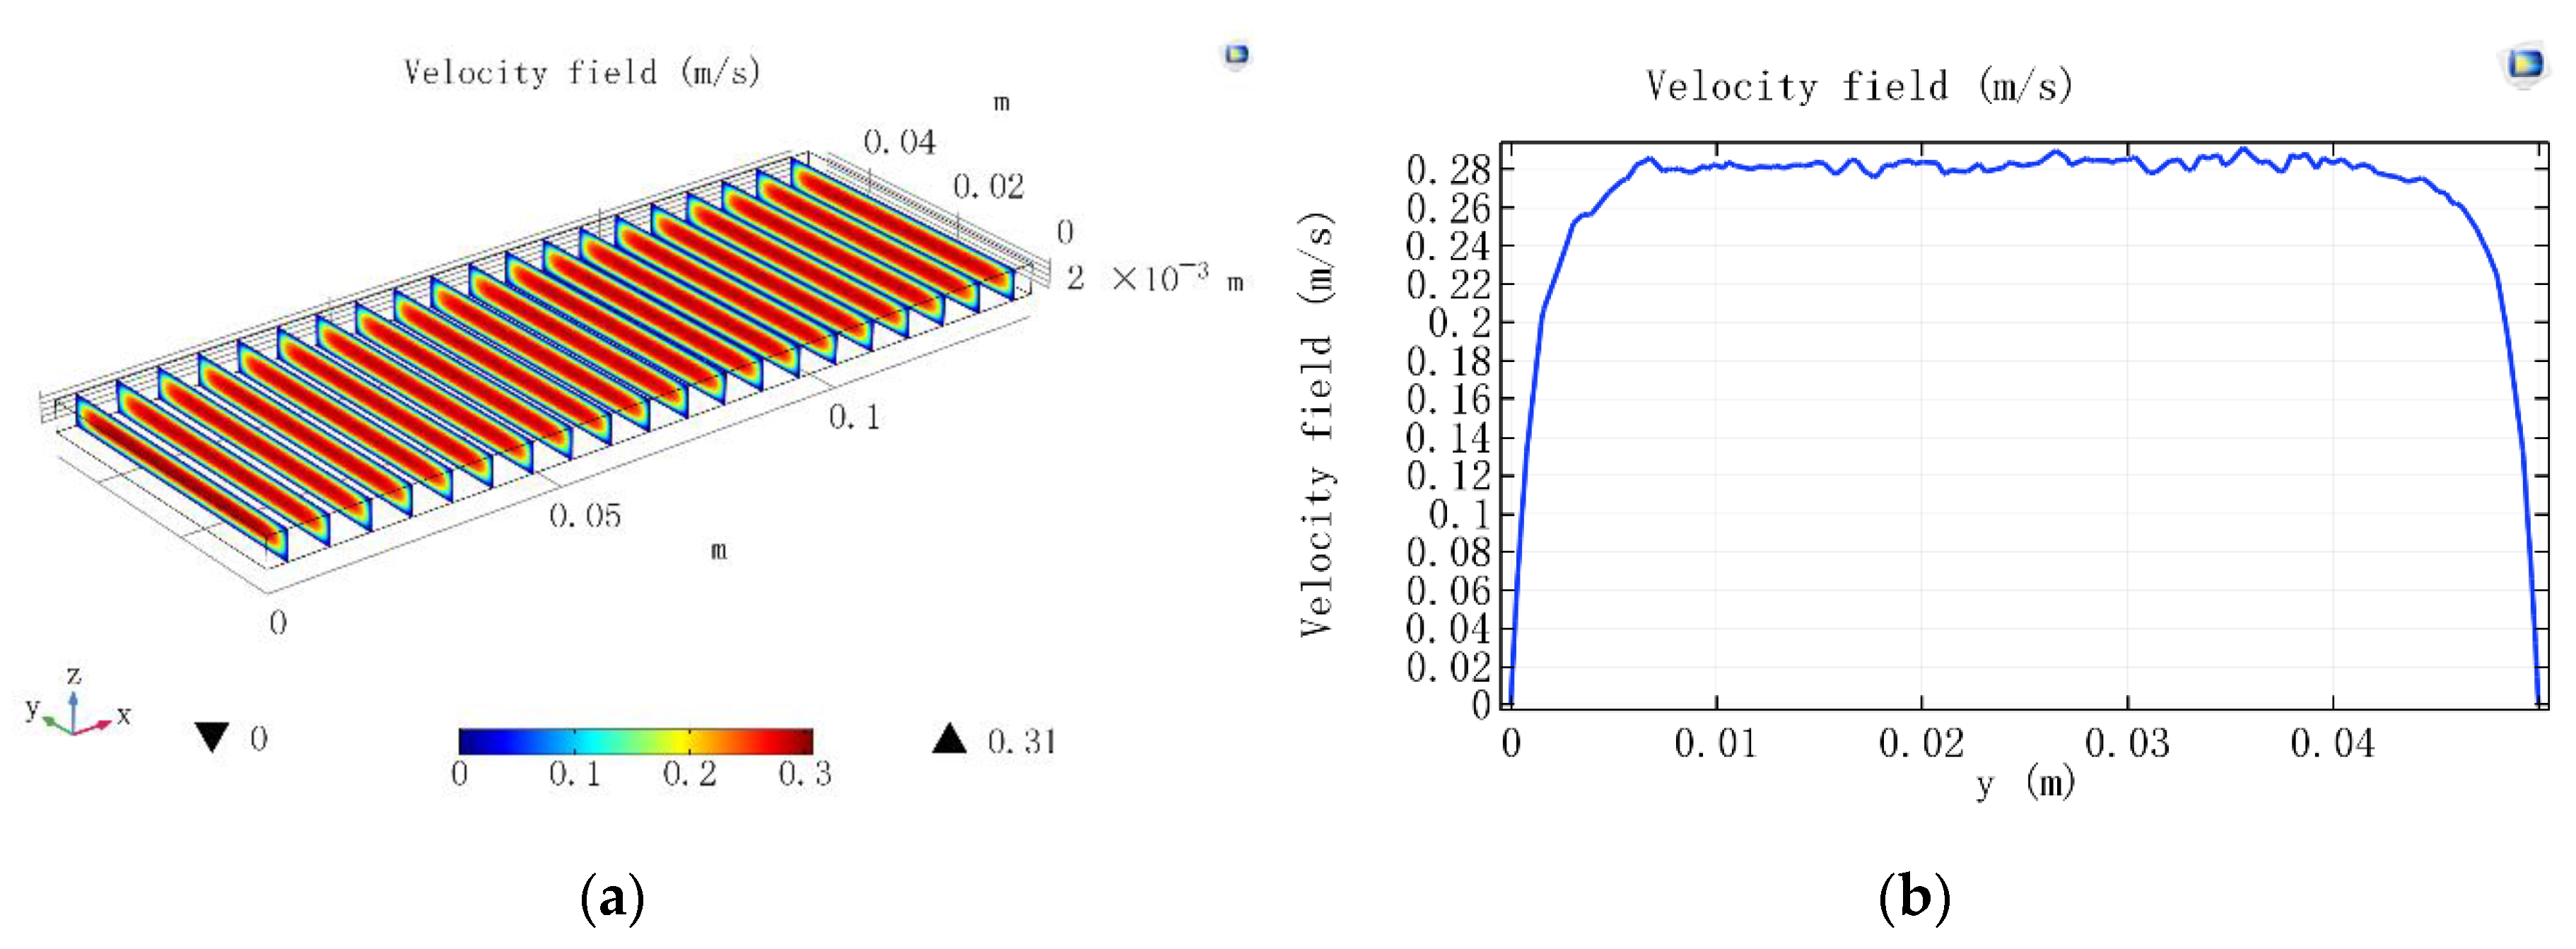
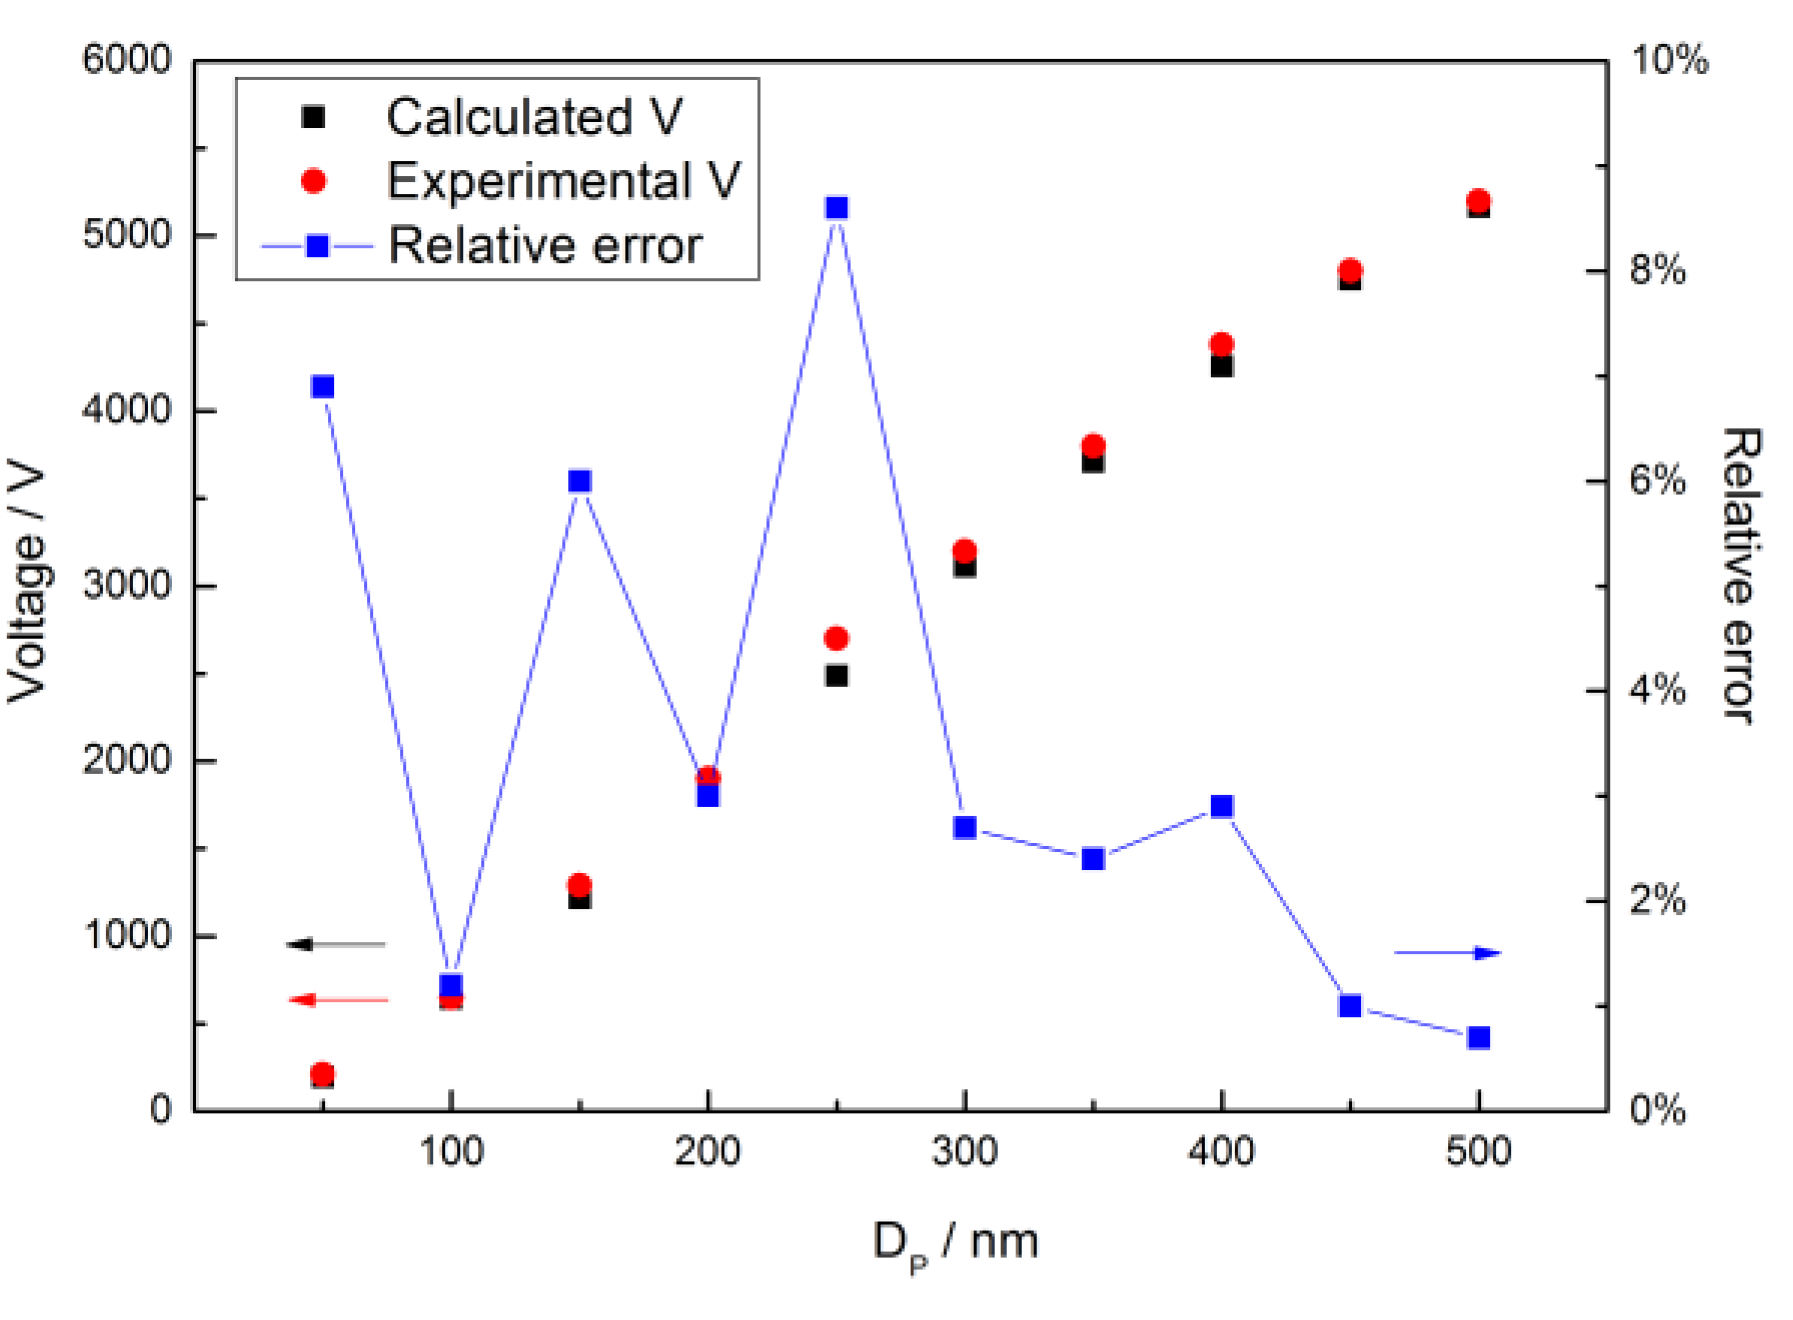
3.1. Simulation-Model Validation

Figure 4a and Figure 5a show the simulation diagram of the velocity field at pressure p 0 = 101.325 k Pa and temperature T = 20 °C. The height in the z direction is 5 mm, and the width in the y-direction is 50 mm. The sheath gas flowed in the x positive direction. Figure 4b and Figure 5b show the velocity distribution diagram at x = 0.05 m, z = 0.0002 m, and x = 0.07 m, y = 0.03 m, respectively. The velocity of the sheath flow rapidly dropped to zero near the walls in the y-direction when the x and z positions were fixed, and in the z-direction when the x and y positions were fixed, which is called the wall effect. Compared with the y direction, the wall effect in the z direction does not affect the exit of particles, as different z positions correspond to different particle mobilities [14]. Therefore, to minimize the wall effect, the length of the aerosol entrance slit was designed to be 40 mm, which was 80% of the width of the classification zone (i.e., 50 mm). The exit slit was the same as the entrance slit.
Different particles have different particle trajectories under the same conditions. Figure 6 shows the trajectories of particles with a size of 5, 200, and 500 nm when the applied voltage is 2800 V and sheath flow rate is 3 L·min−1. At the same voltage, the 5 nm particles were taken to the lower plate, and the 500 nm particles were taken out of the PDMA by the sheath flow. Only the 200 nm particles were classified from the exit slit, which was consistent with the work principle mentioned above. To ensure a reasonable range of the applied voltages, the dimensions of the classification zone were designed as shown in Table 1, based on the working principle and simulations.
Equation (2) can be used to obtain the function relation between particle size D P and applied voltage V, which also deduces the relationship between the two in the simulation model. Sheath flow rate Q s h was set at 2.1 L min−1 and aerosol flow rate Q a was 0.3 L min−1. Figure 7 shows the applied voltage–particle-size relation graph. The black curve represents the simulation-calculated voltages, while the red curve is the experimental voltages. The calculated and experimental voltages increased when the particle sizes increased, and the maximum relative error was 8.6%, which proves that the variation trend of the simulated and experimental voltages has a good consistency. The result of the validation indicates the good consistency between validation results and the simulations. Furthermore, the validation results prove the correctness of the simulation models.

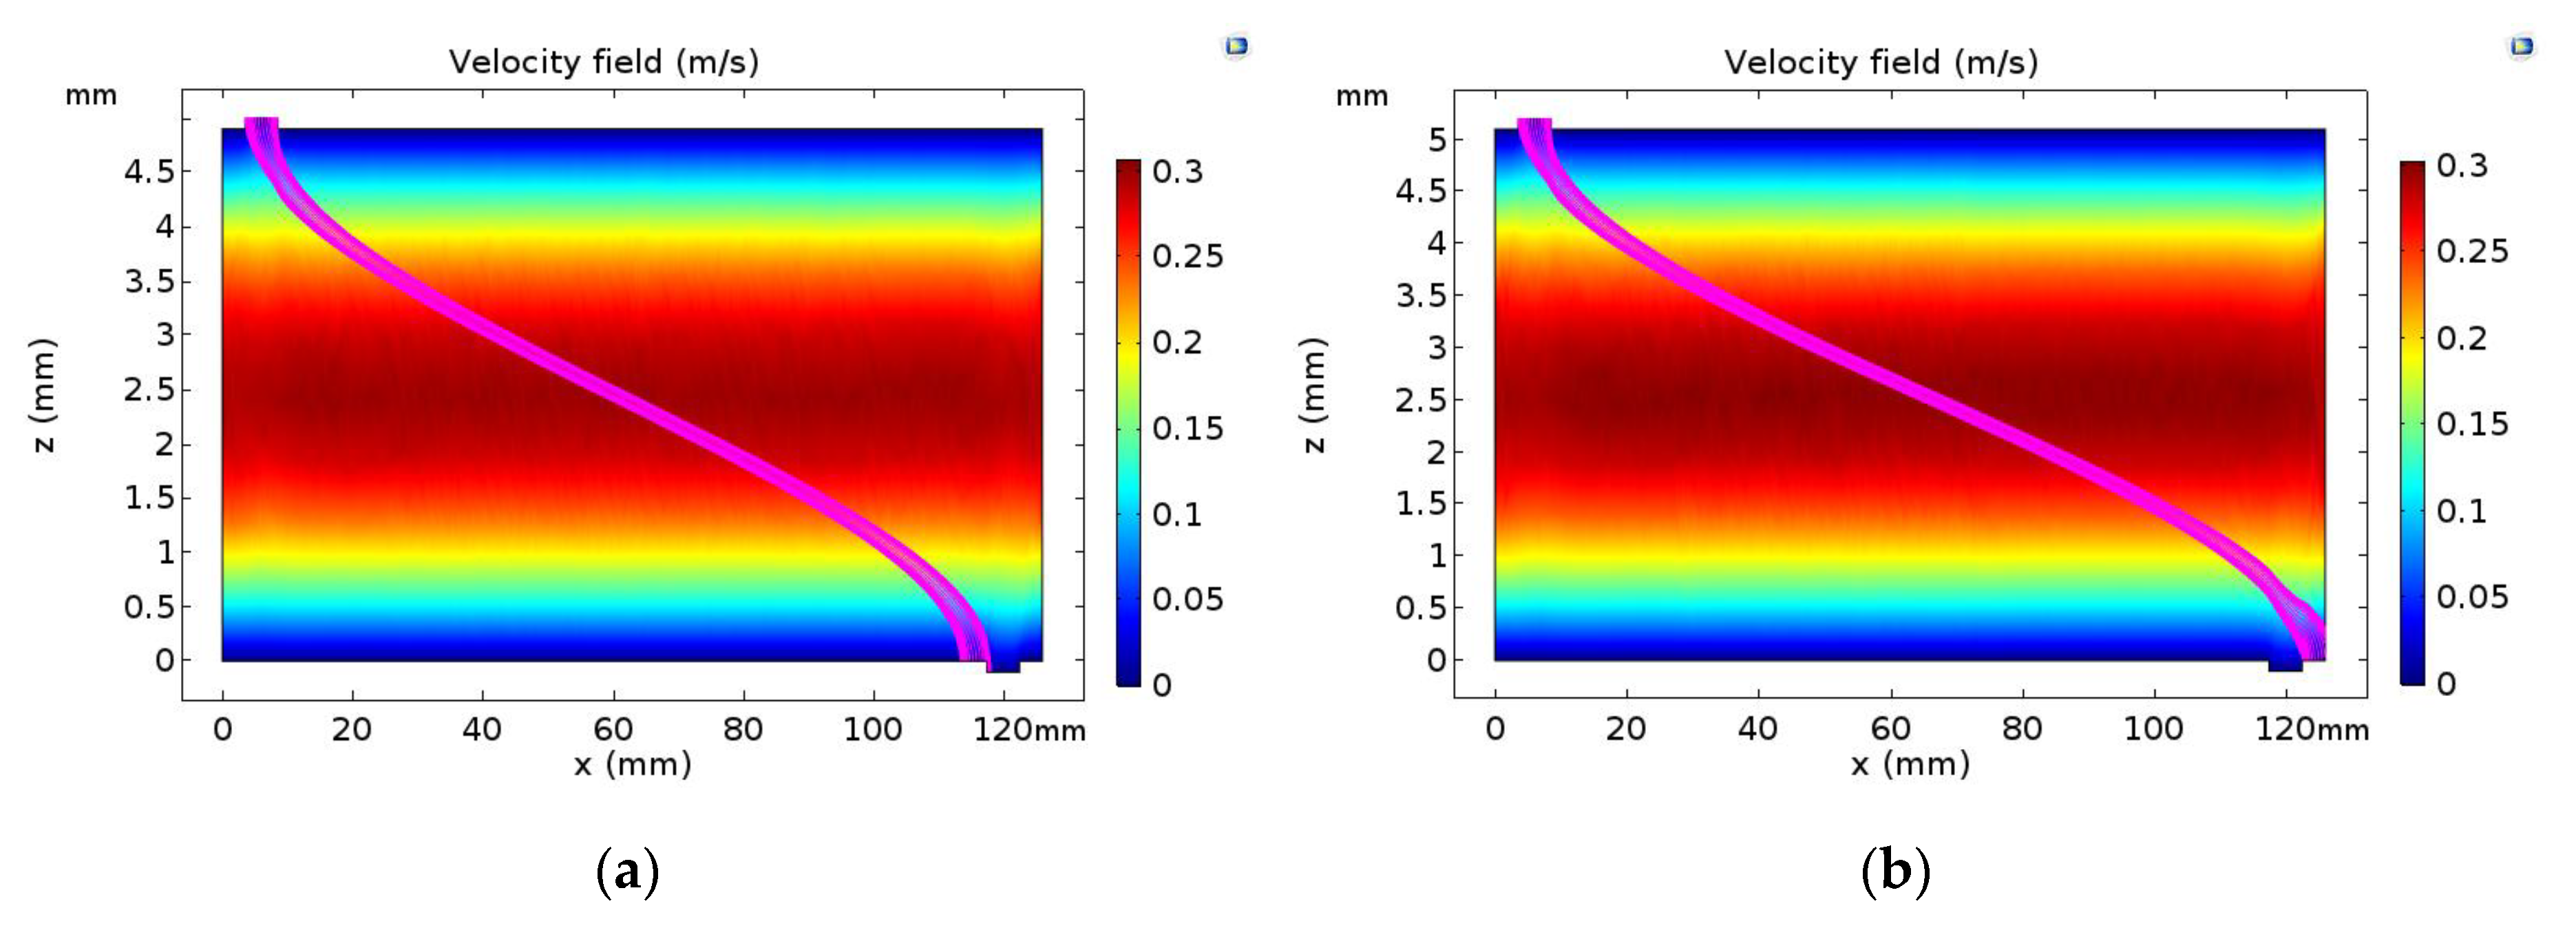
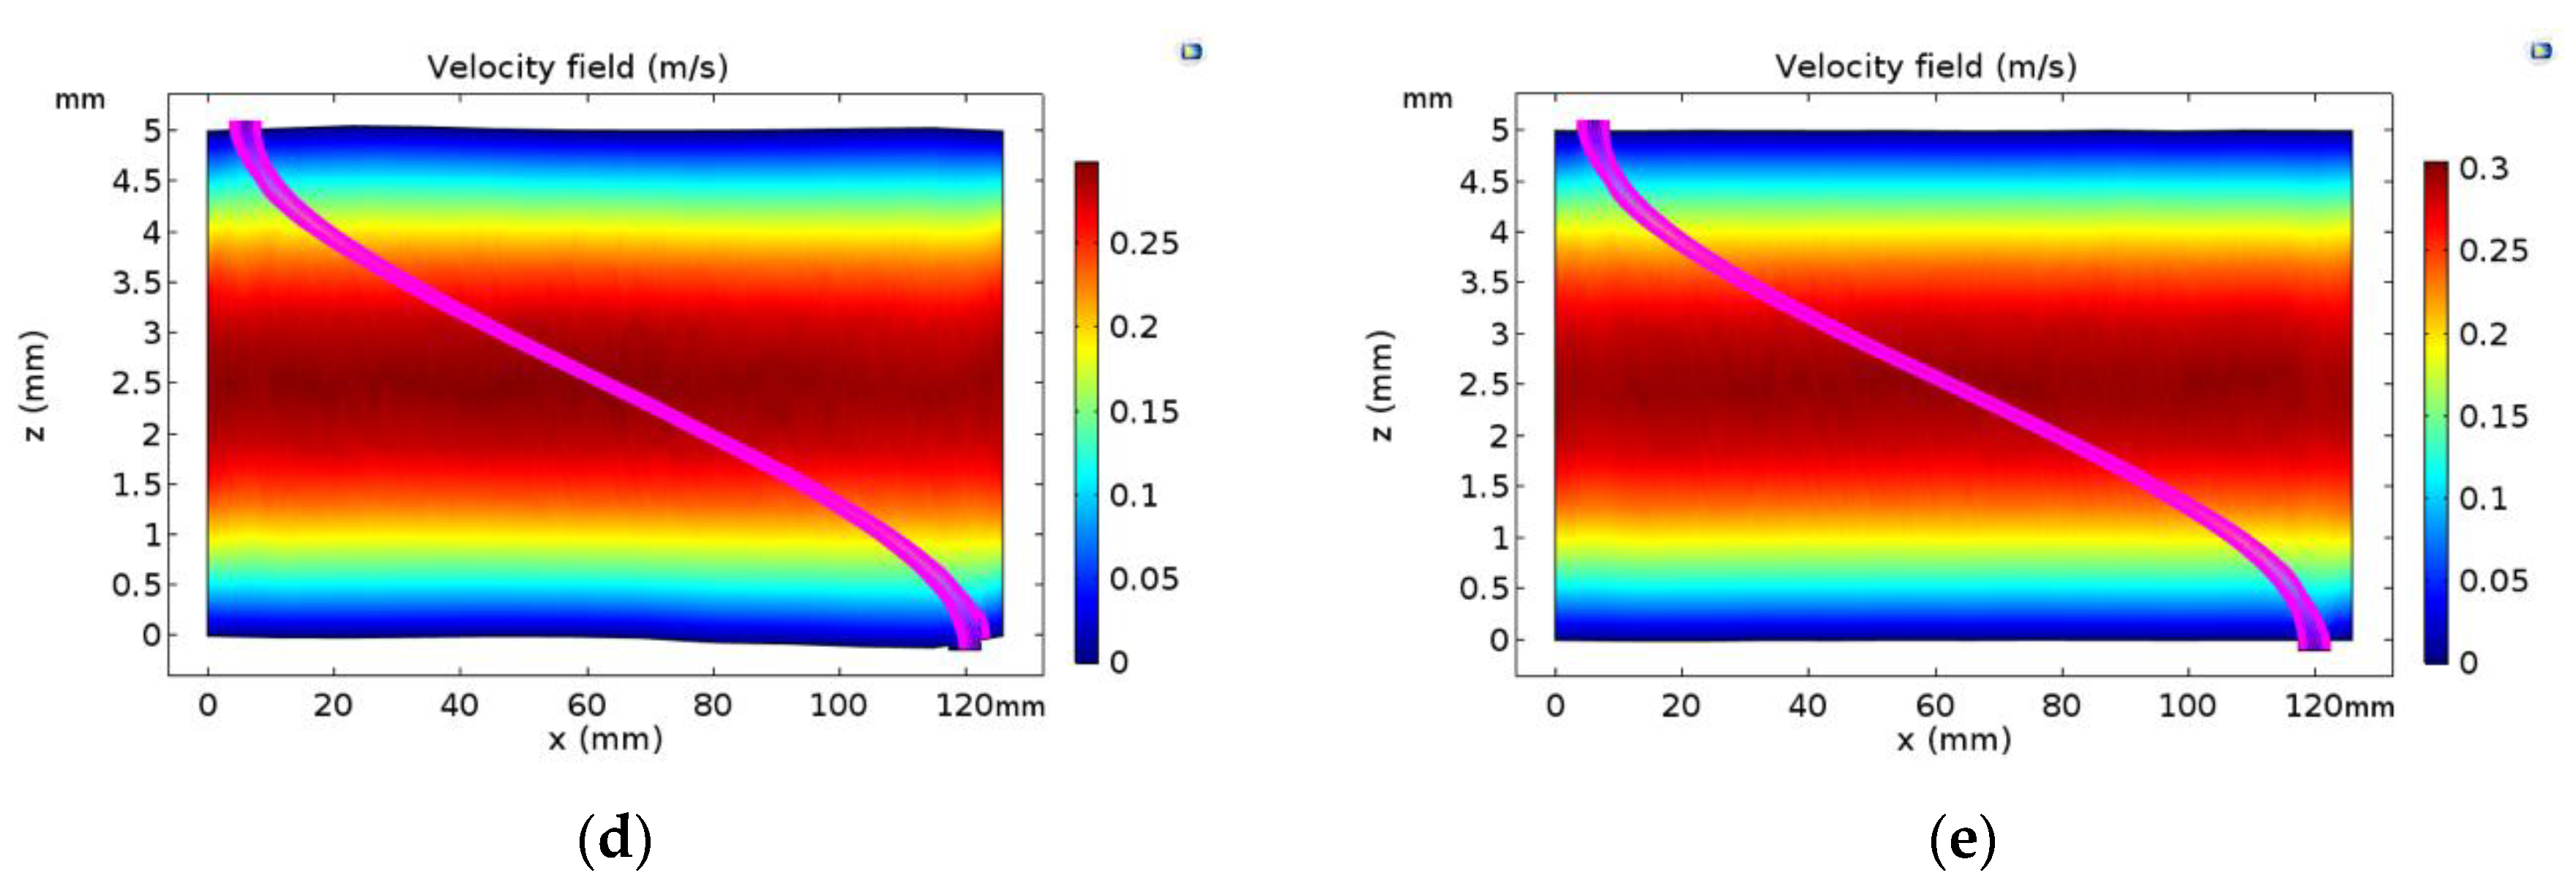
3.2. Effect of Classification-Zone Dimensions

Before the PDMA discussed above, another version of PDMA was designed. The dimensions of the classification zone for the former PDMA version were 108 × 40 × 3 mm (i.e., length × width × height). Figure 8 shows the applied voltage–particle-size relation graph. Compared with the PDMA mentioned above, the dimensions of the classification zone for the former PDMA version were slightly smaller. Classification-zone dimensions are a key PDMA parameter. When other conditions remain unchanged, the applied voltage increases when the H/WL ratio increases (based on Equation (2)).
Classification-zone dimensions not only directly affect the applied voltages, but also limit the measuring range of the former PDMA. Breakdown voltages are capacitors’ limit voltages, and the medium in the capacitor would be punctured beyond the voltage. The theoretical breakdown voltage of the former PDMA is about 9 kV on Paschen’s law, and the applied voltage on the former PDMA should be lower than the breakdown voltage. However, the measured breakdown voltage is about 5 kV, which limits the maximum value of the applied voltage. The measuring range reduces with the applied voltages decrease. The influence factors for the breakdown voltage include not only the classification-zone height, but also air humidity, the finish of each component, etc. Breakdown voltage and the measuring range decrease as the height and finish decrease or air humidity increases. Therefore, when parameters are chosen, various factors need to be considered to achieve a balance between breakdown voltage and applied voltages. Therefore, on the basis of the former PDMA, the optimized one was carried out. The classification-zone height of the optimized PDMA is 5 mm, and measurement range was extended to 500 nm. The simulation model is suitable for the optimized PDMA.

3.3. Process-Parameter Effects

As the machining process has great influence on sizing precision, process-parameter simulations were performed to take influence into consideration. Different machining process can affect the dimensions of each component, and ultimately affects the height of the classification zone, which has a great influence on the performance of PDMAs. A rough machining process could cause the classification-zone height to deviate, which could reduce the PDMA classifying effect. The depth deviation of the groove used to place electrode plates affects classification-zone height, which decreases with the increase of depth. With the correct simulation models mentioned above, the classification-zone height was changed in the range of 4.9–5.1 mm (the other simulation conditions were the same as those of Figure 6b). As shown in Figure 9, electric-field force increases and particles almost completely move to the left of the exit when the height is 4.9 mm, while electric-field force decreases and particles move to the opposite direction when the height is 5.1 mm. Therefore, particles can leave the PDMA from the exit when the classification-zone height changes from 4.9 to 5.1 mm, which means that the PDMA can achieve the role of classification when the error range of the height is within ±2%.
A rough machining process can also cause unevenness of the electrode plates, resulting in electric-field inhomogeneity. An unevenness-measuring instrument (Mitutoyo) was used to measure the unevenness of the two electrode plates. Two lines on different regions of each plate were selected, and the unevenness of ten equidistance points on each line was measured (see Table 2 and Table 3). However, it is impossible to analyze unevenness by experiment due to the difficulty in controlling the unevenness of actual machining. Simulations were applied to show the influence of process parameters in this work. Particle-trajectory simulations, discussed above, were used to model the unevenness trajectories (other simulation conditions were the same as those of Figure 9; see Figure 10). Figure 10b,c shows that the unevenness of the electrode plates leads to electric-field inhomogeneity. The average height of the classification zone was 5.067 mm, and some particles moved to the left of the exit, as seen in Figure 10d, which could affect the penetration of the aerosol particles. Average height was 4.997 mm, and almost all particles left from the exit, as seen in Figure 10e, which means the classifying effect was much better. It is concluded that the PDMA had a better classifying effect when the error range of the average height was approximately ±1% under the influence of the process parameters. Since it is difficult to model the unevenness of the electrode plates, when the error range of the average height is within ±1%, the electrode plates are assumed to be even (other simulation conditions are the same as that of Figure 10. When the error range was +1%, the 195.5 nm particles could be classified (see Figure 11a); when the error range was −1%, the 203.5 nm particles could be sized (see Figure 11b). Process parameters have an effect on PDMA measuring precision, and the error range of the classified particle sizes was between −2.2% and +1.75%.
It can be seen from the trajectory simulations for unevenness that larger positive unevenness leads to lower electric-field force; thus, particles have a tendency to move to the right, away from the exit of the PDMA. That is, larger positive unevenness requires larger electric-field force to make particles leave from the exit, which explains the phenomenon that experimental voltages are always slightly higher than the calculated voltages in Figure 7. In addition, rough machining processing leads to a rough surface, which also affects breakdown voltage in the classification zone. Therefore, good finish machining is one of the most important factors affecting PDMA sizing precision.

4. Conclusions

The effect of design and process parameters on PDMA sizing precision was investigated by Comsol in this work. The key parameters of the PDMA were optimized by simulations and the experimental data of the former PDMA. The width and height of the classification zone were 50 and 5 mm, and the slit length was designed to be 40 mm (80% of the classification-zone width) for avoiding the wall effect. The validation voltages and calculated voltages were in good agreement, and the maximum relative error between the two was 8.6%, which proves the correctness of the simulation model. It was also found that classification-zone dimensions have an effect on PDMA performance. The smaller the H/WL, the smaller the applied voltages are. However, breakdown voltage decreases when H decreases, which limits the maximum of the applied voltages. As the machining process has great influence on PDMA sizing precision, Comsol was also adopted to analyze the effect of the process parameters. In addition, when the PDMA achieves the role of classification, the reasonable error range of the height was ±2% for the classification zone. When the error range of the height was within ±1%, and classified particle sizes were from −2.2% to +1.75%, the PDMA had a better classifying effect. This proves that process parameters have an effect on sizing precision, and a fine processing technology plays an important role in PDMA implementation. Detailed guidelines for machining-process parameters on how to influence PDMA performance are not easy to be outlined only with experiments. For some applications, it is also very important, especially when the designed PDMA is commercially mass-produced, and quality control of the machining process is indispensable. The effect of the process parameters on PDMA sizing precision can guide future design and processing, and provides ideas when there are performance problems but the cause cannot be found.

Author Contributions

Conceptualization, M.C.; Methodology, M.C. and H.W.; Software, M.C.; Validation, M.C., Q.S., F.Y., Y.W., W.W. and C.W.; Formal Analysis, M.C.; Investigation, M.C.; Resources, H.G. and J.L.; Data Curation, M.C.; Writing—Original Draft Preparation, M.C.; Writing—Review and Editing, M.C.; Visualization, M.C.; Supervision, M.C.; Project Administration, H.G., J.L., and L.L.; Funding Acquisition, H.W.

Funding

This research was funded by the National Key Research and Development Program of China (2016YFC0201000), the Natural Science Foundation of China (Grant No. 91544218 and 61673368), the Science and Technological Fund of Anhui Province for Outstanding Youth (1808085J19) and the Anhui Natural Science Foundation Project (Project No.1708085QF151). Huanqin Wang also thanks the State Scholarship Fund, managed by the Chinese Scholarship Council (CSC), for the financial support.

Conflicts of Interest

The authors declare no conflict of interest.

References

  1. Maher, B.A.; Ahmed, I.A.; Karloukovski, V.; MacLaren, D.A.; Foulds, P.G.; Allsop, D.; Mann, D.M.A.; Torres-Jardón, R.; Calderon-Garciduenas, L. Magnetite pollution nanoparticles in the human brain. Proc. Natl. Acad. Sci. USA 2016, 13, 10797–10801. [Google Scholar] [CrossRef] [PubMed]
  2. Mills, H. The Ecology of Infancy and Early Childhood in Rural Senegal; A Five Year Old Can Boot but not Foot, an Exploration of Where Biology Meets Culture. Philos. Trans. R. Soc. Lond. 2014, 358, 2673–2682. [Google Scholar]
  3. Stolcpartova, J.; Pechout, M.; Dittrich, L.; Mazac, M.; Fenkl, M.; Vrbova, K.; Ondracek, J.; Vojtisek-Lom, M. Internal Combustion Engines as the Main Source of Ultrafine Particles in Residential Neighborhoods: Field Measurements in the Czech Republic. Atmosphere 2015, 6, 1714–1735. [Google Scholar] [CrossRef]
  4. Stabile, L. Ultrafine Particle Generation through Atomization Technique: The Influence of the Solution. Aerosol Air Qual. Res. 2013, 13, 1667–1677. [Google Scholar] [CrossRef]
  5. Xiang, S.; Hu, Z.; Zhai, W.; Wen, W.; Noll, K.E. Concentration of Ultrafine Particles near Roadways in An Urban Area in Chicago, Illinois. Aerosol Air Qual. Res. 2018, 18, 895–903. [Google Scholar] [CrossRef]
  6. Flagan, R.C. History of electrical aerosol measurements. Aerosol Sci. Technol. 1998, 28, 301–380. [Google Scholar] [CrossRef]
  7. Intra, P.; Tippayawong, N. An overview of differential mobility analyzers for size classification of nanometer-sized aerosol particles. Songklanakarin J. Sci. Technol. 2008, 30, 243–256. [Google Scholar]
  8. Hewitt, G.W. The Charging of Small Particles for Electrostatic Precipitation. Am. Inst. Electron. Eng. Trans. 1957, 76, 300–306. [Google Scholar] [CrossRef]
  9. Knutson, E.O.; Whitby, K.T. Aerosol classification by electric mobility: Apparatus, theory, and applications. J. Aerosol Sci. 1975, 6, 443–451. [Google Scholar] [CrossRef]
  10. Liu, Q.; Chen, D.R. Experimental evaluation of miniature plate DMAs (mini-plate DMAs) for future ultrafine particle (UFP) sensor network. Aerosol Sci. Technol. 2016, 50, 297–307. [Google Scholar] [CrossRef]
  11. Zhang, S.H.; Akutsu, Y.; Russell, L.M.; Flagan, R.C. Radial Differential Mobility Analyzer. Aerosol Sci. Technol. 1995, 23, 357–372. [Google Scholar] [CrossRef]
  12. Russell, L.M.; Stolzenburg, M.R.; Zhang, S.H.; Caldow, R.; Flagan, R.C.; Seinfeld, J.H. Radially Classified Aerosol Detector for Aircraft Based Submicron Aerosol Measurements. J. Atmos. Ocean. Technol. 1996, 13, 598–609. [Google Scholar] [CrossRef]
  13. Ranjan, M.; Dhaniyala, S. Theory and design of a new miniature electrical-mobility aerosol spectrometer. J. Aerosol Sci. 2007, 38, 950–963. [Google Scholar] [CrossRef]
  14. Steer, B.; Gorbunov, B.; Muir, R.; Ghimire, A.; Rowles, J. Portable Planar DMA: Development and Tests. Aerosol Sci. Technol. 2014, 48, 251–260. [Google Scholar] [CrossRef]
  15. Alonso, M.; Endo, Y. Dispersion of aerosol particles undergoing Brownian motion. J. Phys. A Math. Gen. 2001, 34, 10745–10755. [Google Scholar] [CrossRef]
  16. Rus, J.; Moro, D.; Sillero, J.A.; Royuela, J.; Casado, A.; Estevez-Molinero, F.; Fernández de la Mora, J. IMS-MS studies based on coupling a differential mobility analyzer (DMA) to commercial API-MS systems. Int. J. Mass Spectrom. 2010, 298, 30–40. [Google Scholar] [CrossRef]
  17. Santos, J.P. Performance evaluation of a high-resolution parallel-plate differential mobility analyzer. Atmos. Chem. Phys. 2009, 8, 2419–2429. [Google Scholar] [CrossRef]
  18. Wang, S.C.; Flagan, R. Scanning Electrical Mobility Spectrometer. Aerosol Sci. Technol. 1989, 13, 230–240. [Google Scholar] [CrossRef]
  19. Zhang, M.; Wexler, A.S. Cross flow ion mobility spectrometry: Theory and initial prototype testing. Int. J. Mass Spectrom. 2006, 258, 13–20. [Google Scholar] [CrossRef]
  20. Zhou, G.J.; Yan, Z.Y.; Xu, S.X.; Zhang, K.B. Fluid Mechanics, 2nd ed.; Higher Education Press: Beijing, China, 2011; Volume 2, pp. 150–350. [Google Scholar]
Figure 1. Plate differential mobility analyzer (PDMA) streamlines.
Atmosphere 10 00116 g001
Figure 2. (a) Three-dimensional graph and (b) aerosol slits of the PDMA.
Atmosphere 10 00116 g002
Figure 3. Validation setup for the PDMA.
Atmosphere 10 00116 g003
Figure 4. Simulation diagram of (a) the sheath-flow velocity field on the yz surface at p 0 = 101.325 k Pa and T = 20 °C and (b) the velocity profile at x = 0.05 m and z = 0.0002 m in (a).
Atmosphere 10 00116 g004
Figure 5. Simulation diagrams of (a) the sheath-flow velocity field on the xz surface at p 0 = 101.325 k Pa and T = 20 °C and (b) the velocity profile at x = 0.07 m and y= 0.03 m in (a).
Atmosphere 10 00116 g005
Figure 6. Simulations of the particle trajectories with a size of (a) 5 nm, (b) 200 nm, and (c) 500 nm.
Atmosphere 10 00116 g006
Figure 7. Voltage as a function of particle size at an aerosol and sheath flow rate of 0.3 and 2.1 L min−1, respectively.
Atmosphere 10 00116 g007
Figure 8. Voltage as a function of particle size at an aerosol and sheath flow rate of 0.3 and 3 L min−1, respectively, for the former PDMA version.
Atmosphere 10 00116 g008
Figure 9. Simulations of the particle trajectories for 200 nm at the height of (a) 4.9 nm and (b) 5.1 nm.
Atmosphere 10 00116 g009
Figure 10. Simulations of (a) the calculated electric field in the classification zone, (b) the electric field for the first line, (c) the electric field for the second line, (d) the trajectories of the 200 nm particles for the first line, and (e) the trajectories of the 200 nm particles for the second line.
Atmosphere 10 00116 g010aAtmosphere 10 00116 g010b
Figure 11. Simulations of (a) trajectories of the 195.5 nm particles at a height of 5.05 mm, and (b) trajectories of the 203.5 nm particles at a height of 4.95 mm.
Atmosphere 10 00116 g011
Table 1. Classification-zone dimensions.
Length (mm)Width (mm)Height (mm)H/WL
1265050.794
Table 2. First-line unevenness.
Upper Electrode Plate (mm)Lower Electrode Plate (mm)
0.0280.116
0.0530.102
0.0430.077
0.0230.064
0.0100.019
0.0600.006
0.0080.003
0.0150.010
0.0260.017
0.0330.015
Table 3. Second-line unevenness.
Upper Electrode Plate (mm)Lower Electrode Plate (mm)
−0.0040.008
−0.0020.003
0.0000.001
−0.0010.000
0.000−0.001
−0.0050.001
−0.0070.001
−0.0090.000
−0.0090.001
−0.0090.000

