Article

An Integrated Flood Risk Assessment Model for Cities Located in the Transitional Zone between Taihang Mountains and North China Plain: A Case Study in Shijiazhuang, Hebei, China

1
Postdoctoral Research Station of Geography, Hebei Normal University, Shijiazhuang 050024, China
2
College of Resources and Environment Science, Hebei Normal University, Shijiazhuang 050024, China
3
Hebei Key Laboratory of Environmental Change and Ecological Construction, Hebei Normal University, Shijiazhuang 050024, China
4
College of International Culture Exchange, Hebei Normal University, Shijiazhuang 050024, China
*
Authors to whom correspondence should be addressed.
Atmosphere 2019, 10(3), 104; https://doi.org/10.3390/atmos10030104
Submission received: 8 February 2019 / Revised: 20 February 2019 / Accepted: 21 February 2019 / Published: 26 February 2019

Abstract

:
Cities located in the transitional zone between Taihang Mountains and North China plain run high flood risk in recent years, especially urban waterlogging risk. In this paper, we take Shijiazhuang, which is located in this transitional zone, as the study area and proposed a new flood risk assessment model for this specific geographical environment. Flood risk assessment indicator factors are established by using the digital elevation model (DEM), along with land cover, economic, population, and precipitation data. A min-max normalization method is used to normalize the indices. An analytic hierarchy process (AHP) method is used to determine the weight of each normalized index and the geographic information system (GIS) spatial analysis tool is adopted for calculating the risk map of flood disaster in Shijiazhuang. This risk map is consistent with the reports released by Hebei Provincial Water Conservancy Bureau and can provide reference for flood risk management.

1. Introduction

Floods are one of the most common natural hazards in the world, which cause serious losses in lives and damage to buildings and infrastructures. In the context of global warming and rapid urbanization, the increased frequency of floods leads to more life and economic losses [1,2]. Part of these floods are urban waterlogging. As a consequence, the need for flood risk assessment is becoming more and more critical. Floods possess significant seasonal, regional, and repeatable characteristics [3], while flood risk is usually calculated as the product of the occurrence probability of flood hazard and the casualties and property losses resulted from the flood hazard [4,5]. Monitoring and assessing the flood risk timely and accurately in the flood-prone area is of great importance in preventing watershed disasters and mitigating economic losses.
Many works have been conducted in the flood risk assessment. The source–pathway–receptor (SPR) concept is widely used to develop a flood assessment model [6,7]. Based on the hydrodynamic mechanism, a simulation model can be established [8]. While the mechanism-based model is usually complicated, an index system-based assessment method is relatively simple and has high efficiency, and even has more accuracy than a mechanism-based model, which is not close enough to the real mechanism. Based on the SPR concept, the process of build-up in an index system can be divided into hazard, exposure, vulnerability, and restorability [3,9]. Three dimensions—population, economy, and flood prevention—are usually used to construct the index system of social vulnerability to floods. Analytic hierarchy process (AHP) is then used to calculate the weight of each index and GIS is used to calculate the synthetical result of a specified region [10,11,12,13,14,15].
AHP is a qualitative and quantitative decision analysis method [16]. It is designed to cope with both the rational and intuitive inputs to select the best from a number of alternatives evaluated with respect to several criteria [17]. In this process, the decision-maker carries out simple pairwise comparison judgments, which are then used to develop overall priorities for ranking the alternatives [18]. The AHP both allows for inconsistency in the judgments and provides a means to improve consistency. It is often applied to multi-objective, multi-criteria, multi-factorial, multi-level unstructured and complex decision-making, especially to the study of strategic decision-making, which has a very wide range of practicality [16,19,20]. In this paper, AHP is used to determine the weight of each flood risk index and the response of land cover type to rainwater.
With the development of the economy, urban agglomeration has become the main method of China’s new-type urbanization and the core method of economic development [21]. On 1 April 2017, Xiong’an New Area has been orientated to implement the Beijing–Tianjin–Hebei (BTH) urban agglomeration [22]. The main cities of BTH are located in the transitional zone between Taihang Mountains and North China plain, which run a high flood risk due to the influences of the East Asian monsoon, global warming, and urban ground hardening [23]. The distribution of precipitation in North China plain is relatively uneven during the year, mainly concentrated in late July to early August, with precipitation accounting for more than 50% of the whole year. During this period, the warm and humid airflow [24] from the southeast direction accumulates on the windward slope (east slope) of Taihang Mountain, which often leads to torrential rain [25,26]. In addition, the rivers developed by Taihang Mountain are mostly forked rivers, and the precipitation is easy to collect in a short time, causing serious flood disasters in the transitional zone between Taihang Mountains and North China plain [27,28]. Shijiazhuang is one of them. The risk assessment of flood disaster in Shijiazhuang helps to rationalize the flood control area, scientifically manage the floodplain, and raise the awareness of its residents regarding flood control and disaster reduction. In this paper, an index-system-based assessment method is adopted to assess the flood risk in Shijiazhuang. The objectives of this paper are: (1) to propose an integrated flood risk assessment model for this specific geographical environment, (2) to build up an index system considering the land cover type and flow accumulation level, (3) to calculate the weight for each index using the AHP method, and (4) to obtain the flood risk maps to provide reference for flood risk management and flood disaster reduction planning of Shijiazhuang.

2. Study Area

Shijiazhuang is the capital city of the Hebei province, which plays an important role in the BTH Integration Initiative. It is located in the transitional zone between Taihang Mountains and North China plain with a continental monsoon climate covering a total area of 15,848 square kilometers (Figure 1). The western side of Shijiazhuang is bounded by the Taihang Mountains and the eastern side is on the Hutuo River alluvial plain. The landform sequence from west to east are mid mountains, low mountains, hills, and plains.
The heavy rainfall in August 1996 caused floods to 11 large reservoirs and 338 small and medium sized reservoirs in this transitional zone between Taihang Mountains and North China plain. Beijing-Guangzhou and Shi-Tai Railways were once slowed down or cut off, causing a direct economic loss of RMB 45.6 billion Yuan [29,30]. On 19 July 2016, this transitional zone once again suffered heavy rain that caused huge floods with drastic economic losses. According to the report released by Hebei Provincial Water Conservancy Bureau on 20 July 2016, nearly 400,000 people were affected in Shijiazhuang, 4300 hectares of cultivated land and more than 30,000 trees were destroyed, and 93 roads, 112 communication base stations, and 2 small hydropower stations were damaged, 286 houses were collapsed, and 67,159 people were transferred. Among them, Shijiazhuang was the worst affected, while nearly 300,000 people were affected, 4000 hectares of cultivated land was destroyed, and 186 houses collapsed [31]. (http://www.hebwater.gov.cn/a/2016/07/20/1468986746382.html).
Affected by global climate change and urbanization, in recent years (2014–2018), Shijiazhuang has experienced several heavy rains causing urban waterlogging. Considering the frequent flood history, geographical location, and climate characteristics of Shijiazhuang (Figure 2), a flood risk assessment model is in urgent need of dealing with the potential flood risk.
China Meteorological Data Service Center (http://data.cma.cn) provides two precipitation datasets: one provides monthly surface observation values in individual years in China (hereafter referred to as Dataset A), and the other provides monthly values of climate data from Chinese stations for global exchange (hereafter referred to as Dataset B). A total of 139 rainfall stations are available around Shijiazhuang in Dataset A, where these stations provide average precipitation, continuous maximum precipitation, and precipitation anomaly percentage from 1981 to 2010. A total of 40 rainfall stations are available around Shijiazhuang in Dataset B, where these stations provide average precipitation, continuous maximum precipitation, and precipitation anomaly percentage from 2011 to 2016. All stations in Dataset B are included in Dataset A. Dataset A has more rainfall stations and more records than Dataset B, but Dataset A only has data before 2010. The Digital Elevation Data for ASTER GDEM V2 product is downloaded from Geospatial Data Cloud (http://www.gscloud.cn), with a grid resolution of 30 m. Population data was retrieved from the National Earth System Science Data Sharing Infrastructure, National Science & Technology Infrastructure of China (http://www.geodata.cn). Grain production and gross domestic product (GDP) data are downloaded from Shijiazhuang Municipal Bureau of Statistical Yearbook (http://www.sjztj.gov.cn). Administrative district and water system vector data is extracted from 1:1,000,000 topographic map that is provided by National Geomatics Center of China (http://ngcc.sbsm.gov.cn). Land cover data product of Shijiazhuang is downloaded from the 30-m Global Land cover data product [32].

3. Methodology

3.1. Risk Assessment Method

Floods in Shijiazhuang are generally caused by heavy rain. We adopted the framework of the risk assessment model (risk = hazard + vulnerability) proposed by Maskrey [33] in this paper. Hazard is divide into two parts: hazard trigger factor and hazard potential factor, which can be expressed as follows:
R = f ( H T , H P , V ) = H T + H P + V
where R is flood risk. HT is flood hazard trigger factor, which is precipitation in our study area. It means that if there is no hazard trigger factor, there is no flood. HP is the flood hazard potential factor associated with the natural conditions that affect the flood, which is the flow accumulation area, reciprocal of elevation, reciprocal of slope, buffer zone of traditional water system, and the response of land cover type to rainwater. V is flood vulnerability factor, which is GDP, population, and grain production. Flood disaster assessment modeling steps are as follows: (1) constructing index system of flood disaster factors; (2) normalizing each index; (3) invite relevant experts to evaluate factors and determining the weight of each normalized indices by using AHP method; and (4) using GIS spatial analysis tools to calculate flood hazard trigger factor map, flood disaster potential factor map, flood vulnerability factor map, and flood disaster risk map.

3.2. Constructing Flood Disaster Factors and Data Processing for the Indices

According to Equation (1), flood disaster factors are constructed and all these factors are resampled to a 30-m resolution for later analysis and calculation in ArcGIS 10.2 which is a software from Redlands, California, USA.

3.2.1. Flood Hazard Trigger Factor

For analyses of the flooding events, the high precipitation intensities to be considered are required to occur in an independent and identically distributed way such that they can be extracted as peaks-over-threshold [34,35]. However, in this study, consideration was given to the combination of different characteristics of precipitation in the form of indices. Five indices are selected for the flood hazard trigger factor: continuous maximum precipitation (T1), average precipitation (T2), and precipitation anomaly percentage (T3) in Dataset A; and average precipitation (T4) and precipitation anomaly percentage (T5) in Dataset B. The average precipitation indicates the monthly amount of precipitation in one month, and the continuous maximum precipitation indicates the extreme precipitation of that month. The percentage of precipitation anomaly indicates the ratio of monthly precipitation to the average state of the same period. All the above factors are combined to characterize the continuous extreme precipitation and thus characterize the flooding ability. The data for June, July, August, and September were averaged, and Kriging interpolation [36] was used to interpolate the averaged data and to obtain five 30-m resolution raster data. The maximum search radius was 100 km in Dataset A and 150 km in Dataset B. The greater the value of these five indices, the stronger the flood disaster triggers.

3.2.2. Flood Hazard Potential Factor

Five indices are selected for flood hazard potential: flow accumulation area, reciprocal of elevation, reciprocal of slope, buffer zone of traditional water system, and the response of land cover type to rainwater.
(1) Flow accumulation area (P1)
ArcGIS tools are used to process the DEM data: Mosaic the downloaded DEM data, fill sinks with fill tool, using the flow direction tool to get the water flow direction data, and then use the flow accumulation tool to get the final flow accumulation area. The flood is generally caused by the extreme water accumulation. Therefore, the higher the value of the flow accumulation area, the greater the danger is.
(2) Reciprocal of elevation (P2)
The elevation is obtained from DEM. Water generally flows downward due to gravity, and most flood disasters occur in low-flat areas. Therefore, the higher the elevation is, the lower the danger is. We adopt the reciprocal of elevation.
(3) Reciprocal of slope (P3)
Using DEM processed using the slope tool to generate the slope. Slope is an amount that characterizes the degree of steepness, which affects water velocity. In flat areas with low elevations, it is easier for water to be retained and stay for a long time, causing more floods. Therefore, the greater the slope is, the lower the danger is. We adopt the reciprocal of slope.
(4) Buffer zone of traditional water system (P4)
The heavy rain flooded the stream. According to the precipitation of Shijiazhuang and the principle of river classification, buffer zone analysis is conducted for different grades of river and different degrees of risk value are given according to the catchment analysis experiment and different ranks of river. The first-class river will produce five buffers, starting at the first buffer level. Four buffers for the second-class river, starting with the second buffer level, and so on (Table 1).
(5) Response of land cover type to rainwater (P5)
The types of land cover in Shijiazhuang are roughly divided into forest, wetland, grassland, water body, cultivated land, and artificial surfaces [32], Figure 3. According to the influence of vegetation on the soil, resistance of land cover types to precipitation giving rise to disasters is getting weaker and weaker according to the order of forest, grassland, cultivated land, artificial surfaces, wetlands, and water bodies. Expert scoring and AHP methods are used to determine the resistance of various factors on precipitation.

3.2.3. Flood Vulnerability Factor

Three indices are selected from the flood vulnerability perspective: GDP, population, and grain production. The greater the values of these indices, the higher the vulnerability.
(1) GDP (V1)
The GDP we get is a record result for the administrative district level. We assign the GDP record to the administrative districts. We divided the GDP of each administrative district by the area of the district to produce the averaged GDP value in each district.
(2) Population (V2)
Population data we obtained is 30-m resolution grid raster data. We extract the population data using the boundary of the Shijiazhuang.
(3) Grain production (V3)
The grain production we get is a record result for the administrative district level, which is the output of cultivated land. We first used the administrative district vector map to clip the land cover data of the cultivated land, and then assigned the value according to the grid number of cultivated land in each administrative district. We divided the grain production of each administrative district by the area of the district to produce the averaged grain production value in each district.

3.3. Normalization of Indices

The following normalized approach is adopted to eliminate the impact of magnitude and dimension of the indices [37,38] in order to ensure the comparability of the various indices:
N i = X i X m i n X m a x X m i n
where Ni is the normalized value of the index, Xi is the value of a certain grid of the index, Xmin is the minimum value of the index, and Xmax is the maximum value of the index. We used ArcGIS ModelBuilder to customize an automatic normalization tool [38] that batch-normalized the above thirteen parameters.

3.4. Calibrating the Index Weight Using AHP

The basic process of AHP decision-making analysis can be divided into the following seven basic steps: (1) identify the scope of the problem clearly, including the factors involved, the relationship between the various factors, etc., in order to grasp the full information as much as possible; (2) establish a hierarchical model; (3) invite relevant experts to evaluate factors and construct judgment matrix; (4) create a single hierarchy; (5) consistency check of the single hierarchy; (6) create a total hierarchy; and (7) consistency check of the total hierarchy.
Experts make decisions based on the previous experiences and use several numbers, from one to nine, to compare the relative importance of two given indices, when treating the same issue, the results of the expert scoring are indeed different, but we cannot judge which expert’s results are more accurate. For this reason, we averaged each of the scoring results of each expert.
After experts evaluate the factors, we can get four judgment matrixes, which are A 3 × 3 O for flood disaster risk, A 5 × 5 T for flood hazard trigger factor, A 5 × 5 P for flood hazard potential factor and A 3 × 3 V for flood hazard potential factor. Then eigenvalues ( λ m a x ) and eigenvectors of the above four matrices need to be calculated. The eigenvalues are used to check consistency through Equation (3), where n is the dimension of the judgment matrix, and RI can be found in Table 2. When CR is smaller than 0.1, the consistency check is passed. After the consistency check is passed, we can get the weight from the normalized eigenvector.
C I = λ m a x n n 1 C R = C I R I
In this paper, flood risk assessment is divided into three hierarchies: the first hierarchy is flood disaster risk, hereafter referred to as object hierarchy; the second hierarchy is flood hazard trigger factor, flood hazard potential factor, and flood vulnerability factor, hereafter referred to as factor hierarchy; and the third hierarchy is five indices of flood hazard trigger factor T1 to T5, five indices of flood hazard potential factor P1 to P5, and three indices of flood hazard trigger factor V1 to V3, hereafter referred to as index hierarchy.

4. Results

4.1. AHP Results

4.1.1. Risk Factor of Land Cover Types

The consistency index (CI) of resistance of land cover types to precipitation was 0.0475. The consistency ratio (CR) of resistance of land cover types to precipitation was 0.0383. It is obvious that all of the CRs were smaller than 0.1; therefore the consistency check passed. Taking the reciprocal of resistance can get a risk factor of land cover types on precipitation. The risk factor of land cover types are shown in Table 3.

4.1.2. Weights Calibrated Using AHP

CI and CR of single hierarchy in object hierarchy is −4.4409 × 10⁻¹⁶ and −7.6567 × 10⁻¹⁶, respectively. For the CI and CR of single hierarchy in factor hierarchy, the flood hazard trigger factors were 0.0033 and 0.003, respectively. The flood hazard potential factors were 0.0132 and 0.0118, respectively, and the flood hazard trigger factors were 0.0193 and 0.0332, respectively. For the CI and CR of total hierarchy in factor hierarchy, the flood hazard trigger factors were 0.0019 and 0.0017, respectively. The flood hazard potential factors were 0.0038 and 0.0034, respectively, and the flood hazard trigger factors were 0.0055 and 0.0095, respectively. It is obvious that all of the CRs were smaller than 0.1; therefore, the consistency check passed. Weights calibrated by AHP is shown in Table 4.

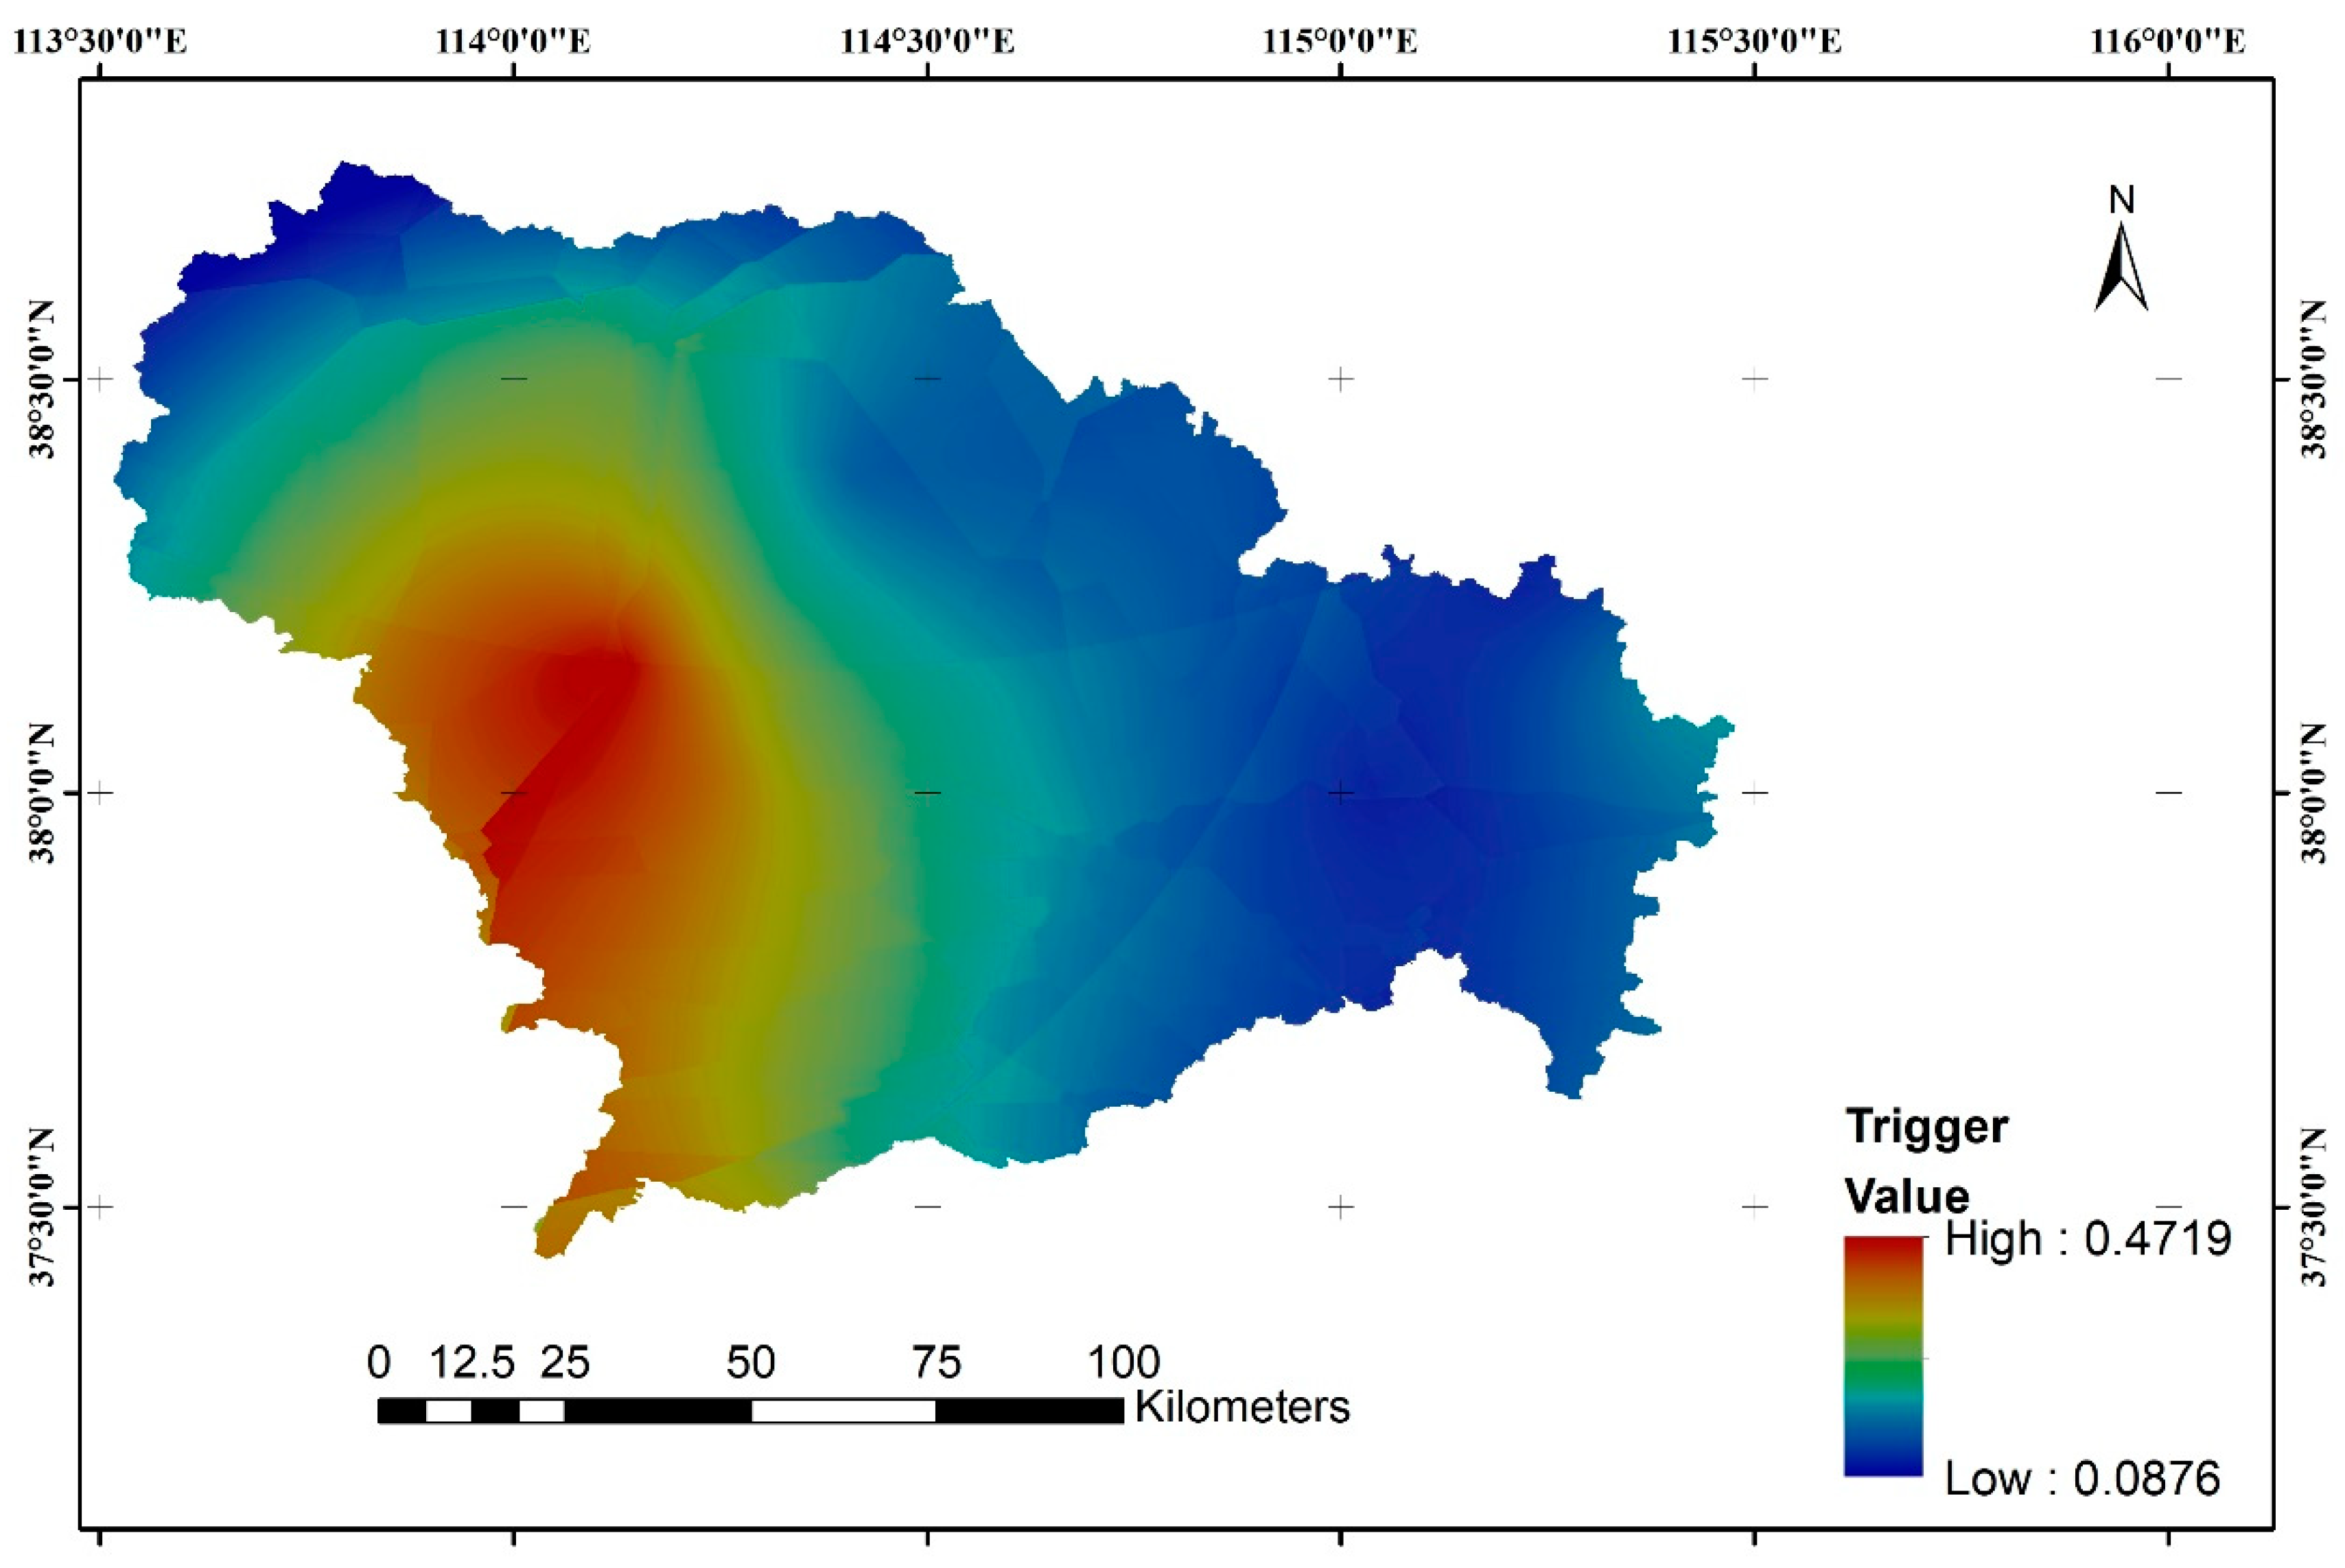
4.2. Flood Hazard Trigger Factor Map

The flood hazard trigger factor is mainly affected by precipitation. According to the weight of AHP (Table 4), flood hazard trigger indices T1 to T5 were added according to Equation (4) using the weighted sum tool of ArcGIS:
H T = T 1 × 0.2623 + T 2 × 0.1311 + T 3 × 0.0695 + T 4 × 0.0695 + T 5 × 0.0391
Figure 4 shows that the flood hazard trigger factor was higher on southwest part of the Shijiazhuang area. The reason for the above phenomenon was due to the affection of Taihang Mountains and the continental monsoon climate. Under the combined effect of topography and climate, floods in the southwest area were highly triggered and were prone to flood disasters and mudslides caused by landslides.

4.3. Flood Hazard Potential Factor Map

The flood hazard potential factor is mainly affected by terrain, river, and land cover characteristics. Based on AHP weights (Table 4), we used the weighted sum tool of ArcGIS 10.2 to add flood hazard potential indices P1 to P5 according to Equation (5):
H P = P 1 × 0.1187 + P 2 × 0.0713 + P 3 × 0.0414 + P 4 × 0.0414 + P 5 × 0.0128
Figure 5 shows that the flood potential in Shijiazhuang was higher in the east and low in the west due to the influence of natural topography and human factors on the surface modification. The potential threat of flood was high in the eastern region, which was because of low topography and the main types of land surface were cultivated land and artificial surfaces in the eastern region. Flood potential was high along rivers and other waters since the risk of flood was higher close to the water.

4.4. Flood Vulnerability Factor Map

Flood vulnerability factor was mainly determined by economic factors such as GDP, population, and grain production. Based on the weight of AHP (Table 4), the weighted sum tool of ArcGIS 10.2 was used to add flood vulnerability indices V1 to V3 according to Equation (6)
V = V 1 × 0.0910 + V 2 × 0.0369 + V 3 × 0.0150
Figure 6 indicates a strong correlation between the high value area, and the artificial surfaces area and cultivated land area in the administrative area. Shijiazhuang urban area is the region with highest vulnerability for its high GDP and large population, followed by the artificial surface area in Zanhuang County, which is located in the lower left corner of the map. This is mainly due to the highly concentrated population. Furthermore, the eastern cultivated land area is used for high grain production. The sparsely populated western mountain area as possessed the lowest vulnerability area.

4.5. Flood Risk Map

Using the weighted sum tool of ArcGIS, the result of the above three factors were summed up according to Equation (1) to get the result of comprehensive assessment of flood risk in Shijiazhuang. The overall risk of flood disaster in Shijiazhuang was concentrated in the southwestern region, followed by the risk in urban areas, especially in the southwestern region of the urban area (Figure 7). Due to the impact of its own terrain and climate, coupled with urbanization, urban waterlogging was getting worse and worse, and the resistance to floods was getting weaker and weaker.

4.6. Validation of the Maps

We validated the results of this study with the textual reports released by Hebei Provincial Water Conservancy Bureau (Table 5). There have been two huge floods caused by torrential rain since 1949. The flood hazard trigger map and the flood hazard potential map were basically consistent with both flood records. The mountain areas in the flood vulnerability map and the flood risk map were basically consistent with both flood records. The urban and cultivated areas in these maps were inconsistent with the flood record of 1996, but consistent with the flood record of 2016.

5. Discussions and Conclusions

Shijiazhuang is a traditional arid zone [39,40] that has experienced two huge floods caused by torrential rain since 1949. Affected by global climate change and urbanization, in recent years Shijiazhuang has experienced several heavy rains causing urban waterlogging. Considering the frequent flood history, geographical location, and climate characteristics of Shijiazhuang, a flood risk assessment model is in urgent need in dealing with the potential flood risk.

5.1. Discussions

The risk assessment model proposed by Maskrey [33] is risk = hazard + vulnerability. Usually, precipitation is included in hazard, while the flooding in the transitional zone between Taihang Mountains and North China plain is mainly caused by the uneven distribution of precipitation during the year, where the warm and humid airflow from the southeast direction accumulates on the windward slope and forked rivers developed by Taihang Mountain. Therefore, we extended the risk assessment model to risk = trigger + hazard + vulnerability. Precipitation was separated from hazard and became an independent factor to characterize the flood trigger rate.
The method used in this paper in establishing a flood disaster assessment model was influenced by the variety of data used, thus the problem that must be faced is how much weight should be allocated for different data dimensions. AHP is a semi-qualitative, semi-quantitative analysis method for weighting. The construction process of the judgment matrix is completely dependent on the experience of the experts. We do not know which expert’s judgment is the most accurate. Although we averaged the scores of experts, we still put uncertainty into the model, as this is at least a semi-quantitative method. The improvement in this paper lies in considering precipitation as a single element to characterize the ability of flood triggering, using land cover/utilization data to characterize surface water storage capacity, and in using the technique of reciprocal to keep the order of data consistent.
Data collection is often difficult in China. Fortunately, more and more data have been opened in recent years. There are 139 stations in the precipitation Dataset A, and 40 stations in the Dataset B. While the latter is inferior in the number of stations, all the stations in the latter dataset are included in the former. In addition, Dataset B did not have continuous maximum precipitation data. However, Dataset B contains data after the year 2010, while Dataset A only has data before the year 2010. Since the dataset contains different numbers of stations, the distance between stations of each datasets differed, thus Dataset A and Dataset B were interpolated separately with different search radius. Since interpolation can lead to outliers, the absence of data in Dataset A and Dataset B increased the probability of the occurrence of outliers. However, we can only hope that the China Meteorological Data Service Center updates the data as soon as possible to provide more abundant data to reduce outliers.
We used ArcGIS 10.2 software to resample all data with a less-than-30-m resolution into 30-m resolution data for subsequent pixel level raster calculations. However, only the DEM and land cover/use data in the original data had a 30-m resolution, and the precipitation was interpolated to 30-m resolution. The vector data of the river extracted from 1:1,000,000 topographic map was converted into a grid raster and the resolution was far less than 30 m. The population was in 1-km resolution grid data, and GDP and food production were assigned according to administrative district and land cover/use data. For this reason, the calculated result did not have an accuracy of 30 m. In the future, we may further improve the resolution accuracy of the data source to improve the accuracy of the results.
The report of the Hebei Provincial Water Conservancy Bureau was plain text without a map, which may be due to the backwardness of the office concept here. We compare the description of the text with the map of this article. Due to the lack of precision of the source text in the government reports, it is hardly possible to figure out “consistent” data. Therefore, when the text description was consistent with the map we calculated, our result is marked as “basically consistent,” while when the text description was not consistent with the map we calculated, our result was marked as “inconsistent.” The validation results show that the flood hazard trigger factor can reflect the precipitation characteristics of this area and have the same trigger impact to these two floods. Since the DEM, land use/cover, and economic data we used were quite recent, the topographical features changed very little, causing potential hazards to also change very little. According to the Shijiazhuang Municipal Bureau of Statistical Yearbook, the population changed from 1996 to 2016 in different districts, and the distribution of GDP had tremendous changes, but the output of cultivated land changed very little. These created the different validating results of flood vulnerability and flood risk map.

5.2. Conclusions

In this paper, we extended the risk assessment model proposed by Maskrey [33] in accordance with the situation of Shijiazhuang located in the transitional zone between Taihang Mountains and North China plain. There are three factors in our model: the flood hazard trigger factor, the flood hazard potential factor, and the flood vulnerability factor. The response of land cover type to rainwater was analyzed as flood hazard factor, and the reciprocal method was applied in the consistency of the factors. We construct the flood risk index with the highest precision data in open data, and we used AHP, a semi-quantitative decision analysis method, to determine the weight of each flood risk index. Evaluation results have a reference value, which can be used as a reference for assessing the flood risk in this study area, and this model is suitable for the weather, terrain, and economic conditions here.
According to the method of constructing parameters, the flood hazard trigger factor can be considered as comprehensive characteristics of precipitation in June, July, August, and September. The flood hazard potential factor was generally the terrain characteristics and the flood vulnerability factor was generally the economic characteristics. Flood risk was the combined result of the above three factors.

Author Contributions

Conceptualization, Q.L.; methodology, Q.L.; software, Q.L. and H.Y.; validation, M.L. and R.S.; investigation, H.Y. and R.S.; data curation, Q.L.; writing—original draft preparation, Q.L.; writing—review and editing, M.L.; visualization, Q.L. and H.Y.; supervision, J.Z.; project administration, J.Z.

Funding

This research received no external funding.

Acknowledgments

We are grateful to the open data department, which we have listed in the article. We wish to thank Shikai Song for his help to our analysis.

Conflicts of Interest

The authors declare no conflict of interest.

References

  1. Rosenfeld, D. Suppression of rain and snow by urban and industrial air pollution. Science 2000, 287, 1793–1796. [Google Scholar] [CrossRef] [PubMed]
  2. Grimm, N.B.; Faeth, S.H.; Golubiewski, N.E.; Redman, C.L.; Wu, J.; Bai, X.; Briggs, J.M. Global change and the ecology of cities. Science 2008, 319, 756–760. [Google Scholar] [CrossRef] [PubMed]
  3. Guo, E.; Zhang, J.; Ren, X.; Zhang, Q.; Sun, Z. Integrated risk assessment of flood disaster based on improved set pair analysis and the variable fuzzy set theory in central Liaoning Province, China. Nat. Hazards 2014, 74, 947–965. [Google Scholar] [CrossRef]
  4. Li, G.; Xiang, X.; Tong, Y.; Wang, H. Impact assessment of urbanization on flood risk in the Yangtze River Delta. Stoch. Environ. Res. Risk Assess. 2013, 27, 1683–1693. [Google Scholar] [CrossRef]
  5. Castillo-Rodríguez, J.T.; Escuder-Bueno, I.; Altarejos-García, L.; Serrano-Lombillo, A. The value of integrating information from multiple hazards for flood risk analysis and management. Nat. Hazards Earth Syst. Sci. 2014, 14, 379–400. [Google Scholar] [CrossRef]
  6. Narayan, S.; Hanson, S.; Nicholls, R.J.; Clarke, D.; Willems, P.; Ntegeka, V.; Monbaliu, J. A holistic model for coastal flooding using system diagrams and the Source-Pathway-Receptor (SPR) concept. Nat. Hazards Earth Syst. Sci. 2012, 12, 1431–1439. [Google Scholar] [CrossRef] [Green Version]
  7. Hsu, W.-K.; Huang, P.; Chang, C.; Chen, C.; Hung, D.; Chiang, W. An integrated flood risk assessment model for property insurance industry in Taiwan. Nat. Hazards 2011, 58, 1295–1309. [Google Scholar] [CrossRef]
  8. Mani, P.; Chatterjee, C.; Kumar, R. Flood hazard assessment with multiparameter approach derived from coupled 1D and 2D hydrodynamic flow model. Nat. Hazards 2013, 70, 1553–1574. [Google Scholar] [CrossRef]
  9. Peng, X.; Tong, J.; Lorenz, K. Hydrologic/Hydraulic Modeling and Flood Risk Analysis For The West Tiaoxi Catchment, Taihu Lake Region, China. Chin. Geogr. Sci. 2000, 10, 309–318. [Google Scholar]
  10. Zhang, Y.-L.; You, W.-J. Social vulnerability to floods: A case study of Huaihe River Basin. Nat. Hazards 2013, 71, 2113–2125. [Google Scholar] [CrossRef]
  11. Chen, Y.-R.; Yeh, C.-H.; Yu, B. Integrated application of the analytic hierarchy process and the geographic information system for flood risk assessment and flood plain management in Taiwan. Nat. Hazards 2011, 59, 1261–1276. [Google Scholar] [CrossRef] [Green Version]
  12. Stefanidis, S.; Stathis, D. Assessment of flood hazard based on natural and anthropogenic factors using analytic hierarchy process (AHP). Nat. Hazards 2013, 68, 569–585. [Google Scholar] [CrossRef]
  13. Wang, Y.; Li, Z.; Tang, Z.; Zeng, G. A GIS-Based Spatial Multi-Criteria Approach for Flood Risk Assessment in the Dongting Lake Region, Hunan, Central China. Water Resour. Manag. 2011, 25, 3465–3484. [Google Scholar] [CrossRef]
  14. Wu, Y.; Zhong, P.; Zhang, Y.; Xu, B.; Ma, B.; Yan, K. Integrated flood risk assessment and zonation method: A case study in Huaihe River basin, China. Nat. Hazards 2015, 78, 635–651. [Google Scholar] [CrossRef]
  15. Wang, Y.; Wang, D.; Wu, J.; Chen, X.; Ma, H.; Wang, G. Risk Assessment for a Flood Control Engineering System Using Fuzzy Theory: A Case in China. Hum. Ecol. Risk Assess. Int. J. 2013, 19, 400–409. [Google Scholar] [CrossRef]
  16. Saaty, T.L. What is the Analytic Hierarchy Process? In Mathematical Models for Decision Support; Mitra, G., Greenberg, H.J., Lootsma, F.A., Rijkaert, M.J., Zimmermann, H.J., Eds.; Springer: Berlin/Heidelberg, Germany, 1988; pp. 109–121. [Google Scholar]
  17. Durbach, I.; Lahdelma, R.; Salminen, P. The analytic hierarchy process with stochastic judgements. Eur. J. Oper. Res. 2014, 238, 552–559. [Google Scholar] [CrossRef]
  18. Saaty, T.L.; Vargas, L.G. Models, Methods, Concepts & Applications of the Analytic Hierarchy Process; International Series in Operations Research & Management Science; Springer: New York, NY, USA, 2012. [Google Scholar]
  19. Vaidya, O.S.; Kumar, S. Analytic hierarchy process: An overview of applications. Eur. J. Oper. Res. 2006, 169, 1–29. [Google Scholar] [CrossRef]
  20. Ho, W.; Ma, X. The state-of-the-art integrations and applications of the analytic hierarchy process. Eur. J. Oper. Res. 2018, 267, 399–414. [Google Scholar] [CrossRef]
  21. Kuang, W.; Yang, T.; Yan, F. Regional urban land-cover characteristics and ecological regulation during the construction of Xiong’an New District, Hebei Province, China. Acta Geogr. Sin. 2017, 72, 947–959. (In Chinese) [Google Scholar]
  22. Li, L.; Guo, Q.; Cheng, L. The Building of Xiong’an New Area and Beijing-Tianjin-Hebei World-Class Urban Agglomerations. Nankai J. 2017, 22–31. (In Chinese) [Google Scholar]
  23. Zhao, J.; Yu, K.; Li, D. Spatial characteristics of local floods in Beijing urban area. Urban Water J. 2014, 11, 557–572. [Google Scholar] [CrossRef]
  24. Wang, Y.; Liu, D.; Zhang, D.; Yao, W.; Wang, C. A Case Study of Assimilating Lightning-Proxy Relative Humidity with WRF-3DVAR. Atmosphere 2017, 8, 55. [Google Scholar] [CrossRef]
  25. Jun, H.; Lu, C. Change of Rainstorm and Extreme Value of Precipitation in Different Periods in Shijiazhuang. Arid Zone Res. 2013, 30, 796–801. (In Chinese) [Google Scholar]
  26. Qingwen, D.; Yingxin, Z. Mesoscale Convective Cloud Cluster Analysis of the Torrential Rain in August 1996. Meteorol. Mon. 1997, 23, 39–43. (In Chinese) [Google Scholar]
  27. Hou, R.; Jing, H.; Chen, X.; Pei, Y. Numerical simulation and analysis of cloud microphysics structure of windward slope rainfall in Taihang Mountain. Sci. Meteorol. Sin. 2010, 30, 351–357. (In Chinese) [Google Scholar]
  28. Wang, C.; Yu, X.; Li, Z.; Li, J.; Wang, J. Investigation of Extreme Flash-Rain Events on the Impact of Taihang Mountain. Meteorol. Mon. 2017, 43, 425–433. (In Chinese) [Google Scholar]
  29. Tao, B.; Huang, G.; Wang, X.; Liu, Z. Observed Change of Extreme Climatic Events in Shijiazhuang. Arid Zone Res. 2012, 29, 660–666. (In Chinese) [Google Scholar]
  30. Zhenqiu, R. Check of the forecast of a rainstorm in south area of Hebei province in 1996. Meteorol. Mon. 1997, 23, 21–26. (In Chinese) [Google Scholar]
  31. Sun Yulong, Z.S.; Zhao, T.; Chen, X. Assessment and evaluation of extraordinary rainstorm of July 19 in Hebei Province. China Water Resour. 2018, 3, 44–45. (In Chinese) [Google Scholar]
  32. Chen, J.; Liao, A.; Chen, J.; Peng, S.; Chen, L.; Zhang, H.; National Geomatics Center of China; Sanya Surveying and Mapping Technology Center of Development and Service NASG; Beijing Normal University. 30-meter GlobalLand cover data product- Globe Land30. Geomat. World 2017, 21, 1–8. (In Chinese) [Google Scholar]
  33. Maskrey, A. Disaster Mitigation: A Community Based Approach; Oxfam: Oxford, UK, 1989. [Google Scholar]
  34. Onyutha, C. Hydrological Model Supported by a Step-Wise Calibration against Sub-Flows and Validation of Extreme Flow Events. Water 2019, 11, 244. [Google Scholar] [CrossRef]
  35. Onyutha, C. On Rigorous Drought Assessment Using Daily Time Scale: Non-Stationary Frequency Analyses, Revisited Concepts, and a New Method to Yield Non-Parametric Indices. Hydrology 2017, 4, 48. [Google Scholar] [CrossRef]
  36. Oliver, M.A.; Webster, R. Kriging: A method of interpolation for geographical information systems. Int. J. Geogr. Inf. Syst. 1990, 4, 313–332. [Google Scholar] [CrossRef]
  37. Jain, A.; Nandakumar, K.; Ross, A. Score normalization in multimodal biometric systems. Pattern Recognit. 2005, 38, 2270–2285. [Google Scholar] [CrossRef] [Green Version]
  38. Li, Y.; Nigh, T. GIS-based prioritization of private land parcels for biodiversity conservation: A case study from the Current and Eleven Point Conservation Opportunity Areas, Missouri. Appl. Geogr. 2011, 31, 98–107. [Google Scholar] [CrossRef]
  39. Li, W.; Wang, W.; Zhou, Y.; Ma, Y.; Zhang, D.; Sheng, L. Occurrence and Reverse Transport of Severe Dust Storms Associated with Synoptic Weather in East Asia. Atmosphere 2018, 10, 4. [Google Scholar] [CrossRef]
  40. Mu, W.; Yu, F.; Xie, Y.; Liu, J.; Li, C.; Zhao, N. The Copula Function-Based Probability Characteristics Analysis on Seasonal Drought & Flood Combination Events on the North China Plain. Atmosphere 2014, 5, 847–869. [Google Scholar] [Green Version]
Figure 1. Geographical location, topography, and artificial surfaces of Shijiazhuang.
Atmosphere 10 00104 g001
Figure 2. Urban waterlogging of Shijiazhuang caused by heavy rains in recent years.
Atmosphere 10 00104 g002
Figure 3. Land use/cover raster of Shijiazhuang.
Atmosphere 10 00104 g003
Figure 4. Flood hazard trigger factor map of Shijiazhuang.
Atmosphere 10 00104 g004
Figure 5. Flood disaster potential factor map of Shijiazhuang.
Atmosphere 10 00104 g005
Figure 6. Flood vulnerability factor map of Shijiazhuang.
Atmosphere 10 00104 g006
Figure 7. Flood risk map of Shijiazhuang.
Atmosphere 10 00104 g007
Table 1. Buffer distance and risk value.
Buffer LevelBuffer Distance (m)Degrees of Risk Value
1141
290.8
350.55
450.25
550.05
Table 2. n values versus RI values.
n1234567891011
RI0.000.000.580.901.121.241.321.411.451.491.52
Table 3. Factor of land cover types.
Land TypeForestGrasslandCultivated LandArtificial SurfacesWetlandWater Body
Risk factor0.06120.11930.19020.3450.53571
Table 4. Calibrated by AHP.
Object HierarchyFactor HierarchySingle Hierarchy WeightsIndex HierarchySingle Hierarchy WeightsTotal Hierarchy Weights
Flood disaster riskFlood hazard trigger factor0.5714T10.45900.2623
T20.22950.1311
T30.12160.0695
T40.12160.0695
T50.06840.0391
Flood hazard potential factor0.2857P10.41540.1187
P20.24970.0713
P30.14500.0414
P40.14500.0414
P50.04490.0128
Flood vulnerability factor0.1429V10.63700.0910
V20.25830.0369
V30.10470.0150
Table 5. Historical records of flood disaster in Shijiazhuang since 1949.
YearThe Historical Flood DisasterFlood Hazard Trigger MapFlood Hazard Potential MapFlood Vulnerability MapFlood Risk Map
1996Flood caused by torrential rain. Some mountainous areas and flood-stricken areas have suffered severe disasters.Basically consistentBasically consistentThe mountain areas are basically consistent, and the urban and cultivated areas are inconsistent.The mountain areas are basically consistent, and the urban and cultivated areas are inconsistent.
2016Flood caused by torrential rain. Urban waterlogging happened in the urban area. Some mountainous areas and flood-stricken areas have suffered severe disasters.Basically consistentBasically consistentBasically consistentBasically consistent

