On the Constellation Design of Multi-GNSS Reflectometry Mission Using the Particle Swarm Optimization Algorithm


1
School of Geodesy and Geomatics, Wuhan University, 129 Luoyu Road, Wuhan 430079, China
2
State Key Laboratory of Information Engineering in Surveying, Mapping, and Remote Sensing (LIESMARS), Wuhan University, Wuhan 430079, China
3
Key Laboratory of Geospace Environment and Geodesy, Ministry of Education, 129 Luoyu Road, Wuhan 430079, China
*
Authors to whom correspondence should be addressed.
Atmosphere 2019, 10(12), 807; https://doi.org/10.3390/atmos10120807
Submission received: 5 November 2019
/
Revised: 27 November 2019
/
Accepted: 11 December 2019
/
Published: 13 December 2019
(This article belongs to the Special Issue GNSS Meteorology and Climatology)
Abstract
:Due to the great success of the CYclone Global Navigation Satellite System (CYGNSS) mission, the follow-on GNSS Reflectometry (GNSS-R) missions are being planned. In the perceivable future, signal sources for GNSS-R missions can originate from multiple global navigation satellite systems (GNSSs) including Global Positioning System (GPS), Galileo, GLONASS, and BeiDou. On the other hand, to facilitate the operational capability for sensing ocean, land, and ice features globally, multi-satellite low Earth orbit (LEO) constellations with global coverage and high spatio-temporal resolutions should be considered in the design of the follow-on GNSS-R constellation. In the present study, the particle swarm optimization (PSO) algorithm was applied to seek the optimal configuration parameters of 2D-lattice flower constellations (2D-LFCs) composed of 8, 24, 60, and 120 satellites, respectively, for global GNSS-R observations, and the fitness function was defined as the length of the time for the percentage coverage of the reflection observations reaches 90% of the globe. The configuration parameters for the optimal constellations are presented, and the performances of the optimal constellations for GNSS-R observations including the visited and the revisited coverages, and the spatial and temporal distributions of the reflections were further compared. Although the results showed that all four optimized constellations could observe GNSS reflections with proper temporal and spatial distributions, we recommend the optimal 24- and 60-satellite 2D-LFCs for future GNSS-R missions, taking into account both the performance and efficiency for the deployment of the GNSS-R missions.
1. Introduction
Over the past few decades, global navigation satellite systems (GNSSs) have been successfully applied for positioning, navigation, and timing as well as for Earth remote sensing. Particularly, GNSS-Reflectometry (GNSS-R) is an innovative remote sensing technique that uses the GNSS signals reflected from the Earth’s surface to derive a variety of geophysical parameters [1,2]. The application of GNSS reflectometry data for the ocean altimetry was first proposed by Martin-Neira [3], and the global positioning system (GPS) reflected signals were used to sense the roughness of the reflecting surface, which was demonstrated by Garrison et al. [4]. At the same time, the first space-borne observation of an Earth-reflected GPS signal, which was obtained by the space shuttle spaceborne imaging radar-C (SIR-C) at an altitude of 200 km, was an initial measurement to scale GNSS-R measurements to obtain the expected signal-to-noise ratio (SNR) for estimating geophysical parameters [5]. Since then, several GNSS-R missions have been launched to verify the feasibility of this technique. The remote-sensing measurement using GPS reflection signals was later performed by the UK-Disaster Monitoring Constellation (UK-DMC) mission in 2004 [6]. A huge number of GNSS reflections have been acquired and further GNSS-R missions are inspired by this pioneering constellation, although the GPS reflections collected by this mission were not capable of demonstrating the robust capabilities of the GNSS-R technique as they are thinly dispersed [7,8]. The TechDemoSat-1 (TDS-1) satellite launched in 2014, which carries a GNSS-R instrument, has provided a key demonstration of the capabilities of GNSS-R to derive high-quality ocean surface winds [9]. Following the great success achieved by TDS-1, the U.S. CYclone Global Navigation Satellite System (CYGNSS), the first GNSS-R constellation composed of eight micro-satellites orbiting at a 35° inclination and 520 km altitude, was launched on December 15, 2016, and each CYGNSS satellite can track up to four parallel reflected GPS L1 signals [10]. Although this constellation was originally designed to measure the ocean wind speed in hurricanes and tropical cyclones, the GNSS-R data collected by it also contributes to other geophysical applications such as the measurements of soil moisture over land and ice thickness [11,12]. The development of different global navigation satellite systems including GPS, GLONASS, the Chinese BeiDou navigation system (BDS), and Galileo, have made the number of available satellites that can be used as platforms for GNSS-R signal sources increasing continuously in recent years, which gives potential for the use of multiple GNSS signals for GNSS-R. A Spanish experimental nanosatellite for both GNSS-R and GNSS Radio Occultation (RO) called 3Cat-2 was successfully launched in 2016, and this experimental satellite investigated the feasibility of the use of multi-GNSS signals for GNSS-R in the future [13].
Higher spatial and temporal resolutions of GNSS reflections, as an important component for designing a GNSS-R system, is a motivation for extensive research. Stosuis et al. [14] simulated six low Earth orbit (LEO) constellations for GNSS-R observations based on Walker constellation patterns and evaluated their performance for detecting six historic tsunami events. The results showed that the performance of the simulated constellation generally became better as the number of satellites and the orbit altitude increased. Zavorotny et al. [2] simulated a possible future GNSS-R constellation that consisted of 24 polar orbiting satellites, and the results demonstrate the global coverage of the GNSS-R observations provided by this constellation with an average revisit time of less than two hours over the globe. The potential performance of GNSS-R with four operational GNSS systems was first demonstrated by Gao et al. [15] and it was revealed that by considering the fusion of GPS, BDS, GLONASS, and Galileo, the spatio-temporal resolutions of GNSS reflections were improved substantially. Furthermore, Bussy-Virat et al. [16] investigated the relationship between the spatial resolution and the temporal one of GNSS-R observations, and analyzed their dependence on key orbit parameters of the LEO satellites.
As GNSS constellations were originally designed to meet the requirements for providing positioning, navigation, and timing services, and not for the GNSS-R observations, to exploit navigation signals sent from these GNSS constellations in a GNSS-R mission, the LEO constellation should be carefully designed so that the desired coverage and spatio-temporal resolutions of the reflection observations can be obtained. In most of the previous studies regarding the design of GNSS-R constellations, the spatial and temporal resolutions of the reflection observations obtained by certain fixed LEO constellation configurations was of concern [2,14]. Among the few studies that aimed to find an optimal LEO configuration for the GNSS-R observations, the variable separation method is usually used [14]. Some evolutionary algorithms such as the particle swarm optimization (PSO) algorithm and the genetic algorithm (GA) have been developed in the fields of computational intelligence and evolutionary computation in recent years. Although it has been testified that these evolutionary algorithms are practical and effective in the optimal designs for the constellations of different scientific missions such as the constellations of the optimal global coverage of geometric dilution of precision (GDOP) [17], and the GNSS radio occultation (RO) constellations [18,19], they have not been applied in the optimization design of GNSS-R constellations. On the other hand, although the present representative operational GNSS-R mission, CYGNSS, is mainly aimed to study the ocean winds and waves in tropical cyclones, and so the LEO constellation was designed with low inclination orbits, it is expected that in the future, GNSS-R will be used to sense ocean, land, and ice features globally using larger constellations [2].
In this study, the optimal constellations for GNSS-R observations over the globe were developed using an evolutionary algorithm (i.e., the PSO algorithm), and the performance of the optimal constellations were evaluated using the coverages and the spatial and temporal distributions of the reflections. Section 2 describes the principles and the methods used in the optimization process. In Section 3, the optimal constellation configurations are presented and evaluated. Section 4 discusses the dependence of the visit coverages of the optimal constellations on the choice of the size of cells, and some conclusions are reached in Section 5.
2. Principles and Methods
CYGNSS is composed of eight LEO satellites [10], and a 24-satellite polar orbiting constellation was taken into consideration in the simulation work of Zavorotny et al. [2]. Considering that Cubesats have advantages in the development cost and time when compared with larger-size satellites for Earth observation, it is highly likely that in the near future, the LEO constellation in a GNSS-R mission will be composed of a large number of Cubesats [20]. Therefore, we also considered the LEO constellations composed of 60 satellites and 120 satellites. Thus, we carried out the optimal designs for 8-, 24-, 60-, and 120-satellite LEO constellations for GNSS-R observations in the present work. The constellation pattern, the evolutionary algorithm with implemented fitness function, the simulation scenario, and the criteria to evaluate the performance of GNSS reflections are presented in this section.
2.1. Low Earth Orbit Constellation Pattern
Walker constellations are considered for GNSS-R missions as they are able to provide good reflection point distributions [14]. A 2D-LFC can also be considered as a Walker constellation [21], and it has been verified that 2D-LFC outperforms other flower constellations in the spatial and temporal distributions of RO events for the design of LEO constellations in GNSS RO missions [19]. Therefore, in the present study, we adopted the 2D-LFC pattern when seeking the optimal configurations for GNSS-R missions.
To define a 2D-LFC, nine parameters are needed including three integer parameters and six continuous ones [21]. Among the three integer parameters, denotes the number of inertial orbit planes; denotes the number of satellites per orbit; while Nc denotes the phasing parameter, which governs the phasing distribution of the satellites in the constellation and satisfies . The six continuous parameters are the orbit altitude (a), the eccentricity (e), the inclination (i), the argument of perigee (w), the longitude of the ascending node (), and the initial mean anomaly of the first satellite of the constellation (). With the above nine parameters defined, the constellation configuration for a 2D-LFC can be expressed as follows, considering that all satellites are uniformly distributed in orbits [21]:
where denotes the i-th orbit, and denotes the j-th satellite in a certain orbit; and denote the longitude of the ascending node and the mean anomaly of the j-th satellite on the i-th orbital plane, respectively. In the regular pattern of the 2D-LFC, the satellites moving in the circular orbits might collide with each other. To avoid this problem, the constraint on the minimum approach distance between any two satellites, which is calculated based on the differences in the mean anomalies and the differences in the longitude of the ascending nodes of the two satellites, was considered as explained in [22], and the fitness value is set to maximum when this constraint condition is not satisfied in the optimization process.
2.2. Particle Swarm Optimization (PSO) Algorithm and Fitness Function
As one of the most popular evolutionary algorithms, the PSO algorithm has been used in a wide range of applications [23]. The concept of the PSO algorithm originates from the simulation of the social behavior of bird flocks searching for food, which is initially inspired by the fact that the birds’ trying to take advantage of sharing information of food position affects the whole swarm behavior. In the realization of the PSO algorithm, each bird is regarded as an initial particle that represents a possible solution in the search space, and these particles are simultaneously flying through the search space. To depict a specific particle, two vectors, a position vector and a velocity vector, are needed. The former vector represents the solution of the problem, while the latter one determines the position updated in the next iteration. For more details, refer to [19,23]. In the PSO algorithm, to search for the best solution, each particle keeps tracking the best position of its own and the whole swarm, according to the value of the fitness function (i.e., the fitness value). The updated position and velocity of the i-th particle in the (t + 1)-th iteration are as follows [23]:
where t and t + 1 denote the t-th and the (t + 1)-th iteration, respectively; and denote the position and the velocity of the i-th particle in the t-th iteration, respectively. and are the best position of the i-th particle and that of the whole swarm, respectively. and represent the random numbers uniformly distributed in [0,1] at each iteration. w is the inertia weight that controls the scope of the search space; and , respectively, denote how the individual and the social factor influence the velocity of the particle. Specifically, w = 0.9, = 1.5, and = 1.5 are applied in the present simulation [17,23].
The fitness function of an evolutionary algorithm plays a vital role in the optimization process, which dominates the optimal solution in the termination of the PSO algorithm. Considering that the key requirement of a GNSS-R mission can be quantified in terms of how quickly 90% of the region of interest is sampled by the measurement [16], here the fitness function is defined as:
Fitness function = Minimum length of time (percentage coverage ≥ 90%).
The region of interest in the present work is the whole globe. In the simulation, the globe was divided into 64,800 cells, each cell encompassing 1° in latitude and 1° in longitude. The dependence of the visit coverage on the choice of the size of the cells will be discussed in Section 4.
In the present simulation study, a particle in the PSO algorithm corresponded to a specific constellation configuration. For a certain number of LEO satellites, 30 different constellation configurations of 2D-LFC, which correspond to 30 particles of the initial swarm, are generated randomly in the first iteration of the simulation, which means that the initial positions and velocities of these 30 constellations (particles) are generated randomly. In the following iteration, each constellation configuration (particle) is evaluated with the fitness function expressed with Equation (4), and the position and velocity of each particle will be updated using Equations (2) and (3) based on the best position of this particle and that of the swarm which have been found so far. In this paper, the PSO process was iterated 60 times for each particle and the optimal constellation configuration that was found accordingly was the final solution. What needs to be mentioned is that the same results were obtained with different initial populations, which means that the optimization procedure does not show sensitive dependence on the initial swarm.
2.3. Simulation Scenario
Following Gao [15], the multi-GNSS signals from GPS, GLONASS, Galileo, and BDS were used as the signal sources for GNSS-R observations in the present simulation. What needs to be mentioned is that the four full operational GNSS constellations were all simulated based on their nominal constellation configurations presented in [24,25,26,27], considering that Galileo and BDS have not yet reached their full planned constellations until now, and the third generation of BDS was used. In the simulation, four steps were followed to determine the available reflected GNSS signals: (1) For each LEO satellite, the potentially available GNSS satellites for reflection observations were selected; (2) The positions of the specular reflection points could be calculated after the positions of the LEO and the GNSS satellites were determined; (3) As shown in Figure 1, only the specular points located within the minimum antenna gain could be contacted; and (4) Furthermore, only the locations of the specular points with 10 highest range corrected gain (RCG) were considered (see the detail of RCG in [16]). In addition, it should be mentioned that the LEO satellites were 3-axis stabilized and the antenna beam widths of the LEO satellites simulated in the present study were the same as that of the TDS-1 satellite, considering that the definitive beam widths of the CYGNSS mission have not been given [15].
2.4. The Criteria to Evaluate the Performance of the Optimal Constellations
To evaluate the performance of the optimal GNSS-R constellations, the spatial and temporal distribution characteristics of the GNSS reflections observed should be taken into consideration. The spatial distribution can be presented by the longitudinal and latitudinal distributions of the GNSS reflections. The temporal distribution is depicted using the mean revisit time, which is defined as the time interval between successive passes in one bin and is calculated by dividing the period with the number of continuous ground tracks on the Earth’s surface formed by the reflections [15].
3. Results and Discussion
3.1. The Configuration Parameters for the Optimal Constellations
By applying the PSO algorithm to search for the optimal configuration parameters for 8-, 24-, 60-, and 120-satellite 2D-LFCs for global GNSS-R observations, the four optimal constellations were obtained and are presented in Table 1.
From Table 1, it can be seen that the inclinations were generally high for the optimal 2D-LFCs as the number of the LEO satellites varied among 8, 24, 60, and 120. Specifically, the inclinations of the optimal 8- and 120-satellite LEO constellations were close to that of the sun synchronous orbiting satellite, and the optimal 24- and 60- satellite ones were composed of near polar orbiting satellites. In addition, the number of orbit planes for each of the four constellation configurations was optimized to the maximum value. To be specific, the optimized value for was 8 for the 8- and 24- satellite LEO constellations, while it was 10 for the 60- and 120-satellite LEO constellations. As stated in Section 2.1, the number of orbit planes was set to be less than or equal to 10 in the simulation for cost consideration. For a 2D-LFC composed of a certain number of satellites, the greater the orbit planes, the faster the coverage goal for GNSS-R observations will be reached. When comparing the fitness values of the four optimized constellations (i.e., the minimum lengths of time to reach the percentage coverage of 90%), the optimized 120-satellite LEO constellation took the shortest time of about 1 h, while the optimized 8-satellite LEO constellation took the longest time of about nine hours. What needs to be mentioned is that the fitness values of the optimized 60- and 120-satellite 2D-LFCs were very close, while the optimized 24-satellite 2D-LFC had a great improvement in fitness value when compared with the optimized 8-satellite 2D-LFC.
3.2. The Visited and the Revisited Coverages Obtained by the Optimal Constellations
The visited and the revisited coverages obtained by the optimal 8-, 24-, 60- and 120-satellite 2D-LFCs during one day are shown in Figure 2. As stated in Section 2.2, the length of the time for 90% visited coverage defines the fitness function in this study. The revisit coverage means the percentage of all the 1° × 1° cells that have been visited twice, and the temporal resolution of GNSS-R observations are usually evaluated by the length of the time corresponding to certain revisit coverage.
From Figure 2, it can be seen that for each of the four optimal constellations, the goal of 90% visited coverage was achieved within 24 hours, and the optimal 8-satellite LEO constellation took the longest time to achieve this goal. What needs to be noticed is that although the optimal 120-satellite configuration took the shortest time to achieve 90% coverage among the four optimal constellations, its improvement was not significant when compared with the optimal 24- and 60-satellite ones. Furthermore, the largest visited and revisited coverages of the optimal 24- and 60-satellite configurations all reached 100%, while the largest visited and revisited coverages of the optimal 120-satellite configuration were both 98%. This is due to the fact that no reflection data were obtained over the polar areas by this LEO constellation with sun-synchronous orbits. On the other hand, the launch cost was quite high for the optimal 8-satellite 2D-LFC, considering that eight launches were needed to deploy the satellites in eight different orbit planes. Taking into consideration the above issues, we recommend the optimal 24- and 60-satellite 2D-LFCs for future GNSS-R missions.
3.3. The Spatial and Temporal Distributions of the Reflections Obtained by the Optimal Constellations
The latitudinal and the longitudinal distributions of the average numbers of the GNSS reflections in the 1° × 1° cells obtained by the optimal constellations are shown in Figure 3. From Figure 3a, it can be seen that the latitude distribution pattern of the average numbers of GNSS reflections obtained by the four different optimal 2D-LFCs were similar (i.e., the numbers of the reflections are higher in high latitudes than in middle and low latitudes), and the peaks were related to the inclinations of the GNSS-R LEO satellites.
In comparison, the average numbers of GNSS reflections were generally uniformly distributed at different longitudes for all four optimal constellations, as shown in Figure 3b. More specifically, the average numbers of points fluctuated around the values of 40, 120, 300, and 600 for the optimal 8-, 24-, 60-, and 120-satellite 2D-LFCs, respectively. What needs to be mentioned is that Gao et al. [15] simulated the distribution of the GNSS-R reflection points observed by a LEO constellation with main orbit parameters similar to CYGNSS and found that there is a peak of average numbers of reflection points at 120° E, which was attributed to the denser reflections to BDS GEO and IGSO satellites in the Asia-Pacific region, while in our work, this peak did not exist. This could be due to the fact that both the LEO constellation configurations and the settings for the selection of observable reflections were different between Gao et al.’s and our studies. It is clear that missions that allow different simultaneous measurements and different antenna gain patterns will have different coverage statistics [16]. We followed [16] by using RCG values as the criteria to pick out the observable reflections and followed [2] by allowing 10 simultaneous measurements, which was different to that of Gao et al.’s simulation strategy. In Gao et al. [15], the available specular reflection points were selected based on the elevations and azimuths of the vectors between the reflections and the LEO satellites in the body-fixed coordinate system, and the azimuth and elevation ranges were obtained using the beam widths and face directions of the antennae.
The spatial distributions of the mean revisit time for the 1° × 1° cells of the optimal 8-, 24-, 60-, and 120-satellite 2D-LFCs are shown in Figure 4. It can be seen that the distribution patterns of the revisit time were similar to that of a 24-satellite polar orbiting constellation with each satellite tracking up to 10 GPS and Galileo measurements, as shown by [2]. For each optimal constellation, the mean revisit time in the high and middle latitudes was generally shorter than that in the low latitudes. Furthermore, due to the spatial distribution of the specular reflections caused by the LEO GNSS-R observatory’s orbit inclination 15, in each of the subfigures, a short revisit time was obtained at the high latitudes near to the orbit inclination angles of the GNSS-R LEO satellites, which is also consistent with [2]. The comparisons of the four subfigures revealed that the mean revisit time generally decreased with the increase in the number of the satellites. The mean value of the mean revisit time over the globe for the 8-, 24-, 60-, and 120-satellite LEO constellation was 4.376 h, 1.405 h, 0.545 h, and 0.257 h, respectively. This mean value corresponds to the time to finish the visit of each cell over the globe. The smaller the value, the more efficient for the GNSS-R mission to monitor the hurricanes and other natural disasters. It can also be seen from this mean value of each optimal constellation that the optimal 24-satellite constellation improved significantly when compared with the optimal 8-satellite one, while the improvement of the optimal 120-satellite constellation compared with the 60- satellite one was not so significant.
What needs to be mentioned is that as the BDS GEO and IGSO satellites were taken into consideration in our simulation, it can be expected that the reflections over the Asia-Pacific region would be denser when compared with other regions if all the reflections available can be measured with plenty of channels. Although Figure 3b shows that due to the selection criteria of the observable reflections applied in this simulation study, there was no distinct improvement in the number of observable reflections over the Asia-Pacific region. Figure 4a–d reveal that minor improvement in the time resolution of the reflections over this region when compared with other regions does exist.
4. Discussion
As stated in Section 2.2, to obtain the spatial coverage over the globe during certain time intervals, the globe was gridded spatially and the number of cells sampled over that interval of time calculated. For a certain LEO constellation configuration, the visit coverage of the optimal LEO constellation depends on the choice of the size of the cells, or the spatial resolution.
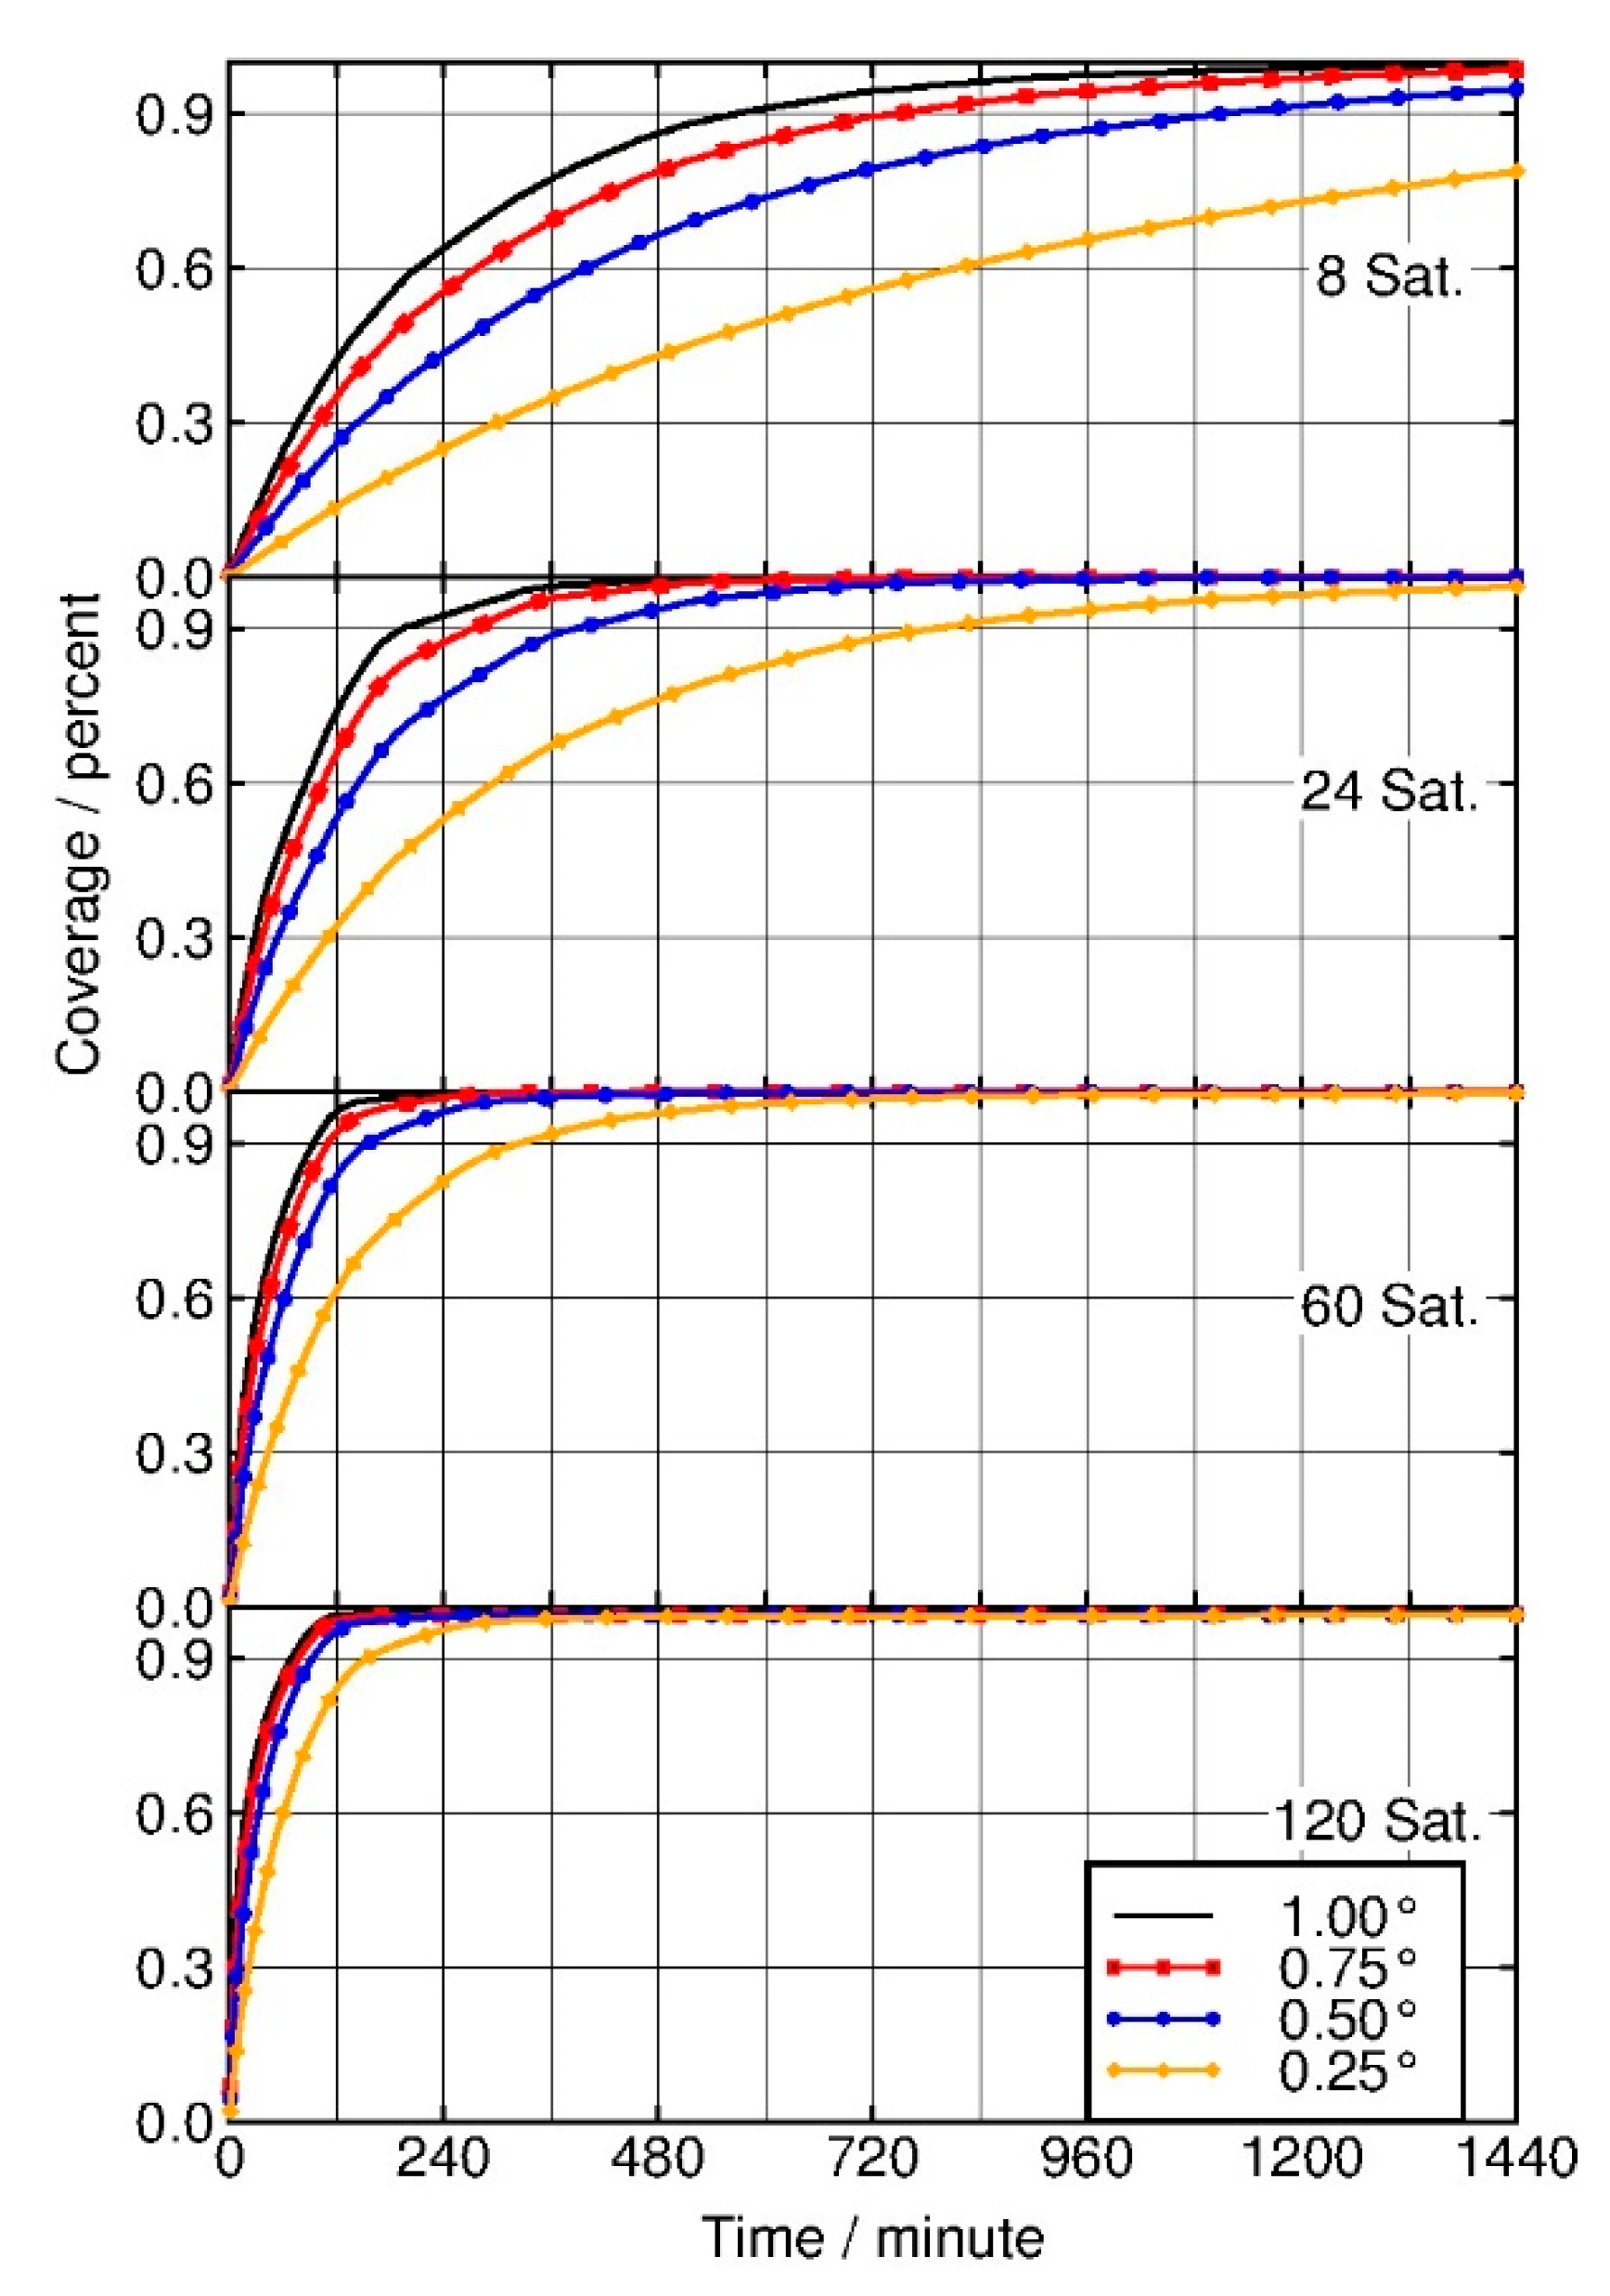
Figure 5 presents the coverage as a function of time during one day for different cell sizes (i.e., 1° × 1°, 0.75° × 0.75°, 0. 50° × 0.50°, and 0.25° × 0. 25°), obtained by the optimal 8-, 24-, 60-, and 120-satellite 2D-LFCs, respectively. It can be seen that for certain optimal constellations, the smaller the cell size, the longer the time for reaching the 90% coverage goal, which is consistent with [16]. While even with the smallest cell size, 0.25° × 0. 25°, the 90% coverage goal could be reached during one day for all the optimal 2D-LFCs, except for the 8-satellite one.
Figure 5 also shows that the larger the number of the LEO satellites, the less significant the dependence of the visit coverage on the choice of the cell size. Figure 2 presents that with the 1° × 1° cell size, the improvement in the visit coverage obtained by the optimal 120- satellite 2D-LFC when compared with that obtained by the 60-satellite was very slight. From Figure 5, it can be seen that although smaller cell sizes do bring a more discernible difference in the visit coverage obtained by the two optimal LEO constellations, the superiority of the optimal 120-satellite constellation was still not significant when compared with the 60-satellite.
Considering both the computing efficiency of the optimization process and the application of the GNSS-R mission in the monitoring of extreme weather phenomena such as hurricanes and tsunamis, it is desirable that the 90% coverage goal can be reached within one day. Therefore, following [15], 1° × 1° (latitude × longitude) cells were applied in this study.
Another issue that needs to be mentioned is that the results were obtained by using simulated data. The present study was focused on the optimization of the LEO constellation parameters, so other issues that might affect the reflection observations were simplified. Following [16], the differences between signal frequencies were not taken into consideration, and as stated in Section 2.3, only the locations of the specular points with the 10 highest RCG were considered, the LEO satellites were set as 3-axis stabilized, and the antenna beam widths of the LEO satellites were set the same as that of the TDS-1 satellite. As pointed out by [16], different settings on the number of simultaneous measurements and on the beam widths of the antennas will produce different coverage statistics, but the general conclusions of this study should be applicable to any mission generally employing GNSS-R reflectometry techniques. Furthermore, the errors in simulated orbits and multipath effects will inevitably cause errors in the positions of the specular reflection points when compared with real conditions, while it is impractical for us to perform officially sensitivity/uncertainty assessments on these issues [15].
5. Conclusions
The present work aimed to search for constellation configurations for the 8-, 24-, 60-, and 120-satellite 2D-LFCs that could provide optimal spatial and temporal distributions of GNSS-R observations over the globe. The navigation signals from the four GNSS systems including GPS, GLONASS, BDS, and Galileo, were exploited in the simulation. The PSO algorithm was applied with a fitness function, which presents the length of time for the percentage coverage of the reflection observations to reach 90% of the globe. The visited and the revisited coverages of the GNSS-R observations obtained by the optimal LEO constellations are presented. The performances of the optimal constellations were further compared using the spatial and temporal distributions of the reflections (i.e., the latitudinal and longitudinal variations of the average numbers of the GNSS-R specular reflection points and the spatial distribution of the mean revisit time).
The results show that all four optimized constellations can observe GNSS reflections with proper temporal and spatial distributions. We recommend the optimal 24- and 60-satellite 2D-LFCs for future GNSS-R missions, taking into account both the performance and efficiency for the deployment of GNSS-R missions.
Author Contributions
J.L. and X.X. conceptualized the initial idea and experimental design; Y.H. analyzed the data; Y.H., J.L., and X.X. wrote the main manuscript text; X.X. reviewed and edited the paper.
Funding
This research was funded by the National Natural Science Foundation of China (grant nos. 41774032 and 41774033), the National Key Research and Development Program of China (grant no. 2018YFC1503502), and the National Basic Research Program of China (973 Program) (grant no. 2013CB733302).
Conflicts of Interest
The authors declare no conflicts of interest.
References
- Jin, S.; Cardellach, E.; Xie, F. GNSS Remote Sensing: Theory, Methods and Applications; Springer: Dordrecht, The Netherlands, 2014; p. 276. [Google Scholar]
- Zavorotny, V.U.; Gleason, S.; Cardellach, E.; Camps, A. Tutorial on remote sensing using GNSS bistatic radar of opportunity. IEEE Geosci. Remote Sens. Mag. 2014, 2, 8–45. [Google Scholar] [CrossRef] [Green Version]
- Martin-Neira, M. A passive reflectometry and interferometry system (PARIS): Application to ocean altimetry. ESA J. 1993, 17, 331–355. [Google Scholar]
- Garrison, J.L.; Katzberg, S.J.; Hill, M.I. Effect of sea roughness on bistatically scattered range coded signals from the Global Positioning System. Geophys. Res. Lett. 1998, 25, 2257–2260. [Google Scholar] [CrossRef] [Green Version]
- Lowe, S.T.; LaBrecque, J.L.; Zuffada, C.; Romans, L.J.; Young, L.E.; Hajj, G.A. First spaceborne observation of an Earth-reflected GPS signal. Radio Sci. 2002, 37, 1–28. [Google Scholar] [CrossRef]
- Gleason, S.; Hodgart, S.; Sun, Y.; Gommenginger, C.; Mackin, S.; Adjrad, M.; Unwin, M. Detection and processing of bistatically reflected GPS signals from low earth orbit for the purpose of ocean remote sensing. IEEE Trans. Geosci. Remote Sens. 2005, 43, 1229–1241. [Google Scholar] [CrossRef] [Green Version]
- Clarizia, M.P.; Gommenginger, C.P.; Gleason, S.T.; Srokosz, M.A.; Galdi, C.; Di Bisceglie, M. Analysis of GNSS-R delay-Doppler maps from the UK-DMC satellite over the ocean. Geophys. Res. Lett. 2009, 36, 10–14. [Google Scholar] [CrossRef] [Green Version]
- Gleason, S. Space-based GNSS scatterometry: Ocean wind sensing using an empirically calibrated model. IEEE Trans. Geosci. Remote Sens. 2013, 51, 4853–4863. [Google Scholar] [CrossRef]
- Foti, G.; Gommenginger, C.; Jales, P.; Unwin, M.; Shaw, A.; Robertson, C.; Rosellõ, J. Spaceborne GNSS reflectometry for ocean winds: First results from the UK TechDemoSat-1 mission. Geophys. Res. Lett. 2015, 42, 5435–5441. [Google Scholar] [CrossRef] [Green Version]
- Ruf, C.S.; Atlas, R.; Chang, P.S.; Clarizia, M.P.; Garrison, J.L.; Gleason, S.; Katzberg, S.J.; Jelenak, Z.; Johnson, J.T.; Majumdar, S.J.; et al. New ocean winds satellite mission to probe hurricanes and tropical convection. Bull. Am. Meteorol. Soc. 2016, 97, 385–395. [Google Scholar] [CrossRef]
- Al-Khaldi, M.; Johnson, J.; O’Brien, A.; Balenzano, A.; Mattia, F. Time-Series Retrieval of Soil Moisture Using CYGNSS. IEEE Trans.Geosci. Remote Sens. 2019, 57, 4322–4331. [Google Scholar] [CrossRef]
- Mayers, D.; Ruf, C. Measuring Ice Thickness with Cygnss Altimetry. In Proceedings of the 2018 IEEE International Geoscience and Remote Sensing Symposium, Valencia, Spain, 22–27 July 2018; pp. 8535–8538. [Google Scholar]
- Carreno-Luengo, H.; Camps, A.; Via, P.; Munoz, J.F.; Cortiella, A.; Vidal, D.; Jane, J.; Catarino, N.; Hagenfeldt, M.; Palomo, P.; et al. 3Cat-2-An Experimental Nanosatellite for GNSS-R Earth Observation: Mission Concept and Analysis. IEEE J. Sel. Top. Appl. Earth Obs. Remote Sens. 2016, 9, 4540–4551. [Google Scholar] [CrossRef] [Green Version]
- Stosius, R.; Beyerle, G.; Helm, A.; Hoechner, A.; Wickert, J. Simulation of space-borne tsunami detection using GNSS-Reflectometry applied to tsunamis in the Indian Ocean. Nat. Hazards Earth Syst. Sci. 2010, 10, 1359–1372. [Google Scholar] [CrossRef] [Green Version]
- Gao, F.; Xu, T.; Wang, N.; Jiang, C.; Du, Y.; Nie, W.; Xu, G. Spatiotemporal evaluation of GNSS-R based on future fully operational global multi-GNSS and eight-LEO constellations. Remote Sens. 2018, 10, 67. [Google Scholar] [CrossRef] [Green Version]
- Bussy-Virat, C.D.; Ruf, C.S.; Ridley, A.J. Relationship between Temporal and Spatial Resolution for a Constellation of GNSS-R Satellites. IEEE J. Sel. Top. Appl. Earth Obs. Remote Sens. 2019, 12, 16–25. [Google Scholar] [CrossRef]
- Casanova, D.; Avendaño, M.; Mortari, D. Seeking GDOP-optimal Flower Constellations for global coverage problems through evolutionary algorithms. Aerosp. Sci. Technol. 2014, 39, 331–337. [Google Scholar] [CrossRef]
- Asgarimehr, M.; Hossainali, M.M. GPS radio occultation constellation design with the optimal performance in Asia Pacific region. J. Geod. 2015, 89, 519–536. [Google Scholar] [CrossRef]
- Xu, X.; Han, Y.; Luo, J.; Wickert, J.; Asgarimehr, M. Seeking optimal GNSS radio occultation constellations using evolutionary algorithms. Remote Sens. 2019, 11, 571. [Google Scholar] [CrossRef] [Green Version]
- Selva, D.; Krejci, D. A survey and assessment of the capabilities of Cubesats for Earth observation. Acta Astronaut. 2012, 74, 50–68. [Google Scholar] [CrossRef]
- Avendaño, M.E.; Davis, J.J.; Mortari, D. The 2-D lattice theory of Flower Constellations. Celest. Mech. Dyn. Astron. 2013, 116, 325–337. [Google Scholar] [CrossRef]
- Speckman, L.; Lang, T.; Boyce, W. An analysis of the line of sight vector between two satellites in common altitude circular orbits. In Proceedings of the Astrodynamics Conference, Portland, OR, USA, 20–22 August 1990; p. 2988. [Google Scholar]
- Eberhart, R.C.; Shi, Y. Particle swarm optimization: Developments, applications and resources. Proc. IEEE Conf. Evol. Comput. ICEC 2001, 1, 81–86. [Google Scholar]
- CSNO. BeiDou Navigation Satellite System Signal in Space Interface Control Document, Version 1.0; China Satellite Navigation Office: Beijing, China, 2018. [Google Scholar]
- DOD SPS, Department of Defense USA (2008) Global Positioning System Standard Positioning Service Performance Standard, 4th ed. Available online: http://www.gps.gov/technical/ps/2008-SPS-performancestandard (accessed on 6 January 2012).
- GLONASS. Interface Control Document ICD Navigational Radio Signal in Bands L1, L2, 5.1st ed.; GLONASS: Moscow, Russia, 2008. [Google Scholar]
- OS-SIS-ICD. European GNSS (Galileo) Open Service Signal in Space Interface Control Document, SISICD-2006; Eur Space Agency: Paris, France, 2010; issue 1:1. [Google Scholar]
Figure 1.
Geometry of the specular reflection points.

Figure 2.
Coverage and revisited coverage as a function of time during one day obtained by the optimal 8-, 24-, 60-, and 120-satellite 2D-LFCs, respectively. Black solid lines, blue dotted lines, and dashed lines represent the coverage, the revisited coverage, and 90% coverage (revisited coverage), respectively.

Figure 3.
Average numbers of the GNSS-R specular reflection points in the 1° × 1° grid cells at (a) different latitudes and (b) different longitudes obtained by the optimal 8-, 24-, 60-, and 120-satellite 2D-LFCs, respectively, during one day.
Figure 3.
Average numbers of the GNSS-R specular reflection points in the 1° × 1° grid cells at (a) different latitudes and (b) different longitudes obtained by the optimal 8-, 24-, 60-, and 120-satellite 2D-LFCs, respectively, during one day.
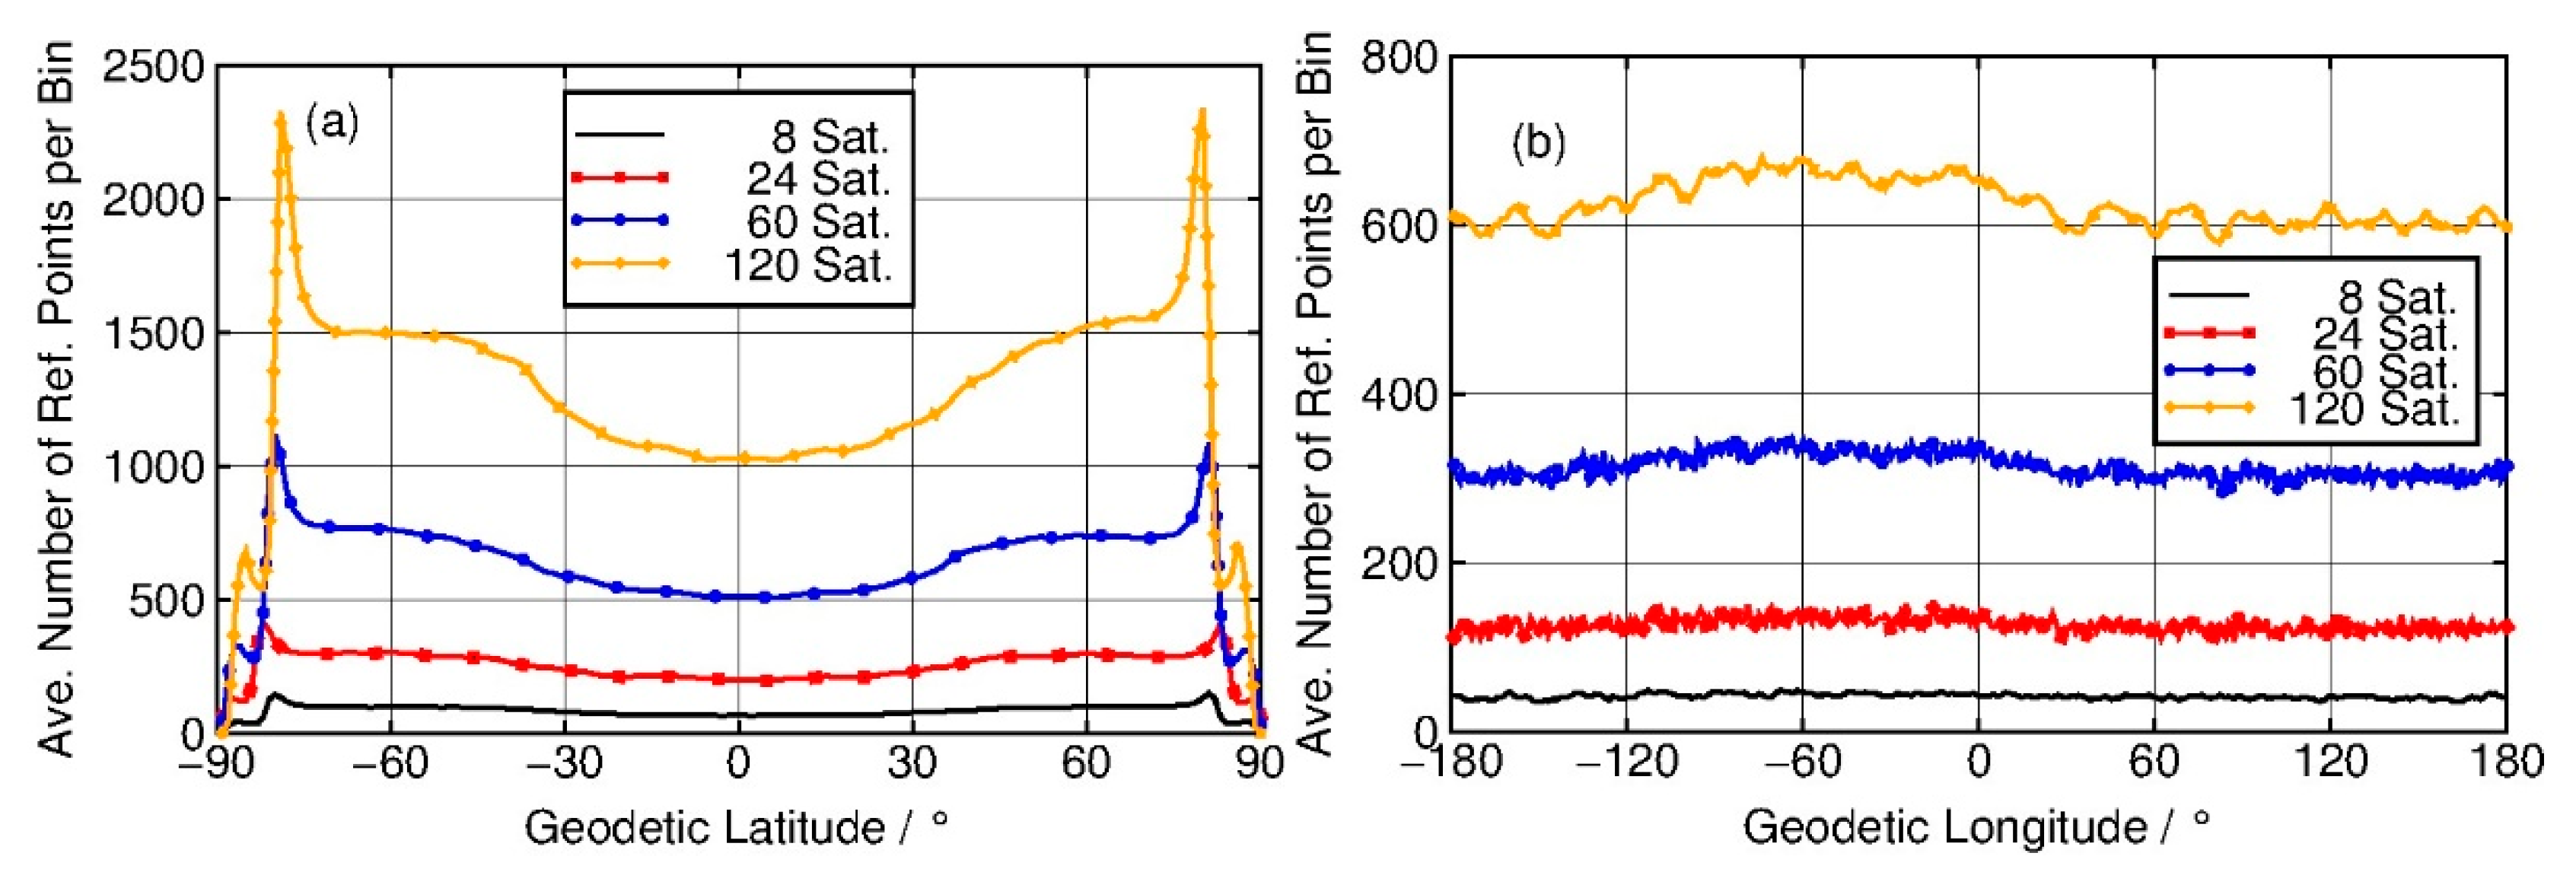
Figure 4.
The spatial distribution of the mean revisit time for the 1° × 1° grid cells of the optimal (a) 8-, (b) 24-, (c) 60-, and (d) 120-satellite 2D-LFCs, respectively, during one day.
Figure 4.
The spatial distribution of the mean revisit time for the 1° × 1° grid cells of the optimal (a) 8-, (b) 24-, (c) 60-, and (d) 120-satellite 2D-LFCs, respectively, during one day.

Figure 5.
Coverage as a function of time during one day for different cell sizes obtained by the optimal 8-, 24-, 60-, and 120-satellite 2D-LFCs, respectively.
Figure 5.
Coverage as a function of time during one day for different cell sizes obtained by the optimal 8-, 24-, 60-, and 120-satellite 2D-LFCs, respectively.

Table 1.
The configurations for the optimal 8-, 24-, 60-, and 120-satellite 2D-lattice flower constellations.
Table 1.
The configurations for the optimal 8-, 24-, 60-, and 120-satellite 2D-lattice flower constellations.
| Nsat | I (°) | No | Nso | Nc | Fitness Value (h) |
|---|---|---|---|---|---|
| 8 | 95.505 | 8 | 1 | 1 | 9.2575 |
| 24 | 86.627 | 8 | 3 | 2 | 3.0839 |
| 60 | 84.428 | 10 | 6 | 1 | 1.5376 |
| 120 | 97.035 | 10 | 12 | 1 | 1.1475 |
Note: Nsat, Nso, and Nc denotes the total number of satellites, the number of satellites per orbit, and the phasing parameter of the constellation, respectively.
© 2019 by the authors. Licensee MDPI, Basel, Switzerland. This article is an open access article distributed under the terms and conditions of the Creative Commons Attribution (CC BY) license (http://creativecommons.org/licenses/by/4.0/).
Share and Cite
MDPI and ACS Style
Han, Y.; Luo, J.; Xu, X. On the Constellation Design of Multi-GNSS Reflectometry Mission Using the Particle Swarm Optimization Algorithm. Atmosphere 2019, 10, 807. https://doi.org/10.3390/atmos10120807
AMA Style
Han Y, Luo J, Xu X. On the Constellation Design of Multi-GNSS Reflectometry Mission Using the Particle Swarm Optimization Algorithm. Atmosphere. 2019; 10(12):807. https://doi.org/10.3390/atmos10120807
Chicago/Turabian StyleHan, Yi, Jia Luo, and Xiaohua Xu. 2019. "On the Constellation Design of Multi-GNSS Reflectometry Mission Using the Particle Swarm Optimization Algorithm" Atmosphere 10, no. 12: 807. https://doi.org/10.3390/atmos10120807
Note that from the first issue of 2016, this journal uses article numbers instead of page numbers. See further details here.