Effect of Bulk Composition on the Heterogeneous Oxidation of Semi-Solid Atmospheric Aerosols


Department of Chemistry, West Virginia University, Morgantown, WV 26506, USA
*
Author to whom correspondence should be addressed.
Atmosphere 2019, 10(12), 791; https://doi.org/10.3390/atmos10120791
Submission received: 12 November 2019
/
Revised: 2 December 2019
/
Accepted: 4 December 2019
/
Published: 7 December 2019
(This article belongs to the Special Issue Nanoparticles in the Atmosphere)
Abstract
:The OH-initiated heterogeneous oxidation of semi-solid saccharide particles with varying bulk compositions was investigated in an atmospheric pressure flow tube at 30% relative humidity. Reactive uptake coefficients were determined from the rate loss of the saccharide reactants measured by mass spectrometry at different monosaccharide (methyl-β-d-glucopyranoside, C7H14O6) and disaccharide (lactose, C12H22O11) molar ratios. The reactive uptake for the monosaccharide was found to decrease from 0.53 ± 0.10 to 0.05 ± 0.06 as the mono-to-disaccharide molar ratio changed from 8:1 to 1:1. A reaction–diffusion model was developed in order to determine the effect of chemical composition on the reactive uptake. The observed decays can be reproduced using a Vignes relationship to predict the composition dependence of the reactant diffusion coefficients. The experimental data and model results suggest that the addition of the disaccharide significantly increases the particle viscosity leading to slower mass transport phenomena from the bulk to the particle surface and to a decreased reactivity. These findings illustrate the impact of bulk composition on reactant bulk diffusivity which determines the rate-limiting step during the chemical transformation of semi-solid particles in the atmosphere.
1. Introduction
Semi-solid organic aerosols represent a major fraction of mid-latitude atmospheric particulate matter [1,2]. Although there are large uncertainties concerning their composition and phase state, they are believed to be mainly biogenic secondary particles formed from forest fires, biomass burning, and biofuel combustion [3,4,5,6,7,8]. Chemical and physical changes due to the multiphase processes between the atmosphere and the particles have impacts on climate, air quality, visibility, and human health [2,9,10,11,12,13,14]. Due to the particle high viscosity (ranging from 102 to 1012 Pa s), such changes are limited by slow bulk diffusion over a long time-scale [15,16]. Models trying to predict the chemical evolution of the atmosphere are still limited by the fundamental understanding of how chemical composition affects particle reactivity [17].
Recent laboratory studies have investigated the impact of moisture-induced viscosity changes on the mechanisms of oxidative aging of semi-solid binary particles [16,18,19,20,21]. The reactive uptake γ (fraction of gas–particle collisions that leads to chemical reaction) exhibits a pronounced increase with relative humidity (RH). Such a trend is explained by a reduction of the particle viscosity due to the plasticizing effect of water [16]. Similar effects were observed in the case of multicomponent particles for which changing the mass fraction among two components at a fixed water composition greatly changes the particle reactivity [22,23,24,25,26]. For example, during the reaction of ozone with particles containing sucrose, maleic acid (MA, C2H4O4), and water, the MA reactive uptake coefficient for particles with a 5:1 sucrose:MA mass ratio at 35% RH was measured to be two orders of magnitude greater than that for particles with a 10:1 mass ratio at RH = 40% [22]. In this case, the addition of sucrose is expected to significantly increase the particle viscosity leading to a decrease of the particle reactivity. A study of the ozonolysis of highly viscous droplets of oleic acid (OL, C18H34O2) and stearic acid (SA, C18H36O2) using transmission electron microscopy reported that the OL uptake coefficient in 1:1 mass ratio particles was eight times smaller than that for pure OL particles [23]. No further changes in reactive uptake were observed for higher SA contents due to the fact of particle solidification. More recently, a study of the ozonolysis of OL using high-resolution time-of-flight aerosol mass spectrometry found that the ozone uptake coefficient decreased by two orders of magnitude as the ozone concentration was increased from 25 to 1100 ppb (parts per billons volume) [25]. The authors attributed this drastic change to the formation of high molecular-weight oligomer products which induces an increase in particle viscosity [25,26].
In semi-solid particles, the radial concentration gradient of the component concentration can be modeled using Fick’s law, where the diffusion coefficient D is a quantitative measurement of the propensity of a reactant to travel in the particle bulk. Because the heterogeneous process mostly occurs within a few nanometers of the particle surface [19,27,28,29], the transport process to the gas–solid interface will often be the rate limiting step of the chemical transformation. Changes in diffusion coefficients with composition are, therefore, likely to affect the reactive uptake coefficient. For a molecule traveling in a molecular matrix, the value of D is related to the bulk dynamic viscosity (Pa s) through the Stokes–Einstein (S–E) equation:
where is the Boltzmann constant, is the temperature, and is the radius of the diffusing molecule. Although the S–E equation has been shown to underpredict the diffusion coefficient for water molecules moving through viscous media [30,31,32], it is able to predict the diffusion coefficient for species with a molecular diameter larger than ~7 Å such as sucrose (C12H22O11) [33]. The particle viscosity and, therefore, the bulk transport properties will greatly depend on the composition. In a binary mixture containing a semi-volatile (sv) and a non-volatile (nv) component, the diffusion coefficient may be determined using the Vignes-type equation proposed by O’Meara et al. [34]:
where xsv is the molar fraction of the semi-volatile component, and and are the self-diffusion coefficients of the semi-volatile and non-volatile components, respectively.
Equation (2) is symmetric for Dsv and Dnv in order to maintain mass balance. In ternary mixtures, the dependence of the diffusion coefficients with composition is more complex due to the interaction of each component. The Maxwell–Stefan framework, which accounts for non-ideality, is believed to be more adapted for describing diffusion in multi-compound particles [35]. Nonetheless, in particles with a fixed molar fraction of the third component (e.g., water), Equation (2) may still provide an order of magnitude for the composition dependent diffusion coefficients, especially when there is a large difference between the self-diffusion coefficients of the two individual reactants. In this case, the x coefficients refer to the molar ratios of the diffusion constituents, excluding water.
The OH radical is one of the main atmospheric oxidants and is known to react at the surface and in the bulk of aerosols [36,37,38,39]. Although numerous investigations have looked at the effect of water on the OH reactive uptake coefficient [16,18,21,40,41,42,43,44], there is only a very limited amount of studies investigating the effect of reactant composition [27]. In a recent study, Jacobs et al. [27] employed aerosol mass spectrometry and X-ray spectroscopy to probe the bulk and surface reactivity of mixed squalane (C30H62) and octacosane (C28H58) particles. The reactivity of the particle bulk was found to be dependent on the particle composition. Particles with high octacosane content are slower to react with OH than particles with high squalane content. The results are interpreted by a decrease of the reactant diffusion coefficients as the viscosity of the particle increases. In order to reproduce the experimental data, the authors designed a model including plasticization of the particle bulk by the products [27]. In this case, the reaction products are found to diffuse faster than the initial reactant, leading to a decrease in the bulk viscosity. In addition, they found that for highly viscous particles, the surface was rapidly oxidized leading to a solid crust at the surface of the particle. These results strongly suggest that the chemical evolution of atmospheric aerosols may not be modeled by assuming well-mixed particles, and that the chemical and physical properties of atmospheric particles will change with oxidation time. For these reasons, experimental investigations over a wide range of compositions and viscosities are needed in order to fully understand the effect of chemical composition on particle transport properties and their effect on atmospheric chemistry [45].
In the present study, particles containing a monosaccharide, methyl-β-d-glucopyranoside (MGP, C7H14O6), and a disaccharide, lactose (C12H22O11) at a fixed water content were employed to investigate the effect of composition and viscosity on the OH-initiated oxidation of highly oxygenated atmospheric particles. In previous experiments [46], we investigated the heterogeneous transformation of liquid, mixed saccharide particles. In this case, diffusion was not the rate limiting step and partitioning between the bulk and the surface of the particle was found to play a significant role. At 30% RH, our previous study on semi-solid monosaccharide particles [16] showed that diffusion controls the heterogeneous process. Because the two saccharides have very different diffusion coefficients [47], a change in composition is expected to impact on the particle transport properties. In the present study, the composition of the particle bulk was varied by changing the mono-to-disaccharide ratio at fixed RH. The experiments were performed in an atmospheric pressure flow-tube reactor, and the aerosol chemical composition was monitored using both online and offline mass spectroscopy techniques as a function of OH exposure (the time-integrated OH concentration). The monosaccharide reactive uptake coefficient was obtained for mono-to-disaccharide molar ratios of 1:1, 2:1, 4:1, and 8:1. A diffusion–reaction kinetic model with a composition-dependent diffusion coefficient was developed in order to explain the observed decreased particle reactivity with increasing disaccharide molar fraction.
2. Experiments
The experiments were performed using an atmospheric pressure aerosol flow tube coupled to both online and offline analysis. Online measurements were performed using thermal vaporization coupled to vacuum-ultra-violet aerosol mass spectrometry (VUV-AMS) at the Chemical Dynamics Beamline at the Advanced Light Source (ALS) synchrotron. Offline experiments at West Virginia University were performed using a modified aerosol flow tube coupled to filter collection followed by aerosol extraction and analysis using gas chromatography coupled to mass spectrometry (GC-MS).
The apparatus at the ALS synchrotron has been described in previous studies and only a brief description is given here [16,48]. A schematic representation of the experimental setup at the ALS is displayed in Figure S1, reproduced from Smith et al. [49]. The saccharide aerosol was formed by nebulizing a 1 mg mL−1 saccharide aqueous solution with 1.0 L min−1 N2 using a constant-output atomizer (TSI, model 3076). The droplets passed through a room-temperature diffusion dryer to remove the water vapor and dry the particles. The residence time in the dryer was approximately 15 s leading to a RH of less than 10% [16]. A wet nitrogen flow was obtained by flowing 0.3 L min−1 N2 through a water bubbler and was added to a fraction (0.45 L min-1) of the dry aerosol. It was then mixed with dry flows of N2, O3, and O2 (5%). The resulting 1.0 L min−1 aerosol stream with a 30% RH entered a type-219 quartz flow tube reactor with an inner diameter of 2.5 cm and a length of 130 cm. The gas-phase RH was measured using a humidity probe before and after the flow tube. The ozone was generated by a commercial corona discharge ozone generator (OzoneLab Instruments). The maximum amount of O3 in the flow tube was 10 ppm. The OH radicals were generated by 254 nm photolysis of O3 in the presence of water vapor. The amount of OH radicals was varied either by controlling the concentration of ozone in the flow tube or by the number of UV lamps turned on. A flow of acetone gas (750 ppb) was injected in the flow tube in order to measure the OH exposure. The total reaction time was 37 s. Upon exiting the flow tube, a fraction of the sample flow was sent to a scanning mobility particle sizer (SMPS) for particle characterization. Another portion of the aerosol flow was sampled through an aerodynamic lens into an aerosol mass spectrometer coupled to the synchrotron’s VUV light for particle composition determination (See Figure S2). The resulting particle stream was vaporized by contact with a copper tip heated to 423 K at a pressure of 3 × 10⁻⁷ Torr. The resulting plume was ionized by 10.5 eV light and analyzed by time-of-flight mass spectrometry. At this tip temperature, only the monosaccharide was vaporized and detected. The remaining sample flow was sent to a gas chromatograph with flame ionization detection (GC-FID) for monitoring the acetone loss.
Figure 1 displays a schematic of the offline GC-MS experimental setup at WVU [46]. The saccharide particles were generated by nebulizing a 5 mg mL−1 saccharide aqueous solution using a constant output atomizer (TSI, model3076) with a 1.5 L min−1 N2 flow. The wet aerosol flow passed through a room-temperature diffusion dryer to dry the particles and remove the excess water vapor leading to a low RH. The diffusion dryer was a 47-inch long PTFE (polytetrafluoroethylene) tube with a 3-inch inner diameter (I.D.) filled with DRIERITE desiccant (≥98% CaSO4, <2% CoCl2). A 1/2 inch I.D. wire screen tube allowed the aerosol flow to pass through the dryer with a residence time of 6 s. The 1.5 L min−1 dry particle stream was mixed with a 0.65 L min−1 flow of wet N2 into a 3.0 L Erlenmeyer flask with an estimated residence time of 84 s. The 30% RH aerosol stream was then mixed with another 0.25 L min−1 wet N2, 0.15 L min−1 O2 (5%), variable amounts of O3, and dry N2. The total gas flow was maintained at 3.0 L min−1. The ratio of total humidified N2 flow over that of the total aerosol sample was kept to 0.3 from the mixing volume to the entrance of the flow tube. The additional mixing volume guarantied sufficient equilibrium time between the particle and the gas-phase water. The resulting flow was injected into a 45-inch long and 2-inch inner diameter quartz tube surrounded by three UV lamps (UVP, λ = 254 nm). Ozone was generated either by passing a 1.0 L min−1 O2 flow through an ozone generator (AC-500G, Ozone Solutions, 0.87 g/h) or by passing a 5.66 L min−1 O2 flow through a corona discharge ozone generator (CD2000P, ClearWater Tech, LLC., 27 g/h). The O3 concentration in the flow tube was varied by the O3 flow rate. The maximum amount of O3 in the flow tube was estimated to be 5 ppm. With a total flow through the reaction tube of 3.0 L min−1, the resident time was of the order of 46 s.
Upon exiting the flow tube, 0.3 L min−1 of the total flow passed through an ozone denuder before being sent to an SMPS (TSI, model 3936) for particle size distributions and concentration measurements. Another 0.05 L min−1 of the reacted flow passed through a packed potassium iodide tube to remove O3 before reaching the GC-FID for hexane measurement. The remaining of the particle flow (2.65 L min−1) passed through a PTFE (polytetrafluoroethylene) filter (Millipore FALP, 1.0 μm, diameter: 47 mm). A vacuum pump and an ozone denuder were placed after the filter to force the particle flow through the collection filter. The collection was performed for 30 min in order to collect approximately 1 mg of saccharide particles. Experiments were run with O3 and no UV lamps. No change in particle composition was observed with ozone alone.
Following the particle collection, the reactants and products were extracted from the PTFE filter by sonication using a mixture of ethanol and distilled water [46]. The samples were modified by silylation and analyzed by GC-MS. Details of the extraction, silylation, and analysis procedures are given elsewhere [46]. All the samples were analyzed in triplicate.
The OH exposure (the time-integrated OH concentration) quantifications have been described previously [16,46]. The hexane (acetone in the case of the ALS experiments) tracer was injected into the bottom 1/5 of the flow tube through a 1/8 inch I.D Teflon tube in order to obtain a detectable tracer concentration. The OH exposure for the whole flow tube was calibrated by injecting hexane first into the top of the flow tube and then separately through the bottom 1/5 of the flow tube at a relatively low O3 concentration. The correction factor was then applied to all OH exposure measurements. Under these flow conditions, the Reynolds number was lower than 120 and was characteristic of a fully established laminar flow. The injection of the tracer gas at the bottom of the tube was therefore only a small perturbation to the total flow. The decay of the relative hexane concentration was monitored by GC-FID. In both experiments, the OH exposure was obtained from the ratio of the tracer (acetone or hexane) signal with and without the photolysis lamps following the equation:
where is the initial concentration of tracer entering the flow tube, and is the final concentration of tracer exiting the flow tube after reaction with OH. The second-order rate constant () for OH + hexane reaction was 5.2 × 10⁻¹² cm3 s−1 [50], while that for OH + acetone was 2.31 × 10⁻¹³ cm3 s−1 [51]. The measured OH exposure values were found to be reproducible within ±10%.
For rapidly mixed particles, the reactant decay rate constant of a saccharide with OH radicals can be expressed using the following equation [52]:
where (cm3 s−1) is the second-order rate constant for OH oxidation of the saccharide, and are the initial and final number densities (cm−3) of saccharide in the particle phase, and is the OH exposure. For processes limited by bulk diffusion, Equation (4) is valid only at low OH exposure, for reaction with saccharide molecules initially in the outermost layers of the particle [16]. Within this range, the rate coefficient is obtained by fitting the reactant signal to an exponential decay. The aerosol reactivity can then be expressed in terms of the effective uptake coefficient γ for the loss of saccharide following [49]:
where is the number density of particles, M is the molecular weight of reactant within the particle, is the Avogadro’s number, is the mean surface-weighted particle diameter, and c is the mean speed of gas-phase OH. Uptake coefficients were corrected to account for the OH gas diffusion [49].
3. Modeling of the Particle Composition
A reaction–diffusion kinetic model based on ordinary differential equations (ode) was developed in order to investigate the effect of composition-dependent diffusion on the heterogeneous oxidation. The coupled partial differential equations were solved using the numerical solver pdepe in MATLAB [15,49]. The model outcome is the number of saccharide molecules as a function of radial position and reaction time.
The OH concentration at the particle surface was modeled using a multi-step uptake mechanism [28]:
where is the pseudo-first order rate coefficient of adsorption (10 s−1) [28], and is the rate coefficient of desorption (2.86 × 10¹⁰ s−1) [53]. The rate coefficients for OH reacting with lactose and MGP were set to their values in aqueous solution, 5.15 × 10⁻¹² cm3 s−1 [54] and 5.31 × 10⁻¹² cm3 s−1 [55], respectively. First, the gas-phase OH radicals adsorbed onto a surface site (one site per saccharide molecule at the surface). The adsorbed OH radicals may either desorb back into the gas phase or react by abstracting a hydrogen atom from the saccharides, producing water. The number density of OH adsorption sites was equal to the number density of saccharide at the surface. Once an OH radical was adsorbed, it led to a particle phase OH therefore regenerating the saccharide molecule. The mole fraction of surface site for MGP/lactose was the same as that of the bulk. The OH number densities were set to 1.35 × 1011 cm−3 for the online VUV-AMS experiment model and to 8.70 × 1010 cm−3 for the offline GC-MS analysis model. These values were selected in order to best reproduce the experimental OH exposure. The modeled OH exposure was the OH number density times the modelling reaction time. The diffusion coefficient of the OH radicals in the particle phase (DOH) was set to 1 × 10⁻⁹ cm2 s−1 which is close to its value in mixed citric acid (C6H8O7) and sucrose (C12H22O11) droplet at 30% RH [56]. The number densities and diffusion coefficients of the saccharide molecules were set to be radially homogeneous before the reaction. The particles were assumed to have spherical symmetry with a radius of 100 nm for the VUV-AMS analysis sample and 180 nm for the GC-MS analysis sample. The reaction–diffusion equations written using spherical polar coordinates are as follows:
A Vignes-type [57] equation was used to parametrize the diffusion coefficients of the saccharide molecules with composition [34]:
where and are the diffusion coefficients of MGP and lactose in a binary aqueous droplet at 30% RH, and is the MGP molar fraction. The value of was set to 6.00 × 10⁻¹³ cm2 s−1 which is 35 times higher than the diffusion coefficient of glucose established based on the S–E equation and using viscosity values from aqueous glucose at 30% RH [47]. The coefficient was set to the value of the sucrose diffusion coefficient established based on the S–E relationship using viscosities of aqueous-sucrose solutions at 30% RH [47]. Equation (10) was used solely to estimate the monosaccharide diffusion coefficient in the approximation of a binary particle. Rather than using the same value for both saccharides, the diffusion coefficient for the disaccharide was determined through the ratio of the hydrodynamic radii [58]. Simulation parameters and rate constants used in the models are shown in Table 1. The model is non-predictive; the model parameters presented in Table 1 were adjusted to match the experimental data.
4. Results and Discussion
Figure 2 displays the surface-weighted particle size distribution for semi-solid saccharide particles obtained in both online VUV-AMS (black, dashed line) and offline GC-MS analysis (red, dashed line). The saccharide profile was from an unreacted sample with a 1:1 molar ratio of the two saccharides. For the GC-MS analysis, in order to collect about 1 mg of sample in 30 min, the saccharide solution concentration was five times higher than that used for the VUV-AMS experiments. This resulted in a particle surface-weighted diameter of about 360 nm for the GC-MS analysis compared to 220 nm for the AMS analysis. The changes in particle size, number particle, and total mass are displayed in Figures S2–S6 (see Supplementary Material).
4.1. VUV-AMS Analysis
Figure 3 shows a VUV-AMS spectrum of unreacted equimolar MGP–lactose particles recorded at 10.5 eV photoionization energy. The five ion peaks employed to monitor the decay of the monosaccharide were m/z 60, m/z 73, m/z 121, m/z 144, and m/z 163 [16]. The disaccharide was not observable under these experimental conditions. The fragmentation of the saccharide upon ionization was previously discussed [16] and is characteristic of the MGP molecules.
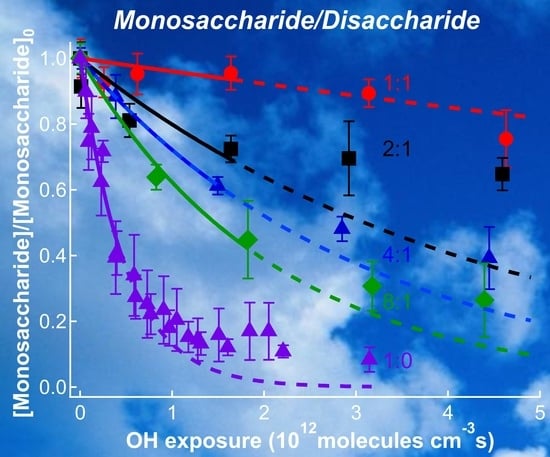
Figure 4 displays the relative abundance of MGP reactant remaining in the particle phase as a function of OH exposure at MGP:lactose molar ratios of 1:1 (red circles), 2:1 (black squares), 4:1 (blue filled triangles), and 8:1 (green diamonds). The reactant decay profiles for MGP particles at RH = 30% are also displayed (purple, open triangles) [16]. The relative MGP signal was an average of the five different mass fragments identified in the aerosol mass spectra (indicated in Figure 3). The signals at each mass fragment displayed identical decays, suggesting that contributions from reaction products were negligible [16]. The error bars were 2σ (two standard deviations) of the mean (MGP)/(MGP)0 ratio. The solid lines were exponential fits to the experimental data using Equation (4) for OH exposures below 2 × 1012 cm−3 s and extrapolated to higher values (dashed lines). This range was selected to minimize the fit residual. The rate constants and reactive uptake coefficients (calculated using Equation (5)) are displayed in Table 2.
At the lowest lactose molar ratio (green diamond in Figure 4), the MGP fraction already displayed a slower decay than that observed for pure MGP semi-solid particles at RH = 30% [16]. At low OH exposure, the MGP concentration decays exponentially, followed by a slower decay at higher OH exposure. The effective uptake coefficient for the 8:1 molar ratio in Table 1 was 0.53 ± 0.10 compared to 1.00 ± 0.30 (from Reference [16], corrected for gas diffusion) in the case of pure MGP particles. This suggests that a disaccharide molar fraction of 0.1 was sufficient to significantly change the reactivity of the particle toward oxidation. As the molar ratio of disaccharide increased (Figure 4), the uptake coefficient decreased to reach a value below 0.1 for equimolar monosaccharide/disaccharide particles. For a 2:1 molar fraction between the monosaccharide and the disaccharide, the experimental measurements at low OH exposure deviated from an exponential decay, likely leading to an overestimated uptake coefficient in Table 2.
The general trend observed in Figure 4 for mixed saccharide particles at a fixed RH was similar to that observed for MGP particles at RH ranging from 30% to 10% [16]. In the RH study, this behavior was attributed to a change in the saccharide diffusion coefficient with water activity. A similar change in monosaccharide diffusion coefficient may explain the sharp decrease of the MGP reactive uptake with increasing disaccharide molar fraction [22].
Figure 5 shows the modeled fractions of MGP remaining in the particle as a function of OH exposure for MGP:lactose molar ratios of 1:1 (red lines), 2:1 (black lines), 4:1 (blue lines), and 8:1 (green lines) superposed on the experimental data. The trend of the modeled profiles reproduces that observed in Figure 4. Deviations from the experimental data may, in part, be due to the water diffusion, especially at a high disaccharide molar ratio when the water diffusion is expected to be slower. Using a value of 1.0 × 10⁻¹² cm2 s−1 for the water diffusion coefficient at low RH [56], the equilibrium partitioning time was estimated to be of the order of 10 s [59]. This water diffusion characteristic time was long compared to the 37 s of total reaction time. A slow water diffusion from the particle surface to its core was likely to induce a steep gradient in the MGP diffusion coefficient which was not accounted for in the present model. Differences between the modeled and experimental decays may also be due to the accumulation of the reaction products and changes in viscosity.
Although lactose is not detectable using the VUV-AMS experiment, the model supports that it acts as an anti-plasticizer in the particle by increasing its viscosity and decreasing the diffusion coefficients of both saccharide reactants. In order to further understand the effect of the disaccharide content on the heterogeneous process, temporal profiles of both saccharides were recorded using filter collection and GC-MS analysis.
4.2. GC-MS Analysis
Figure 6 displays a GC-MS chromatogram obtained for the unreacted (black line in lower panel) and reacted (red line in upper) saccharide particles with an MGP:lactose molar ratio of 2:1 collected at 0.7 × 1012 cm−3 s OH exposure. The xylose tracer signals were used to normalize the saccharide signals among the different samples [46].
Figure 7 displays the relative abundances of the MGP (open circles) and lactose (filled squares) remaining in the particles as a function of OH exposure at MGP:lactose molar ratios of (a) 1:1 (red markers), (b) 2:1 (black markers), and (c) 4:1 (blue markers). The lines are modeled MGP (solid lines) and lactose (dashed lines) profiles. Because of the large particle size, the reactant decay profiles were not as pronounced as those displayed in Figure 4. The trend discussed in the previous paragraph was still observed: increasing the disaccharide molar fraction slowed down the heterogeneous oxidation of the monosaccharide. The large scattering in the experimental data was likely due to the larger particle size and a small change in reactant concentrations. For these reasons, uptake coefficients were not inferred from the experimental data. The modeled reactant fractions for MGP and lactose were superposed to the experimental data. The model traces were obtained using the same diffusion coefficient as those used in Figure 5 but with a different particle diameter. The space–time images of the MGP and lactose molar fractions are displayed in Figures S7 and S8. The model suggests that the reaction occurs only within few nanometers of the surface, and that a saccharide concentration gradient was established within the outermost 30 nm of the particle. The concentration of the inner core remained homogeneous through the reaction. The experimental and modeled traces displayed in Figure 7 confirm that an increase in the disaccharide molar ratio reduces the reactivity of both the mono- and disaccharide within the particle. The model suggests that the difference in relative decays, observed in Figure 5 and Figure 7 for similar saccharide molar ratios, was due to the difference in particle size. The trend displayed in Figure 7 cannot be reproduced using a smaller particle size.
Figure 8 displays the logarithm of the particle viscosity inferred using the modeled MGP diffusion coefficients and the Stock–Einstein equation for MGP:lactose molar ratios of (a) 1:1; (b) 2:1; and (c) 4:1. The modeled viscosity decreased by several orders of magnitude as the molar ratio of the disaccharide was lowered. In addition, for equimolar saccharide particles in Figure 8a, the viscosity remained almost unchanged during the entire reaction time, while a gradient appeared near the surface at lower disaccharide ratios. The model supports that an increase of disaccharide content in the particle bulk decreases the overall particle reactivity through a drastic change in particle viscosity.
In Figure 7c, for a 4:1 ratio, the decay of the disaccharide signal differs significantly from that of the monosaccharide. In order to reproduce the observed trend using the diffusion coefficients displayed in Table 1, the number density of lactose-reactive sites must be reduced by a factor of two compared to its value in the bulk. A difference in reactivity between the monosaccharide and the disaccharide has been observed previously in liquid droplets [46]. In this case, diffusion is no longer the rate limiting step and the thermodynamic properties of the components govern the concentration gradient between the bulk and the surface. Such partitioning may become observable as the particle viscosity decreases. In the case of α-pinene particle evaporation, liquid-like behavior was observed for viscosities as high as 105 Pa s [60]. Diffusion phenomena are thought to become significant for viscosities higher than 106 Pa s. The viscosity range displayed in Figure 7c suggests that for a 4:1 ratio, the particles may display a liquid-like behavior. For higher disaccharide molar fractions, mass transport remains the rate limiting step and the effect of partitioning will not be observable. In order to accurately model such phenomena, more sophisticated models are required [29,46], especially to validate the viscosity gradient near the interface. Nonetheless, the data displayed in Figure 7 and Figure 8 support an increase in viscosity with addition of the disaccharide. It is also interesting to note that at this saccharide ratio, glucose was detected as a product (Figure S7). As discussed in Reference [16], the glucose product is likely to migrate toward the interface and further react with the OH radicals.
In Figure 8c, for particles with a 4:1 molar ratio, faster decay of the monosaccharide reactant near the surface leads to a viscosity gradient. Formation of high viscosity layers was previously reported for semi-solid particles [16,27]. In this case, the particle reactivity becomes independent of the bulk diffusivity, as the reactant mass transport is limited by the highly viscous surface. For an 8:1 molar fraction (Figure 4 and Figure 5), partitioning between the bulk and the interface is also likely to affect the heterogeneous process. For liquid-like particles (molar ratios of 8:1 and 4:1), Equation (2) and the ode model may not be adapted to reproduce the heterogeneous process. Nonetheless, they provide a bases to discuss the observed decays.
5. Relevance for Atmospheric Chemistry
The present experiments were performed at a high OH number density and short reaction time, compared to the low number densities and long reaction times found in atmospheric processes. Although the experiments were performed at equivalent OH exposures, in the atmosphere, the component concentrations may have sufficient time to equilibrate throughout the particle. Houle et al. [45] investigated the relevance of laboratory studies to the investigation of heterogeneous atmospheric processes. The accuracy of the laboratory simulations is found to greatly depend on the limiting phenomena. Experimental simulations are found to be predictive when the heterogeneous process is limited by the transport of the OH radical to the particle surface. This will be the case for liquid, well-mixed particles. For semi-solid particles, for which the process is limited by the diffusion of the reactants in the particles, the experimental simulations were found to be qualitatively similar to the atmospheric processes, although not identical. The most difference between the simulation and the atmospheric chemistry was found when the OH and reactant transport were competitive. In order to quantify the preponderance of these two phenomena, Houle et al. [45] defined the reaction–diffusion index IRD:
Low IRD values are characteristic of heterogeneous processes limited by OH supply to the surface, while high values are characteristic of a particle diffusion-limited transformation. The organic mixing limited regime is defined as IRD > 100.
Using the values displayed in Table 1, the reaction–diffusion index of the studied particles ranged from 38 for pure MGP particles to 7600 for equimolar mono- and disaccharide particles. For mixed saccharide particles under our flow-tube conditions, the heterogeneous process was therefore fully limited by the diffusion of the saccharide reactants. In this case, Houle et al. [45] indicates that laboratory experiments, such as the one presented here, may be a reasonable proxy to investigate heterogeneous chemistry occurring in the atmosphere.
Semi-solid aerosols enter the atmosphere through anthropogenic and biogenic processes or are formed by the chemical reaction and condensation of volatile molecules. Their reactions with atmospheric oxidizers, such as the OH radical, lead to chemical aging and potentially to the release of new volatile components to the atmosphere. In addition, the optical properties of these aerosols will greatly depend on the chemical composition and physical structure of the particle surface [11,14]. In the present study, the uptake coefficients measured in semi-solid aerosols with varying particle compositions suggest that the molecular structure of the constituents greatly affect the particle reactivity. In the case of the highly oxidized saccharide, the addition of a small amount of the anti-plasticizer readily changes the mass transport process of both reactants in the bulk, leading to slower reactivity.
6. Conclusions
Measurements of the fraction of reactants remaining after OH-initiated heterogeneous oxidation of mixed semi-solid saccharide particles revealed that the monosaccharide reactive uptake coefficient decreased by a factor of 10 as the mole fraction of the disaccharide was increased from 0.1 to 0.5. Such behavior was expected in semi-solid particles, where bulk diffusion of the reactants is the rate-limiting step. A simplified reaction–diffusion model suggests that the monosaccharide and disaccharide diffusion coefficients were lowered due to the rapid rise of the viscosity with increasing disaccharide mole fraction. Upon detecting both the mono- and disaccharide, it was found that the diffusion coefficient of both saccharides was of the same order of magnitude in the particle bulk leading to similar temporal decays. As the viscosity was lowered, the disaccharide reactive profile deviated from that of the monomer. In this case, it was possible that the viscosity of the particle was sufficiently low to lead to partitioning of the disaccharide between the bulk and the particle surface. As the monosaccharide was more likely to migrate toward the surface of the particle, where most of the reaction occurs, it will decay faster than the disaccharide.
A Vignes relationship was applied to approximate the bulk diffusion within the particles’ fixed RH over a wide range of saccharide molar ratios. The model was capable of reproducing the change in bulk diffusion for the different particle compositions. The kinetics and model results provide valuable insights into the effect of composition on transport properties in semi-solid organic particles. This study provides a useful framework in order to predict the reactivity of mixed, highly oxidized atmospheric aerosols. More sophisticated models are required in order to fully understand the effect of the products and partitioning on the heterogeneous oxidation of semi-solid particles.
Supplementary Materials
The following are available online at https://www.mdpi.com/2073-4433/10/12/791/s1, Figure S1 Schematic representation of the atmospheric pressure flow reactor at the Advanced Light Source Synchrotron. Figure S2 Schematic view of the aerosol TOF-MS at the Advanced Light Source synchrotron. Figure S3: VUV-AMS analysis particle sample measurement result. Absolute surface weighted diameter as a function of OH exposure. Figure S4: VUV-AMS analysis particle sample measurement result. Relative single particle mass fraction remaining as a function of OH exposure. Figure S5: GC-MS analysis particle sample measurement result. Absolute surface weighted diameter as a function of OH exposure. Figure S6: GC-MS analysis particle sample measurement result. Relative single particle mass fraction remaining as a function of OH exposure. Figure S7: Modeled space–time plots of concentration of lactose for MGP:lactose molar ratios of (a) 1:1, (b) 2:1, and (c). Figure S8: Modeled space–time plots of concentration of MGP for MGP:lactose molar ratios of (a) 1:1, (b) 2:1, and (c). Figure S9: Normalized product glucose signal as a function of OH exposure identified in semi-solid MGP–lactose particles with a molar ratio of 4:1.
Author Contributions
Conceptualization, H.F. and F.G.; methodology, H.F.; formal analysis, H.F.; investigation, H.F. and F.G.; writing—original draft preparation, H.F.; writing—review and editing, F.G.; supervision, F.G.; project administration, F.G.; funding acquisition, F.G.
Funding
This research received no external funding.
Acknowledgments
We thank Nicole Richards-Henderson and Kevin Wilson for technical support of the experiments performed at the Advanced Light Source. This research used resources of the Advanced Light Source, a DOE Office of Science User Facility, which is supported by the Direct, Office of Science, Office of Basic Energy Sciences, the US Department of Energy under contract DE-AC02-05CH11231 at Lawrence Berkeley National Laboratory.
Conflicts of Interest
The authors declare no conflict of interest.
References
- Shiraiwa, M.; Li, Y.; Tsimpidi, A.P.; Karydis, V.A.; Berkemeier, T.; Pandis, S.N.; Lelieveld, J.; Koop, T.; Pöschl, U. Global distribution of particle phase state in atmospheric secondary organic aerosols. Nat. Commun. 2017, 8, 15002. [Google Scholar] [CrossRef] [PubMed] [Green Version]
- Baustian, K.J.; Wise, M.E.; Jensen, E.J.; Schill, G.P.; Freedman, M.A.; Tolbert, M.A. State transformations and ice nucleation in amorphous (semi-)solid organic aerosol. Atmos. Chem. Phys. 2013, 13, 5615–5628. [Google Scholar] [CrossRef] [Green Version]
- Kalberer, M.; Paulsen, D.; Sax, M.; Steinbacher, M.; Dommen, J.; Prevot, A.S.H.; Fisseha, R.; Weingartner, E.; Frankevich, V.; Zenobi, R.; et al. Identification of Polymers as Major Components of Atmospheric Organic Aerosols. Science 2004, 303, 1659–1662. [Google Scholar] [CrossRef] [PubMed] [Green Version]
- Russell, L.M.; Bahadur, R.; Ziemann, P.J. Identifying organic aerosol sources by comparing functional group composition in chamber and atmospheric particles. Proc. Nati. Acad. Sci. USA 2011, 108, 3516–3521. [Google Scholar] [CrossRef] [PubMed] [Green Version]
- Virtanen, A.; Joutsensaari, J.; Koop, T.; Kannosto, J.; Yli-Pirilä, P.; Leskinen, J.; Mäkelä, J.M.; Holopainen, J.K.; Pöschl, U.; Kulmala, M.; et al. An amorphous solid state of biogenic secondary organic aerosol particles. Nature 2010, 467, 824–827. [Google Scholar] [CrossRef] [PubMed]
- Saukko, E.; Lambe, A.; Massoli, P.; Koop, T.P.; Wright, J.R.; Croasdale, D.; Pedernera, D.B.; Onasch, T.; Laaksonen, A.; Davidovits, P.; et al. Humidity-dependent phase state of SOA particles from biogenic and anthropogenic precursors. Atmos. Chem. Phys. 2012, 12, 4447–4476. [Google Scholar] [CrossRef]
- Hand, J.L.; Malm, W.C.; Laskin, A.; Day, D.; Lee, T.; Wang, C.; Carrico, C.; Carrillo, J.; Cowin, J.P.; Collett, J., Jr.; et al. Optical, physical, and chemical properties of tar balls observed during the Yosemite Aerosol Characterization Study. J. Geophys. Res. 2005, 110, D21210. [Google Scholar] [CrossRef]
- Pósfai, M.; Gelencsér, A.; Simonics, R.; Arató, K.; Li, J.; Hobbs, P.V.; Buseck, P.R. Atmospheric tar balls: Particles from biomass and biofuel burning. J. Geophys. Res. 2004, 109, D06213. [Google Scholar] [CrossRef] [Green Version]
- Reid, J.P.; Bertram, A.K.; Topping, D.O.; Laskin, A.; Martin, S.T.; Petters, M.D.; Pope, F.D.; Rovelli, G. The viscosity of atmospherically relevant organic particles. Nat. Commun. 2018, 9, 956. [Google Scholar] [CrossRef] [Green Version]
- Mikhailov, E.; Vlasenko, S.; Martin, S.T.; Koop, T.; Pöschl, U. Amorphous and crystalline aerosol particles interacting with water vapor: Conceptual framework and experimental evidence for restructuring, phase transitions and kinetic limitations. Atmos. Chem. Phys. 2009, 9, 9491–9522. [Google Scholar] [CrossRef] [Green Version]
- Browne, E.C.; Zhang, X.L.; Franklin, J.P.; Ridley, K.J.; Kirchstetter, T.W.; Wilson, K.R.; Cappa, C.D.; Kroll, J.H. Effect of heterogeneous oxidative aging on light absorption by biomass burning organic aerosol. Aerosol Sci. Technol. 2019, 53, 663–674. [Google Scholar] [CrossRef]
- Shi, X.J.; Zhang, W.T.; Liu, J.J. Comparison of Anthropogenic Aerosol Climate Effects among Three Climate Models with Reduced Complexity. Atmosphere 2019, 10, 456. [Google Scholar] [CrossRef] [Green Version]
- Kang, J.Y.; Bae, S.Y.; Park, R.S.; Han, J.Y. Aerosol Indirect Effects on the Predicted Precipitation in a Global Weather Forecasting Model. Atmosphere 2019, 10, 392. [Google Scholar] [CrossRef] [Green Version]
- Liu, P.F.; Li, Y.J.; Wang, Y.; Bateman, A.P.; Zhang, Y.; Gong, Z.H.; Bertram, A.K.; Martin, S.T. Highly Viscous States Affect the Browning of Atmospheric Organic Particulate Matter. ACS Cent. Sci. 2018, 4, 207–215. [Google Scholar] [CrossRef] [Green Version]
- Shiraiwa, M.; Ammann, M.; Koop, T.; Pöschl, U. Gas uptake and chemical aging of semisolid organic aerosol particles. Proc. Nati. Acad. Sci. USA 2011, 108, 11003–11008. [Google Scholar] [CrossRef] [Green Version]
- Fan, H.; Tinsley, M.R.; Goulay, F. Effect of Relative Humidity on the OH-Initiated Heterogeneous Oxidation of Monosaccharide Nanoparticles. J. Phys. Chem. A 2015, 119, 11182–11190. [Google Scholar] [CrossRef]
- Laskin, A.; Gilles, M.K.; Knopf, D.A.; Wang, B.; China, S. Progress in the Analysis of Complex Atmospheric Particles. Annu. Rev. Anal. Chem. 2016, 9, 117–143. [Google Scholar] [CrossRef] [Green Version]
- Slade, J.H.; Knopf, D.A. Multiphase OH oxidation kinetics of organic aerosol: The role of particle phase state and relative humidity. Geophys. Res. Lett. 2014, 41, 5297–5306. [Google Scholar] [CrossRef]
- Davies, J.F.; Wilson, K.R. Nanoscale interfacial gradients formed by the reactive uptake of OH radicals onto viscous aerosol surfaces. Chem. Sci. 2015, 6, 7020–7027. [Google Scholar] [CrossRef] [Green Version]
- Steimer, S.S.; Berkemeier, T.; Gilgen, A.; Krieger, U.K.; Peter, T.; Shiraiwa, M.; Ammann, M. Shikimic acid ozonolysis kinetics of the transition from liquid aqueous solution to highly viscous glass. Phys. Chem. Chem. Phys. 2015, 17, 31101–31109. [Google Scholar] [CrossRef] [Green Version]
- Chim, M.M.; Chow, C.Y.; Davies, J.F.; Chan, M.N. Effects of Relative Humidity and Particle Phase Water on the Heterogeneous OH Oxidation of 2-Methylglutaric Acid Aqueous Droplets. J. Phys. Chem. A 2017, 121, 1666–1674. [Google Scholar] [CrossRef]
- Marshall, F.H.; Miles, R.E.H.; Song, Y.-C.; Ohm, P.B.; Power, R.M.; Reid, J.P.; Dutcher, C.S. Diffusion and reactivity in ultraviscous aerosol and the correlation with particle viscosity. Chem. Sci. 2016, 7, 1298–1308. [Google Scholar] [CrossRef] [Green Version]
- Katrib, Y.; Biskos, G.; Buseck, P.R.; Davidovits, P.; Jayne, J.T.; Mochida, M.; Wise, M.E.; Worsnop, D.R.; Martin, S.T. Ozonolysis of Mixed Oleic-Acid/Stearic-Acid Particles: Reaction Kinetics and Chemical Morphology. J. Phys. Chem. A 2005, 109, 10910–10919. [Google Scholar] [CrossRef] [PubMed]
- Hearn, J.D.; Smith, G.D. Ozonolysis of Mixed Oleic Acid/n-Docosane Particles: The Roles of Phase, Morphology, and Metastable States. J. Phys. Chem. A 2007, 111, 11059–11065. [Google Scholar] [CrossRef] [PubMed]
- Mendez, M.; Visez, N.; Gosselin, S.; Crenn, V.; Riffault, V.; Petitprez, D. Reactive and Nonreactive Ozone Uptake during Aging of Oleic Acid Particles. J. Phys. Chem. A 2014, 118, 9471–9481. [Google Scholar] [CrossRef] [PubMed]
- Wang, M.; Yao, L.; Zheng, J.; Wang, X.; Chen, J.; Yang, X.; Worsnop, D.R.; Donahue, N.M.; Wang, L. Reactions of Atmospheric Particulate Stabilized Criegee Intermediates Lead to High-Molecular-Weight Aerosol Components. Environ. Sci. Technol. 2016, 50, 5702–5710. [Google Scholar] [CrossRef]
- Jacobs, M.I.; Xu, B.; Kostko, O.; Wiegel, A.A.; Houle, F.A.; Ahmed, M.; Wilson, K.R. Using Nanoparticle X-ray Spectroscopy to Probe the Formation of Reactive Chemical Gradients in Diffusion-Limited Aerosols. J. Phys. Chem. A 2019, 123, 6034–6044. [Google Scholar] [CrossRef] [Green Version]
- Wiegel, A.A.; Liu, M.J.; Hinsberg, W.D.; Wilson, K.R.; Houle, F.A. Diffusive confinement of free radical intermediates in the OH radical oxidation of semisolid aerosols. Phys. Chem. Chem. Phys. 2017, 19, 6814–6830. [Google Scholar] [CrossRef] [Green Version]
- Wiegel, A.A.; Wilson, K.R.; Hinsberg, W.D.; Houle, F.A. Stochastic methods for aerosol chemistry: A compact molecular description of functionalization and fragmentation in the heterogeneous oxidation of squalane aerosol by OH radicals. Phys. Chem. Chem. Phys. 2015, 17, 4398–4411. [Google Scholar] [CrossRef] [Green Version]
- Power, R.M.; Simpson, S.H.; Reid, J.P.; Hudson, A.J. The transition from liquid to solid-like behaviour in ultrahigh viscosity aerosol particles. Chem. Sci. 2013, 4, 2597–2604. [Google Scholar] [CrossRef]
- Price, H.C.; Murray, B.J.; Mattsson, J.; O’Sullivan, D.; Wilson, T.W.; Baustian, K.J.; Benning, L.G. Quantifying water diffusion in high-viscosity and glassy aqueous solutions using a Raman isotope tracer method. Atmosph. Chem. Phys. 2014, 14, 3817–3830. [Google Scholar] [CrossRef] [Green Version]
- Eyoy, E.; Maclean, A.M.; Royelli, G.; Li, Y.; Tsimpidi, A.P.; Karydis, V.A.; Kamal, S.; Lelieveld, J.; Shiraiwa, M.; Reid, J.P.; et al. Predictions of diffusion rates of large organic molecules in secondary organic aerosols using the Stokes-Einstein and fractional Stokes-Einstein relations. Atmos. Chem. Phys. 2019, 19, 10073–10085. [Google Scholar] [CrossRef] [Green Version]
- Price, H.C.; Mattsson, J.; Murray, B.J. Sucrose diffusion in aqueous solution. Phys. Chem. Chem. Phys. 2016, 18, 19207–19216. [Google Scholar] [CrossRef] [PubMed] [Green Version]
- O’Meara, S.; Topping, D.O.; Zaveri, R.A.; McFiggans, G. An efficient approach for treating composition-dependent diffusion within organic particles. Atmos. Chem. Phys. 2017, 17, 10477–10494. [Google Scholar] [CrossRef] [Green Version]
- Fowler, K.; Connolly, P.J.; Topping, D.O.; O’Meara, S. Maxwell-Stefan diffusion: A framework for predicting condensed phase diffusion and phase separation in atmospheric aerosol. Atmos. Chem. Phys. 2018, 18, 1629–1642. [Google Scholar] [CrossRef] [Green Version]
- Burkholder, J.B.; Abbate, J.P.D.; Barnes, I.; Roberts, J.M.; Melamed, M.L.; Ammann, M.; Bertram, A.K.; Cappa, C.D.; Carlton, A.G.; Carpenter, L.J.; et al. The Essential Role for Laboratory Studies in Atmospheric Chemistry. Environ. Sci. Technol. 2017, 51, 2519–2528. [Google Scholar] [CrossRef] [Green Version]
- Houle, F.A.; Hinsberg, W.D.; Wilson, K.R. Oxidation of a model alkane aerosol by OH radical: The emergent nature of reactive uptake. Phys. Chem. Chem. Phys. 2015, 17, 4412–4423. [Google Scholar] [CrossRef] [Green Version]
- Nah, T.; Kessler, S.H.; Daumit, K.E.; Kroll, J.H.; Leone, S.R.; Wilson, K.R. Influence of Molecular Structure and Chemical Functionality on the Heterogeneous OH-Initiated Oxidation of Unsaturated Organic Particles. J. Phys. Chem. A 2014, 118, 4106–4119. [Google Scholar] [CrossRef] [Green Version]
- Kolesar, K.R.; Buffaloe, G.; Wilson, K.R.; Cappa, C.D. OH-Initiated Heterogeneous Oxidation of Internally-Mixed Squalane and Secondary Organic Aerosol. Environ. Sci. Technol. 2014, 48, 3196–3202. [Google Scholar] [CrossRef] [Green Version]
- Arangio, A.M.; Slade, J.H.; Berkemeier, T.; Poeschl, U.; Knopf, D.A.; Shiraiwa, M. Multiphase Chemical Kinetics of OH Radical Uptake by Molecular Organic Markers of Biomass Burning Aerosols: Humidity and Temperature Dependence, Surface Reaction, and Bulk Diffusion. J. Phys. Chem. A 2015, 119, 4533–4544. [Google Scholar] [CrossRef] [Green Version]
- Lu, J.W.; Rickards, A.M.J.; Walker, J.S.; Knox, K.J.; Miles, R.E.H.; Reid, J.P.; Signorell, R. Timescales of water transport in viscous aerosol: Measurements on sub-micron particles and dependence on conditioning history. Phys. Chem. Chem. Phys. 2014, 16, 9819–9830. [Google Scholar] [CrossRef] [PubMed]
- Lai, C.Y.; Liu, Y.C.; Ma, J.Z.; Ma, Q.X.; He, H. Degradation kinetics of levoglucosan initiated by hydroxyl radical under different environmental conditions. Atmos. Environ. 2014, 91, 32–39. [Google Scholar] [CrossRef]
- Tong, H.-J.; Reid, J.P.; Bones, D.L.; Luo, B.P.; Krieger, U.K. Measurements of the timescales for the mass transfer of water in glassy aerosol at low relative humidity and ambient temperature. Atmos. Chem. Phys. 2011, 11, 4739–4754. [Google Scholar] [CrossRef] [Green Version]
- Zobrist, B.; Soonsin, V.; Luo, B.P.; Krieger, U.K.; Marcolli, C.; Peter, T.; Koop, T. Ultra-slow water diffusion in aqueous sucrose glasses. Phys. Chem. Chem. Phys. 2011, 13, 3514–3526. [Google Scholar] [CrossRef] [PubMed]
- Houle, F.A.; Wiegel, A.A.; Wilson, K.R. Predicting Aerosol Reactivity Across Scales: From the Laboratory to the Atmosphere. Environ. Sci. Technol. 2018, 52, 13774–13781. [Google Scholar] [CrossRef]
- Fan, H.; Wenyika Masaya, T.; Goulay, F. Effect of surface–bulk partitioning on the heterogeneous oxidation of aqueous saccharide aerosols. Phys. Chem. Chem. Phys. 2019, 21, 2992–3001. [Google Scholar] [CrossRef]
- Song, Y.C.; Haddrell, A.E.; Bzdek, B.R.; Reid, J.P.; Bannan, T.; Topping, D.O.; Percival, C.; Cai, C. Measurements and Predictions of Binary Component Aerosol Particle Viscosity. J. Phys. Chem. A 2016, 120, 8123–8137. [Google Scholar] [CrossRef] [Green Version]
- Mysak, E.R.; Wilson, K.R.; Jimenez-Cruz, M.; Ahmed, M.; Baer, T. Synchrotron radiation based aerosol time-of-flight mass spectrometry for organic constituents. Anal. Chem. 2005, 77, 5953–5960. [Google Scholar] [CrossRef]
- Smith, J.D.; Kroll, J.H.; Cappa, C.D.; Che, D.L.; Liu, C.L.; Ahmed, M.; Leone, S.R.; Worsnop, D.R.; Wilson, K.R. The heterogeneous reaction of hydroxyl radicals with sub-micron squalane particles: A model system for understanding the oxidative aging of ambient aerosols. Atmos. Chem. Phys. 2009, 9, 3209–3222. [Google Scholar] [CrossRef] [Green Version]
- Atkinson, R. Kinetics of the gas-phase reactions of OH radicals with alkanes and cycloalkanes. Atmosph. Chem. Phys. 2003, 3, 2233–2307. [Google Scholar] [CrossRef] [Green Version]
- Atkinson, R. Kinetics and mechanistics of the gas-phase reactions of the hydroxyl radical with organic-compounds under atmospheric conditions. Chem. Rev. 1986, 86, 69–201. [Google Scholar] [CrossRef]
- Hearn, J.D.; Smith, G.D. A mixed-phase relative rates technique for measuring aerosol reaction kinetics. Geophys. Res. Lett. 2006, 33, L17805. [Google Scholar] [CrossRef]
- Vieceli, J.R.M.; Potter, N.; Dang, L.X.; Garrett, B.C.; Tobias, D.J. Molecular Dynamics Simulations of Atmospheric Oxidants at the Air−Water Interface: Solvation and Accommodation of OH and O3. J. Phys. Chem. B 2005, 15876–15892. [Google Scholar] [CrossRef] [PubMed]
- Bucknall, T.; Edwards, H.E.; Kemsley, K.G.; Moore, J.S.; Phillips, G.O. The formation of malonaldehyde in irradiated carbohydrates. Carbohydr. Res. 1978, 62, 49–59. [Google Scholar] [CrossRef]
- Zakatova, N.V.; Minkhadzhiddinova, D.P.; Sharpatyi, V.A. Role of OH-radicals in the radiolytic decomposition of carbohydrates and polysaccharides. Russ. Chem. Bull. 1969. [Google Scholar] [CrossRef]
- Davies, J.F.; Wilson, K.R. Raman Spectroscopy of Isotopic Water Diffusion in Ultraviscous, Glassy, and Gel States in Aerosol by Use of Optical Tweezers. Anal. Chem. 2016, 88, 2361–2366. [Google Scholar] [CrossRef] [PubMed] [Green Version]
- Vignes, A. Diffusion in Binary Solutions. Variation of Diffusion Coefficient with Composition. Ind. Eng. Chem. Fundam. 1966, 5, 189–199. [Google Scholar] [CrossRef]
- Lide, D.R. CRC Handbook of Chemistry and Physics, 64th ed.; CRC Press: Boca Raton, FL, USA, 1983. [Google Scholar]
- Mai, H.; Shiraiwa, M.; Flagan, R.C.; Seinfeld, J.H. Under What Conditions Can Equilibrium Gas–Particle Partitioning Be Expected to Hold in the Atmosphere? Environ. Sci. Technol. 2015, 49, 11485–11491. [Google Scholar] [CrossRef] [Green Version]
- Yli-Juuti, T.; Pajunoja, A.; Tikkanen, O.P.; Buchholz, A.; Faiola, C.; Vaisanen, O.; Hao, L.Q.; Kari, E.; Perakyla, O.; Garmash, O.; et al. Factors controlling the evaporation of secondary organic aerosol from alpha-pinene ozonolysis. Geophys. Res. Lett. 2017, 44, 2562–2570. [Google Scholar] [CrossRef]
Figure 1.
Schematic of the flow reactor used for particle collection and offline gas chromatography coupled to mass spectrometry (GC-MS) analysis. Saccharide particles were generated by a constant output atomizer and mixed with flows of humidified N2, O2, O3, and dry N2. A total of a 3.0 L min−1 aerosol stream entered the atmospheric pressure flow tube to react with OH radicals. Hexane was injected from the bottom 1/5 of the flow tube. Upon exiting the flow tube, the OH concentration was measured by quantifying the loss of hexane tracer using gas chromatograph with flame ionization detection (GC-FID). The aerosol stream was analyzed by a scanning mobility particle sizer (SMPS) and collected by a Teflon filter.

Figure 2.
Surface-weighted particle size distribution for unreacted equimolar saccharide particles. The mean surface-weighted diameter and the total concentration of number particle size were 218.2 nm and 3.05 × 105 cm−3 for the VUV-AMS analysis sample (black, dashed line) and 366.4 nm and 2.58 × 105 cm−3 for the GC-MS analysis sample (red, dashed line).

Figure 3.
VUV-AMS spectrum of unreacted equimolar MGP–lactose aerosols recorded at 10.5 eV photoionization energy. The m/z 60, m/z 73, m/z 121, m/z 144, and m/z 163 were monitored during the kinetic measurements.
Figure 3.
VUV-AMS spectrum of unreacted equimolar MGP–lactose aerosols recorded at 10.5 eV photoionization energy. The m/z 60, m/z 73, m/z 121, m/z 144, and m/z 163 were monitored during the kinetic measurements.

Figure 4.
Relative abundance of the MGP reactant as a function of OH exposure in particles with MGP:lactose molar ratios of 1:1 (red, solid circles), 2:1 (black, solid squares), 4:1 (blue, solid triangles), and 8:1 (green, solid diamonds) at RH = 30%. Online analyses were performed using VUV-AMS. Also displayed is the MGP decay for MGP particles at RH = 30% (purple open triangles) [16]. The error bars are 2σ of the mean values. The solid lines are exponential fits to the data for OH exposures below 2 × 1012 cm−3 s and extrapolated to higher values (dashed lines).

Figure 5.
Modeled (solid line) and experimental (markers) fractions of unreacted MGP remaining in the particle as a function of OH exposure for MGP:lactose molar ratios of 1:1 (red), 2:1 (black), 4:1 (blue), and 8:1 (green).
Figure 5.
Modeled (solid line) and experimental (markers) fractions of unreacted MGP remaining in the particle as a function of OH exposure for MGP:lactose molar ratios of 1:1 (red), 2:1 (black), 4:1 (blue), and 8:1 (green).

Figure 6.
GC-MS chromatogram of silylated reacted (upper panel) and unreacted (lower panel) particles for an MGP:lactose molar ratio of 2:1 at 0.7 × 1012 cm−3 s OH exposure. The retention time for the internal standard xylose was 6.17 min and 6.83 min, 9.13 min for MGP, 12.79 min and 13.10 min for lactose, and 10.09 min for glucose. All the saccharides were identified with authentic samples.

Figure 7.
Relative abundance of unreacted MGP (open circles) and lactose (filed squares) in semi-solid MGP–lactose particles at 30% RH as a function of OH exposure for MGP:lactose molar ratios of (a) 1:1 (red markers); (b) 2:1 (black markers); (c) 4:1 (blue markers). The offline analyses were performed using GC-MS. The error bars represent the maximum and minimum experimental values. The lines were modeled MGP (solid lines) and lactose (dashed lines) profiles using the parameters displayed in Table 1.

Figure 8.
Logarithm of the particle viscosity calculated using the Stock–Einstein equation for MGP:lactose molar ratios of (a) 1:1; (b) 2:1; and (c) 4:1 at a constant OH gas number density of 1.08 × 1010 cm−3, corresponding to total OH exposure of 5 × 1011 cm−3 s. The top panels display the viscosity gradient near the particle surface.


Table 1.
Key simulation parameters and rate constants for semisolid MGP (methyl-β-d-glucopyranoside)-lactose particles.
Table 1.
Key simulation parameters and rate constants for semisolid MGP (methyl-β-d-glucopyranoside)-lactose particles.
| Parameter | Value | Description |
|---|---|---|
| RH | 30% | Relative humidity |
| (OH) | 1.35 × 1011 cm−3 (VUV-AMS) 8.70 × 1010 cm−3 (GC-MS) | OH average experimental number density 1 |
| 100 nm (VUV-AMS) 180 nm (GC-MS) | Particle radius | |
| 10 s−1 | Pseudo first-order adsorption rate for OH [28] | |
| 2.86 × 10¹⁰ s−1 | OH desorption rate coefficient [53] | |
| 5.31 × 10⁻¹² cm3 s−1 | OH + MGP rate coefficient in aqueous solutions [55] | |
| 5.15 × 10⁻¹² cm3 s−1 | OH + lactose rate coefficient in aqueous solutions [54] | |
| 1 × 109 cm2 s−1 | OH diffusion coefficient [56] | |
| 6.0 × 10⁻¹³ cm2 s−1 | MGP diffusion coefficient at RH = 30% (35 times the value obtained based on the S–E: logη = 5.554 [47]) 2 | |
| 1.5 × 10⁻¹⁷ cm2 s−1 | Lactose diffusion coefficient at RH = 30% (from S–E equation: logη = 8.526 [47]) 2 |
1 Set to reproduce the experimental OH exposure values. 2 Parameters adjusted to best match the model output to the data.
Table 2.
MGP rate coefficients and reactive uptake coefficients for OH reaction with semi-solid MGP–lactose particles at 30% RH measured using VUV-AMS. The error bars are 2σ of the mean value.
Table 2.
MGP rate coefficients and reactive uptake coefficients for OH reaction with semi-solid MGP–lactose particles at 30% RH measured using VUV-AMS. The error bars are 2σ of the mean value.
| Molar Ratio (MGP:lactose) | Rate Constant kMGP ± 2σ (cm3 s−1) | Uptake Coefficient (γMGP ± 2σ) |
|---|---|---|
| 1:1 | 4.02 ± 4.78 × 10⁻¹⁴ | 0.05 ± 0.06 |
| 2:1 | 2.24 ± 1.10 × 10⁻¹³ | 0.27 ± 0.15 |
| 4:1 | 3.26 ± 0.04 × 10⁻¹³ | 0.38 ± 0.01 |
| 8:1 | 4.73 ± 0.68 × 10⁻¹³ | 0.53 ± 0.10 |
© 2019 by the authors. Licensee MDPI, Basel, Switzerland. This article is an open access article distributed under the terms and conditions of the Creative Commons Attribution (CC BY) license (http://creativecommons.org/licenses/by/4.0/).
Share and Cite
MDPI and ACS Style
Fan, H.; Goulay, F. Effect of Bulk Composition on the Heterogeneous Oxidation of Semi-Solid Atmospheric Aerosols. Atmosphere 2019, 10, 791. https://doi.org/10.3390/atmos10120791
AMA Style
Fan H, Goulay F. Effect of Bulk Composition on the Heterogeneous Oxidation of Semi-Solid Atmospheric Aerosols. Atmosphere. 2019; 10(12):791. https://doi.org/10.3390/atmos10120791
Chicago/Turabian StyleFan, Hanyu, and Fabien Goulay. 2019. "Effect of Bulk Composition on the Heterogeneous Oxidation of Semi-Solid Atmospheric Aerosols" Atmosphere 10, no. 12: 791. https://doi.org/10.3390/atmos10120791
Note that from the first issue of 2016, this journal uses article numbers instead of page numbers. See further details here.