Urban Areas and Urban–Rural Contrasts under Climate Change: What Does the EURO-CORDEX Ensemble Tell Us?—Investigating near Surface Humidity in Berlin and Its Surroundings


Abstract
:1. Introduction
2. Experiments
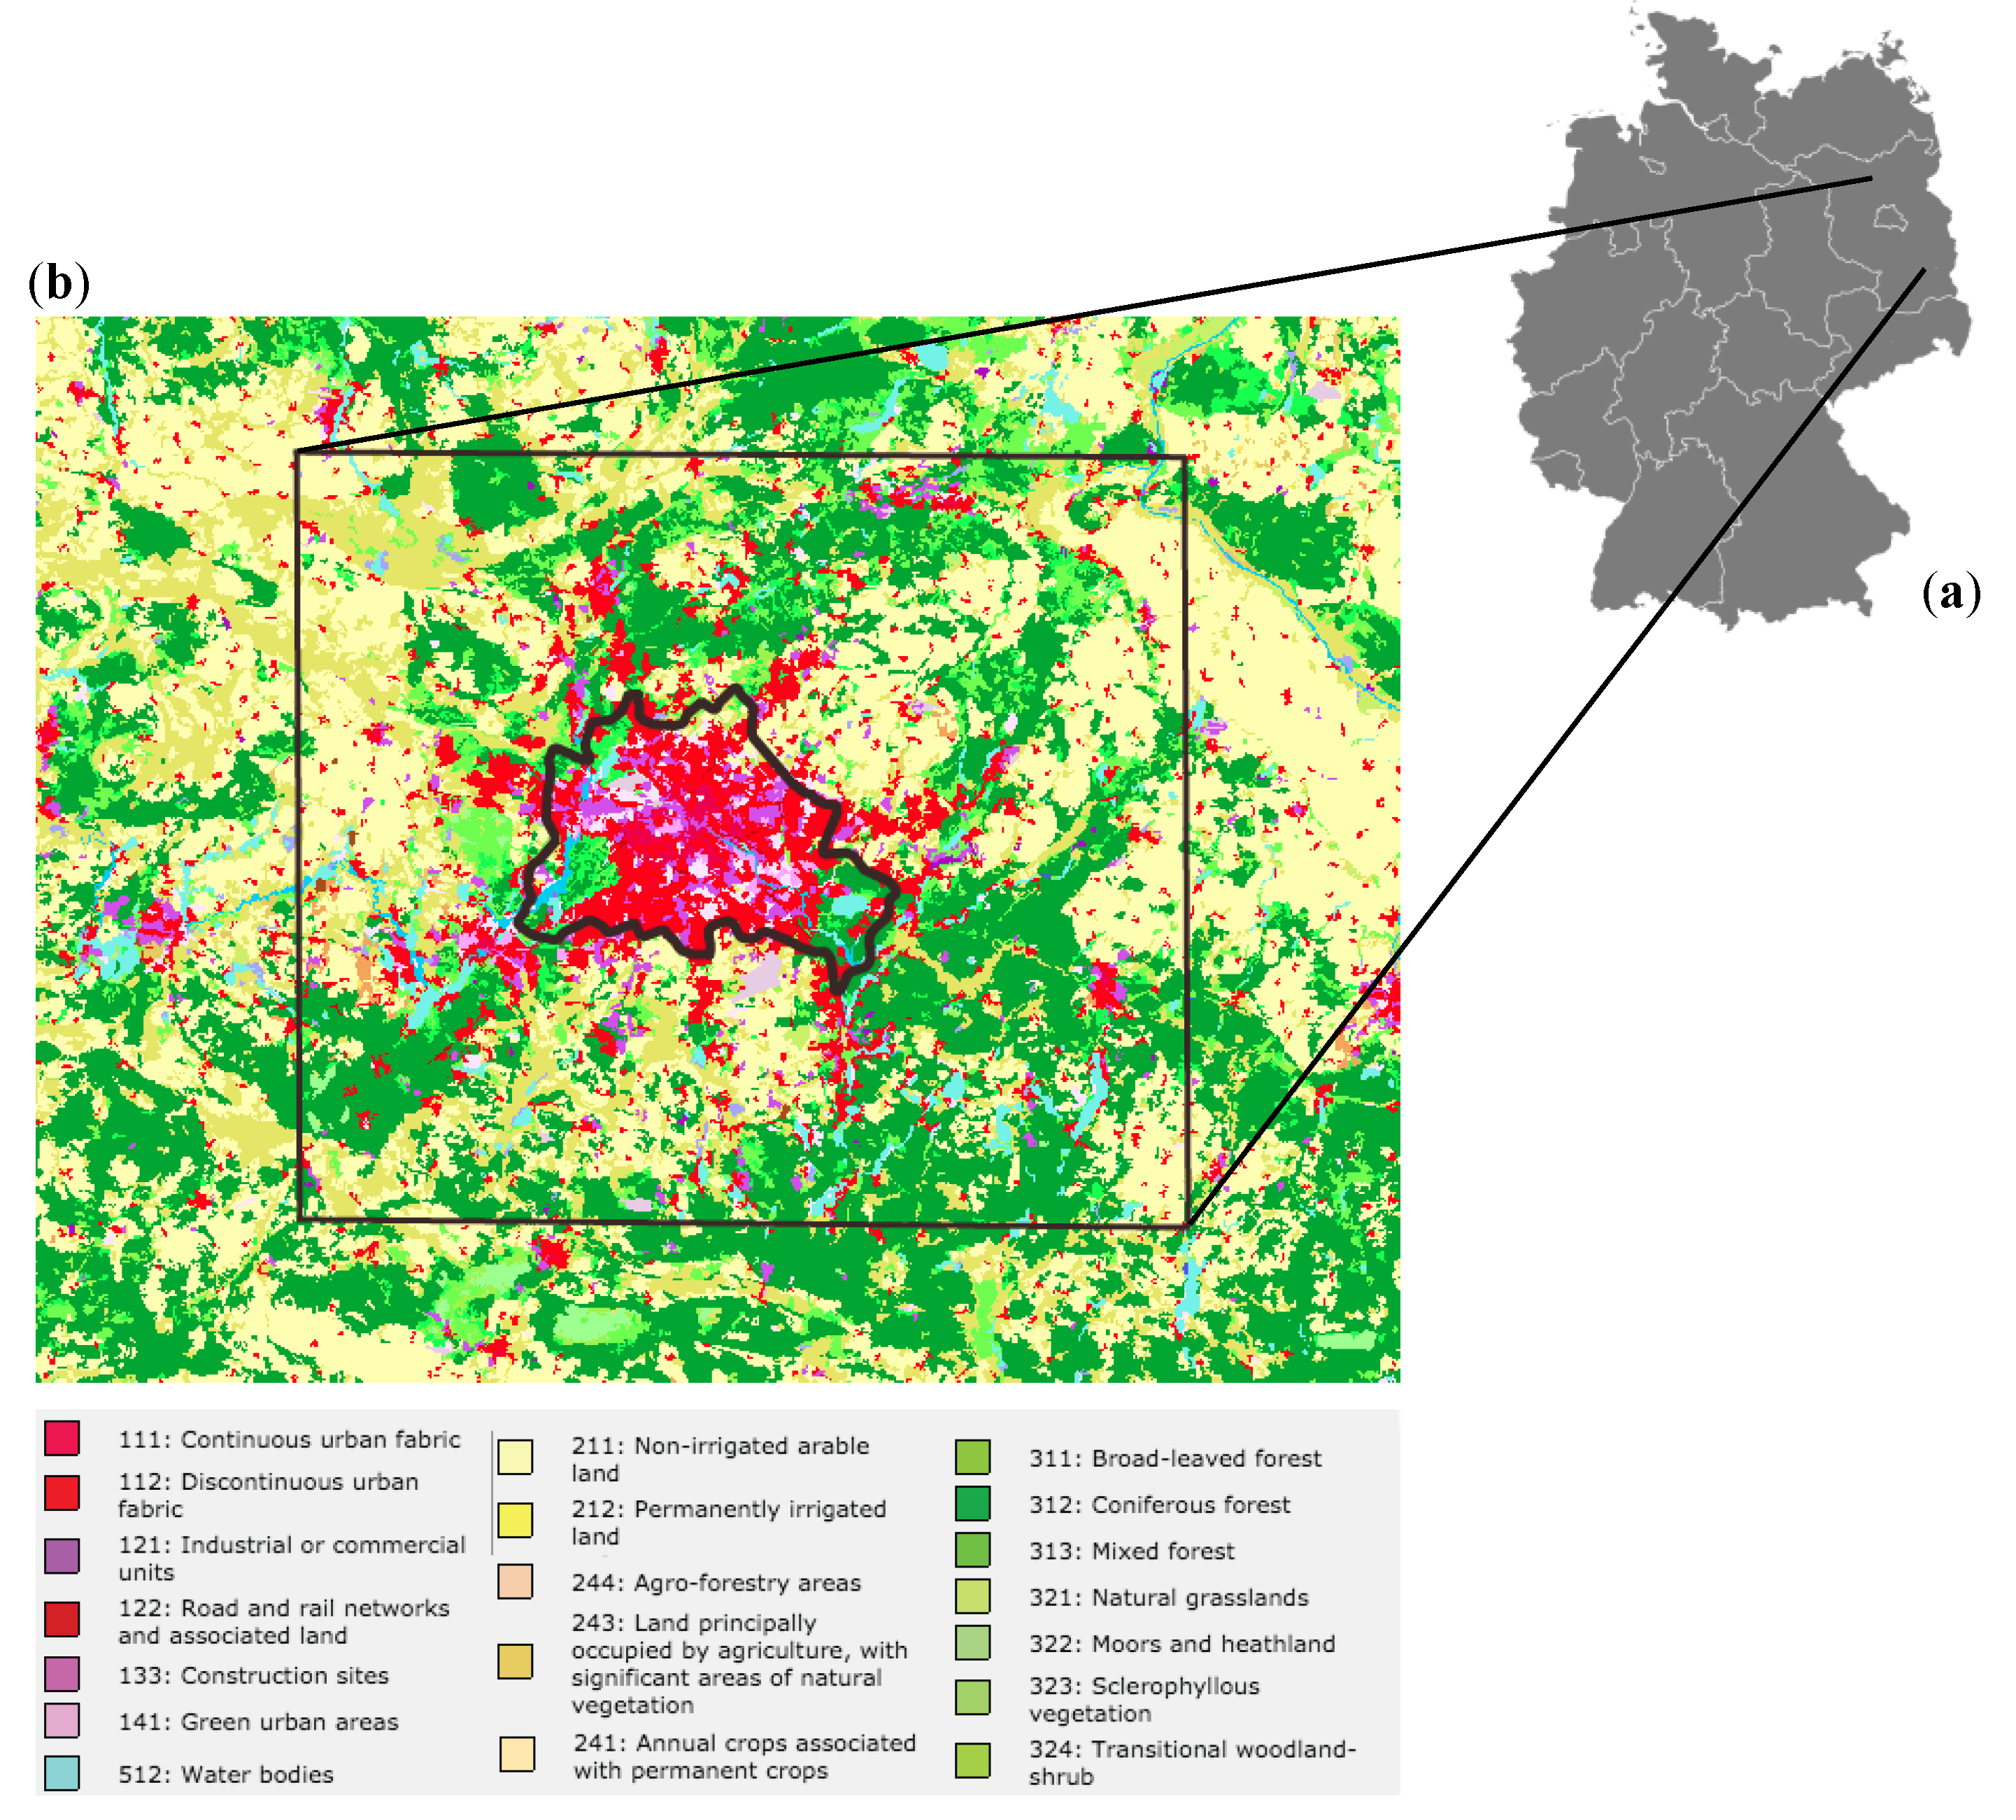
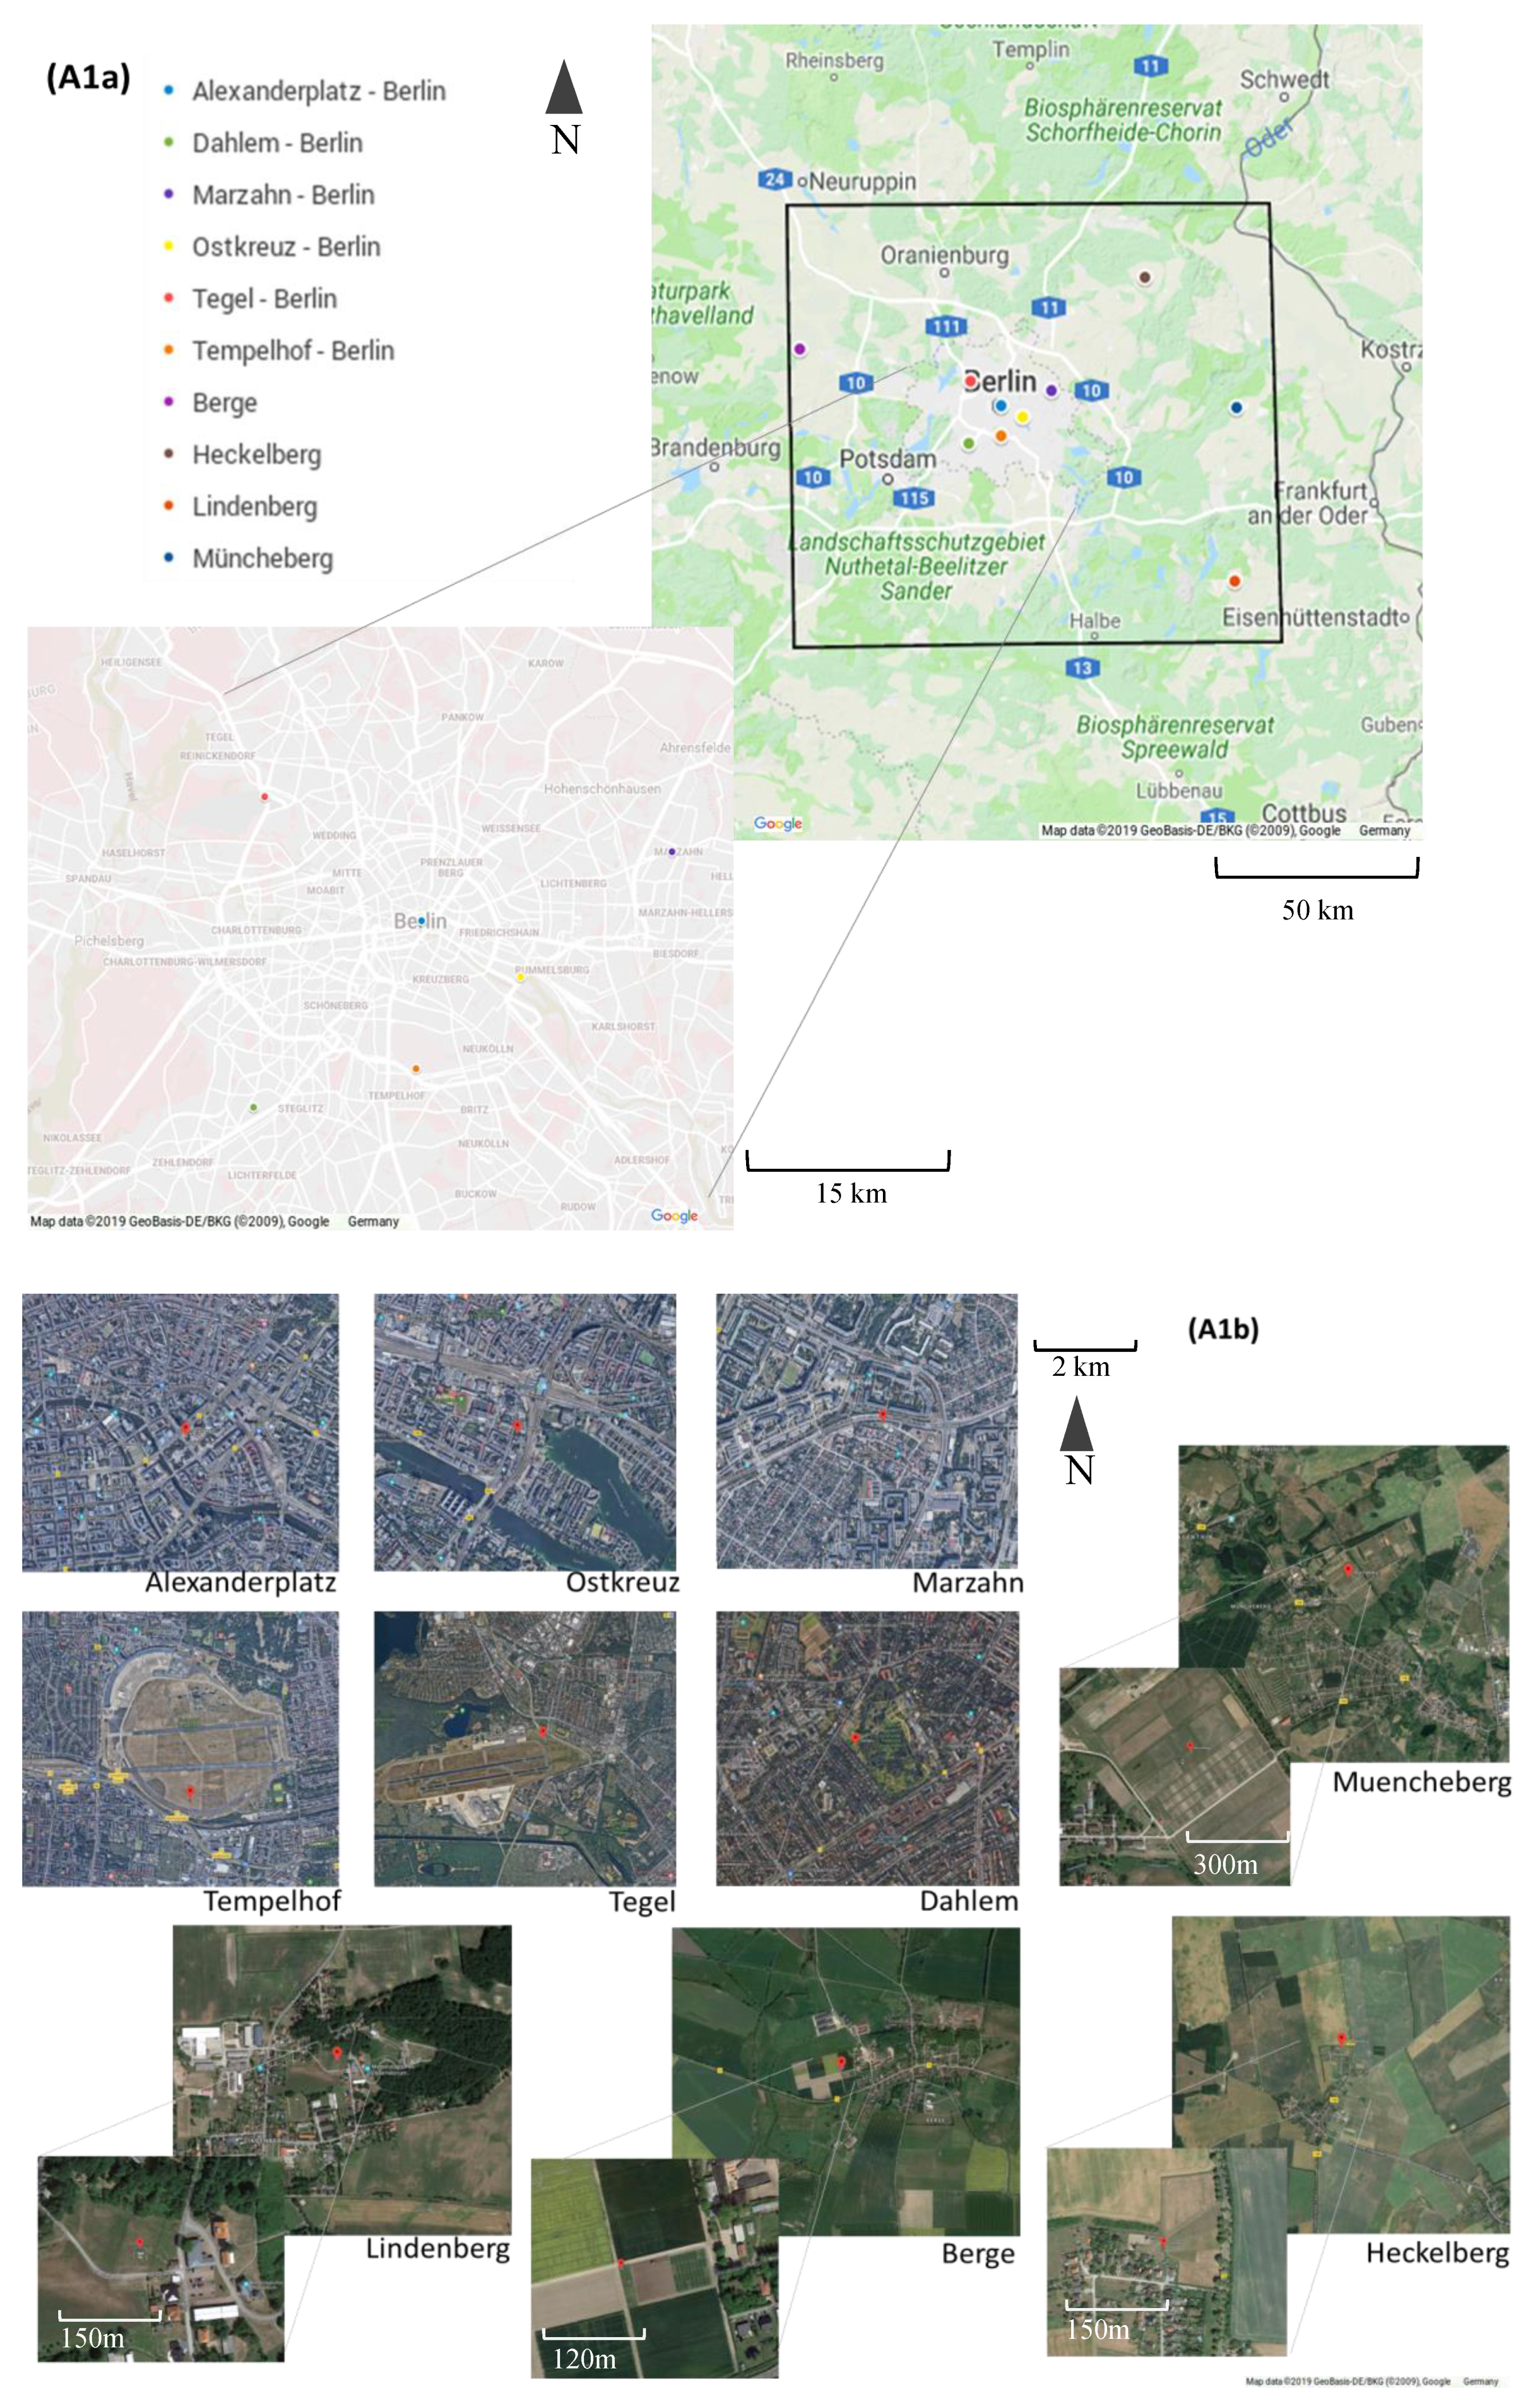
2.1. Research Area
2.2. Data, Variables, and Climate Scenarios
2.3. Calculations and Statistics
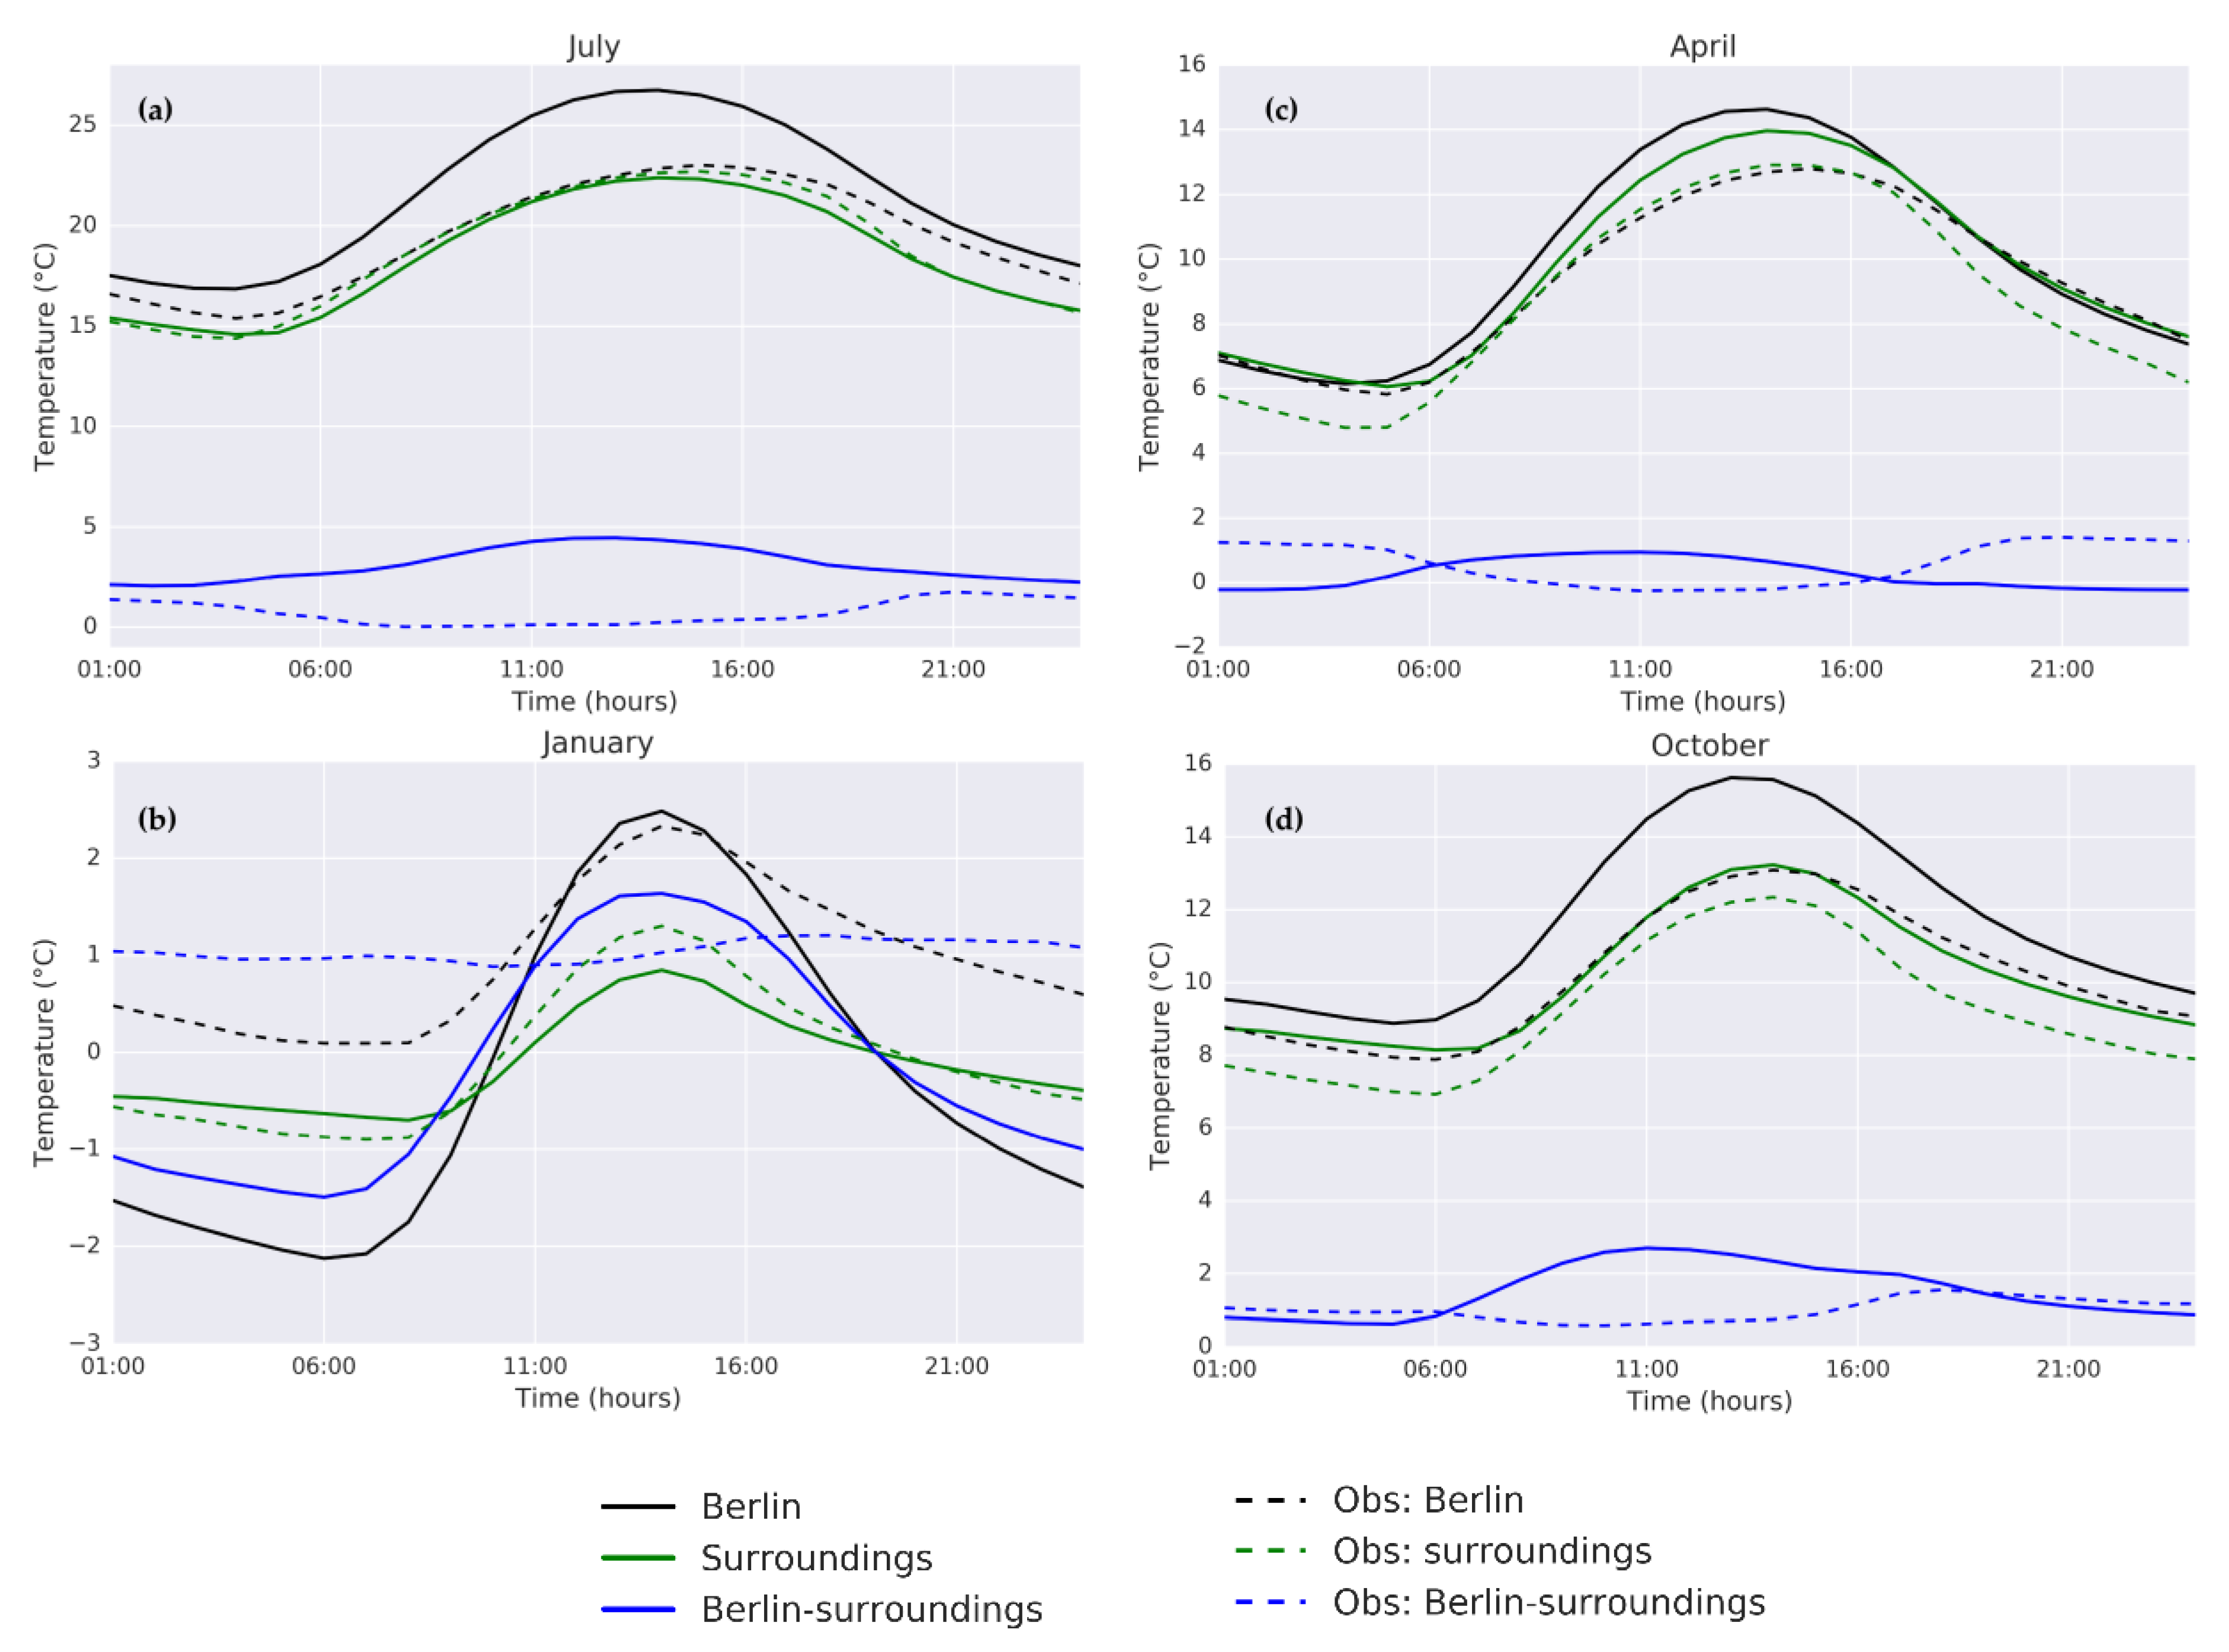
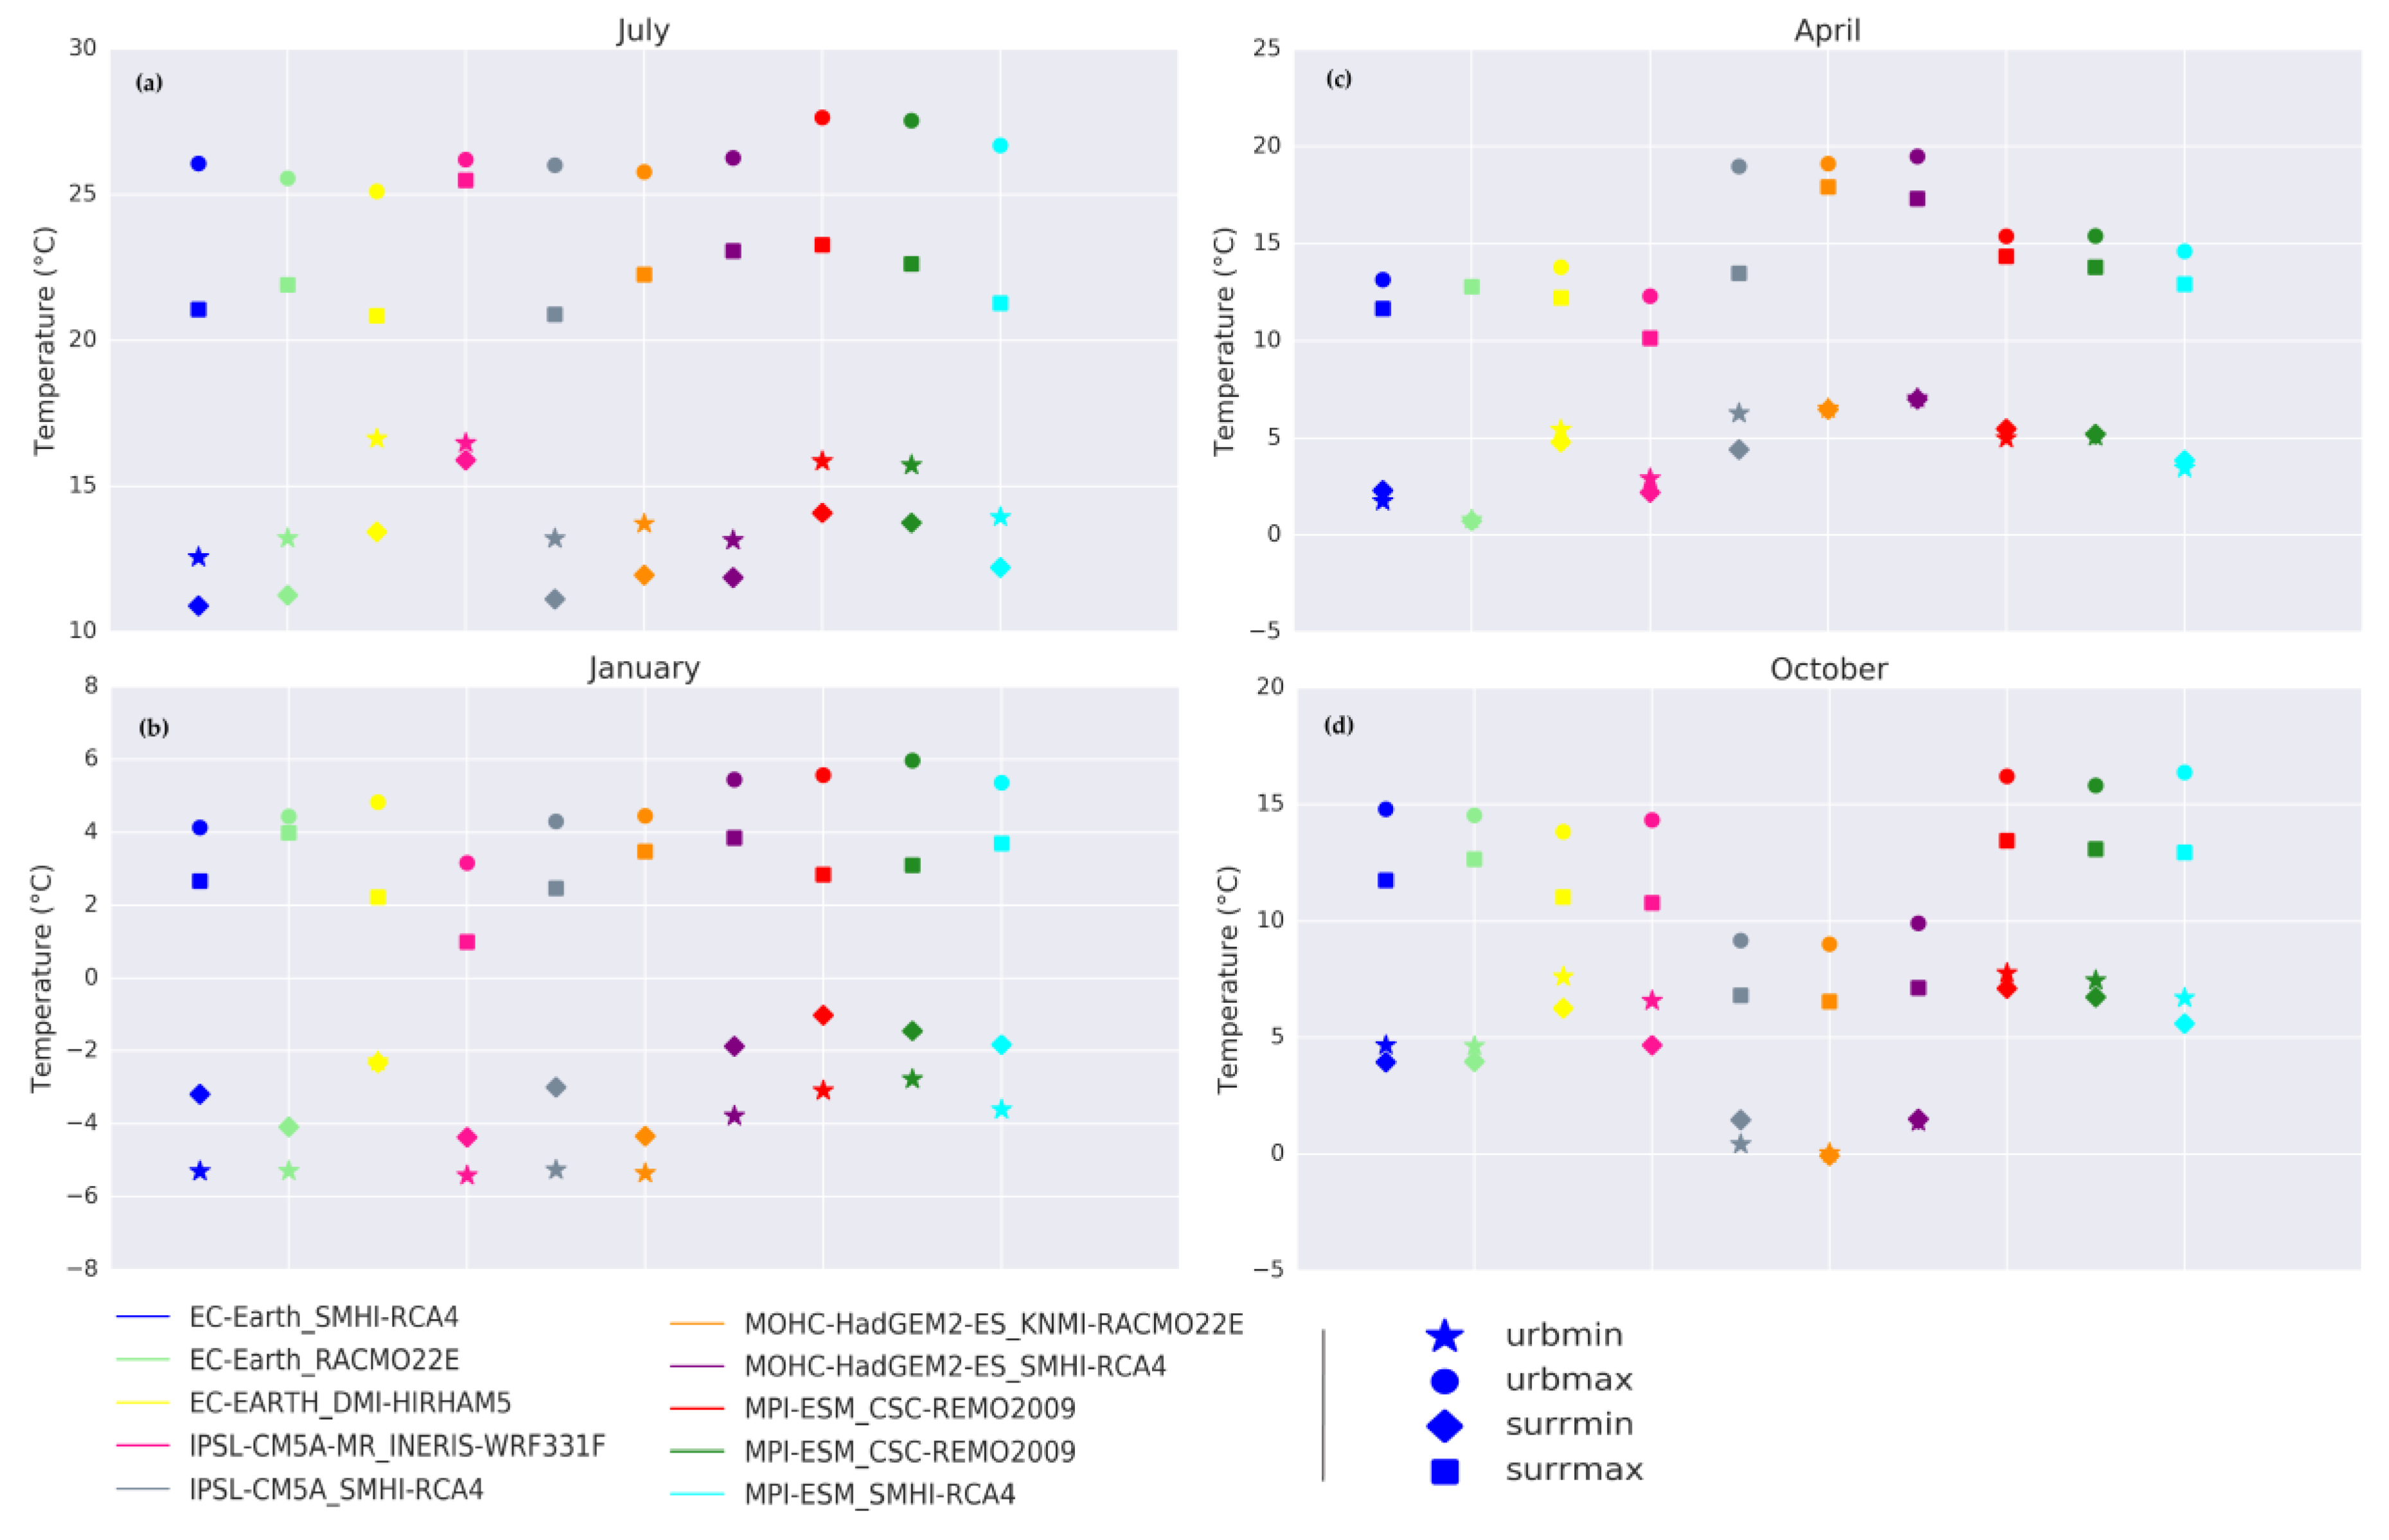
2.4. Daily Cycle
3. Results
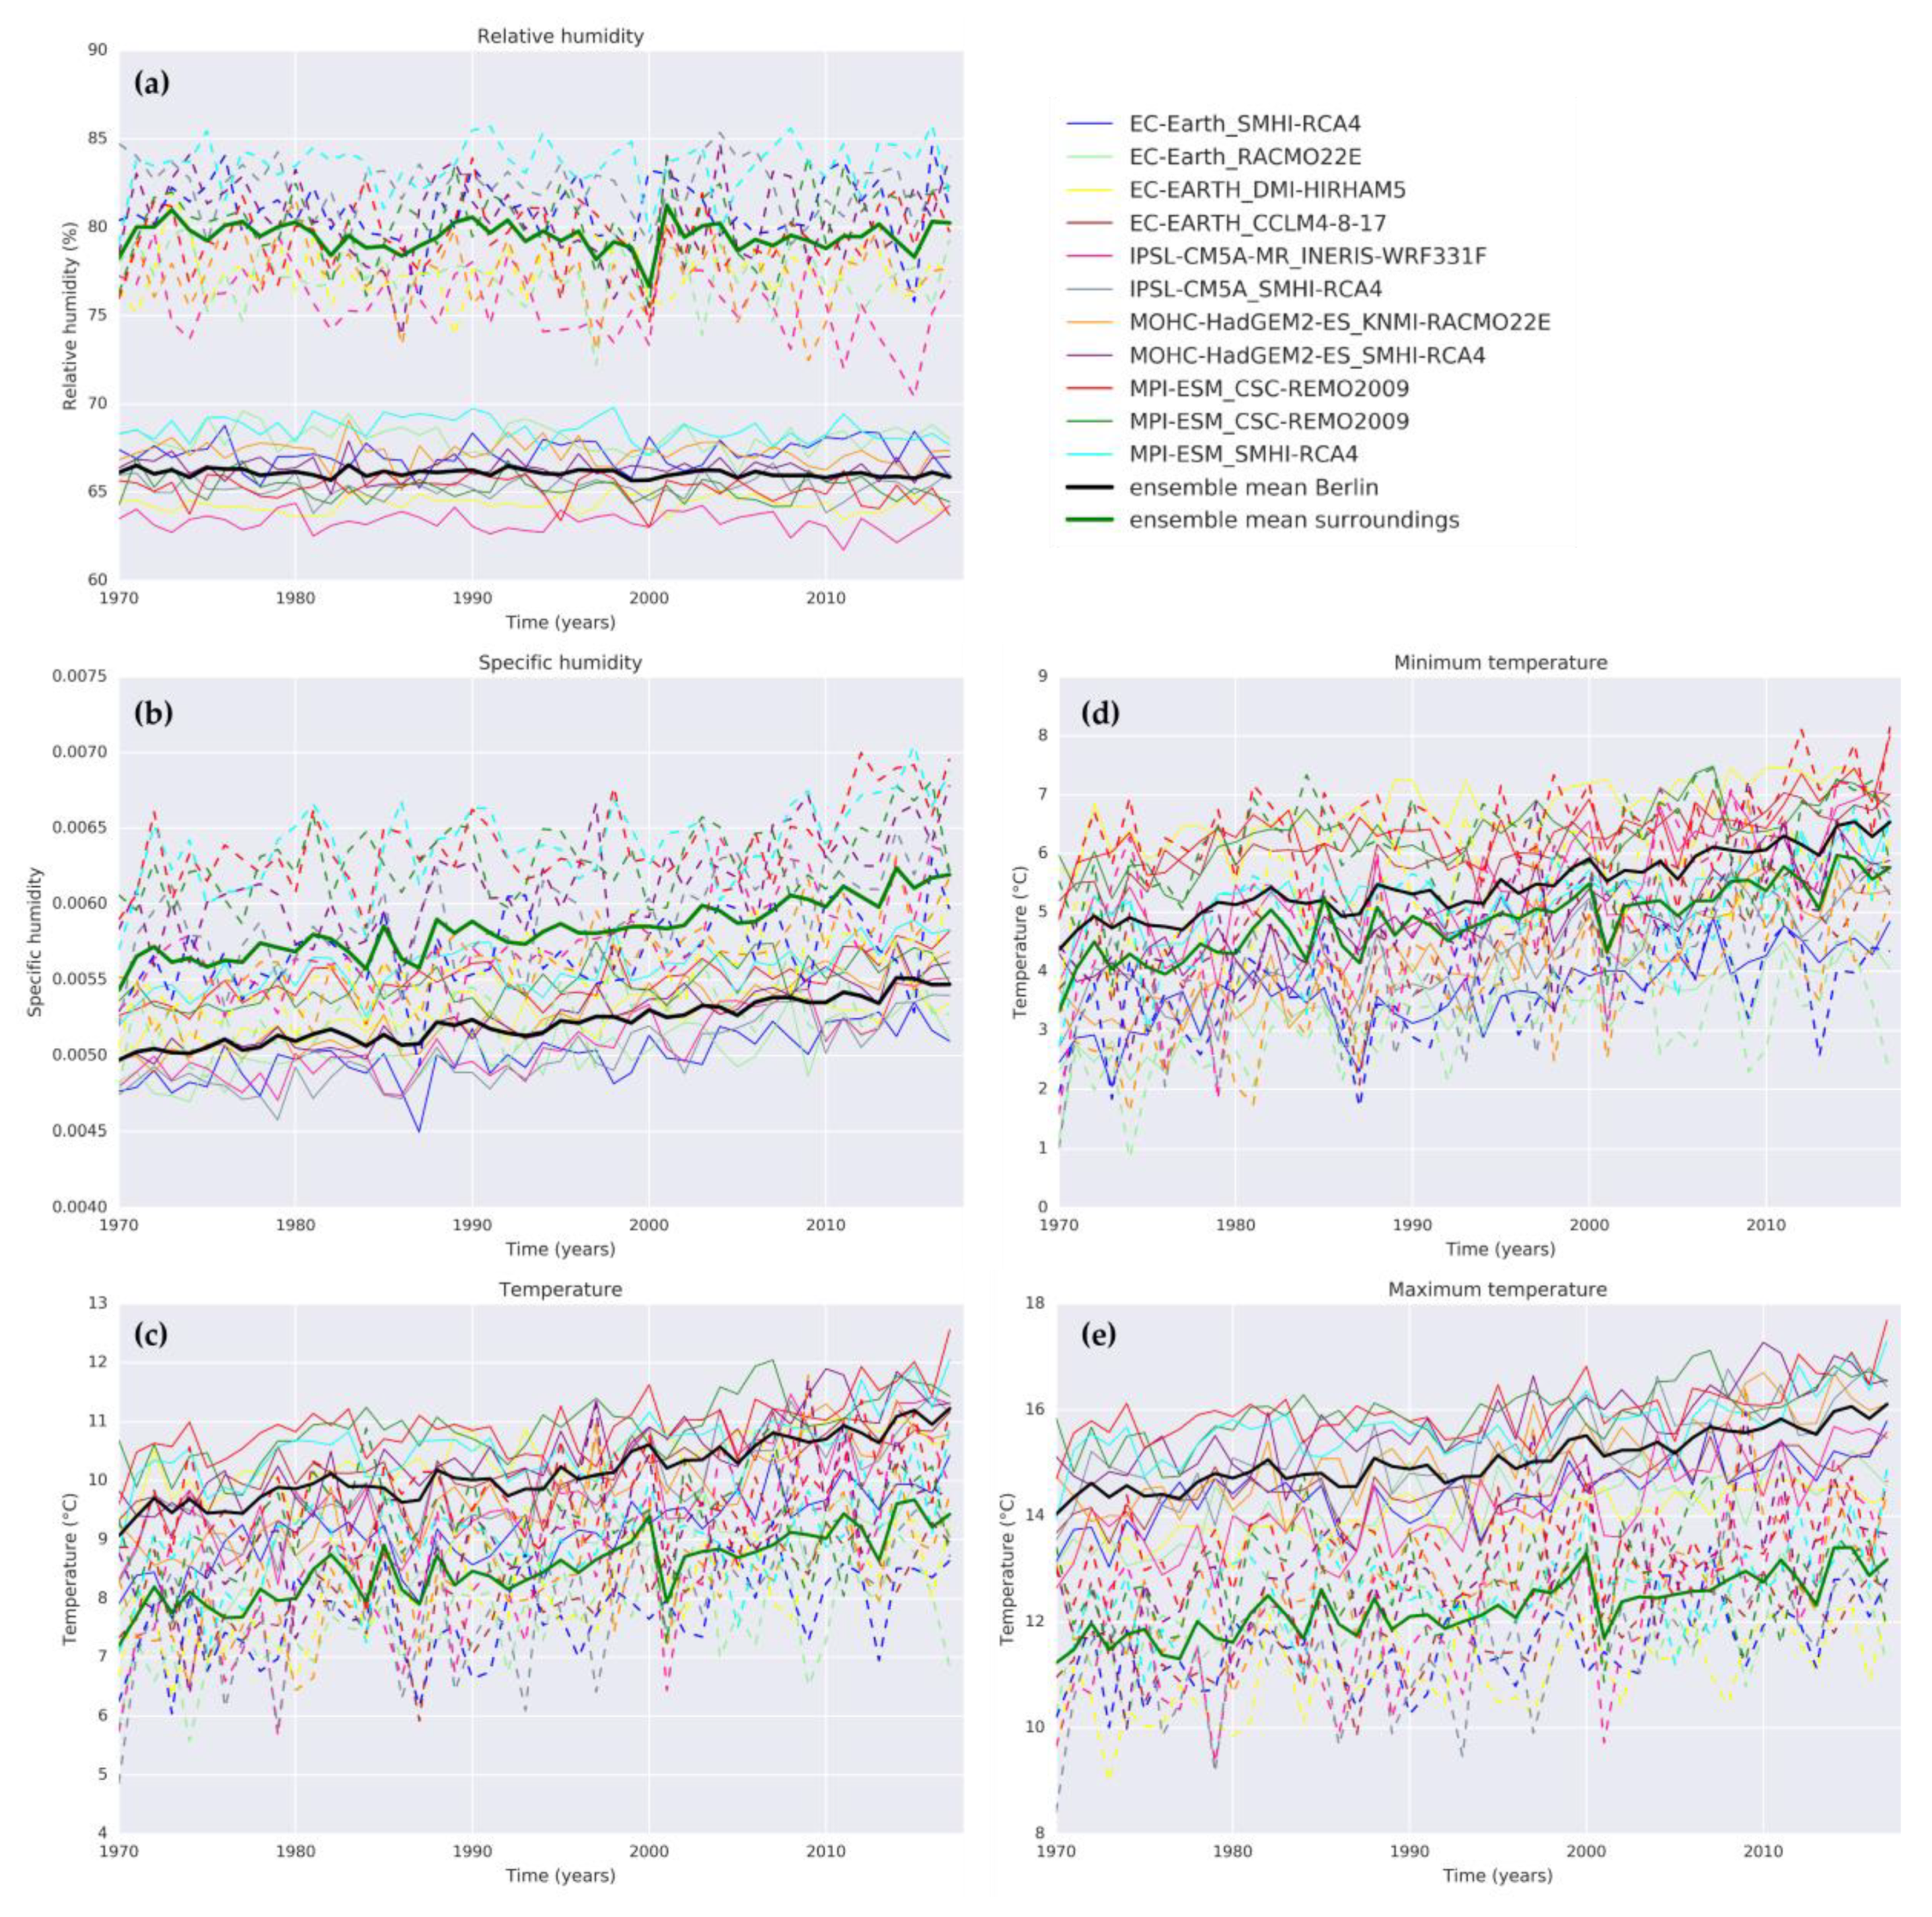
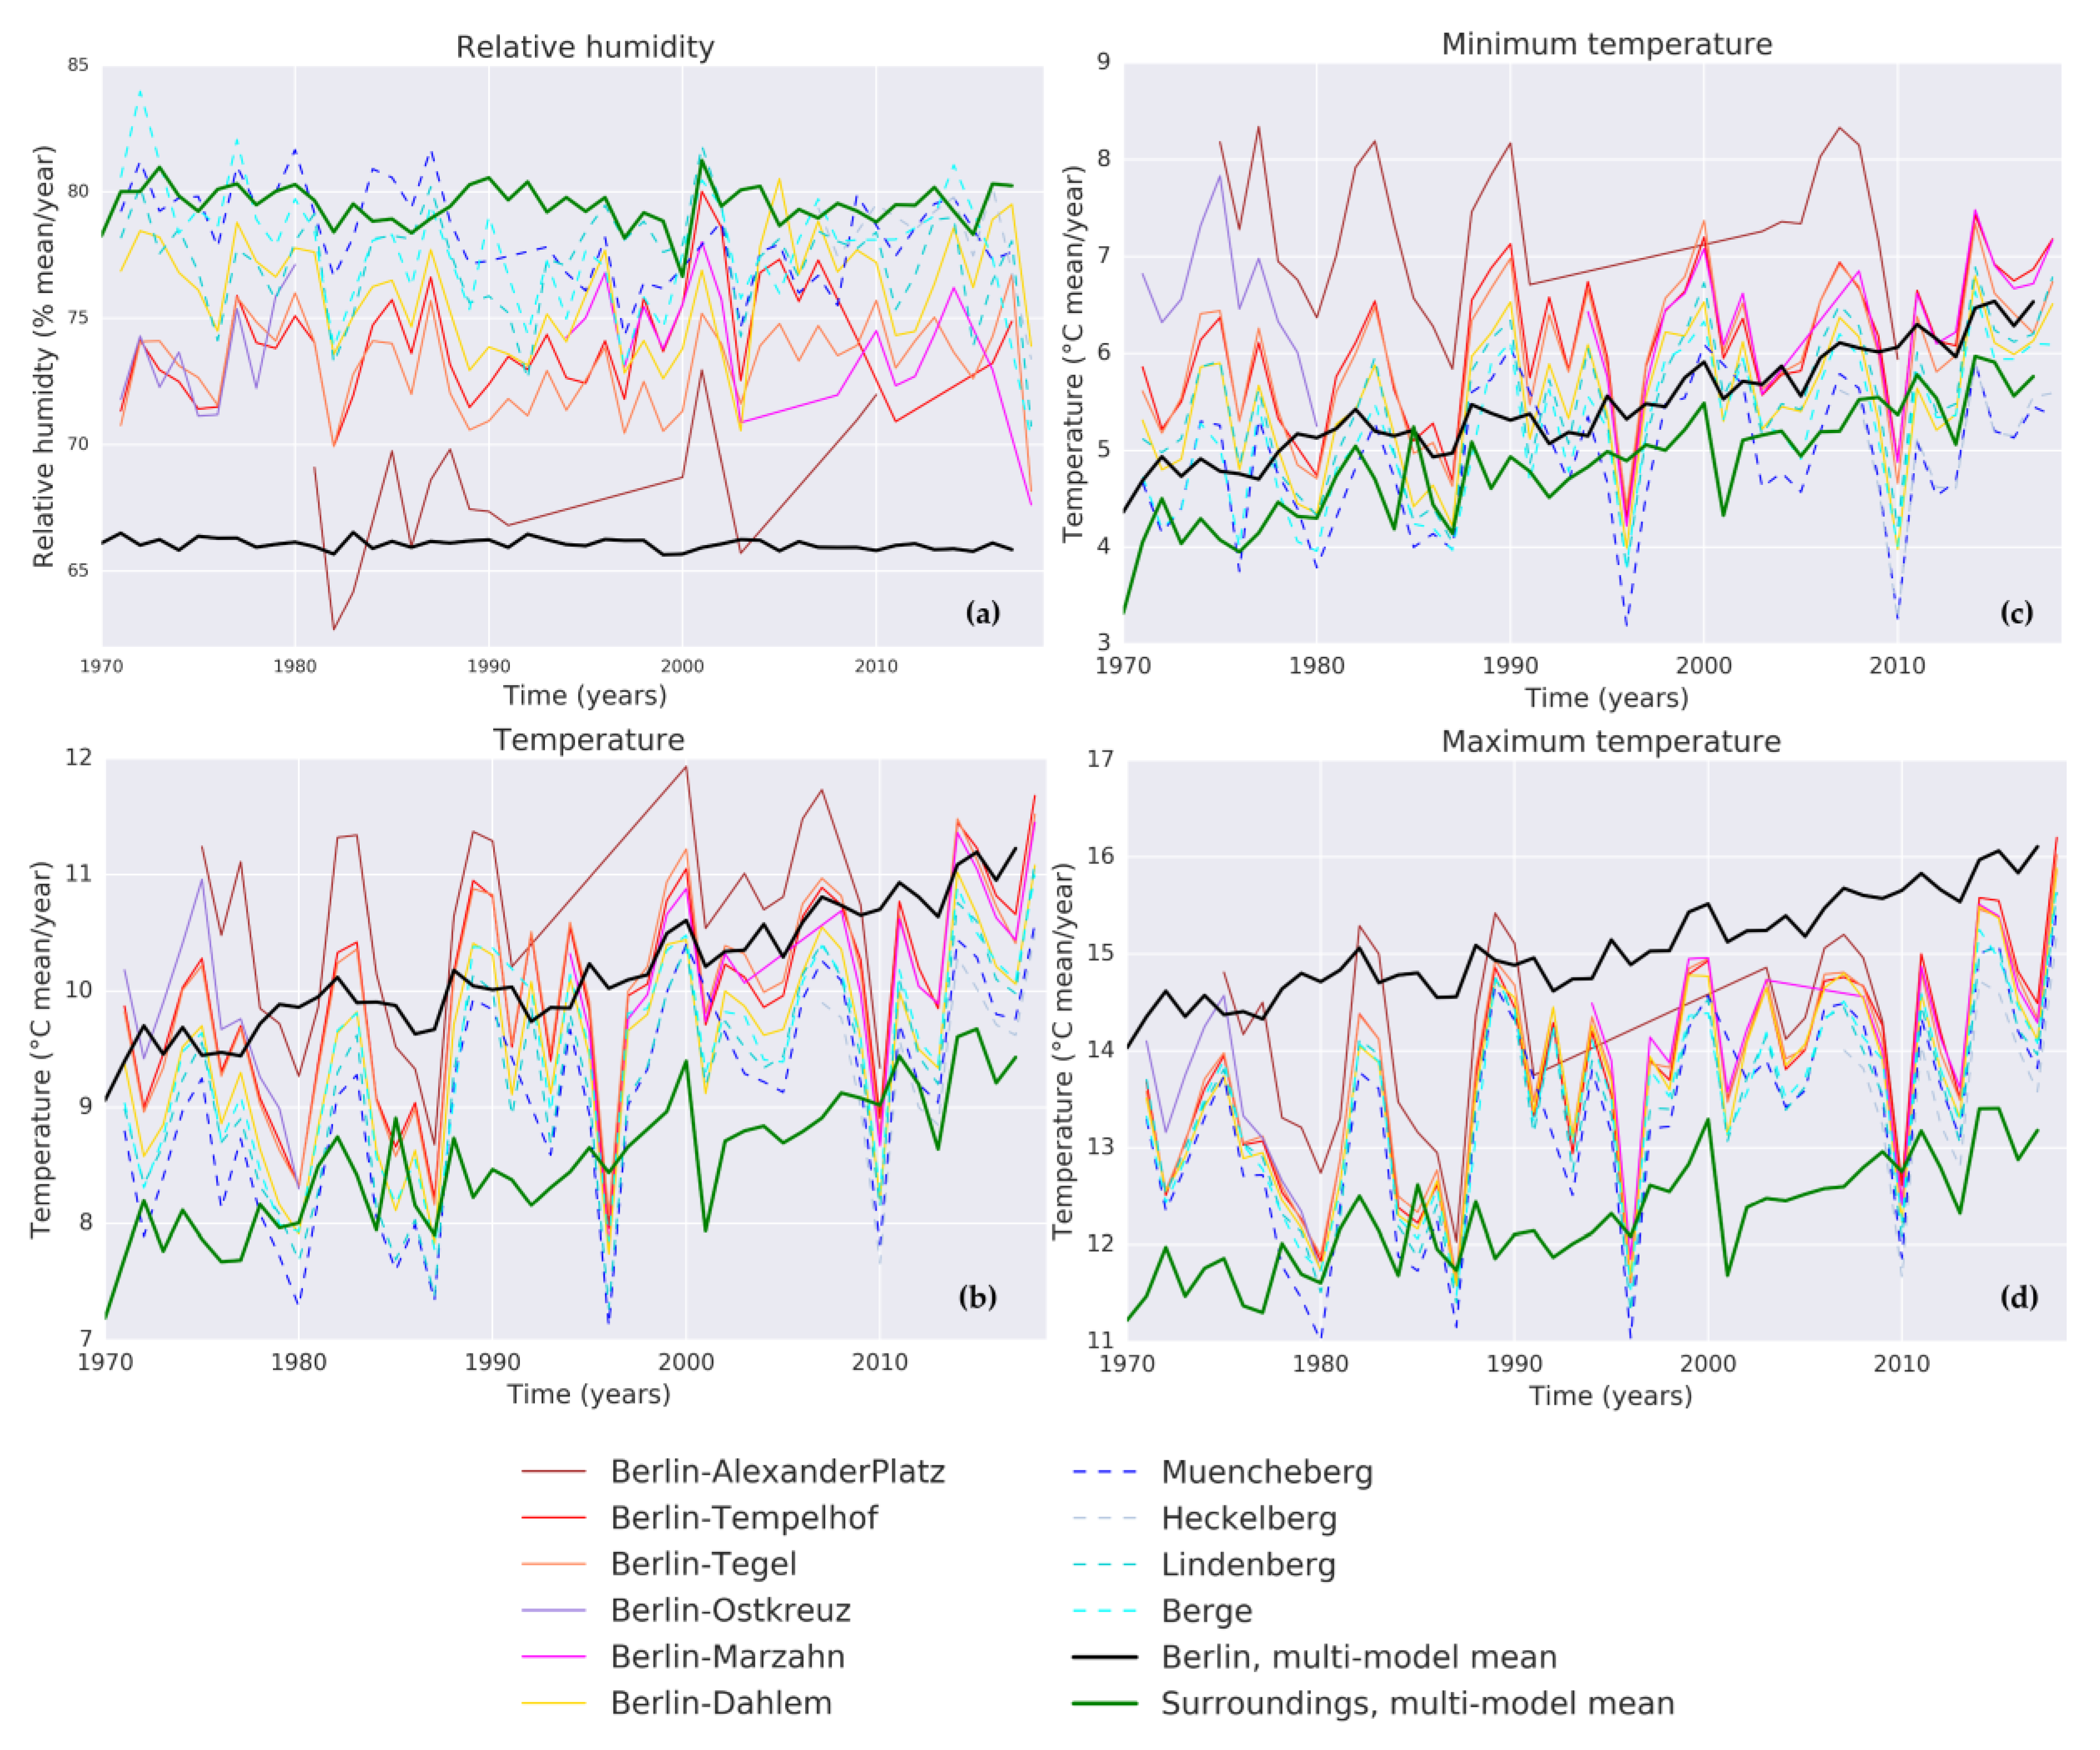
3.1. Models and Observations
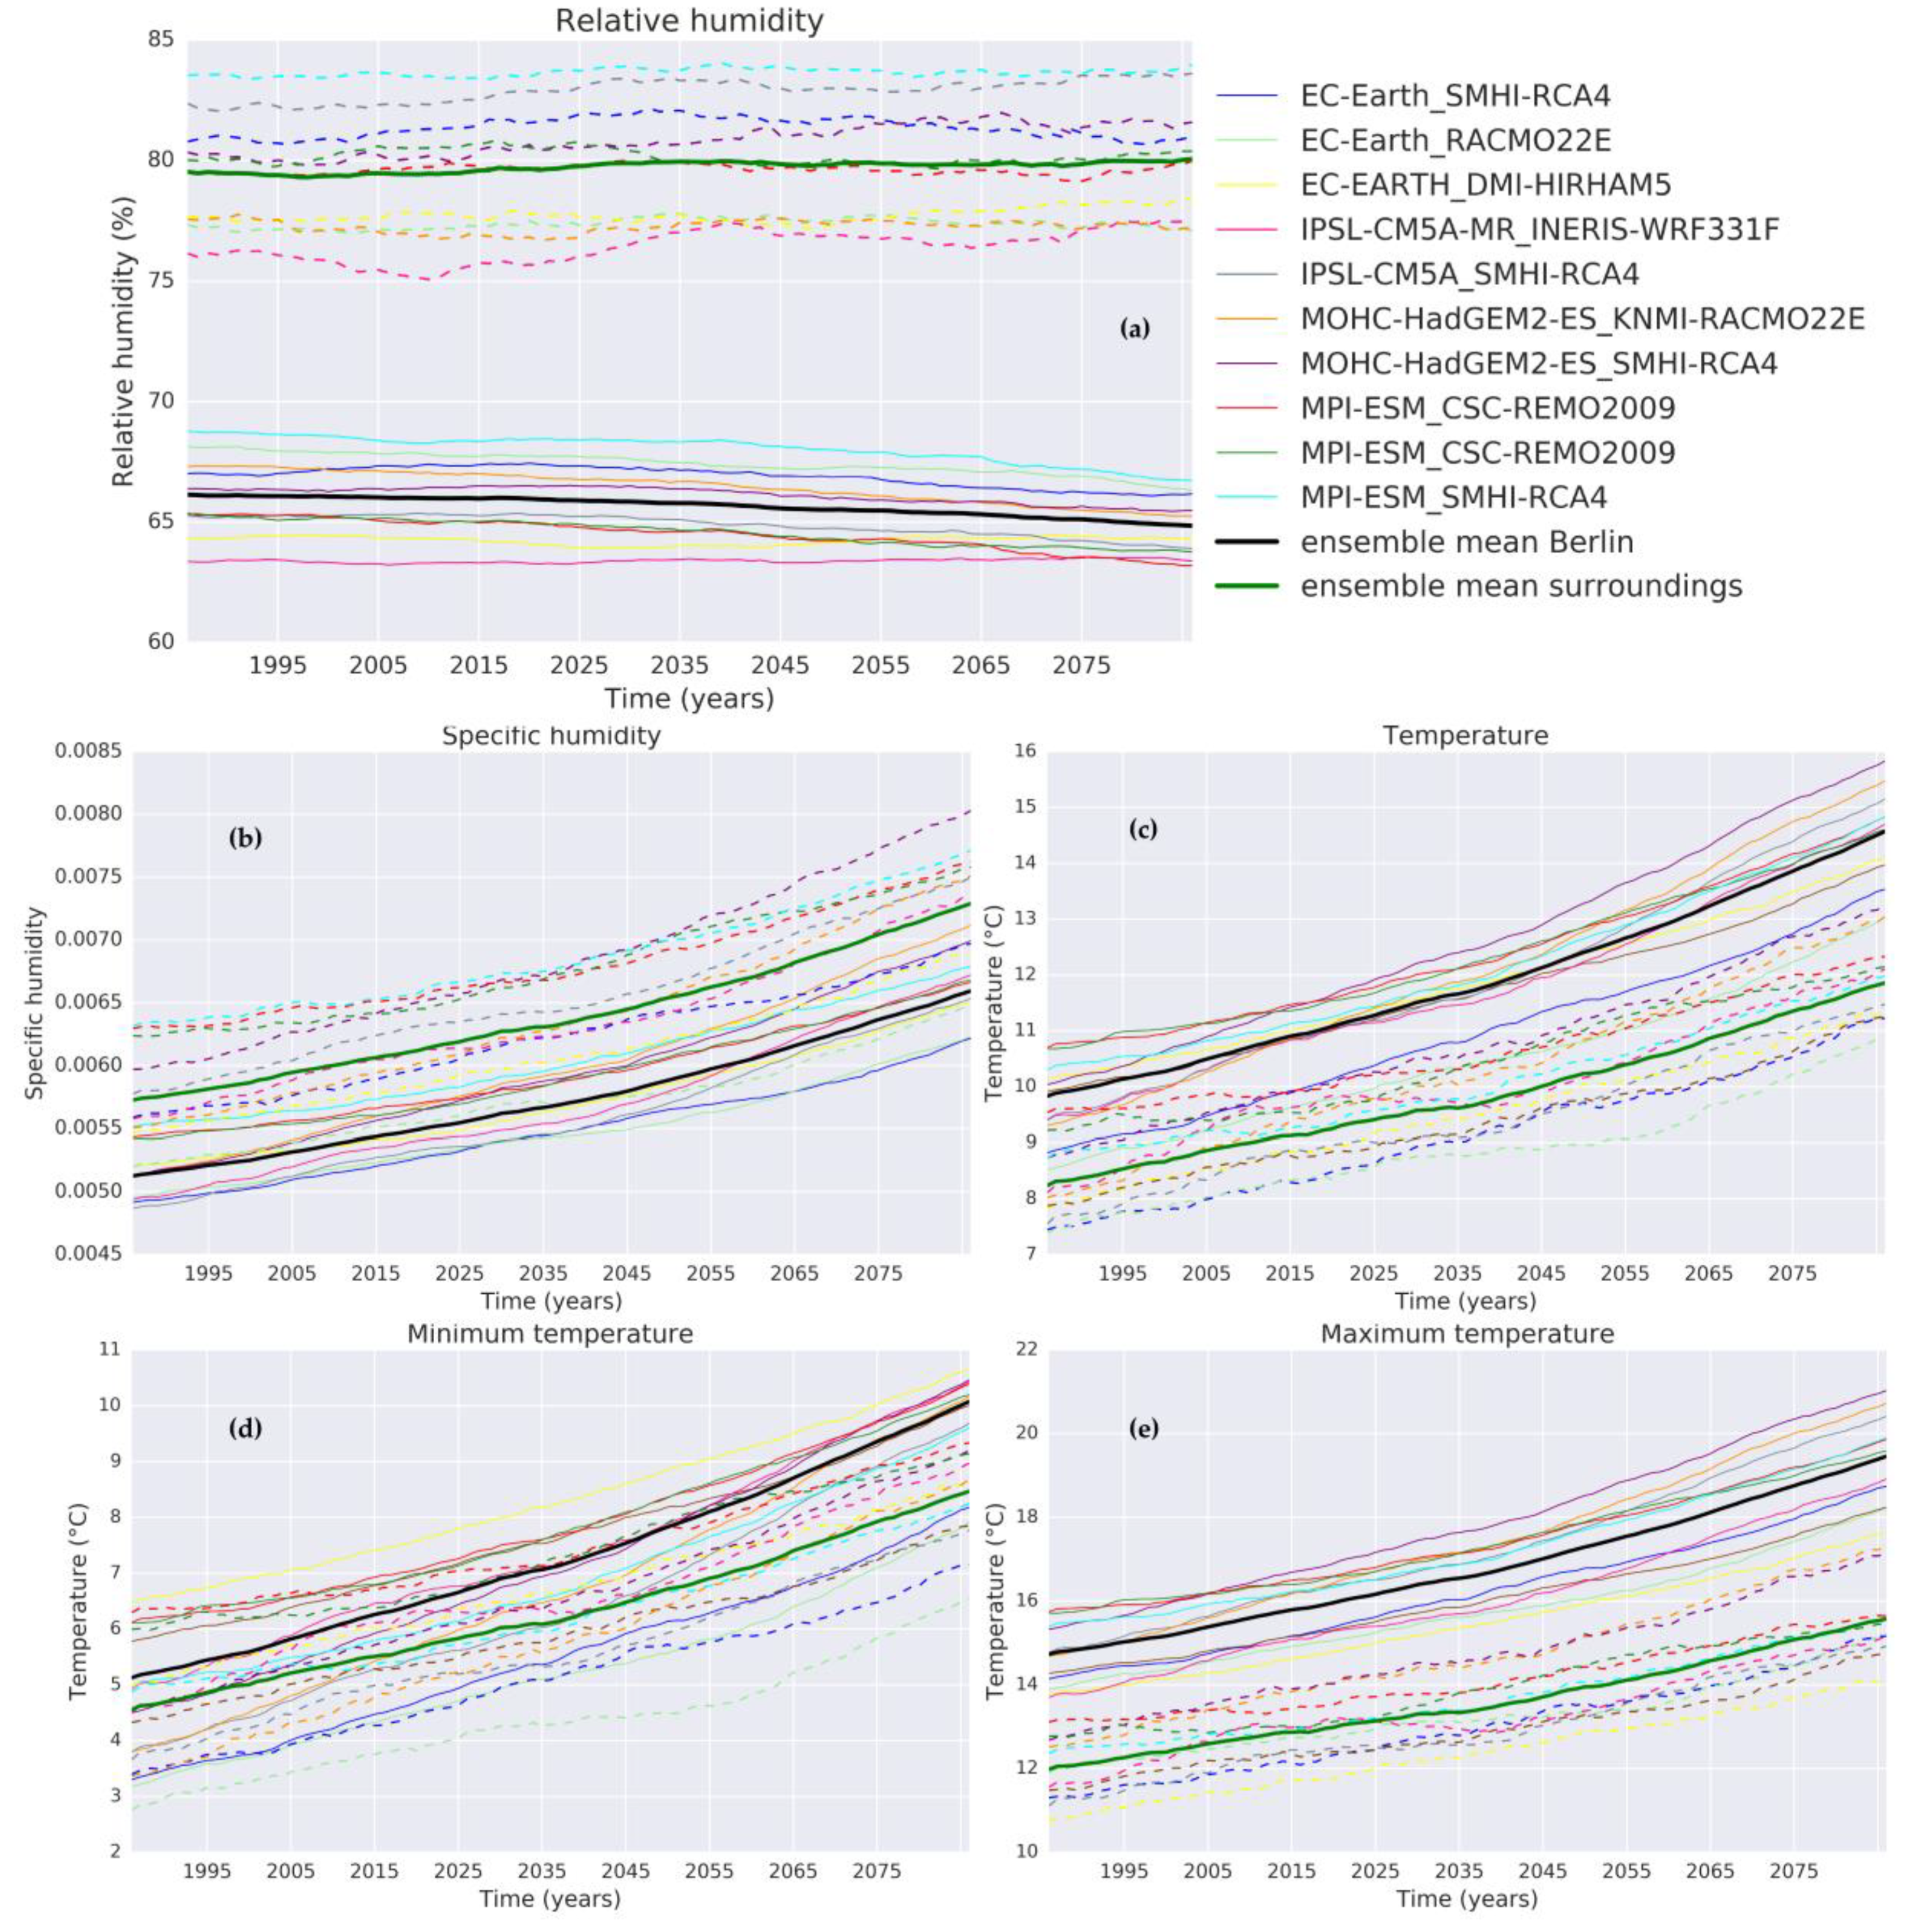
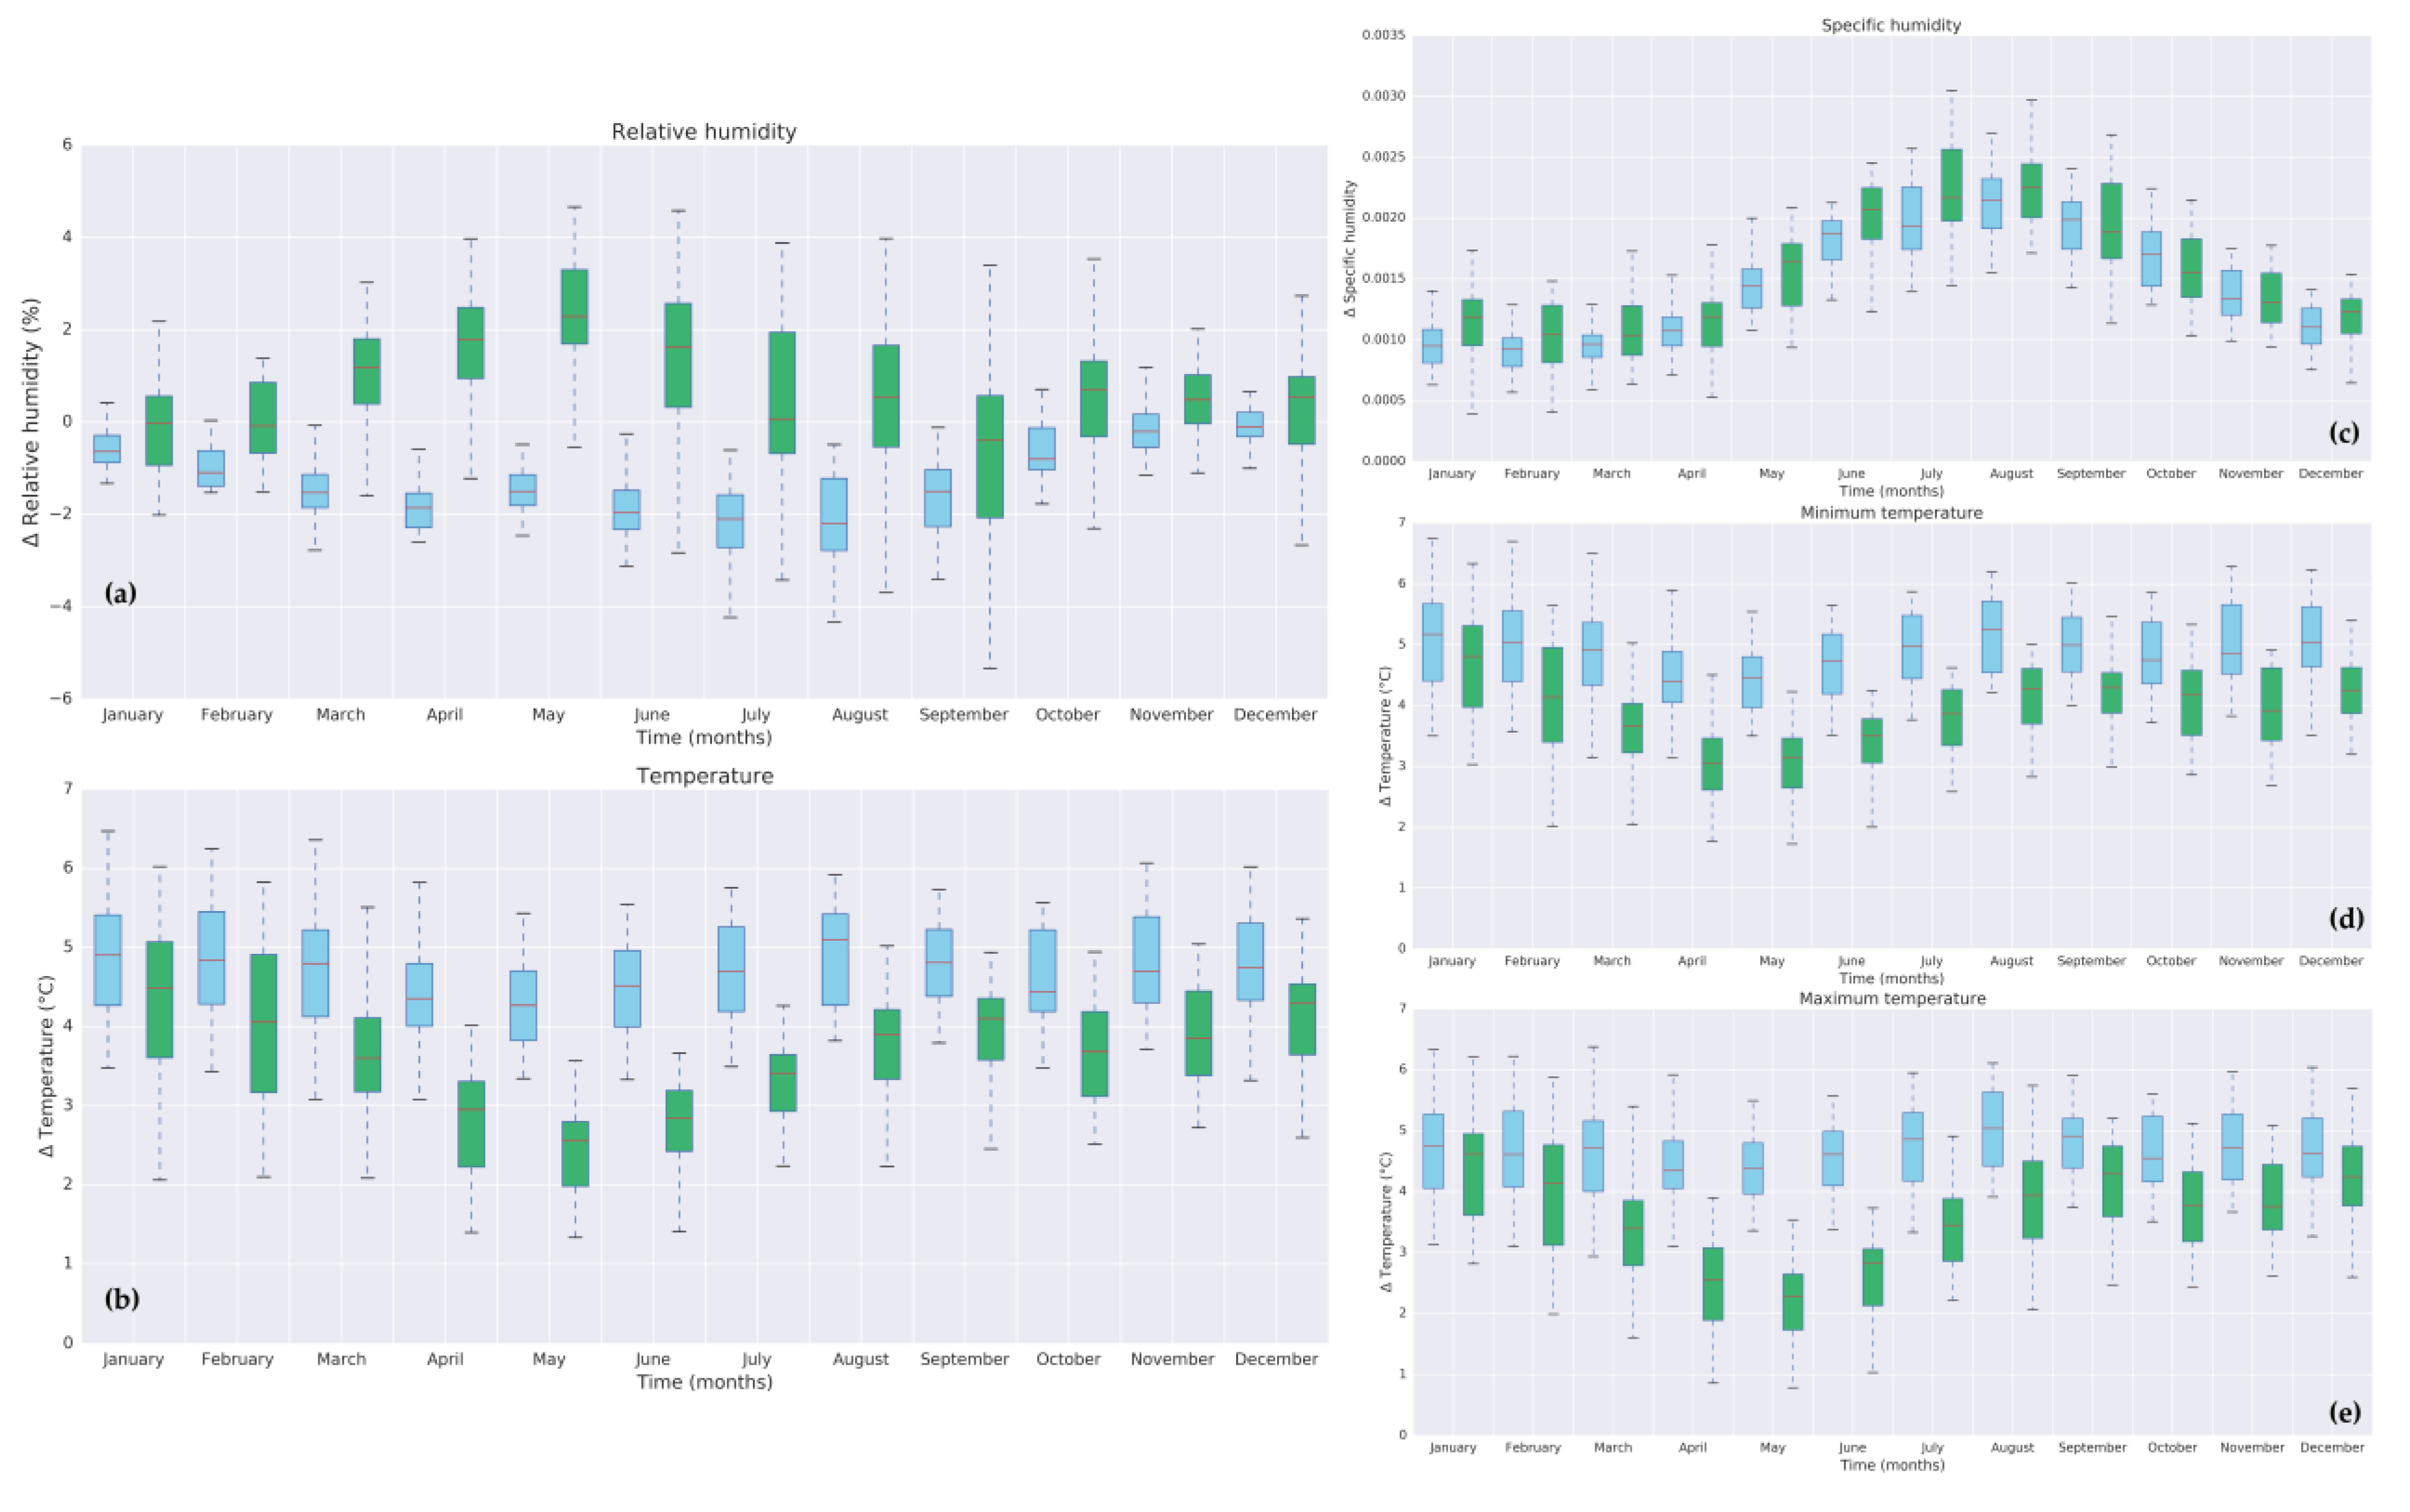
3.2. Humidity under Climate Change
4. Discussion
5. Conclusions
Author Contributions
Funding
Acknowledgments
Conflicts of Interest
Appendix A

| Name of Institution | Model Versions Used for EURO-CORDEX Simulations on ESGF | Urban Representation | Description and References |
|---|---|---|---|
| Climate Service Center Germany (GERICS) | REMO2009 | Bulk | Land-use type urban. Urban is treated as rock surfaces. Roughness length and albedo adjusted. No field capacity, nor vegetation. Fractional approach [49,50]. |
| Swedish Meteorological and Hydrological Institute (SMHI) | RCA4 | Bulk | Land-use physiography is based on ECOCLIMAP land-surface database [45]. RCA4 includes no further direct reference to urban parameterizations [48]. |
| Royal Netherlands Meteorological Institute (KNMI) | RACMO22E | Bulk | RACMO22E is based on CY31r1 Urban fraction based on ECOCLIMAP land-surface database [45]. Dominant tile approach. Roughness lengths and surface interactions adjusted for urban land cover [46]. |
| Danish Meteorological Institute (DMI) | HIRHAM5 | Bulk | HIRHAM5 [51] includes ECHAM4 [52]. Urban represented through adjusted constant surface parameters. |
| Institute Pierre Simon Laplache(IPSL) | CM5A-MR- WRF331F | Bulk | The vegetation/soil parameters are adjusted for urban land surface type (e.g., albedo and roughness length) [66] in NOAH-LSM [47]. Urban Canopy model available but not turned on for EURO-CORDEX simulations. |
| Climate Limit-Area Modeling Community (CLM) | COSMO-CLM | Bulk | Surface land cover type urban. Each sub-grid land cover type is a separate column for energy and water calculations [44]. TERRA-LM is used for EURO-CORDEX simulations. |
| MK Test | Levene Test | MWW Test | |||||
|---|---|---|---|---|---|---|---|
| Model Combination (GCM_RCM) | Direction | p Value | t Value | p Value | t Value | p Value | |
| Berlin | EC-EARTH_RCA4 | Decreasing | 2.58 × 10−06 | 0.0003 | 0.9855 | 226 | 0.0002 |
| EC-EARTH_RACMO22E | Decreasing | 3.33 × 10⁻¹⁵ | 0.2236 | 0.6380 | 156 | 2.54 × 10−06 | |
| EC-EARTH_HIRHAM5 | No trend | 0.8689 | 0.3136 | 0.5775 | 446 | 0.3161 | |
| CM5A-MR_WRF331F | No trend | 0.5196 | 16.184 | 0.2082 | 405 | 0.1455 | |
| CM5A-MR_RCA4 | Decreasing | 3.97 × 10⁻¹¹ | 61.218 | 0.0162 | 159 | 3.10 × 10−06 | |
| HadGEM2_RCA4 | Decreasing | 5.64 × 10−07 | 21.851 | 0.1446 | 231 | 0.0002 | |
| HadGEM2_RACMO22E | Decreasing | 0.0000 | 0.1718 | 0.6800 | 40 | 2.92 × 10⁻¹⁰ | |
| MPI-ESM-LR_REMO2009(r1) | Decreasing | 2.22 × 10⁻¹⁶ | 57.208 | 0.0199 | 80 | 8.94 × 10−09 | |
| MPI-ESM-LR_REMO2009(r2) | Decreasing | 4.88 × 10⁻¹⁴ | 24.869 | 0.1201 | 102 | 5.14 × 10−08 | |
| Surroundings | EC-EARTH_RCA4 | No trend | 0.3124 | 91.139 | 0.0037 | 447 | 0.3211 |
| EC-EARTH_RACMO22E | No trend | 0.7353 | 29.544 | 0.0908 | 474 | 0.4663 | |
| EC-EARTH_HIRHAM5 | Increasing | 0.0329 | 0.4255 | 0.5167 | 372 | 0.0642 | |
| CM5A-MR_WRF331F | Increasing | 0.0061 | 0.6487 | 0.4238 | 331 | 0.0180 | |
| CM5A-MR_RCA4 | Increasing | 0.0001 | 0.3001 | 0.5858 | 227 | 0.0002 | |
| HadGEM2_RCA4 | Increasing | 0.0225 | 0.0003 | 0.9870 | 364 | 0.0512 | |
| HadGEM2_RACMO22E | No trend | 0.7967 | 0.0299 | 0.8632 | 460 | 0.3891 | |
| MPI-ESM-LR_REMO2009(r1) | No trend | 0.4589 | 0.0414 | 0.8395 | 452 | 0.3467 | |
| MPI-ESM-LR_REMO2009(r2) | No trend | 0.8154 | 0.0099 | 0.9212 | 462 | 0.4000 | |
| Variables | ||||||
|---|---|---|---|---|---|---|
| Model Combination (GCM_RCM) | RH (%) | SH (-) | Tas (°C) | Tasmax (°C) | Tasmin (°C) | |
| Berlin | EC-EARTH_RCA4 | 0.80 | 0.00017 | 0.60 | 0.59 | 0.62 |
| EC-EARTH_RACMO22E | 0.76 | 0.00017 | 0.62 | 0.60 | 0.64 | |
| EC-EARTH_HIRHAM5 | 0.46 | 0.00013 | 0.48 | 0.46 | 0.52 | |
| CM5A-MR_WRF331F | 0.55 | 0.00022 | 0.85 | 0.83 | 0.88 | |
| CM5A-MR_RCA4 | 0.58 | 0.00021 | 0.79 | 0.80 | 0.78 | |
| HadGEM2_RCA4 | 0.61 | 0.00019 | 0.71 | 0.71 | 0.71 | |
| HadGEM2_RACMO22E | 0.71 | 0.00021 | 0.78 | 0.77 | 0.79 | |
| MPI-ESM-LR_REMO2009(r1) | 0.72 | 0.00014 | 0.47 | 0.47 | 0.49 | |
| MPI-ESM-LR_REMO2009(r2) | 0.68 | 0.00014 | 0.52 | 0.54 | 0.54 | |
| Surroundings | EC-EARTH_RCA4 | 1.83 | 0.00026 | 0.75 | 0.79 | 0.78 |
| EC-EARTH_RACMO22E | 1.64 | 0.00024 | 0.82 | 0.83 | 0.80 | |
| EC-EARTH_HIRHAM5 | 1.51 | 0.00021 | 0.79 | 0.80 | 0.81 | |
| CM5A-MR_WRF331F | 2.14 | 0.00029 | 1.34 | 1.35 | 1.38 | |
| CM5A-MR_RCA4 | 1.56 | 0.00030 | 1.09 | 1.20 | 1.04 | |
| HadGEM2_RCA4 | 2.39 | 0.00030 | 0.99 | 1.14 | 0.90 | |
| HadGEM2_RACMO22E | 1.98 | 0.00025 | 1.06 | 1.08 | 1.06 | |
| MPI-ESM-LR_REMO2009(r1) | 1.88 | 0.00026 | 0.71 | 0.77 | 0.72 | |
| MPI-ESM-LR_REMO2009(r2) | 2.11 | 0.00023 | 0.82 | 0.87 | 0.86 | |


References
- UN-HABITAT. Urbanization and Development: Emerging Futures World Cities Report 2016; United Nations Human Settlements Programme (UN-Habitat): Nairobi, Kenya, 2016. [Google Scholar] [CrossRef]
- ONU. New Urban Agenda. In Health Visit; United Nations Habitat III: Geneva, Switzerland, 2017; ISBN 978-92-1-132757-1. [Google Scholar]
- Rosenzweig, C.; Solecki, W.; Romero-Lankao, P.; Mehrotra, S.; Dhakal, S.; Bowman, T.; Ibrahim, S.A. Climate Change and Cities: Second Assessment Report of the Urban Climate Change Research Network. In Climate Change and Cities; Cambridge University Press: Cambridge, UK, 2018. [Google Scholar] [CrossRef]
- Baklanov, A.; Grimmond, C.S.B.; Carlson, D.; Terblanche, D.; Tang, X.; Bouchet, V.; Lee, B.; Langendijk, G.; Kolli, R.K.; Hovsepyan, A. From Urban Meteorology, Climate and Environment Research to Integrated City Services. Urban Clim. 2018, 23, 330–341. [Google Scholar] [CrossRef]
- Grimmond, C.S.B.; Roth, M.; Oke, T.R.; Au, Y.C.; Best, M.; Betts, R.; Carmichael, G.; Cleugh, H.; Dabberdt, W.; Emmanuel, R.; et al. Climate and More Sustainable Cities: Climate Information for Improved Planning and Management of Cities (Producers/Capabilities Perspective). Procedia Environ. Sci. 2010, 1, 247–274. [Google Scholar] [CrossRef]
- Bai, X.; Dawson, R.J.; Ürge-Vorsatz, D.; Delgado, G.C.; Salisu Barau, A.; Dhakal, S.; Dodman, D.; Leonardsen, L.; Masson-Delmotte, V.; Roberts, D.C.; et al. Six Research Priorities for Cities and Climate Change. Nature 2018, 555, 23–25. [Google Scholar] [CrossRef] [PubMed]
- Jacob, D.; Petersen, J.; Eggert, B.; Alias, A.; Christensen, O.B.; Bouwer, L.M.; Braun, A.; Colette, A.; Déqué, M.; Georgievski, G.; et al. EURO-CORDEX: New High-Resolution Climate Change Projections for European Impact Research. Reg. Environ. Chang. 2014, 14, 563–578. [Google Scholar] [CrossRef]
- Giorgi, F.; Gutowski, W.J. Regional Dynamical Downscaling and the CORDEX Initiative. Annu. Rev. Environ. Resour. 2015, 40, 467–490. [Google Scholar] [CrossRef]
- Gutowski, J.W.; Giorgi, F.; Timbal, B.; Frigon, A.; Jacob, D.; Kang, H.S.; Raghavan, K.; Lee, B.; Lennard, C.; Nikulin, G.; et al. WCRP COordinated Regional Downscaling EXperiment (CORDEX): A Diagnostic MIP for CMIP6. Geosci. Model Dev. 2016, 9, 4087–4095. [Google Scholar] [CrossRef]
- Daniel, M.; Lemonsu, A.; Déqué, M.; Somot, S.; Alias, A.; Masson, V. Benefits of Explicit Urban Parameterization in Regional Climate Modeling to Study Climate and City Interactions. In Climate Dynamics; Springer: Berlin, Germany, 2018; pp. 1–20. [Google Scholar] [CrossRef]
- Chen, F.; Kusaka, H.; Bornstein, R.; Ching, J.; Grimmond, C.S.B.; Grossman-Clarke, S.; Loridan, T.; Manning, K.W.; Martilli, A.; Miao, S.; et al. The Integrated WRF/Urban Modelling System: Development, Evaluation, and Applications to Urban Environmental Problems. Int. J. Climatol. 2011, 31, 273–288. [Google Scholar] [CrossRef]
- Trusilova, K.; Schubert, S.; Wouters, H.; Früh, B.; Grossman-Clarke, S.; Demuzere, M.; Becker, P. The Urban Land Use in the COSMO-CLM Model: A Comparison of Three Parameterizations for Berlin. Meteorol. Z. 2016, 25, 231–244. [Google Scholar] [CrossRef]
- Best, M.J.; Grimmond, C.S.B. Analysis of the Seasonal Cycle Within the First International Urban Land-Surface Model Comparison. Bound. Layer Meteorol. 2013, 146, 421–446. [Google Scholar] [CrossRef]
- Best, M.J.; Grimmond, C.S.B. Investigation of the Impact of Anthropogenic Heat Flux within an Urban Land Surface Model and PILPS-Urban. Theor. Appl. Climatol. 2016, 126, 51–60. [Google Scholar] [CrossRef]
- Masson, V. Urban Surface Modeling and the Meso-Scale Impact of Cities. Theor. Appl. Climatol. 2006, 84, 35–45. [Google Scholar] [CrossRef]
- Karlický, J.; Huszár, P.; Halenka, T.; Belda, M.; Žák, M.; Pišoft, P.; Mikšovský, J. Multi-Model Comparison of Urban Heat Island Modelling Approaches. Atmos. Chem. Phys. 2018, 18, 10655–10674. [Google Scholar] [CrossRef]
- De Ridder, K.; Lauwaet, D.; Maiheu, B. UrbClim—A Fast Urban Boundary Layer Climate Model. Urban Clim. 2015, 12, 21–48. [Google Scholar] [CrossRef]
- Huszar, P.; Halenka, T.; Belda, M.; Zak, M.; Sindelarova, K.; Miksovsky, J. Regional Climate Model Assessment of the Urban Land-Surface Forcing over Central Europe. Atmos. Chem. Phys. 2014, 14, 12393–12413. [Google Scholar] [CrossRef]
- Lauwaet, D.; Hooyberghs, H.; Maiheu, B.; Lefebvre, W.; Driesen, G.; Van Looy, S.; De Ridder, K. Detailed Urban Heat Island Projections for Cities Worldwide: Dynamical Downscaling CMIP5 Global Climate Models. Climate 2015, 3, 391–415. [Google Scholar] [CrossRef]
- Wiesner, S.; Bechtel, B.; Fischereit, J.; Gruetzun, V.; Hoffmann, P.; Leitl, B.; Rechid, D.; Schlünzen, K.; Thomsen, S. Is It Possible to Distinguish Global and Regional Climate Change from Urban Land Cover Induced Signals? A Mid-Latitude City Example. Urban Sci. 2018, 2, 12. [Google Scholar] [CrossRef]
- Robaa, S.M. Urban-Suburban/Rural Differences over Greater Cairo, Egypt. Atmosfera 2003, 16, 157–171. [Google Scholar]
- Ackerman, B. Climatology of Chicago Area Urban-Rural Differences in Humidity. J. Clim. Appl. Meteorol. 2002, 26, 427–430. [Google Scholar] [CrossRef]
- Tapper, N.J. Urban Influences on Boundary Layer Temperature and Humidity: Results from Christchurch, New Zealand. Atmos. Environ. Part B Urban Atmos. 1990, 24, 19–27. [Google Scholar] [CrossRef]
- Hage, K.D. Urban-Rural Humidity Differences. J. Appl. Meteorol. 1975, 14, 1277–1283. [Google Scholar] [CrossRef]
- Fortuniak, K.; Kłysik, K.; Wibig, J. Urban—Rural Contrasts of Meteorological Parameters in Łódź. Theor. Appl. Climatol. 2006, 84, 91–101. [Google Scholar] [CrossRef]
- Jåuregui, E.; Tejeda, A. Urban-Rural Humidity Contrasts in Mexico City. Int. J. Climatol. 1997, 17, 187–196. [Google Scholar] [CrossRef]
- Unkašević, M.; Jovanović, O.; Popović, T. Urban-Suburban/Rural Vapour Pressure and Relative Humidity Differences at Fixed Hours over the Area of Belgrade City. Theor. Appl. Climatol. 2001, 68, 67–73. [Google Scholar] [CrossRef]
- Kuttler, W.; Weber, S.; Schonnefeld, J.; Hesselschwerdt, A. Urban/Rural Atmospheric Water Vapour Pressure Differences and Urban Moisture Excess in Krefeld, Germany. Int. J. Climatol. 2007, 27, 2005–2015. [Google Scholar] [CrossRef]
- Lee, D.O. Urban–Rural Humidity Differences in London. Int. J. Climatol. 1991, 11, 577–582. [Google Scholar] [CrossRef]
- Unger, J. Urban-Rural Air Humidity Differences in Szeged, Hungary. Int. J. Climatol. 1999, 19, 1509–1515. [Google Scholar] [CrossRef]
- Lokoshchenko, M.A. Urban Heat Island and Urban Dry Island in Moscow and Their Centennial Changes. J. Appl. Meteorol. Climatol. 2017, 56, 2729–2745. [Google Scholar] [CrossRef]
- Moriwaki, R.; Watanabe, K.; Morimoto, K. Urban dry island phenomenon and its impact on cloud base level. J. JSCE 2013, 1, 521–529. [Google Scholar] [CrossRef]
- Coccolo, S.; Kämpf, J.; Scartezzini, J.L.; Pearlmutter, D. Outdoor Human Comfort and Thermal Stress: A Comprehensive Review on Models and Standards. In Urban Climate; Elsevier B.V.: Amsterdam, The Netherlands, 2016; pp. 33–57. [Google Scholar] [CrossRef]
- Chiabai, A.; Quiroga, S.; Martinez-Juarez, P.; Higgins, S.; Taylor, T. The Nexus between Climate Change, Ecosystem Services and Human Health: Towards a Conceptual Framework. Sci. Total Environ. 2018, 635, 1191–1204. [Google Scholar] [CrossRef]
- Rohat, G.; Flacke, J.; Dosio, A.; Dao, H.; van Maarseveen, M. Projections of Human Exposure to Dangerous Heat in African Cities Under Multiple Socioeconomic and Climate Scenarios. Earth’s Futur 2019, 7, 528–546. [Google Scholar] [CrossRef] [Green Version]
- Abuku, M.; Janssen, H.; Roels, S. Impact of Wind-Driven Rain on Historic Brick Wall Buildings in a Moderately Cold and Humid Climate: Numerical Analyses of Mould Growth Risk, Indoor Climate and Energy Consumption. Energy Build. 2009, 41, 101–110. [Google Scholar] [CrossRef] [Green Version]
- Blocken, B.; Carmeliet, J. A Review of Wind-Driven Rain Research in Building Science. J. Wind Eng. Ind. Aerodyn. 2004, 92, 1079–1130. [Google Scholar] [CrossRef]
- Elmqvist, T.; Goodness, J.; Marcotullio, P.J.; Parnell, S.; Sendstad, M.; Wilkinson, C.; Fragkias, M.; Güneralp, B.; McDonald, R.I.; Schewenius, M.; et al. Urbanization, Biodiversity and Ecosystem Services: Challenges and Opportunities: A Global Assessment; Springer: Heidelberg, Germany, 2013. [Google Scholar] [CrossRef] [Green Version]
- Lahr, E.C.; Dunn, R.R.; Frank, S.D. Getting Ahead of the Curve: Cities as Surrogates for Global Change. Proc. R. Soc. B Biol. Sci. 2018, 285, 20180643. [Google Scholar] [CrossRef] [PubMed]
- Amt für Statistik Berlin-Brandenburg. Statistiken Berlin und Brandenburg. Available online: https://www.statistik-berlin-brandenburg.de/statistiken/Inhalt-Statistiken.asp (accessed on 26 July 2019).
- Statistiken Berlin und Brandenburg Flaechenutzung. Available online: https://www.statistik-berlin-brandenburg.de/BasisZeitreiheGrafik/Bas-Flaechennutzung.asp?Ptyp=300&Sageb=33000&creg=BBB&anzwer=6 (accessed on 10 June 2019).
- EEA. The Revised and Supplemented Corine Land Cover Nomenclature, EEA Technical Report No. 40; European Environment Agency: Copehagen, Denmark, 2000. [Google Scholar]
- German Climate Computing Centre (DKRZ); Earth System Grid Federation (ESGF); World Climate Research programme (WCRP); Coordinated Regional Climate Downscaling Experiment (CORDEX); G.C.C. Earth System Grid Federation WCRP CORDEX Data Node. Available online: https://esgf-data.dkrz.de/search/cordex-dkrz/ (accessed on 20 November 2018).
- Rockel, B.; Will, A.; Hense, A. The Regional Climate Model COSMO-CLM (CCLM). Meteorol. Z. 2008, 17, 347–348. [Google Scholar] [CrossRef]
- Masson, V.; Champeaux, J.L.; Chauvin, F.; Meriguet, C.; Lacaze, R. A Global Database of Land Surface Parameters at 1-Km Resolution in Meteorological and Climate Models. J. Clim. 2003, 16, 1261–1282. [Google Scholar] [CrossRef]
- Van Meijgaard, E.; Van Ulft, L.H.; Van De Berg, W.J.; Bosveld, F.C.; Van Den Hurk, B.J.J.M.; Lenderink, G.; Siebesma, A.P. The KNMI Regional Atmospheric Climate Model RACMO; Version 2.1; Koninklijk Nederlands Meteorologisch Instituut (KNMI): de Bilt, The Netherlands, 2008. [Google Scholar]
- Niu, G.Y.; Yang, Z.L.; Mitchell, K.E.; Chen, F.; Ek, M.B.; Barlage, M.; Kumar, A.; Manning, K.; Niyogi, D.; Rosero, E.; et al. The Community Noah Land Surface Model with Multiparameterization Options (Noah-MP): 1. Model Description and Evaluation with Local-Scale Measurements. J. Geophys. Res. Atmos. 2011, 116. [Google Scholar] [CrossRef] [Green Version]
- Samuelsson, P.; Jones, C.G.; Willén, U.; Ullerstig, A.; Gollvik, S.; Hansson, U.; Jansson, C.; Kjellström, E.; Nikulin, G.; Wyser, K. The Rossby Centre Regional Climate Model RCA3: Model Description and Performance. Tellus Ser. A Dyn. Meteorol. Oceanogr. 2011, 63, 4–23. [Google Scholar] [CrossRef] [Green Version]
- Jacob, D.; Elizalde, A.; Haensler, A.; Hagemann, S.; Kumar, P.; Podzun, R.; Rechid, D.; Remedio, A.R.; Saeed, F.; Sieck, K.; et al. Assessing the Transferability of the Regional Climate Model REMO to Different Coordinated Regional Climate Downscaling Experiment (CORDEX) Regions. Atmosphere (Basel) 2012, 3, 181–199. [Google Scholar] [CrossRef] [Green Version]
- Jacob, D.; Podzun, R. Sensitivity Studies with the Regional Climate Model REMO. Meteorol. Atmos. Phys. 1997, 63, 119–129. [Google Scholar] [CrossRef]
- Christensen, O.B.; Drews, M.; Christensen, J.H.; Dethloff, K.; Ketelsen, K.; Hebestadt, I.; Rinke, A. The HIRHAM Regional Climate Model Version 5 (Beta), Technical Report 06-17; Danish Climate Center (DMI): Copenhagen, Denmark, 2007. [Google Scholar]
- Roeckner, E.; Arpe, K.; Bengtsson, L.; Christoph, M.; Claussen, M.; Dümenil, L.; Esch, M.; Giorgetta, M.A.; Schlese, U.; Schulzweida, U. The Atmospheric General Circulation Model Echam-4: Model Description and Simulation of Present-Day Climate; Max-Planck-Institut für Meteorologie: Hamburg, Germany, 1996. [Google Scholar]
- Deutsche Wetter Dienst (DWD). German Weather Service, Climate Data Center (CDC). Available online: https://cdc.dwd.de/portal/ (accessed on 25 January 2019).
- DWD Climate Data Center (CDC): Annual Mean of Station Observations of Relative Humidity at 2 m above Ground in %, Version V18.3. Available online: https://cdc.dwd.de/portal/ (accessed on 20 May 2019).
- DWD Climate Data Center (CDC): Annual Mean of Station Observations of Daily Air Temperature Minimum at 2 m above Ground in °C (for TasMin), Version V18.3. Available online: https://cdc.dwd.de/portal/ (accessed on 20 May 2019).
- DWD Climate Data Center (CDC): Annual Mean of Station Observations of Daily Air Temperature Maximum at 2 m above Ground in °C (for TasMax), Version V18.3. Available online: https://cdc.dwd.de/portal/ (accessed on 20 May 2019).
- DWD Climate Data Center (CDC): Annual Mean of Station Observations of Air Temperature at 2 m above Ground in °C (for Tas), Version V18.3. Available online: https://cdc.dwd.de/portal/ (accessed on 20 May 2019).
- Hass, A.L.; Ellis, K.N.; Mason, L.R.; Hathaway, J.M.; Howe, D.A. Heat and Humidity in the City: Neighborhood Heat Index Variability in a Mid-Sized City in the Southeastern United States. Int. J. Environ. Res. Public Health 2016, 13, 117. [Google Scholar] [CrossRef]
- van Vuuren, D.P.; Edmonds, J.; Kainuma, M.; Riahi, K.; Thomson, A.; Hibbard, K.; Hurtt, G.C.; Kram, T.; Krey, V.; Lamarque, J.F.; et al. The Representative Concentration Pathways: An Overview. Clim. Chang. 2011, 102, 5. [Google Scholar] [CrossRef]
- Hennemuth, B.; Bender, S.; Bülow, K.; Dreier, N.; Keup-Thiel, E.; Krüger, O.; Mudersbach, C.; Radermacher, C.; Schoetter, R. Statistical Methods for the Analysis of Simulated and Observed Climate Data Applied in Projects and Institutions Dealing with Climate Change Impact and Adaptation. CSC Rep. 2013, 13, 1–135. [Google Scholar]
- Mann, H.B. Nonparametric Tests Against Trend. Econometrica 1945, 13, 245–259. [Google Scholar] [CrossRef]
- Kendall, M.G. Rank Correlation Methods. By Maurice G. Kendall, M.A. [Pp. Vii + 160. London: Charles Griffin and Co. Ltd., 42 Drury Lane, 1948. 18 S]. J. Inst. Actuar. 1949, 75, 140–141. [Google Scholar] [CrossRef]
- Pfeifer, S.; Bülow, K.; Gobiet, A.; Hänsler, A.; Mudelsee, M.; Otto, J.; Rechid, D.; Teichmann, C.; Jacob, D. Robustness of Ensemble Climate Projections Analyzed with Climate Signal Maps: Seasonal and Extreme Precipitation for Germany. Atmosphere (Basel) 2015, 6, 677–698. [Google Scholar] [CrossRef] [Green Version]
- Brown, M.B.; Forsythe, A.B. Robust Tests for the Equality of Variances. J. Am. Stat. Assoc. 1974, 69, 364–367. [Google Scholar] [CrossRef]
- DWD Climate Data Center (CDC): Hourly Station Observations of Air Temperature at 2 m above Ground in °C, Version V18.3. Available online: https://cdc.dwd.de/portal/ (accessed on 10 April 2019).
- Skamarock, W.C.; Klemp, J.B.; Dudhia, J.; Gill, D.O.; Barker, D.M.; Duda, M.G.; Huang, X.-Y.; Wang, W.; Powers, J.G. A Description of the Advanced Research WRF; Version 3; National Center for Atmospheric Research: Boulder, CO, USA, 2008. [Google Scholar]
- Li, H.; Zhou, Y.; Li, X.; Meng, L.; Wang, X.; Wu, S.; Sodoudi, S. A New Method to Quantify Surface Urban Heat Island Intensity. Sci. Total Environ. 2018, 624, 262–272. [Google Scholar] [CrossRef]
- Zhou, B. On The Assessment Of Surface Urban Heat Island: Size, Urban Form, and Seasonality; Institutional Repository of the University of Potsdam: Potsdam, Germany, 2017. [Google Scholar]
- Li, H.; Meier, F.; Lee, X.; Chakraborty, T.; Liu, J.; Schaap, M.; Sodoudi, S. Interaction between Urban Heat Island and Urban Pollution Island during Summer in Berlin. Sci. Total Environ. 2018, 636, 818–828. [Google Scholar] [CrossRef]
- Wang, L.; Gao, Z.; Miao, S.; Guo, X.; Sun, T.; Liu, M.; Li, D. Contrasting Characteristics of the Surface Energy Balance between the Urban and Rural Areas of Beijing. Adv. Atmos. Sci. 2015, 32, 505–514. [Google Scholar] [CrossRef]
- Illston, B.G.; Basara, J.B.; Crawford, K.C. Seasonal to Interannual Variations of Soil Moisture Measured in Oklahoma. Int. J. Climatol. 2004, 24, 1883–1896. [Google Scholar] [CrossRef]
- Jänicke, B.; Meier, F.; Fenner, D.; Fehrenbach, U.; Holtmann, A.; Scherer, D. Urban–Rural Differences in near-Surface Air Temperature as Resolved by the Central Europe Refined Analysis (CER): Sensitivity to Planetary Boundary Layer Schemes and Urban Canopy Models. Int. J. Climatol. 2017, 37, 2063–2079. [Google Scholar] [CrossRef]
- Christensen, J.H.; Carter, T.R.; Rummukainen, M.; Amanatidis, G. Evaluating the Performance and Utility of Regional Climate Models: The PRUDENCE Project. Clim. Chang. 2007, 81, 1–6. [Google Scholar] [CrossRef]


| Driving Data (GCM) | Regional Model (RCM) | Regional Modeling Group | Humidity Variables (RH and SH) | Temperature Variables (Tas, Tasmax, Tasmin) |
|---|---|---|---|---|
| EC-EARTH | RCA4 | SMHI | x | x |
| EC-EARTH | RACMO22E | KNMI | x | x |
| EC-EARTH | HIRHAM5 | DMI | x | x |
| CM5A-MR | WRF331F | IPSL | x | x |
| CM5A-MR | RCA4 | SMHI | x | x |
| HadGEM2 | RCA4 | SMHI | x | x |
| HadGEM2 | RACMO22E | KNMI | x | x |
| MPI-ESM-LR | REMO2009 | GERICS | x | x |
| MPI-ESM-LR | RCA4 | SMHI | x | x |
| EC-EARTH | CCLM4-8-17 | CLM community SH only | x | |
© 2019 by the authors. Licensee MDPI, Basel, Switzerland. This article is an open access article distributed under the terms and conditions of the Creative Commons Attribution (CC BY) license (http://creativecommons.org/licenses/by/4.0/).
Share and Cite
Langendijk, G.S.; Rechid, D.; Jacob, D. Urban Areas and Urban–Rural Contrasts under Climate Change: What Does the EURO-CORDEX Ensemble Tell Us?—Investigating near Surface Humidity in Berlin and Its Surroundings. Atmosphere 2019, 10, 730. https://doi.org/10.3390/atmos10120730
Langendijk GS, Rechid D, Jacob D. Urban Areas and Urban–Rural Contrasts under Climate Change: What Does the EURO-CORDEX Ensemble Tell Us?—Investigating near Surface Humidity in Berlin and Its Surroundings. Atmosphere. 2019; 10(12):730. https://doi.org/10.3390/atmos10120730
Chicago/Turabian StyleLangendijk, Gaby S., Diana Rechid, and Daniela Jacob. 2019. "Urban Areas and Urban–Rural Contrasts under Climate Change: What Does the EURO-CORDEX Ensemble Tell Us?—Investigating near Surface Humidity in Berlin and Its Surroundings" Atmosphere 10, no. 12: 730. https://doi.org/10.3390/atmos10120730