Effect of Typhoon-Generated Cold Wake on the Subsequent Typhoon Tembin and Its Sensitivity to Horizontal Resolutions


1
Center for Climate Physics, Institute for Basic Science (IBS), Busan 46241, Korea
2
Department of Climate System, Pusan National University, Busan 46241, Korea
3
Department of Atmospheric Science, Pusan National University, Busan 46241, Korea
*
Author to whom correspondence should be addressed.
Atmosphere 2019, 10(11), 644; https://doi.org/10.3390/atmos10110644
Submission received: 27 September 2019
/
Revised: 21 October 2019
/
Accepted: 22 October 2019
/
Published: 24 October 2019
Abstract
:Weather research models have been used to investigate the sensitivity of simulations of Typhoon Tembin (1214) to changes in three horizontal grid spacings and the effect of the cold wake generated by Typhoon Bolaven (1215). We used modified sea surface temperature (SST) to simulate Tembin as it approached after Bolaven had passed through the Ieodo Ocean Research Station and the Yellow Sea buoy in Korea. In the tropical cyclone (TC) tracking experiments, a higher resolution showed the faster and more eastward movement of TCs in all SST conditions. TCs tend to move more eastward at all resolutions particularly when there is a cold wake in their western regions. When there is no cold wake, the intensity of TC is very sensitive to the resolution of the experiment. If a cold wake is maintained on the western and eastern sides, TC intensity is less sensitive to differences in resolution. The precipitation from TCs in the cold wake of the eastern (western) region is lower (higher) than when there is no wake. The TC-generated cold wake significantly affects intensity and movement in cold wake cases in the western region, regardless of horizontal grid, for various reasons.
1. Introduction
Typhoons are significant causes of disasters such as floods and building collapses through their strong winds and heavy rains. Of the approximately 80 global tropical cyclones (TCs) that occurred from 1981–2010, 30% occurred in the Western North Pacific (WNP) basin annually. To improve TC simulation and to understand TC track dynamics, previous studies have conducted sensitivity tests on the horizontal and vertical grids and physical processes [1,2,3,4]. Although many variables affect tropical cyclone development, sea surface temperatures (SSTs) majorly impact their paths and intensities [5,6,7,8]. In particular, the higher the latitude, the stronger the SST gradient becomes; environmental factors also have more of an influence on the typhoon [9]. Previous work attempted to understand the structure of typhoons using satellite data, statistical approaches, and parameters [10,11,12,13,14].
Many typhoons occur from July to October, with about 5.8 typhoons occurring on average in August; thus, the occurrence of simultaneous typhoons leads to the systems directly or indirectly affecting one another. Previous research has been conducted via tank experiments [15,16,17], observations [18,19,20,21,22], and modeling studies [23,24,25,26,27,28], with most focusing on the direct effects of binary interaction between typhoons. The Fujiwhara effect, in particular, is a binary interaction in which direct interaction between typhoons directly affects adjacent typhoons through merging, rotation, and other processes. These direct interaction studies are significant, but indirect interactions have been underrepresented in the literature, despite their importance. For example, typhoon-generated cold wakes have been shown to cool SSTs from ~3 to 8 °C [29,30,31,32]. In Dare and McBride [33], the cooling effect of an initial typhoon was recovered by just 44% approximately five days following the cooling, and by 88% after 30 days. This cold wake effect impacts the direction and intensity of other typhoons [28,34,35,36,37,38]. Jeong et al. [34] also considered how the typhoon-induced cold wake of Typhoon Ewiniar (0603; the third typhoon of 2006) inhibited the development of Typhoon Billis (0604; the fourth typhoon of 2006).
Typhoon Bolaven (1215) resulted in a decrease of about 10 °C along the coast of Jeollanam-do in the Yellow Sea, and the intensity of Typhoon Tembin (1214) was weakened by the rapidly cooled sea surface [35]. However, Kim et al. [35] only noted the weakened intensity of Tembin in response to the cooling from Bolaven without investigating the processes that led to this weakening. Moon et al. [37] and Heo et al. [38] also studied the change in the track of the following and weakening of Tembin via the cold wake using Bolaven and Tembin and focusing on 10 m wind and changes in the waves caused by a typhoon. The previous studies [34,35,36,37,38] investigated the impact of the changed SST on around region of the following TC. However, there is a lack of understanding of the mechanisms by which the track, intensity, and precipitation of a TC is affected by the SST gradient generated by a typhoon that occurred before it. In this study, we investigate the effect of the Typhoon Bolaven-generated cold wake on the track, intensity, and precipitation of Typhoon Tembin using the potential vorticity tendency (PVT) and vertical structure of potential vorticity (PV). The typhoon was simulated from 27 to 30 August, before Typhoon Tembin made landfall on the Korean Peninsula, using the Weather Research and Forecasting (WRF) model (version 3.2).
We prescribed the SST field that modified the location of the SST gradient using the observed SST change and the three horizontal grid spacings of 12 km, 8 km, and 6 km, which were based on high-resolution data and experiments with the WRF. This study is composed of five Sections: Section 2 introduces the characteristics of the model, the initial data, and case selection. In Section 3, we review the experimental design and results of the track intensity and vertical structure of TC in model experiments; in Section 4, we analyze variables associated with the physical processes on the surface and top of the TC and how they affect changes in the typhoon and the temporal change in the precipitation rate. In Section 5, we summarize and discuss the main results.
2. Model Experiment and Case Selection
2.1. Model Experiment
WRF version 3.2 is used to simulate Typhoons Tembin (1214) and Bolaven (1215); the details of these TCs are included in the following section [39]. The model domain consists of 240 × 240 (360 × 360 and 480 × 480) grid points with a uniform horizontal resolution of 12 km (8 km and 6 km) and 27 vertical levels, with the top model level at 50 hPa. All experiments are conducted through 72-h integration with a 60-s (48-s and 36-s) time step. The Kain-Fritsch scheme [40] is used for the cumulus parameterization. The details of the model physics have been documented by Yun et al. (2012) and Choi et al. (2013) [41,42]. National Centers for Environmental Prediction (NCEP) Final (FNL) Operational Global Analysis 6-hourly data with 1.0° × 1.0° resolution, and SST data obtained at the daily interval from the Optimal Interpolation Sea Surface Temperature version 2 (OISST.v2) with 0.25° × 0.25° resolution, are used as initial and boundary conditions [43]. The best-track datasets are from the Joint Typhoon Warning Center (JTWC).
Difficulties in numerical model initialization are a major obstacle in accurate TC forecasting. Therefore, a simple bogussing scheme used in the Mesoscale Model Fifth Generation (MM5) [44] is employed to insert a bogus vortex onto a background field to improve the simulation performance. Briefly, the bogussing procedure consists of identifying an initial TC vortex relative to the best-track data and removing the vortex from the first-guess field. Finally, the bogus Rankine vortex is inserted into the removed region to generate the vortex, which is an improvement over the initial vortex. The bogus vortex has a radius of maximum wind of 45 km with a maximum wind speed of 50 m/s considering the best track data.
2.2. Case Selection: Typhoon Tembin (1214) and Typhoon Bolaven (1215)
One of the major challenges in predicting typhoons is handling changes in the track and intensity due to the interaction between typhoons. This is particularly important since successive impacts on a particular area from subsequent typhoons will increase the damage in the region. For this reason, we selected Bolaven and Tembin for this study; this case is significant in Korea due to the forecasting errors that resulted in damage from both of the typhoons occurring back-to-back. According to the forecast preceding landfall on the Korean peninsula by the Korea Meteorological Administration, the first system was expected to move north along the coast of China on 27 August; Tembin, however, deflected northeastward and made landfall on the Korean peninsula. Bolaven, a relative larger typhoon (radius is 550 km), directly interacted with Tembin, a relative smaller typhoon (radius is 350 km), after the former’s first landfall in Taiwan, which changed the track of Tembin. After the interaction between typhoons, Tembin passed through the track of Bolaven, which deflected eastward and minimized its development thereafter (Figure 1a,b). The 200 hPa and 500 hPa weather maps (Figure 1c–f) show the relationship between Tembin and synoptic phenomena such as jets and troughs on 29 and 30 August 2012. The jet, marked with a thick red arrow, blows along with the geopotential height on 29 August and exits on 30, weakening Tembin at 200 hPa. At 500 hPa, Tembin is weakened by interaction with the trough generated by typhoon Bolaven and the existing mid-latitude trough.
We analyze Tembin when it approaches the Korean Peninsula and Bolaven passes through the Ieodo Ocean Research Station (IORS) and Yellow Sea (YS) buoy observation points. According to the time series of the observed SST, Bolaven approached the IORS and started to decrease its SST observations at 00 UTC on 27 August [45]; the SSTs decreased by about 3 °C, but, after 12 UTC on 27 August, data were missing. At 00 UTC on 29 August, YS buoy SST data indicate an SST reduction of 7 °C and a subsequent recovery of 2 °C (Figure 2a). Using the OISST.v2 data, we defined ∆SST (the Bolaven-generated cold wake) as the difference of SST between SSTs on 27 August over 0.5 °C (Figure 2b), before Bolaven passed through, and on 28 August, after its passage. The forcing of the Bolaven-generated cold wake was controlled using the observed SST evolution at each station. The OISST.v2 data is underestimated three times compared to YS buoy data. Therefore, we force ∆SST three times to change the SST gradient.
2.3. Experimental Design
This study used nine experiments as time series during the approach of Tembin towards the Korean peninsula; the experiments used three different SST conditions and three horizontal grid spacings. We prescribed the effects of the cold wake caused by typhoon and recovered SST after the typhoon passed through specific regions. OISST.v2 data was underestimated compared to the observed SST change and did not show recovery in terms of SST after the typhoon passed through a specific region as the observed SST. In the No_CW experiment, we not consider the typhoon Bolaven-generated cold wake; we use the SST on 27 August. In ET_CW experiment, we prescribed the cold wake effect when typhoon Bolaven passed through the IORS. Subsequently, we considered the change in the observed SST, added three times the underestimated ∆SST to the SST in the ET region, and subtracted ∆SST in the WT region. We prescribed the cold wake after the Bolaven passed through the YS region in the WT_CW experiment. Then we were then forced to add three times the ∆SST in the WT region and subtract ∆SST in the ET region as SST change of YS buoy. We simulated experiments with the smoothed ∆SST for the double-check boundary of the box at WT and ET; the result was consistent with non-smoothed ∆SST experiments. The more detailed experimental design is shown in Table 1.
The difference of area-averaged SST between WT region and ET region (SSTWT − SSTET ) in each experiment is −2.60 °C in No_CW, 0.40 °C in ET_CW, and −5.94 °C for the WT_CW condition in the initial data. Moon et al. [33] investigated how the Bolaven-generated cold wake influenced the change in the track of Tembin using the same experimental design and found the main factors from the synoptic pattern around the typhoon and asymmetric flow with only a 12 km grid spacing experiment; however, it did not reveal the characteristics of 3-D structure of PV and precipitation with change of grid spacing.
For the simulation reliability of the model, the model test the result and comparative verification were conducted using 10 min data of IORS. The time was compared between Sea Level Pressure (SLP and 10 m wind intensity for 72 h from 00 UTC 27 August, to 00 UTC 30 August (Figure 3). Figure 3a shows the time evolution in IORS, and when looking at the time evolution, Bolaven passed the IORS after 12 UTC 27 August. At this time, the sea level air pressure was about 945 hPa, and the 10 m wind was a strong wind of 35 m/s. Tembin passed on 21 UTC 29 August, when the sea level was about 980 hPa, and the 10 m wind was 30 m/s. Figure 3b,c show SLP and 10 m wind of the location even in each experiment. Compared with the observations, SLP was about 955 hPa and the 10 m wind was about 30 m/s in 12 km and 6 km experiments, and they are underestimated than Bolaven at the time of passing through the Bolaven. The TC approached IORS later than the observation in the 12 km experiment and confirmed that the observations approached a similar time in the 6 km experiment. However, SLP and 10 m wind is underestimated than the observation data.
3. Effect of the Location of the Cold Wake Generated by Bolaven on the Simulated Tembin
To understand the effects of the Bolaven-generated cold wake on Tembin, we simulated the events from 00 UTC 27 August to 00 UTC 30 August. Figure 4a–c show the SST distribution of each experiment, denoted No_CW, ET_CW, and WT_CW in Table 1. The No_CW indicates that SSTs are maintained as SSTs before the passage of Typhoon Bolaven so as to ignore the effect of the cold wake, the ET_CW experiment defines the eastern cold wake from the IORS observation as 28 August minus 27 August, and the WT_CW experiment is the opposite of the ET_CW. The track of the TC is a different response, depending on the SST condition and horizontal grid spacing (Figure 4d), as the SST gradient affects the direction of TC motion in all horizontal grid spacing. In comparison with No_CW and ET_CW, which are similar, the TC in the ET_CW moves faster and more westward than that in No_CW. The movement of the TC of the WT_CW is slower than that of No_CW and is deflected more eastward. The higher resolution experiment results in the faster and more eastward movement.
Based on the results of previous studies that indicated that the typhoon-generated cold wake affects the intensity of the subsequent typhoon [34,35], we examined the change in intensity in the TC between experiments with mean sea level pressure. In terms of TC intensity, the results show that TCs in the SST condition No_CW show largely different responses at the 6 km resolutions. In the SST of ET_CW, the TC at the 6 km resolution weakens earlier compared to the other two resolutions (Figure 4e). In the SST of WT_CW, TC tends to maintain the intensity for all resolutions.
To analyze the TC track, asymmetric flow analysis using the potential vorticity tendency equation and the asymmetric component with the symmetric component removed from the wind field was performed. The definition of PV used in the study is the definition of PV in the sigma coordinate system, as follows:
where PV, g, Psfc, ξ, and f are potential vorticity, gravitational acceleration, surface pressure, relative vorticity, and the Coriolis parameter, respectively.
To divides PVT of TC into symmetric and asymmetric components, we use Fourier transform as follows:
and are Fourier coefficients, is a wavenumber, and is a symmetric component.
Wavenumber 0 of PV is the symmetric component and represents the circulation based on the center of TC. Wavenumber 1 and more wavenumbers of PV are asymmetric components, especially the wavenumber 1 component is known as beta gyre. the components of wavenumber 2 and above number show the circulation of opposite phases in the advancing direction, and the magnitude thereof is smaller than that of the wavenumber 1 component. Therefore, we examine the Wavenumber 1 component associated with the track of TC.
The PVT equation used in this study is defined as follows [46,47]:
where a left side is wavenumber 1 component of PVT, is the operator of wavenumber 1, is the horizontal advection (HA) included in beta effect and asymmetric flow, is the vertical advection (VA) included vertical wind shear effect, and is diabatic heating (DH) included in vertical shear and precipitation. PVT is particularly sensitive to level; we vertical averaged from 0.9 to 0.55 sigma level because straight-moving TCs are affected by the low-mid layer in previous work [42,48].
In the asymmetrical flow, the symmetrical components that can be represented by typhoons in the same region are removed from the wind field of a 720 km radius from the center of the typhoon. Since Tembin is a small typhoon, the range used for the actual analysis is based on the asymmetry of a 250 km radius from its center. The asymmetric flows include the asymmetrical components of the direct currents and typhoons that are affected at the center of the TC.
The magnitude of each term in the PVT in the 6 km resolution experiment is stronger than in the 12 km resolution experiment (Figure 5). HA does not show the difference in the direction according to SST at 12 km, while it is headed north in No_CW and ET_CW at 6 km and northeast at WT_CW. VA is similarly oriented in ET_CW, in the direction opposite No_CW and WT_CW, compared to 12 km and 6 km. However, the VA term is too small compared to the other terms in the two resolutions. DH does not show much difference in the direction depending on the resolution, but the strength of No_CW and WT_CW is greatly developed and offset with HA. However, although there is an offset between HA and DH, the former is the dominant role of the movement of TC because of its magnitude.
Based on the PVT analysis, we analyzed the asymmetric flow associated with the HA term. In all SST conditions, the higher resolution experiments showed a faster asymmetric flow than the coarse resolution experiment. These results support the difference in the magnitude of the horizontal advection term of the wavenumber-1 component of PVT. In the region northeast from the center of typhoon (Quadrant 1), in particular, there are many differences in resolution (Figure 6). However, the asymmetric flow in the center of the TC is strong in the 12 km resolution experiment; it seems to overestimate asymmetric flow in the center of TC. According to the SST conditions, the direction of asymmetric flow is more inclined at WT_CW and moves eastward compared to No_CW and ET_CW, which is consistent with an earlier study [37]. In this study, SST gradient changes the direction of the TC and the horizontal grid spacing changes the translating speed of the TC.
In order to confirm whether the difference in intensity is caused by the vertical structure change within the typhoon, the difference in intensity between 48 and 60 h (from 00 UTC 29 August to 12 UTC 29 August) and the averaged zonal cross-sections of PV in each experiment are examined to see how they differed from No_CW.
When looking at the zonal cross-section of the vertical potential, there is little difference in resolution. However, there is a difference between the potential and the SST condition. At No_CW and ET_CW, the maximum potential intensity and asymmetry appear above the 0.5 sigma level. In WT_CW, the maximum value of PV is under 7 PVU and asymmetry shows above 0.5 sigma level, while PV intensity is weakened overall and maximum value shifts to the lower layer (Figure 7). TC in WT_CW does not develop vertically compared to the other two SSTs, and it is inferred that it will be affected by synoptic phenomena. Comparing 48–60 h and 36–48 h, closer distance to the SST gradient, TC is weaker in WT_CW and stronger TC in No_CW and ET_CW. Through the difference in the vertical structure of PV, it is confirmed that the change in intensity according to the SST condition is more sensitive than the difference in intensity of PV according to the resolution.
In addition to the vertical structural change, the analysis is performed using moisture static energy (MSE) to examine the effect on the intensity of TC. SST conditions and horizontal resolution are affected when looking at the MSE averaged vertically from sigma level 0.99 to 0.85. First, when comparing SST condition, ET_CW has the weak MSE at the center of the TC and WT_CW has the strong MSE at the center and northeast of the TC (Figure 8) even if the resolution is changed. As the resolution in each experiment, MSE at the center of TC does not change; however, it does decreases at the periphery of TC, which results in the asymmetric MSE. Then enhance the asymmetry of MSE are strong in TC as finer horizontal grid spacing.
When vertically averaged from 0.85 to 0.55 sigma level, the difference in resolution is attenuated in the periphery of TC, similar to the results at the lower level. In WT_CW, MSE develops more widely than the other two SSTs. In all experiments, MSE plays a role in the development of TC at the center of TC.
Although the MSE of ET_CW is relatively small and the MSE of WT_CW is relatively large, the intensity of TC is, conversely, strong in ET_CW and weak in WT_CW. The cause of this is investigated through shear between 200 hPa and 850 hPa. No_CW and ET_CW have the wind shear under 10 m/s at the center of TC, and the strength of the surrounding wind shear is less than 25 m/s. However, WT_CW has a stronger wind shear than that in two SSTs in the center and south-east of the TC (Figure 9). There is little difference in wind shear according to the horizontal resolution experiment. The weak MSE acts as a source in ET_CW, but the energy loss in the TC is low due to the low wind shear; but in WT_CW, although the relatively strong MSE acts as a source in the TC, the energy loss increases due to the strong wind shear.
4. The Physical Response in the Surface and the Top of TC as SST and Horizontal Grid Spacing
We examined the changes in the physical processes at the top of the surface of TC in response to SST forcing and horizontal grid spacing. We examine latent heat at the surface of 250 km from the center of TC. In each SST, the latent heat flux is released more strongly as the horizontal grid spacing becomes finer (Figure 10). In contrast, each SST shows a different spatial pattern of latent heat flux. Latent heat flux is sensitive to the horizontal grid spacing in No_CW. The maximum of latent heat flux shows the south-east region of TC in the No_CW_12 km experiment. In the 8 km experiment, the latent heat flux are separated western side and eastern side of TC under 400 Wm−2. However, the latent heat flux in the 6 km experiment develops in the western side of TC meridionally over 500 Wm−2.
In ET_CW, circular latent heat release in the 12 km experiment is less than 400 Wm−2 and expands along the meridional in the 8 km and 6 km experiments. In WT_CW, the maximum value is over 500 Wm−2 regardless of the resolution, and a lot of latent heat is released from the south to the east of the TC. At 8 km and 6 km, more latent heat flux than in the 12 km resolution is also enhanced west of the TC over 300 Wm−2. The latent heat dissipation from the surface area of TC is strong in the 6 km resolution experiment, the maximum value of latent heat flux at No_CW and ET_CW is shown to the west of TC, and the direction of TC movement is also shown. In WT_CW there is a great release in latent heat flux southeast of the TC.
The cloud top temperature (CTT) was investigated to confirm the change in the intensity and structure on the top of the TC (Figure 11). Looking at the SST conditions, CTTs in the No_CW and ET_CW show meridional, not zonal, expansion of the cloud structure. In WT_CW, the cloud structure shifts to the west compared to the other two SST conditions; thus, it is inferred that the typhoon is tilted. Compared to WT_CW, which has a lower PV vertical structure than it under other SST conditions, CTT is similar to the other two SST conditions; thus, we infer that the cloud is developed to a similar altitude. In terms of the sensitivity to resolution, the cloud in the finer resolution experiment is more developed in the periphery than that in the coarse resolution experiment.
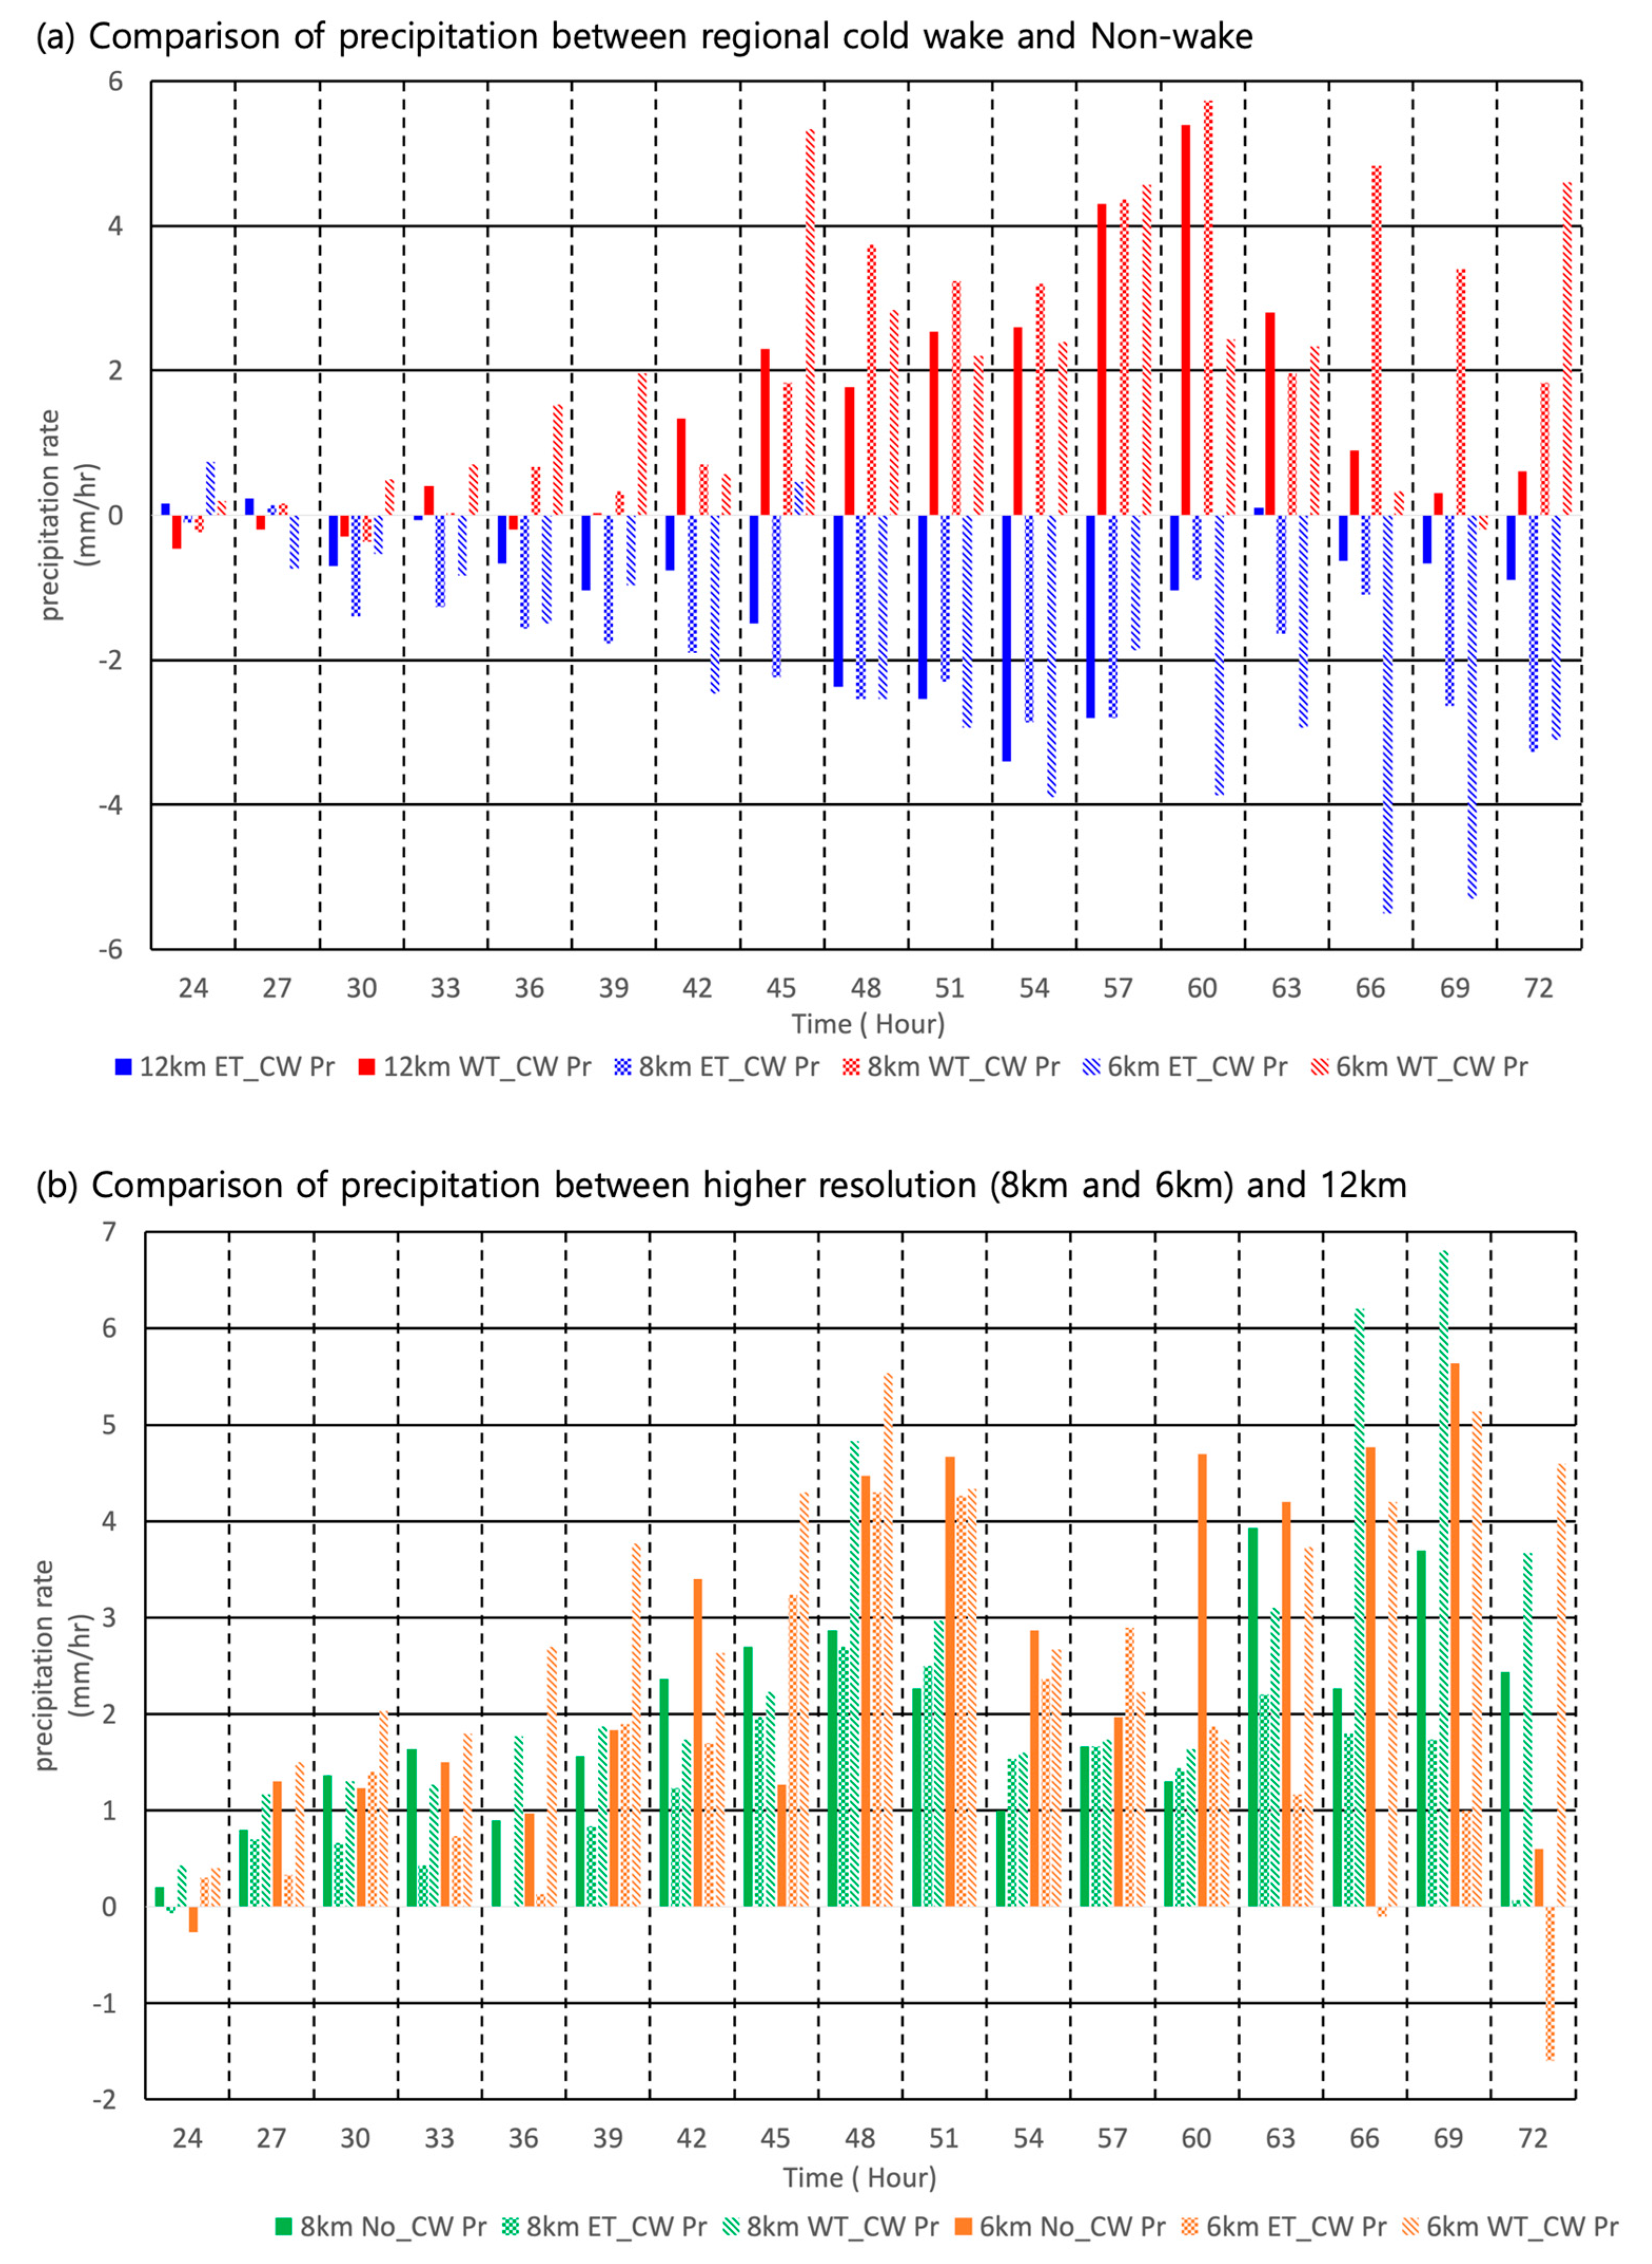
To examine the change of precipitation rate calculated through the following physical processes, the time variations of the area-averaged precipitation rate from the center of TC to 500 km are analyzed. First, when the effects of the SST condition on the same resolution are examined, the precipitation rate in ET_CW is weaker than that of No_CW (Figure 12a). The decrease in precipitation rate according to the SST condition is particularly great after 60 h in the 6 km experiment. However, the precipitation rate in WT_CW is stronger than No_CW. The 12 km experiment shows that the difference in precipitation rate increases to 60 h integration. In the 6 km experiment the maximum positive precipitation rate anomaly appears before 48 h, and the 72 h precipitation rate is more than that in No_CW. This difference in precipitation rate indicates a difference of less than 2 mm/h before TC until 36 h, but the difference then increases to as much as 6 mm/h.
We compared the response of precipitation rate according to the resolution under the same SST condition (Figure 12b). In the 8 km experiment, the strongest precipitation rate difference is shown in WT_CW and the weakest precipitation rate in the ET_CW is in the 12 km experiment. This difference is particularly large after 66 h than before 66 h. In the 6 km experiment, the precipitation rate of No_CW and WT_CW is usually enhanced. In the No_CW and WT_CW experiment, the difference in the precipitation rate increased until 51 h and increased again after 60 h. In ET_CW, the difference in precipitation rate increased up to 51 h, like in No_CW, but it then decreases and becomes negative at 72 h. The difference in precipitation rate is similar to the difference in SST condition, but TC is less than 2 mm/h until 36 h. The difference increases after the maximum 7 mm/h.
5. Summary and Discussion
In this study, we examine the effects of the location of the Typhoon Bolaven-generated cold wake on Typhoon Tembin and examine the sensitivity of three (6, 8, and 12 km) horizontal grid spacings of the numerical model through PVT, asymmetric flow, and the vertical structure of PV using WRF. The SST gradient affects the direction and intensity of the TC and the horizontal grid spacing affects the translation speed of the TC.
First, the track of TC, when examined through the wavenumber 1 component of PVT, shows a strong asymmetry at 6 km compared to 12 km, according to the direction of TC. As seen through the asymmetric flow, all horizontal grid spacings show movements northeastward in WT_CW (western cooling) and northward in No_CW and ET_CW. In all SST conditions, the asymmetric flow is mainly characterized by the model resolution. The asymmetric flow in finer resolution experiments has a stronger magnitude than that in coarse resolution experiments.
Second, the intensity of TC is examined by the vertical structure of PV, MSE, and wind shear. The intensity of TC has little difference in resolution and is greatly influenced by the SST gradient. In No_CW and ET_CW, the zonal cross-section of PV develops to about 0.2 sigma level and the maximum intensity appears at 0.5 sigma level. The asymmetry is the smallest for ET_CW. However, WT_CW has a weak maximum strength, with a maximum value that shifted down to 0.8 sigma level, and the asymmetry is strong in the upper layer. MSE is strong in WT_CW and weak in ET_CW at all resolutions, but TC becomes weaker in WT_CW, due to strong wind shear, and stronger in ET_CW.
To consider the physical process of the reaction of TC, the surface latent heat flux and CTT on the top of TC were investigated. Latent heat flux is greatly affected by SST and the horizontal grid. The spatial distribution of latent heat and CTT are mainly determined with SST. No_CW and ET_CW maintain symmetry in the zonal direction, whereas in WT_CW, there is cloud development on the west side of the TC, increasing asymmetry. In all experiments, the altitudes of the CTTs are similar. Comparisons of the temporal evolution of precipitation rate show that WT_CW is strong while ET_CW is weak. The precipitation rate in the 8 and 6 km experiments increased compared to the 12 km experiments.
The present study intends to focus on the effect of the SST gradient changed by typhoon-generated cold wake and its sensitivity to the horizontal grid spacing. However, the limitations of this work are that there is only one case study, SST is fixed, and that there is no finer resolution than 6 km can be the limitation of this study. Therefore, further case studies on the impact of adjacent typhoon-generated cold wake on TCs and model experiments with cloud-resolving scale resolutions and coupled simulations are needed. To study the typhoons that have recently affected the Korean Peninsula, more practical case studies can be conducted based on the data from the IORS and the Ocean Research Stations that have been built since 2012 [45]. Studies of the dynamic factor and thermodynamics are particularly required in the context of a moistened environment given the global climate.
Author Contributions
Conceptualization, K.-J.H.; Formal analysis, M.M.; Investigation, M.M.; Methodology, M.M.; Visualization, M.M.; Writing—original draft, M.M. and K.-J.H.; Writing—review & editing, M.M. and K.-J.H.
Funding
This study was supported by the Institute for Basic Science (IBS), Republic of Korea, under IBS-R028-D1 and the Korea Ministry of Environment (MOE) as “Graduate School specialized in Climate Change” (M.M., and K.-J.H.).
Acknowledgments
WRF model can be found at http://www2.mmm.ucar.edu/wrf/users/downloads.html. FNL data can be found at https://rda.ucar.edu/datasets/ds083.2/. Observation (IORS and YS buoy) data can be found at http://kors.kiost.ac.kr/en/data/sub1.php(More details of the research facilities, maintenance, observations and scientific achievements of KORS. OISST.v2 daily data can be found at https://www.esrl.noaa.gov/psd/cgi-bin/db_search/DBListFiles.pl?did=132&tid=75. Best track data can be found at https://www.metoc.navy.mil/jtwc/jtwc.html?western-pacific.
Conflicts of Interest
The authors declare no conflicts of interest.
References
- Gentry, S.M.; Gray, M.L. Sensitivity of simulated tropical cyclone structure and intensity to horizontal resolution. Mon. Wea. Rev. 2009, 138, 688–704. [Google Scholar] [CrossRef]
- Davis, C.; Wei, W.; Jimy, D. Does increased horizontal resolution improve hurricane wind forecasts? Wea. Forecast. 2010, 25, 1826–1841. [Google Scholar] [CrossRef]
- Ma, Z.; Jianfang, F.; Xiaogang, H.; Xiaoping, C. Sensitivity of tropical cyclone intensity and structure to vertical resolution in WRF. Asia Pacific J. Atmos. Sci. 2012, 48, 67–81. [Google Scholar] [CrossRef]
- Wu, Z.; Changbo, J.; Bin, D.; Jie, C.; Xiaojian, L. Sensitivity of WRF simulated typhoon track and intensity over the South China Sea to horizontal and vertical resolutions. Acta Oceanol. Sin. 2019, 38, 74–83. [Google Scholar] [CrossRef]
- Chang, S.W.; Madala, R.V. Numerical simulation of the influence of sea surface temperature on translating tropical cyclones. J. Atmos. Sci. 1980, 37, 2617–2630. [Google Scholar] [CrossRef]
- Wang, B.; Elsberry, R.L.; Wang, Y.; Wu, L. Dynamics in Tropical Cyclone Motion: A Review. Chin. J. Atmos. Sci. 1998, 22, 416–434. [Google Scholar]
- Schade, L.R. Tropical cyclone intensity and sea surface temperature. J. Atmos. Sci. 2000, 57, 3122–3130. [Google Scholar] [CrossRef]
- Chan, J.C.L. The physics of tropical cyclone motion. Annu. Rev. Fluid Mech. 2005, 37, 99–128. [Google Scholar] [CrossRef]
- Jones, S.C.; Harr, P.A.; Abraham, J.; Bosart, L.F.; Bowyer, P.J.; Evans, J.L.; Hanley, D.E.; Hanstrum, B.N.; Hart, R.E.; Lalaurette, F.; et al. The extratropical transition of tropical cyclones: Forecast challenges, current understanding, and future directions. Wea. Forecast. 2003, 18, 1052–1092. [Google Scholar] [CrossRef]
- Mueller, K.J.; DeMaria, M.; Knaff, J.A.; Kossin, J.P.; Haar, T.H.V. Objective estimation of tropical cyclone wind structure from infrared satellite data. Wea. Forecast. 2006, 21, 990–1005. [Google Scholar] [CrossRef]
- Ueno, M. Observational Analysis and Numerical Evaluation of the Effects of Vertical Wind Shear on the Rainfall Asymmetry in the Typhoon Inner-Core Region. J. Meteor. Soc. Japan 2007, 85, 115–136. [Google Scholar] [CrossRef] [Green Version]
- Knaff, J.A.; Sampson, C.C.R.; DeMaria, M.; Marchok, T.P.; Gross, J.M.; McAdie, C.J. Statistical tropical cyclone wind radii prediction using climatology and persistence. Wea. Forecast. 2007, 22, 781–791. [Google Scholar] [CrossRef]
- Knaff, J.A.; Sampson, C.R.; Fitzpatrick, P.J.; Jin, Y.; Hill, C.M. Simple diagnosis of tropical cyclone structure via pressure gradients. Wea. Forecast. 2011, 26, 1020–1031. [Google Scholar] [CrossRef]
- Kanada, S.; Wada, A. Sensitivity to horizontal resolution of the simulated intensifying rate and inner-core structure of typhoon Ida, an extremely intense typhoon. J. Meteor. Soc. Japan 2016, 94A, 181–190. [Google Scholar] [CrossRef]
- Fujiwara, S. The natural tendency towards symmetry of motion and its application as a principle in meteorology. Quart. J. Roy. Meteor. Soc. 1921, 47, 287–293. [Google Scholar] [CrossRef]
- Fujiwara, S. On the growth and decay of vorticity systems. Quart. J. Roy. Meteor. Soc. 1923, 49, 75–104. [Google Scholar] [CrossRef]
- Fujiwara, S. Short note on the behavior of two vortices. Proc. Phys. Math. Soc. Japan. Ser. 1931, 3, 13. [Google Scholar]
- Brand, S. Interaction of binary tropical cyclones of the western north pacific ocean. J. Appl. Meteor 1970, 9, 433–441. [Google Scholar] [CrossRef]
- Carr, L.E., III; Boothe, M.A.; Elsberry, R.L. Observational evidence for alternate modes of track-altering binary tropical cyclone scenarios. Mon. Wea. Rev. 1997, 125, 2094–2211. [Google Scholar] [CrossRef]
- Carr, L.E., III; Elsberry, R.L. Objective diagnosis of binary tropical cyclone interactions for the western North Pacific Basin. Mon. Wea. Rev. 1998, 126, 1734–1740. [Google Scholar] [CrossRef]
- Wu, C.-C.; Huang, T.-S.; Huang, W.-P.; Chou, K.-H. A new look at the binary interaction: Potential vorticity diagnosis of the unusual southward movement of Typhoon Bopha (2000) and its interaction with Typhoon Saomai (2000). Mon. Wea. Rev. 2003, 131, 1289–1300. [Google Scholar] [CrossRef]
- Mauk, R.G.; Hobgood, J.S. Tropical cyclone formation in environments with cool SST and high wind shear over the northeastern Atlantic Ocean. Wea. Forecast. 2012, 27, 1433–1448. [Google Scholar] [CrossRef]
- DeMaria, M.; Chan, C.L. Comments on “A numerical study of the interactions between two tropical cyclones”. Mon. Wea. Rev. 1984, 112, 1643–1645. [Google Scholar] [CrossRef]
- Holland, G.J.; Dietachmayer, G.S. On the interaction of tropical-cyclone-scale vortices. III: Continuous barotropic vortices. Quart. J. Roy. Meteor. Soc. 1993, 119, 1381–1398. [Google Scholar] [CrossRef]
- Wang, Y.; Holland, G.J. On the interaction of tropical cyclone-scale vortices. IV: Baroclinic vortices. Quart. J. Roy. Meteor. Soc. 1995, 121, 95–126. [Google Scholar] [CrossRef]
- Yang, C.-C.; Wu, C.-C.; Chou, K.-H.; Lee, C.-Y. Binary interaction between Typhoons Fengshen (2002) and Fungwong (2002) based on the potential vorticity diagnosis. Mon. Wea. Rev. 2008, 136, 4593–4611. [Google Scholar] [CrossRef]
- Wu, C.-C.; Chen, S.-G.; Chen, J.-H.; Chou, K.-H.; Lin, P.-H. Interaction of Typhoon Shanshan (2006) with the midlatitude trough from both adjoint-derived sensitivity steering vector and potential vorticity perspectives. Mon. Wea. Rev. 2009, 137, 852–862. [Google Scholar] [CrossRef]
- Balaguru, K.; Taraphdar, S.; Leung, L.R.; Foltz, G.R.; Knaff, J.A. Cyclone-cyclone interactions through the ocean pathway. Geophys. Res. Lett. 2014, 41, 6855–6862. [Google Scholar] [CrossRef]
- Price, J.F. Upper ocean response to a hurricane. J. Phys. Oceanogr. 1981, 11, 153–175. [Google Scholar] [CrossRef]
- Cione, J.J.; Uhlhorn, E.W. Sea surface temperature variability in hurricanes: Implications with respect to intensity change. Ameri. Meteor. Soci. 2003, 131, 1783–1796. [Google Scholar] [CrossRef]
- Lin, I.; Liu, W.T.; Wu, C.C.; Wong, G.T.; Hu, C.; Chen, Z.; Liang, W.D.; Yang, Y.; Liu, K.K. New evidence for enhanced primary production triggered by tropical cyclone. Geophys. Res. Lett. 2003, 30, 1718. [Google Scholar] [CrossRef]
- Price, J.F.; Morzel, J.; Niiler, P.P. Warming of SST in the cool wake of a moving hurricane. J. Geophys. Res. 2008, 113. [Google Scholar] [CrossRef]
- Dare, R.A.; McBride, J.L. Sea surface temperature response to tropical cyclones. Mon. Wea. Rev. 2011, 139, 3798–3808. [Google Scholar] [CrossRef]
- Jeong, Y.; Moon, I.; Kim, S. A Study on Upper Ocean Response to Typhoon Ewiniar (0603) and Its Impact. Atmosphere 2013, 23, 205–220. [Google Scholar] [CrossRef] [Green Version]
- Kim, C.; Lim, S.; Jeong, J.; Shim, J.; Moon, I.; Oh, Y.; You, H. Response of coastal waters in the Yellow sea to typhoon Bolaven. J. Coastal. Res. 2014, 70, 278–283. [Google Scholar] [CrossRef]
- Lee, J.; Cheong, H.; Kang, H.; Kwon, I. Tropical cyclone track and intensity forecast using asymmetric 3-dimensional bogus vortex. Atmosphere 2014, 24, 207–223. [Google Scholar] [CrossRef]
- Moon, M.; Choi, Y.; Ha, K.-J. Effect of sea surface temperature gradient induced by the previous typhoon’s cold wake on the track of the following typhoon: Bolaven (1215) and Tembin (1214). Atmosphere 2016, 26, 635–647. [Google Scholar] [CrossRef]
- Heo, K.-Y.; Ha, T.; Park, K.-S. The effects of a typhoon induced oceanic cold wake on typhoon intensity and typhoon-induced ocean waves. J. Hydro-Environ. Res. 2017, 14, 61–75. [Google Scholar] [CrossRef]
- Skamarock, W.C.; Klemp, J.B.; Dudhia, J.; Gill, D.O.; Barker, D.M.; Wang, W.; Powers, J.G. A Description of the Advanced Research WRF Version 3; Tech. Rep. TN-475+STR; NCAR: Boulder, CO, USA, 2008; 113p. [Google Scholar] [CrossRef]
- Kain, J.S.; Fritsch, J.M. Convective parameterization for mesoscale models: The Kain-Fritcsh scheme. In The Representation of Cumulus Convection in Numerical Models; American Meteorological Society: Boston, MA, USA, 1993; pp. 165–170. [Google Scholar]
- Yun, K.-S.; Chan, J.C.L.; Ha, K.-J. Effects of SST magnitude and gradient on typhoon tracks around East Asia: A case study for Typhoon Maemi (2003). Atmos. Res. 2012, 109–110, 36–51. [Google Scholar] [CrossRef]
- Choi, Y.; Yun, K.-S.; Ha, K.-J.; Kim, K.-Y.; Yoon, S.-J.; Chan, J.C.L. Effects of asymmetric SST distribution on straight-moving Typhoon Ewiniar (2006) and recurving Typhoon Maemi (2003). Mon. Wea. Rev. 2013, 141, 3950–3967. [Google Scholar] [CrossRef]
- Banzon, V.F.; Reynolds, R.W.; Stokes, D.; Xue, Y. A 1/48-spatial-resolution daily sea surface temperature climatology based on a blended satellite and in situ analysis. J. Climate 2014, 27, 8221–8228. [Google Scholar] [CrossRef]
- Davis, C.A.; Low-Nam, S. The NCAR-AFWA Tropical Cyclone Bogussing Scheme; U.S. Air Force Weather Agency (AFWA) Report; National Center for Atmospheric Research: Bellevue, CO, USA, 2001; 21p. [Google Scholar]
- Ha, K.-J.; Nam, S.H.; Jeong, J.-Y.; Moon, I.-J.; Lee, M.; Yun, J.; Jang, C.; Kim, Y.; Byun, D.-S.; Heo, K.-Y.; et al. Observations utilizing Korean Ocean Research Stations and their Applications for Process Studies. Bull. Amer. Meteor. Soc. 2019. [Google Scholar] [CrossRef]
- Hoskins, B.J.; McIntyre, M.E.; Robertson, A.W. On the use and significance of isentropic potential vorticity maps. Quart. J. Roy. Meteor. Soc. 1985, 111, 877–946. [Google Scholar] [CrossRef]
- Wu, L.; Wang, B. A potential vorticity tendency diagnostic approach for tropical cyclone motion. Mon. Wea. Rev. 2000, 128, 1899–1911. [Google Scholar] [CrossRef]
- Wong, M.L.M.; Chan, J.C.L. Tropical cyclone intensity in vertical wind shear. J. Atmos. Sci. 2004, 61, 1859–1876. [Google Scholar] [CrossRef]
Figure 1.
(a) Best track of Typhoon Tembin (red solid line) and Typhoon Bolaven (black solid line), green triangle (orange triangle) represent YS buoy (IORS), and (b) the mean sea level pressure (unit:hPa) changes in Typhoon Tembin (red solid line) and Typhoon Bolaven (black solid line) obtained from JTWC. A three-day integration is conducted from 00 UTC 27 August 2012 to 00 UTC 30 August 2012. The weather charts during approach Tembin to Korea at (c,d) 200 hPa and (e,f) 500 hPa from 00UTC 29 August 2012 to 00UTC 30 August 2012.
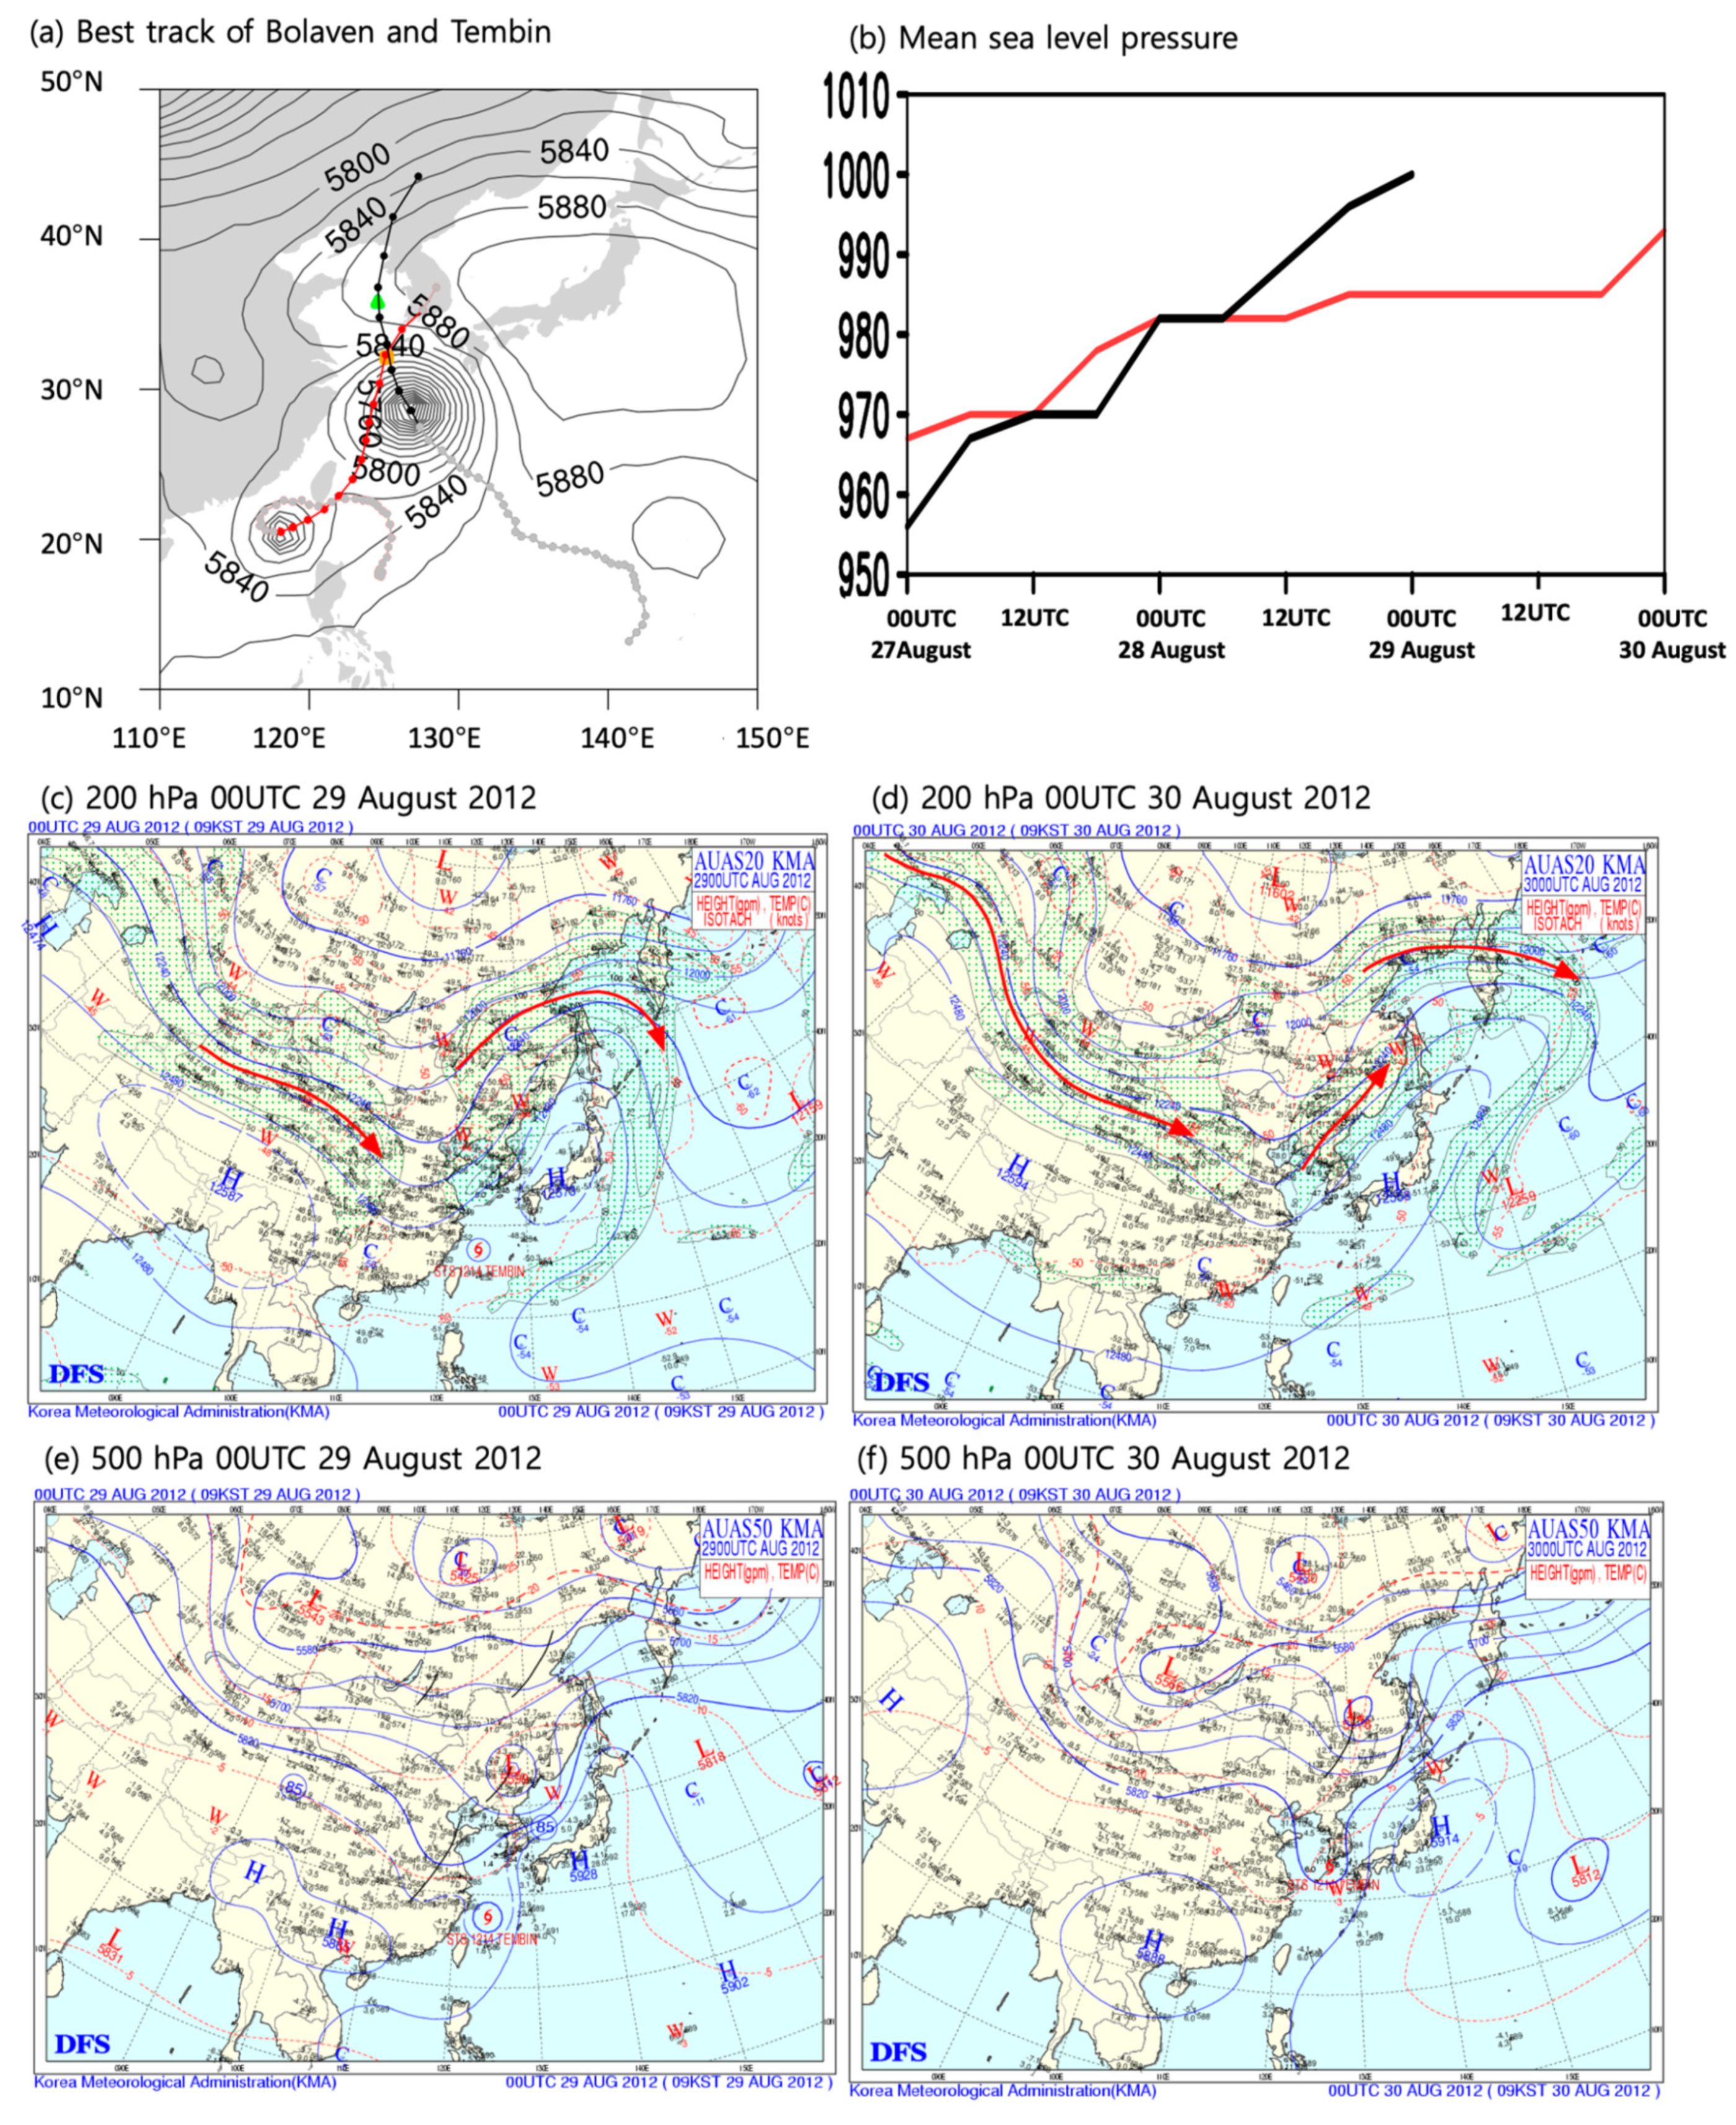
Figure 2.
(a) Time evolution of the Sea Surface Temperature (SST, unit: °C) of observed station and OISST.v2, and green solid(dashed) line indicates the SST located at YS buoy (OISST.v2 at YS buoy point), and orange solid(dashed) line indicates the SST located at the IORS((OISST.v2 at the IORS point). The orange(green) vertical line means when Typhoon Bolaven passes through the IORS (YS buoy). (b) Spatial distribution of the difference in SST between 27 August and 28 August. The left box is the defined western region of Tembin (WT); the right box is the defined eastern region of Tembin (ET).
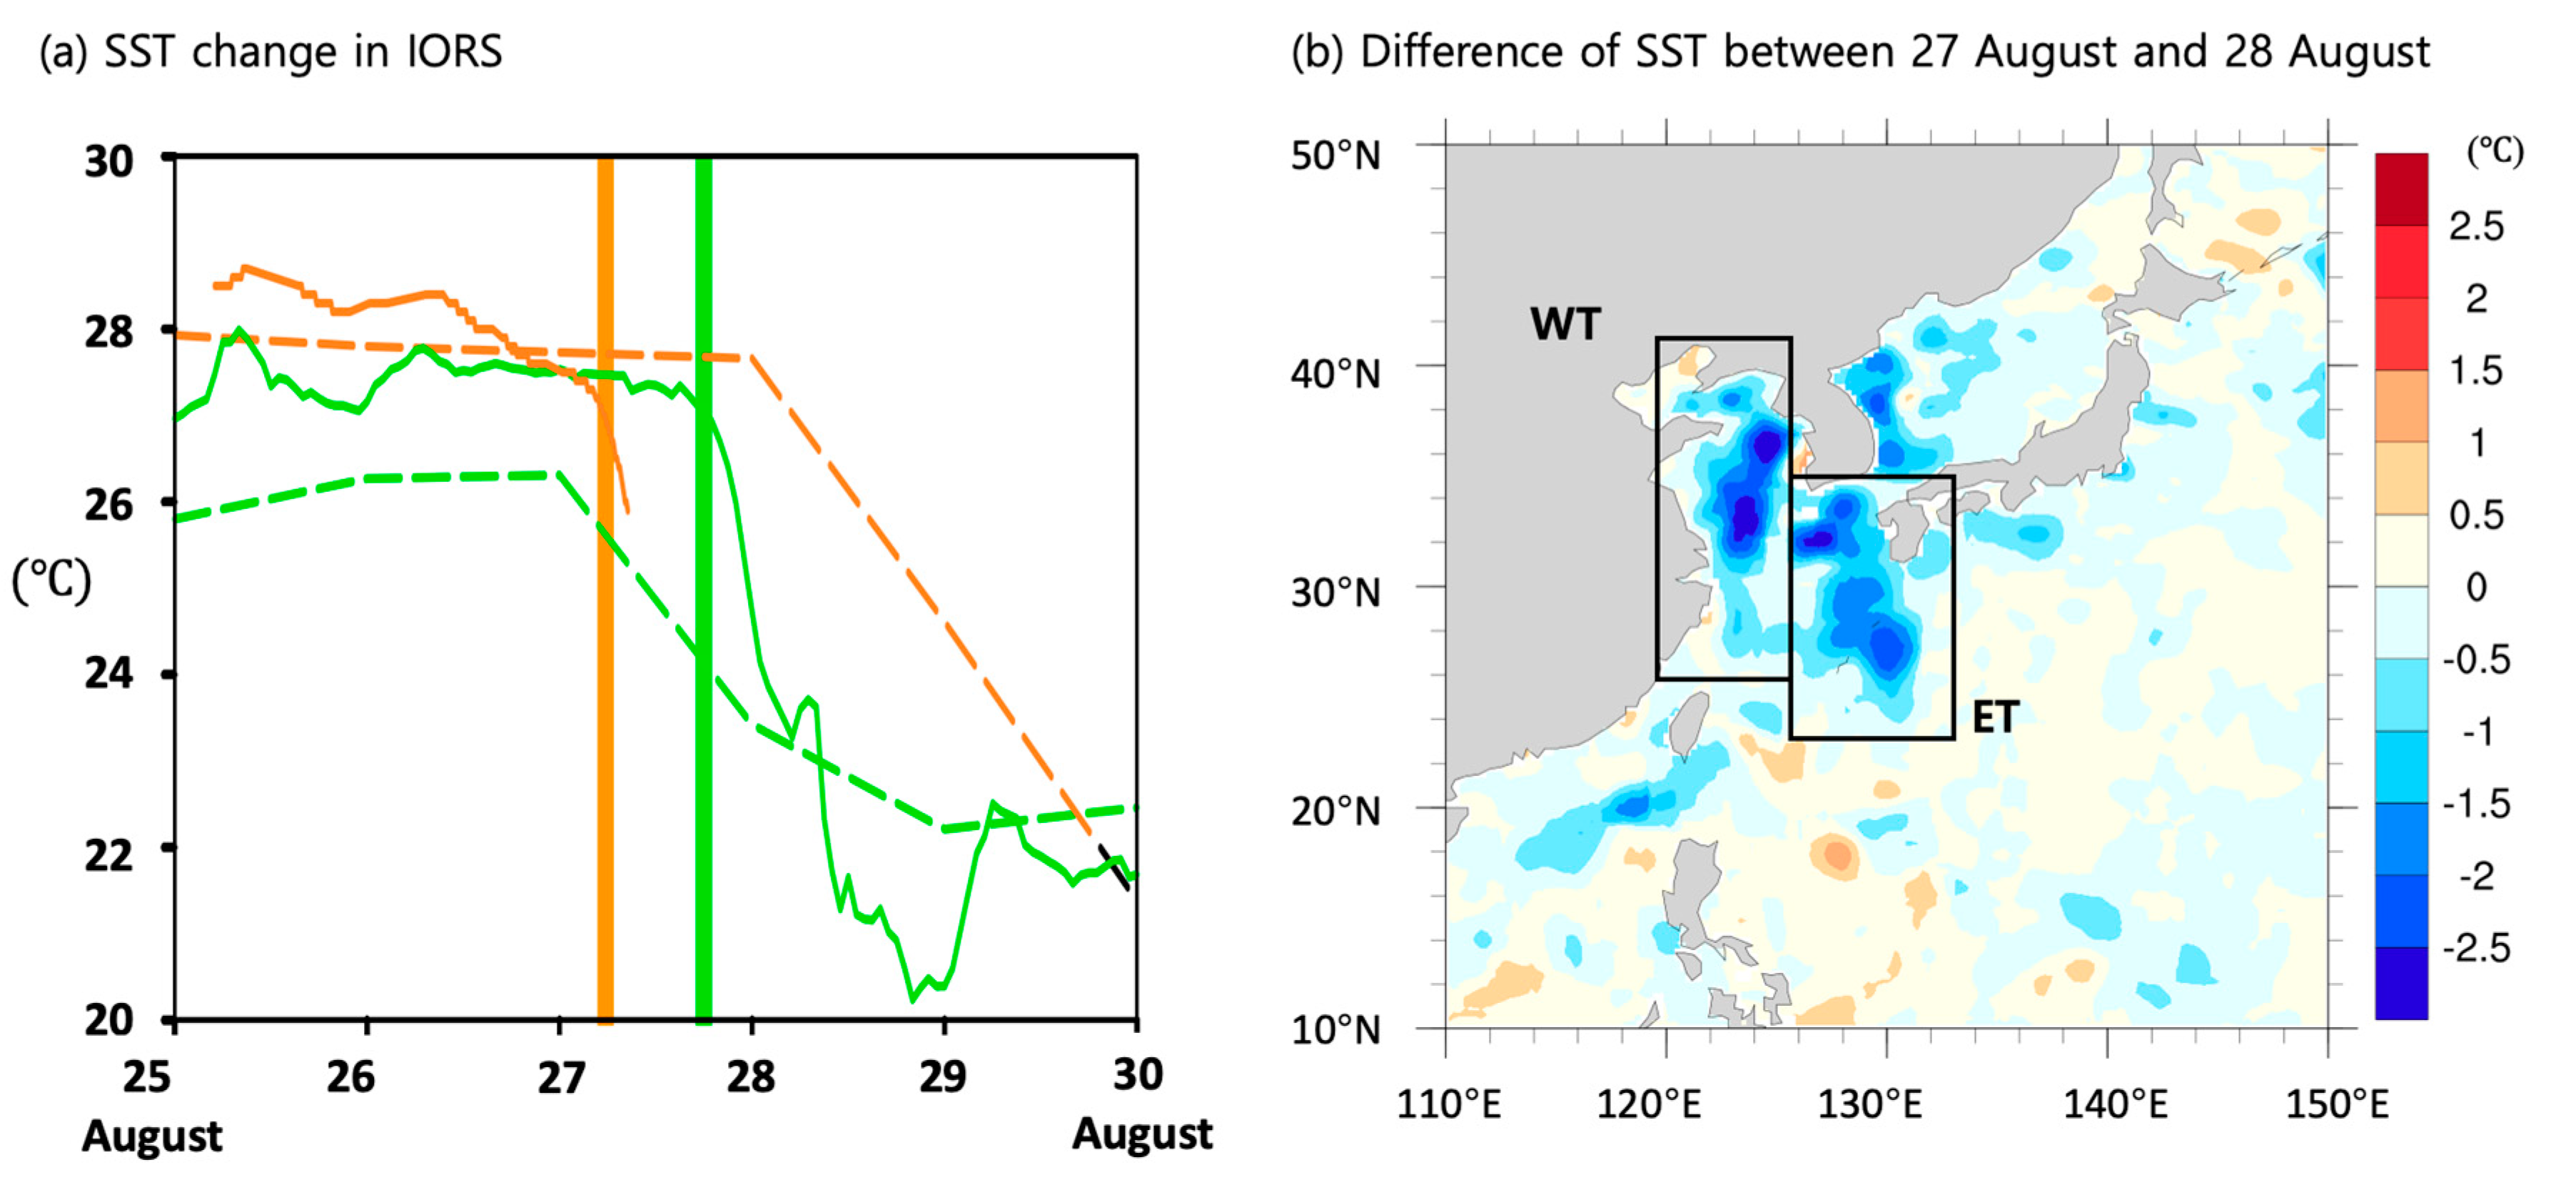
Figure 3.
Time series of sea level pressure (right y-axis, orange, unit: hPa) and 10 m wind speed (left y-axis, blue, unit:m/s) at (a) IORS, (b) No_CW_12 km experiment, and (c) No_CW_6 km experiment.
Figure 3.
Time series of sea level pressure (right y-axis, orange, unit: hPa) and 10 m wind speed (left y-axis, blue, unit:m/s) at (a) IORS, (b) No_CW_12 km experiment, and (c) No_CW_6 km experiment.
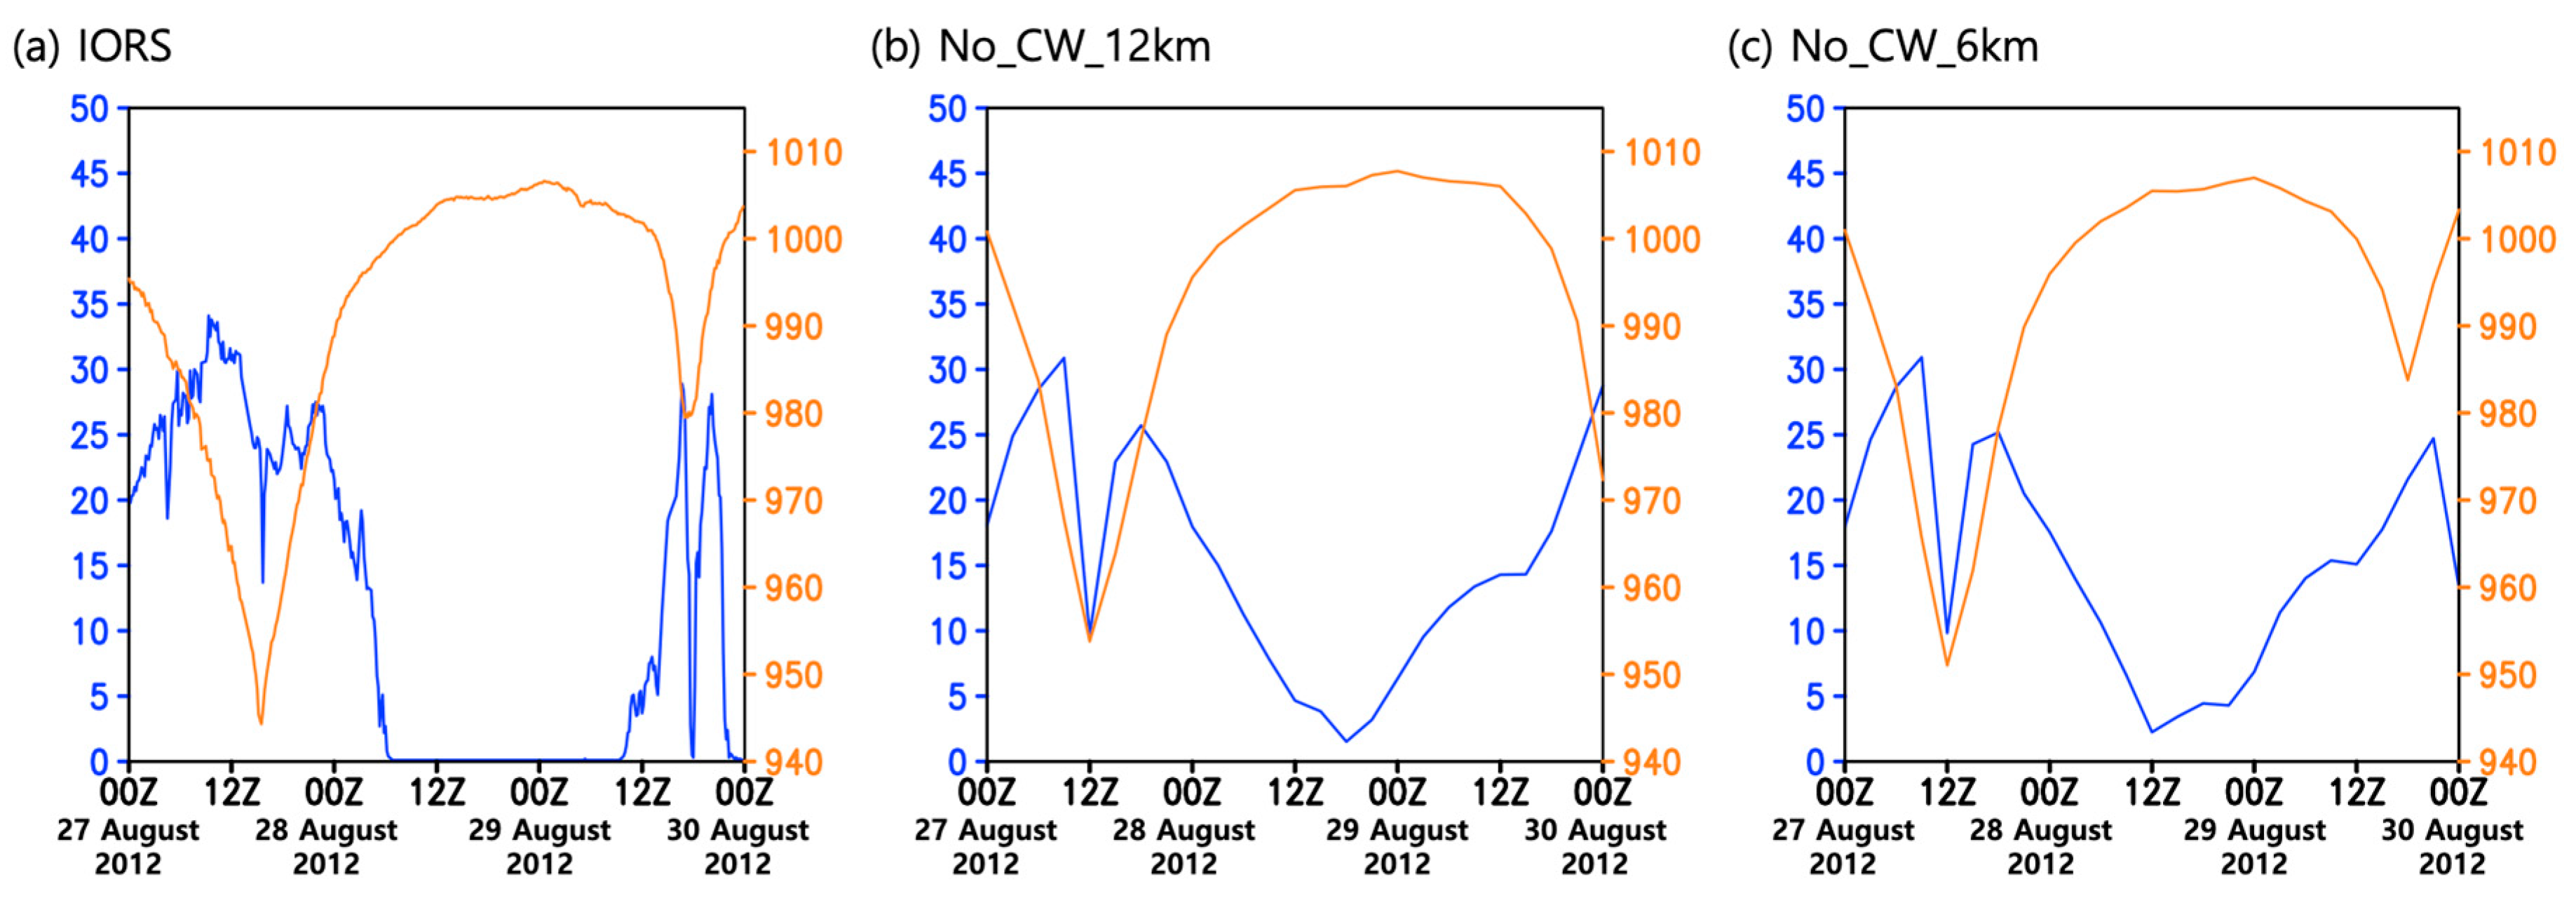
Figure 4.
Spatial patterns of SST(unit: °C) in (a) No_CW, (b) ET_CW, and (c) WT_CW adapted from the initial condition of Moon et al. 2016; (d) The track of Typhoon Tembin (black solid line: OBS, dotted line with brown(green and blue): No_CW_12 km (8 km and 6 km), solid line with brown(green and blue) ET_CW_12 km (8 km and 6 km), dashed line with brown(green and blue): WT_CW_12 km (8 km and 6 km)) and contour is geopotential height at 500 hPa in No_CW_12 km experiment; (e) the mean sea level pressure changes in Typhoon Tembin. The two-day integration is conducted from 00 UTC 28 August 2012 to 00 UTC 30 August 2012.
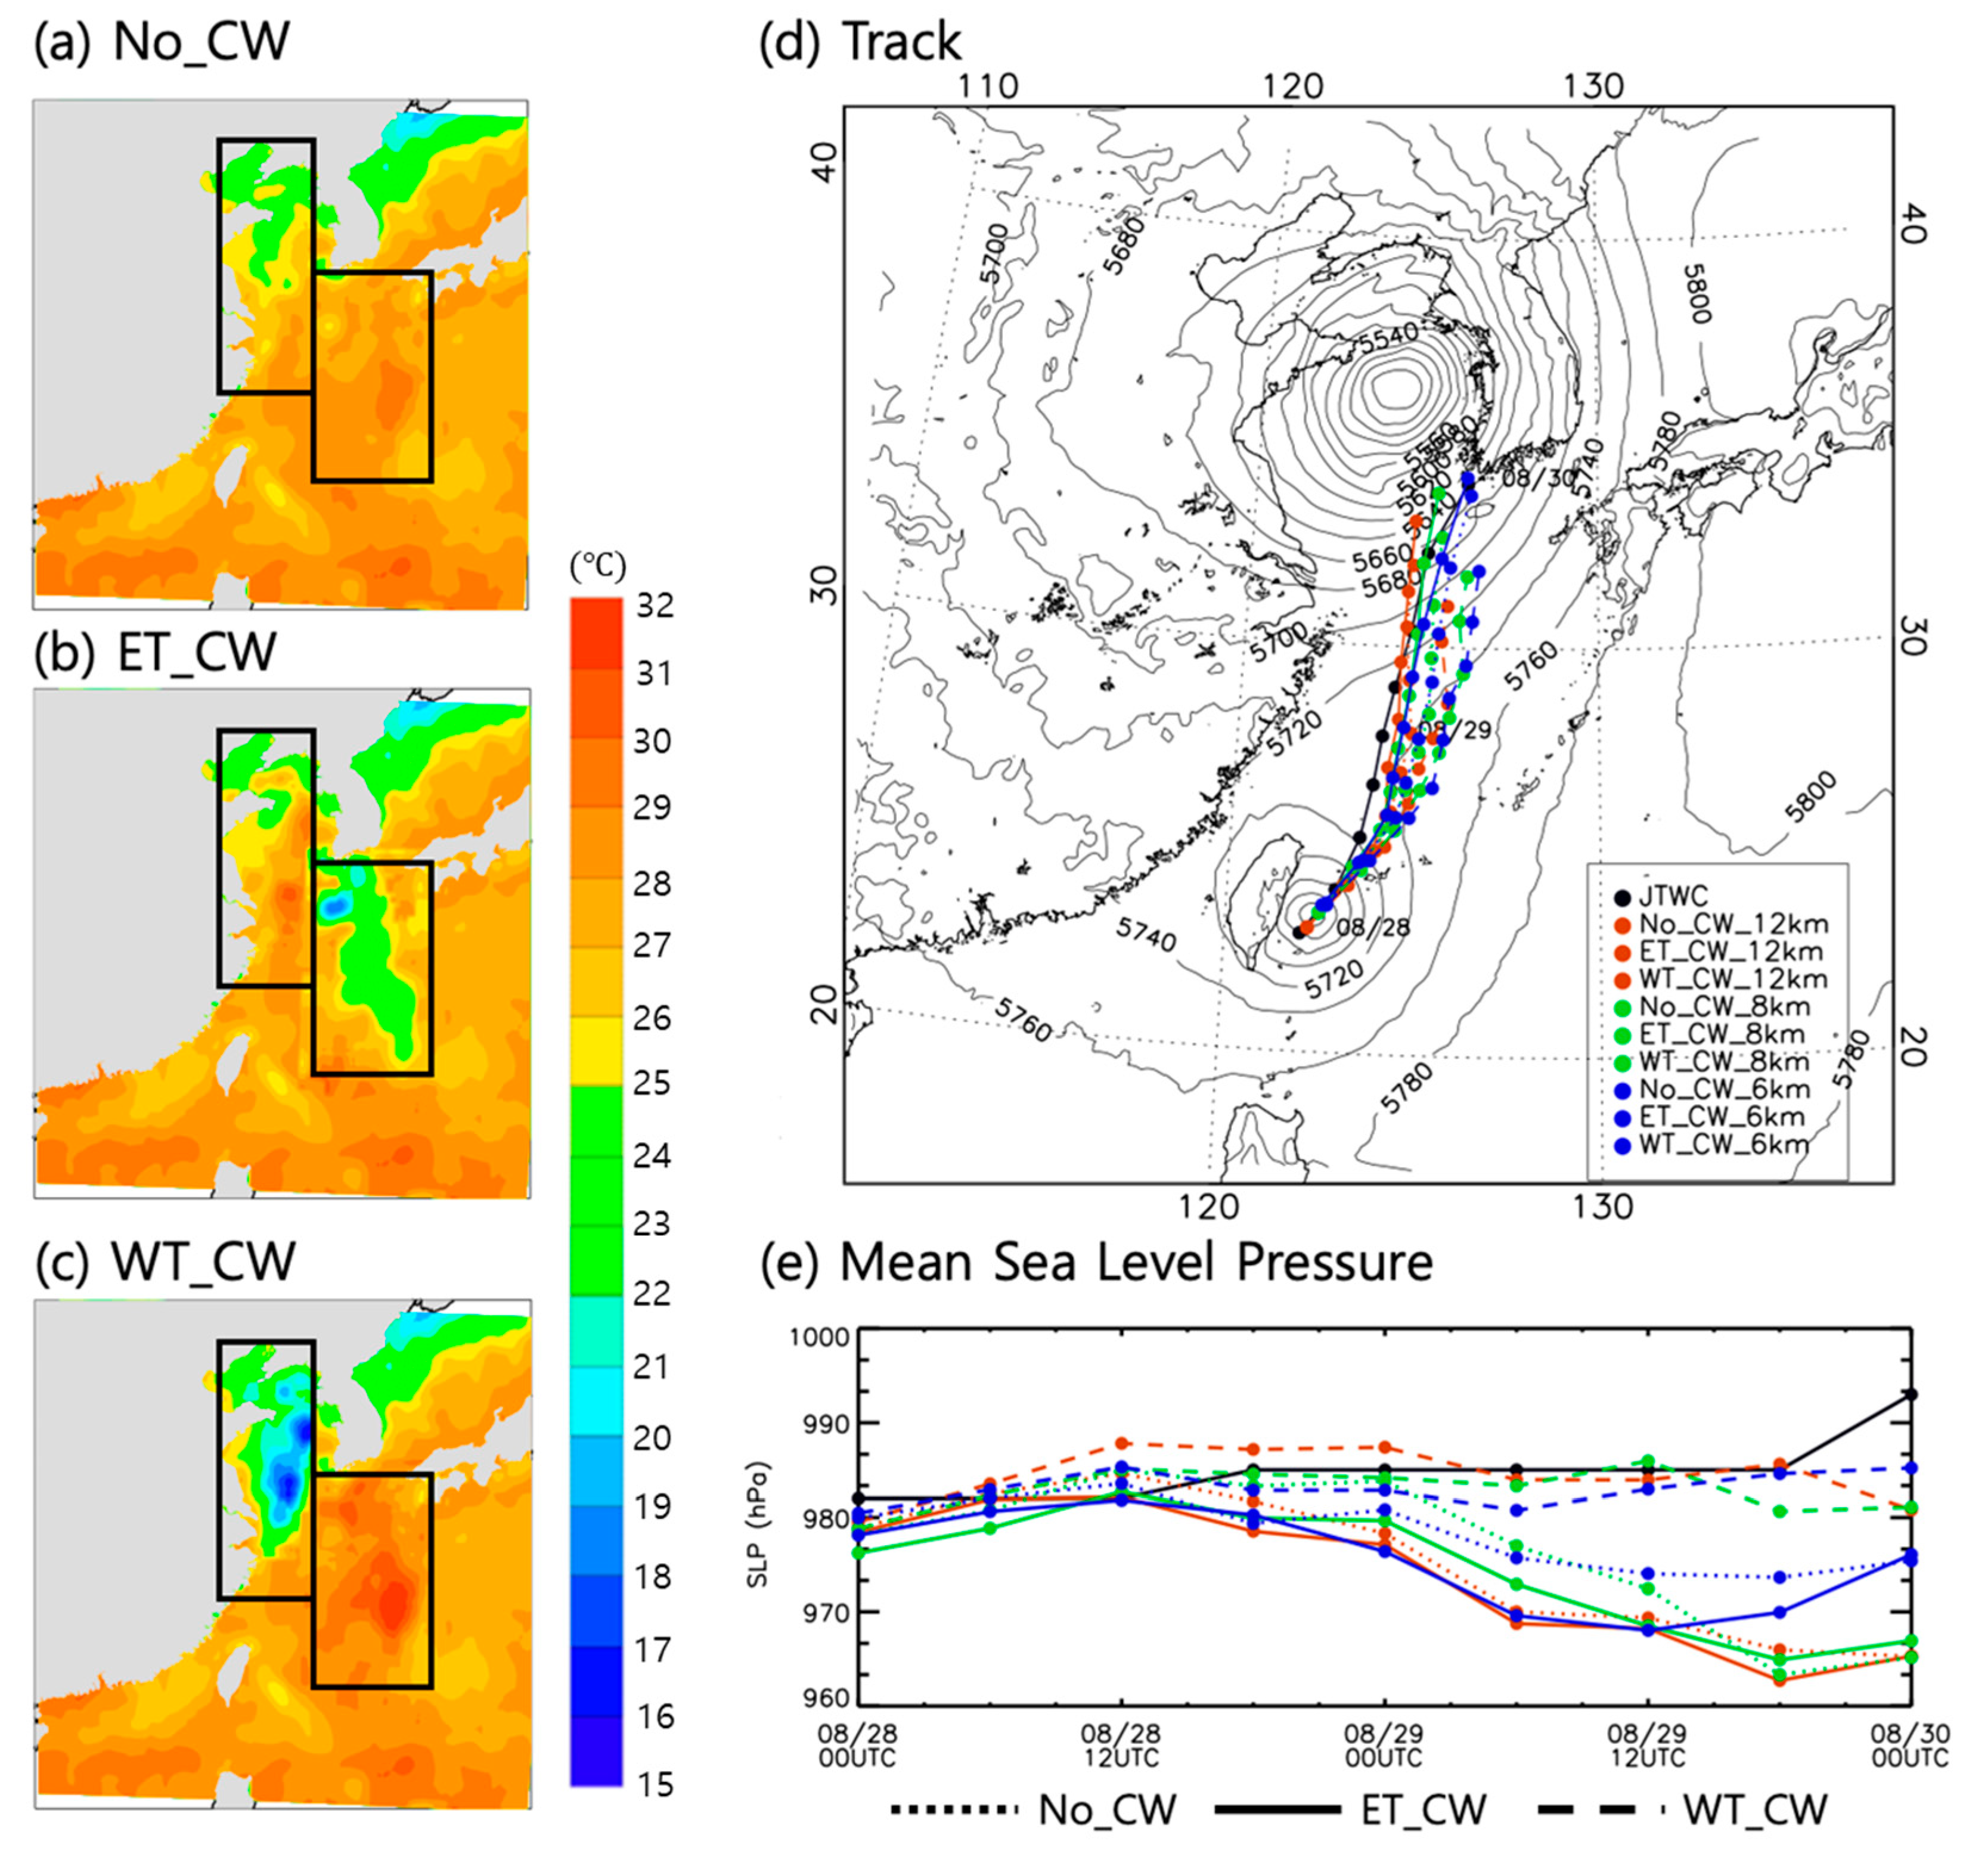
Figure 5.
Wavenumber-1 components of (a–c) total potential vorticity tendency, (d–f) horizontal advection, (g–i) vertical advection, and (j–l) diabatic heating, which are 12-h composites of lower-level (0.9 ≥ σ ≥ 0.55) averages during 48–60 h in (left) No_CW, (middle) ET-CW, and (right) WT-CW experiment of Tembin. The left panel is for 12 km grid experiments and the right panel is for 6 km grid experiments. Positive values are shaded. The contour interval is 3.0 in (a–f), 0.5 in (g–i), and 1.0 in (j–l). [Unit: 10−4 potential vorticity unit (PVU) per seconds (PVU, where PVU:10−6m2s−1Kkg−1).].
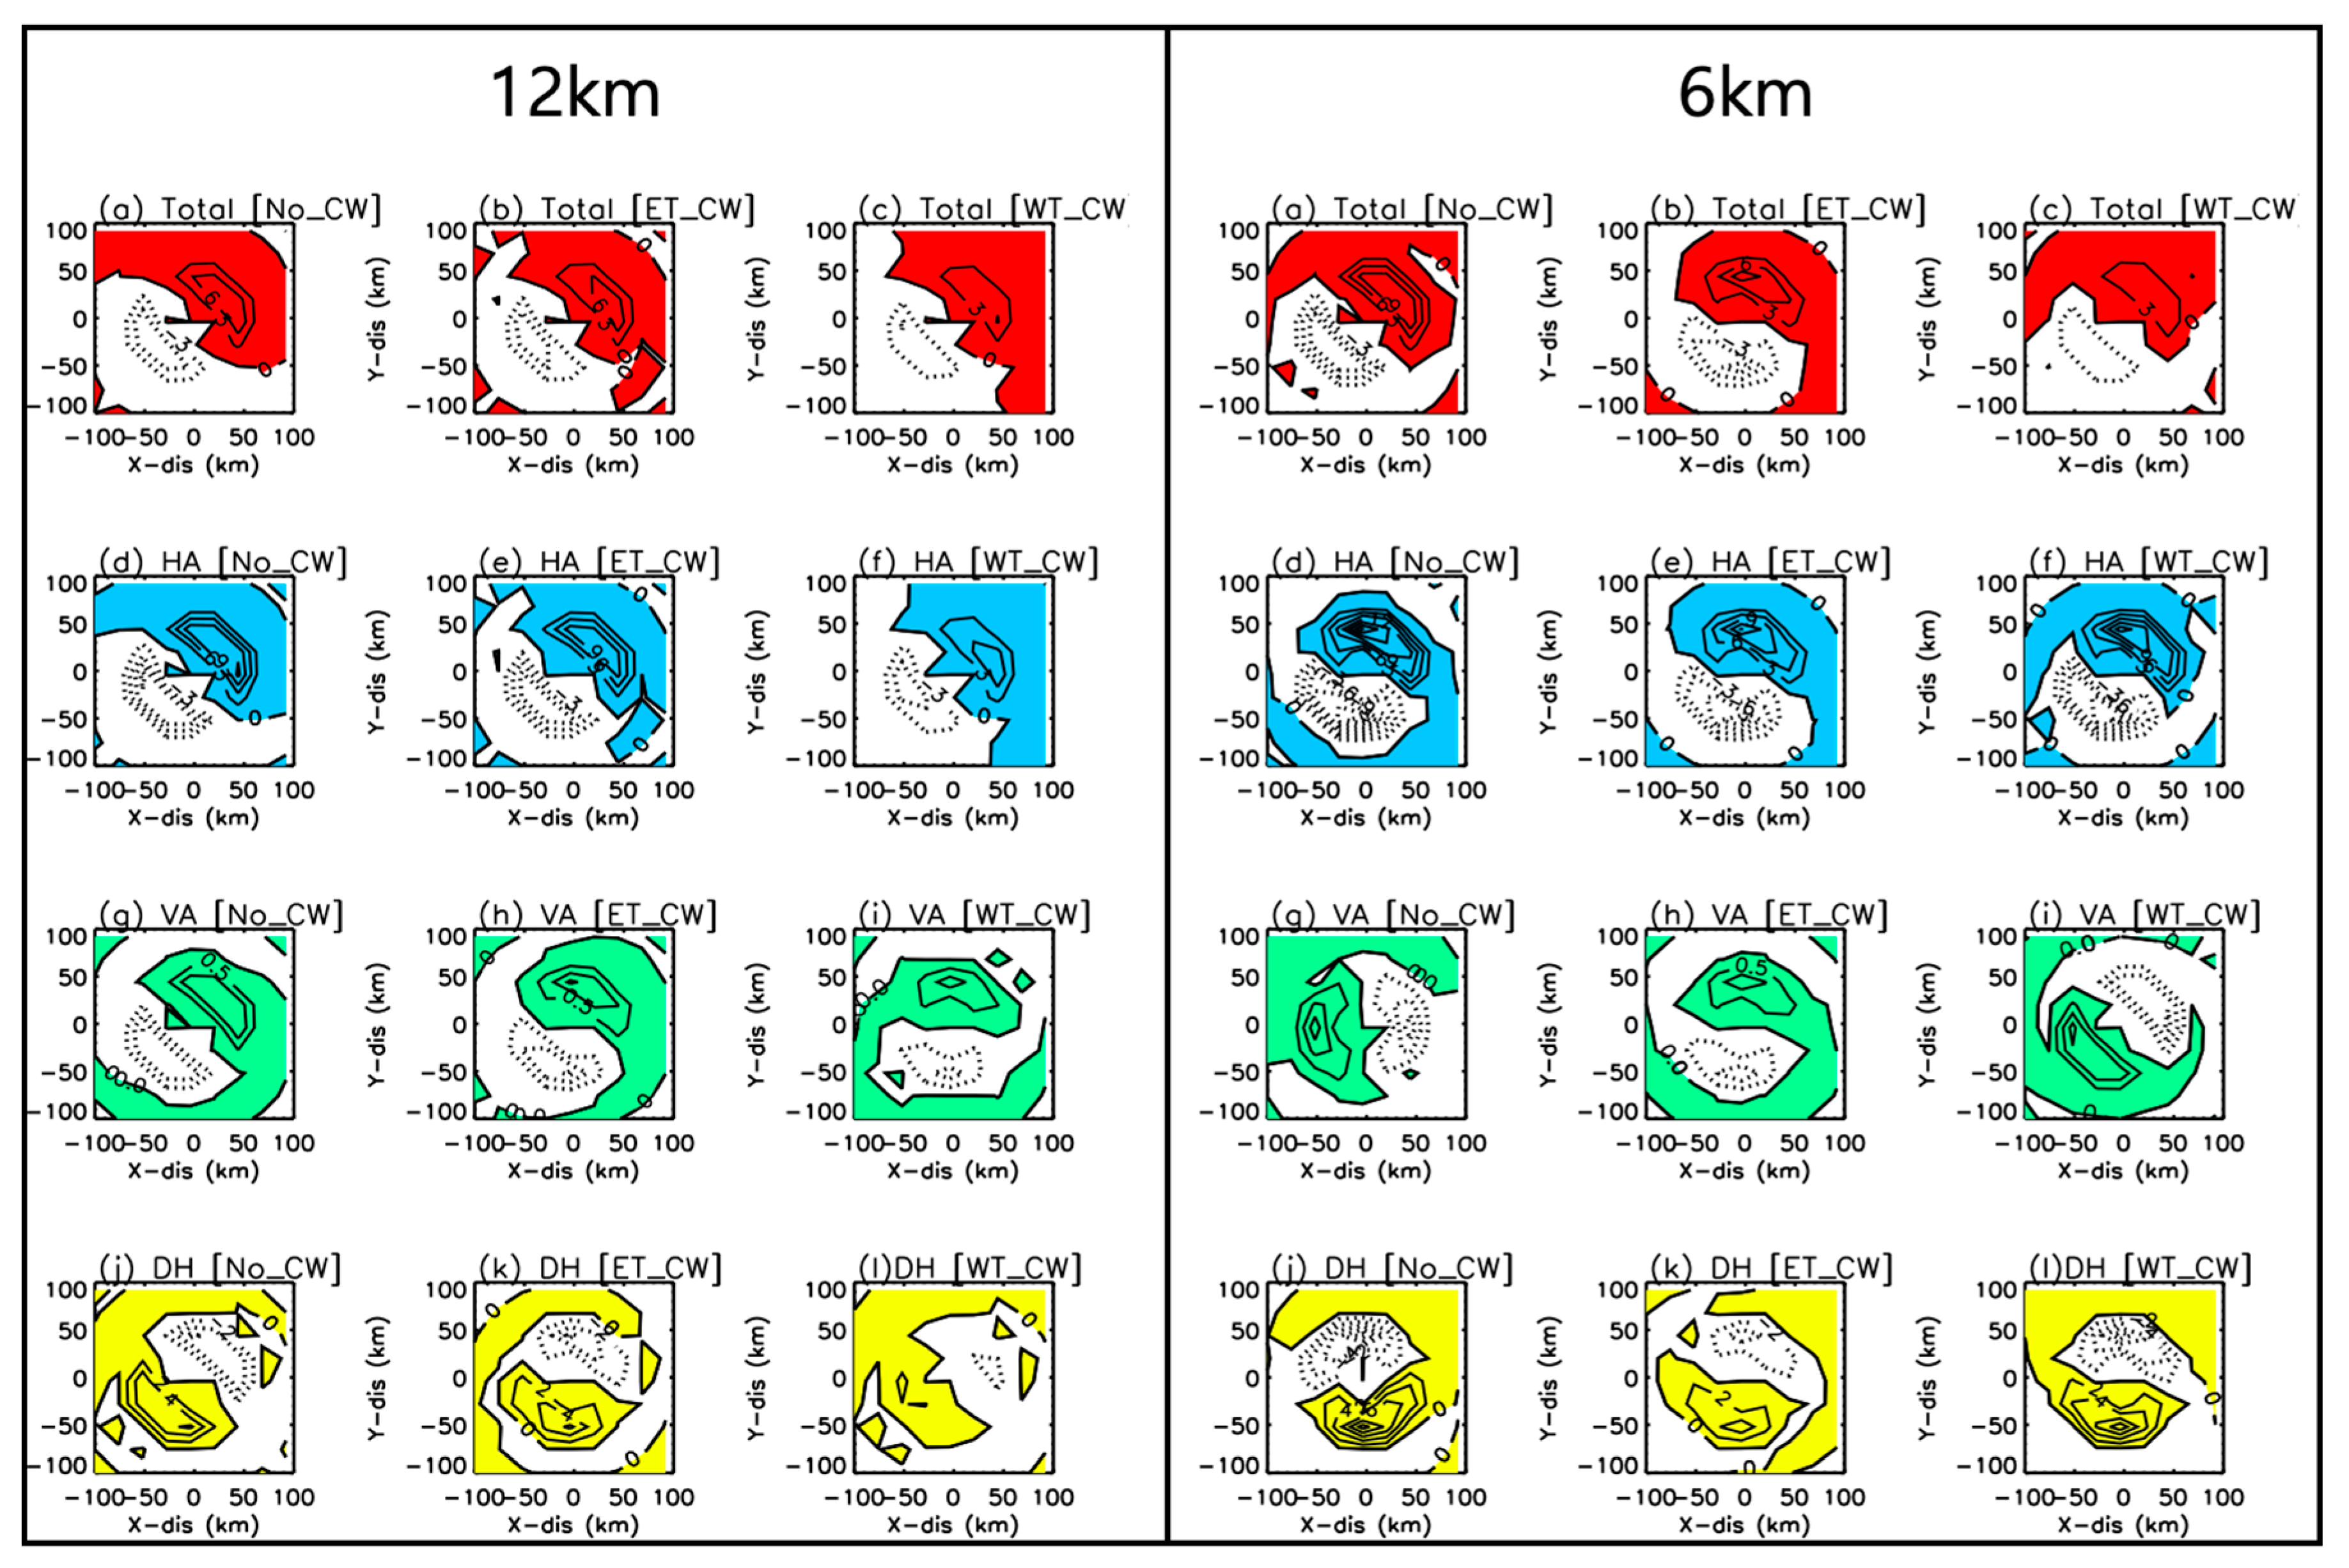
Figure 6.
The 12-h averaged lower-level (900 hPa–550 hPa) asymmetric flow in the Typhoon Tembin core region (250 km × 250 km) over periods (48–60 h) in (a) No_CW_12 km, (b) No_CW_8 km, (c) No_CW_6 km, (d) ET_CW_12 km, (e) ET_CW_8 km, (f) ET_CW_6 km, (g) WT_CW_12 km, (h) WT_CW_8 km and (i) WT_CW_6 km experiment of Typhoon Tembin.
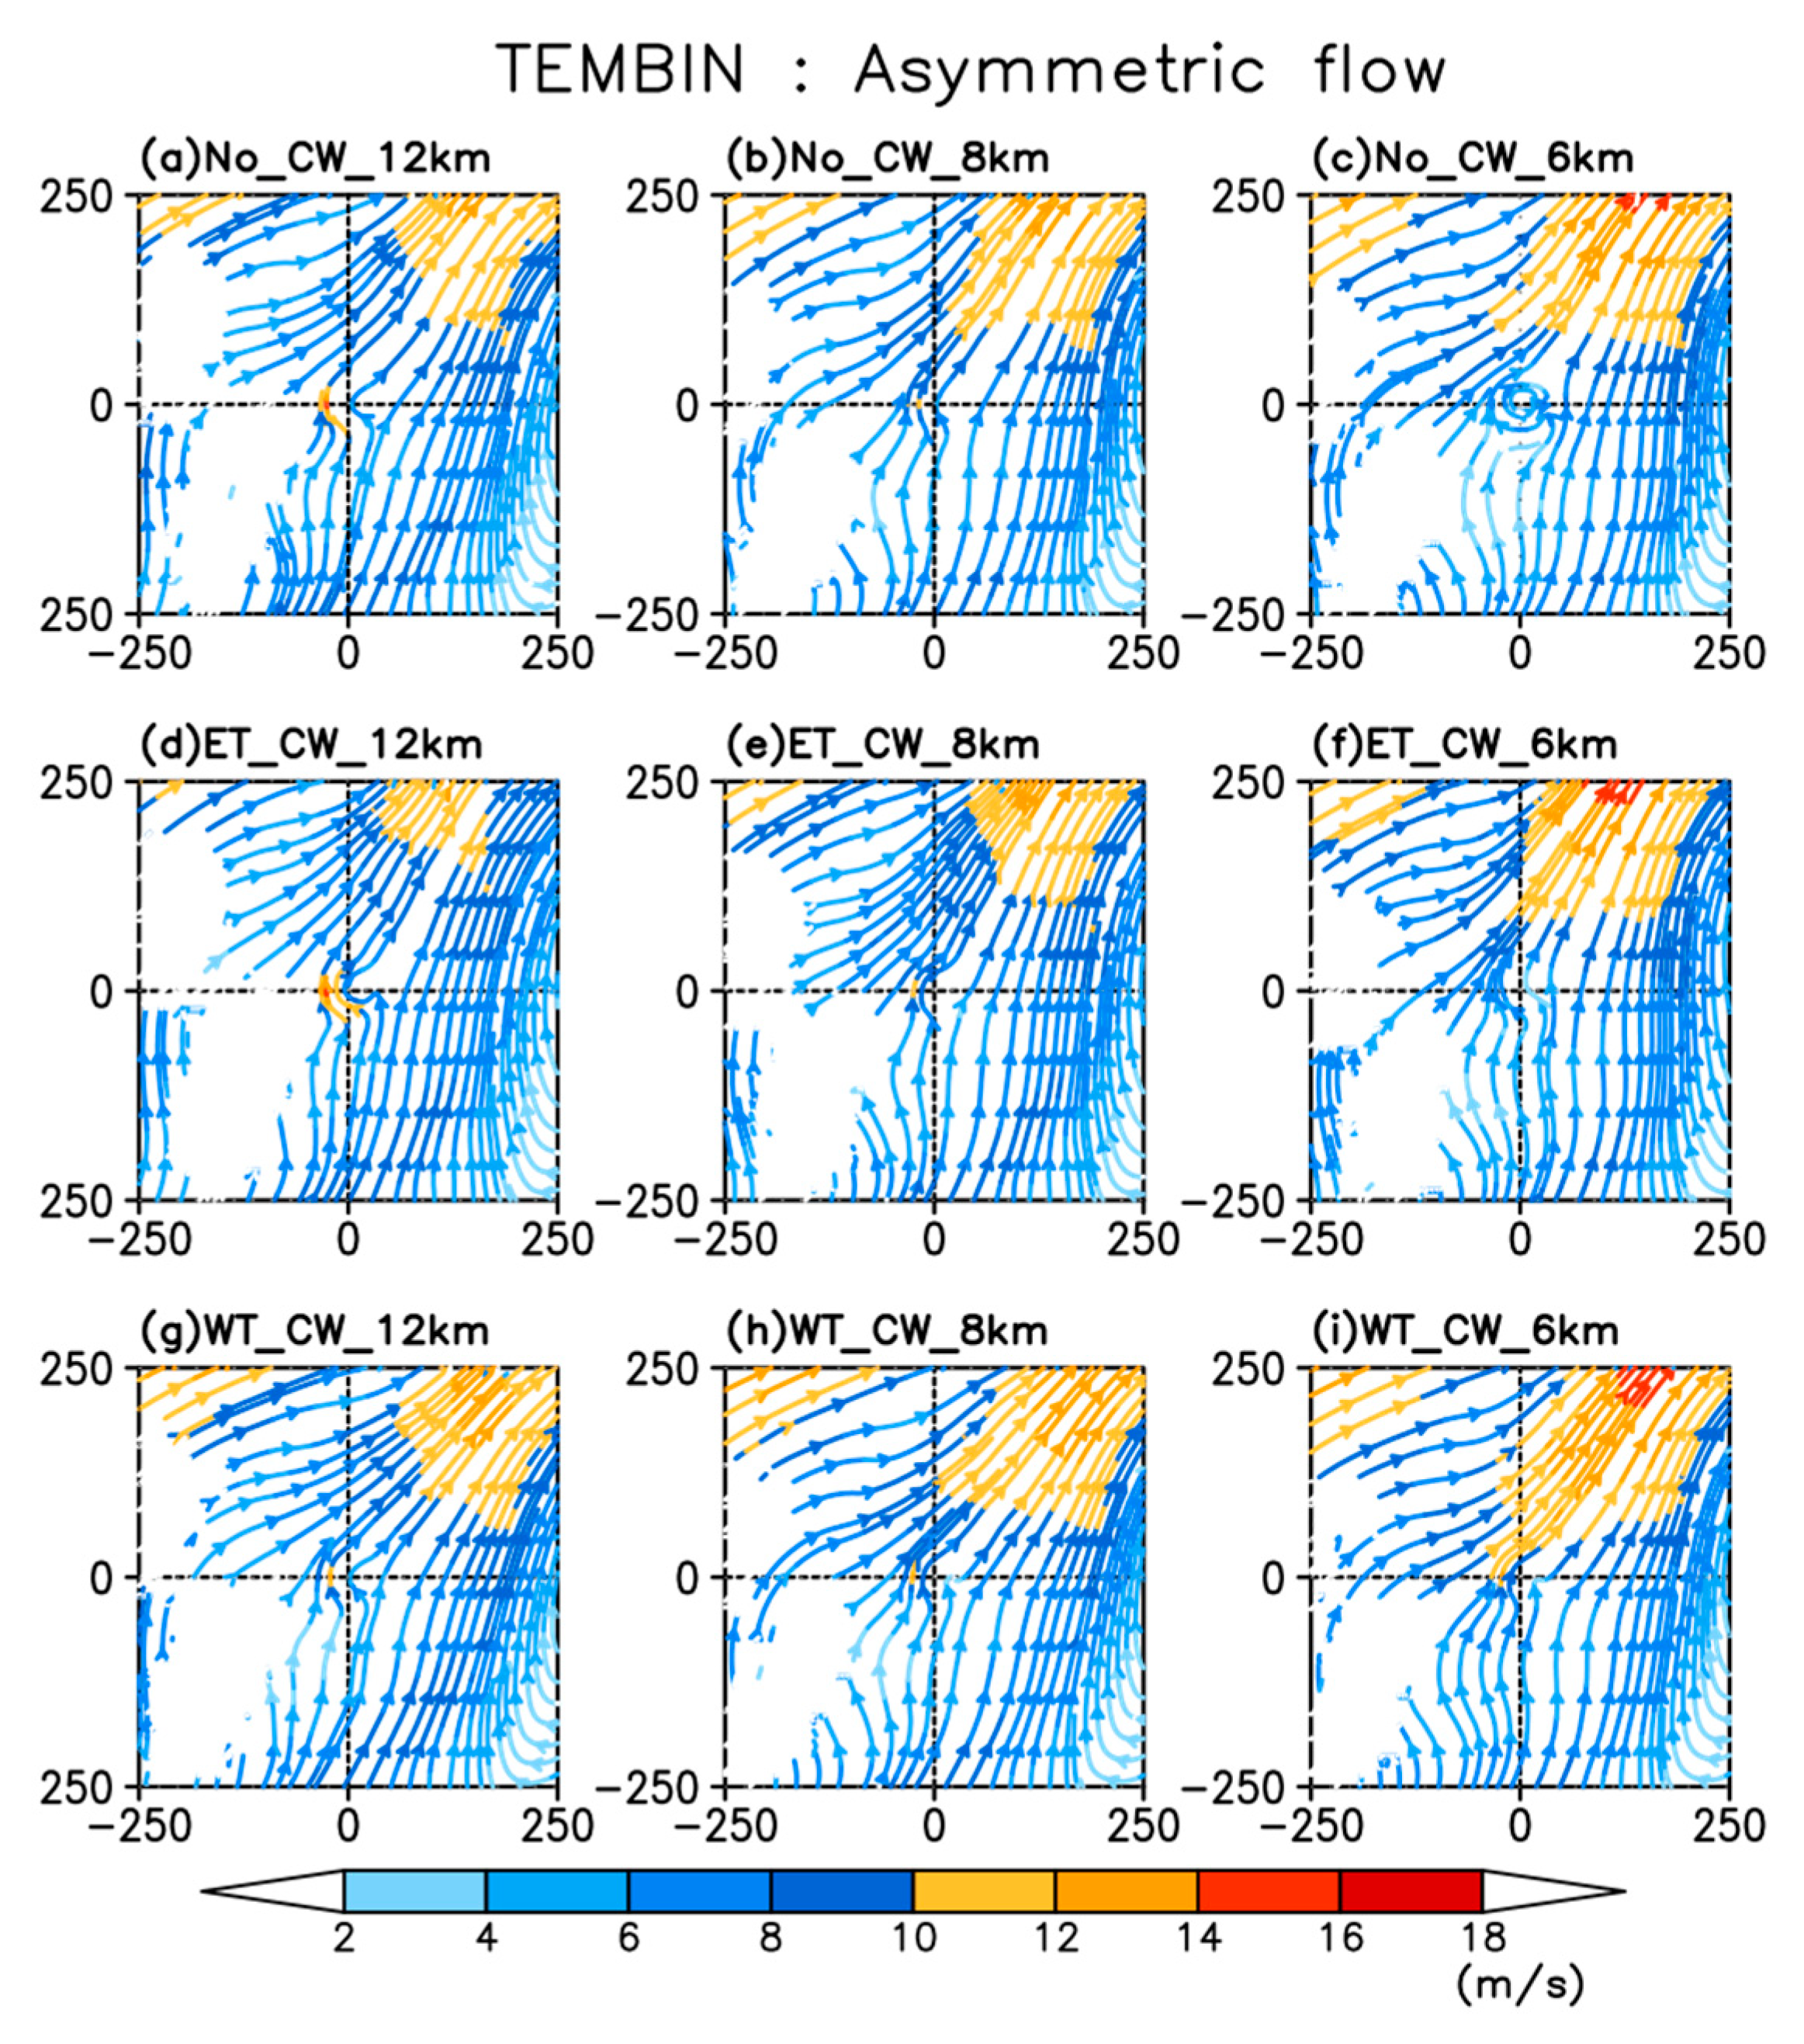
Figure 7.
12-h averaged zonal cross-section of PV at the center of TC during 48–60 h in (a) No_CW_12 km, (b) No_CW_8 km, (c) No_CW_6 km, (d) ET_CW_12 km, (e) ET_CW_8 km, (f) ET_CW_6 km, (g) WT_CW_12 km, (h) WT_CW_8 km and (i) WT_CW_6 km.Shaded is the PV magnitude in No_CW (top), ET_CW (middle), and WT_CW (bottom), the shading denotes the magnitude of PV and contour denotes wavenumber 1 component of PV(shaded interval is 1 PVU:10−6m2s−1Kkg−1 and the contour interval is 0.5 PVU).
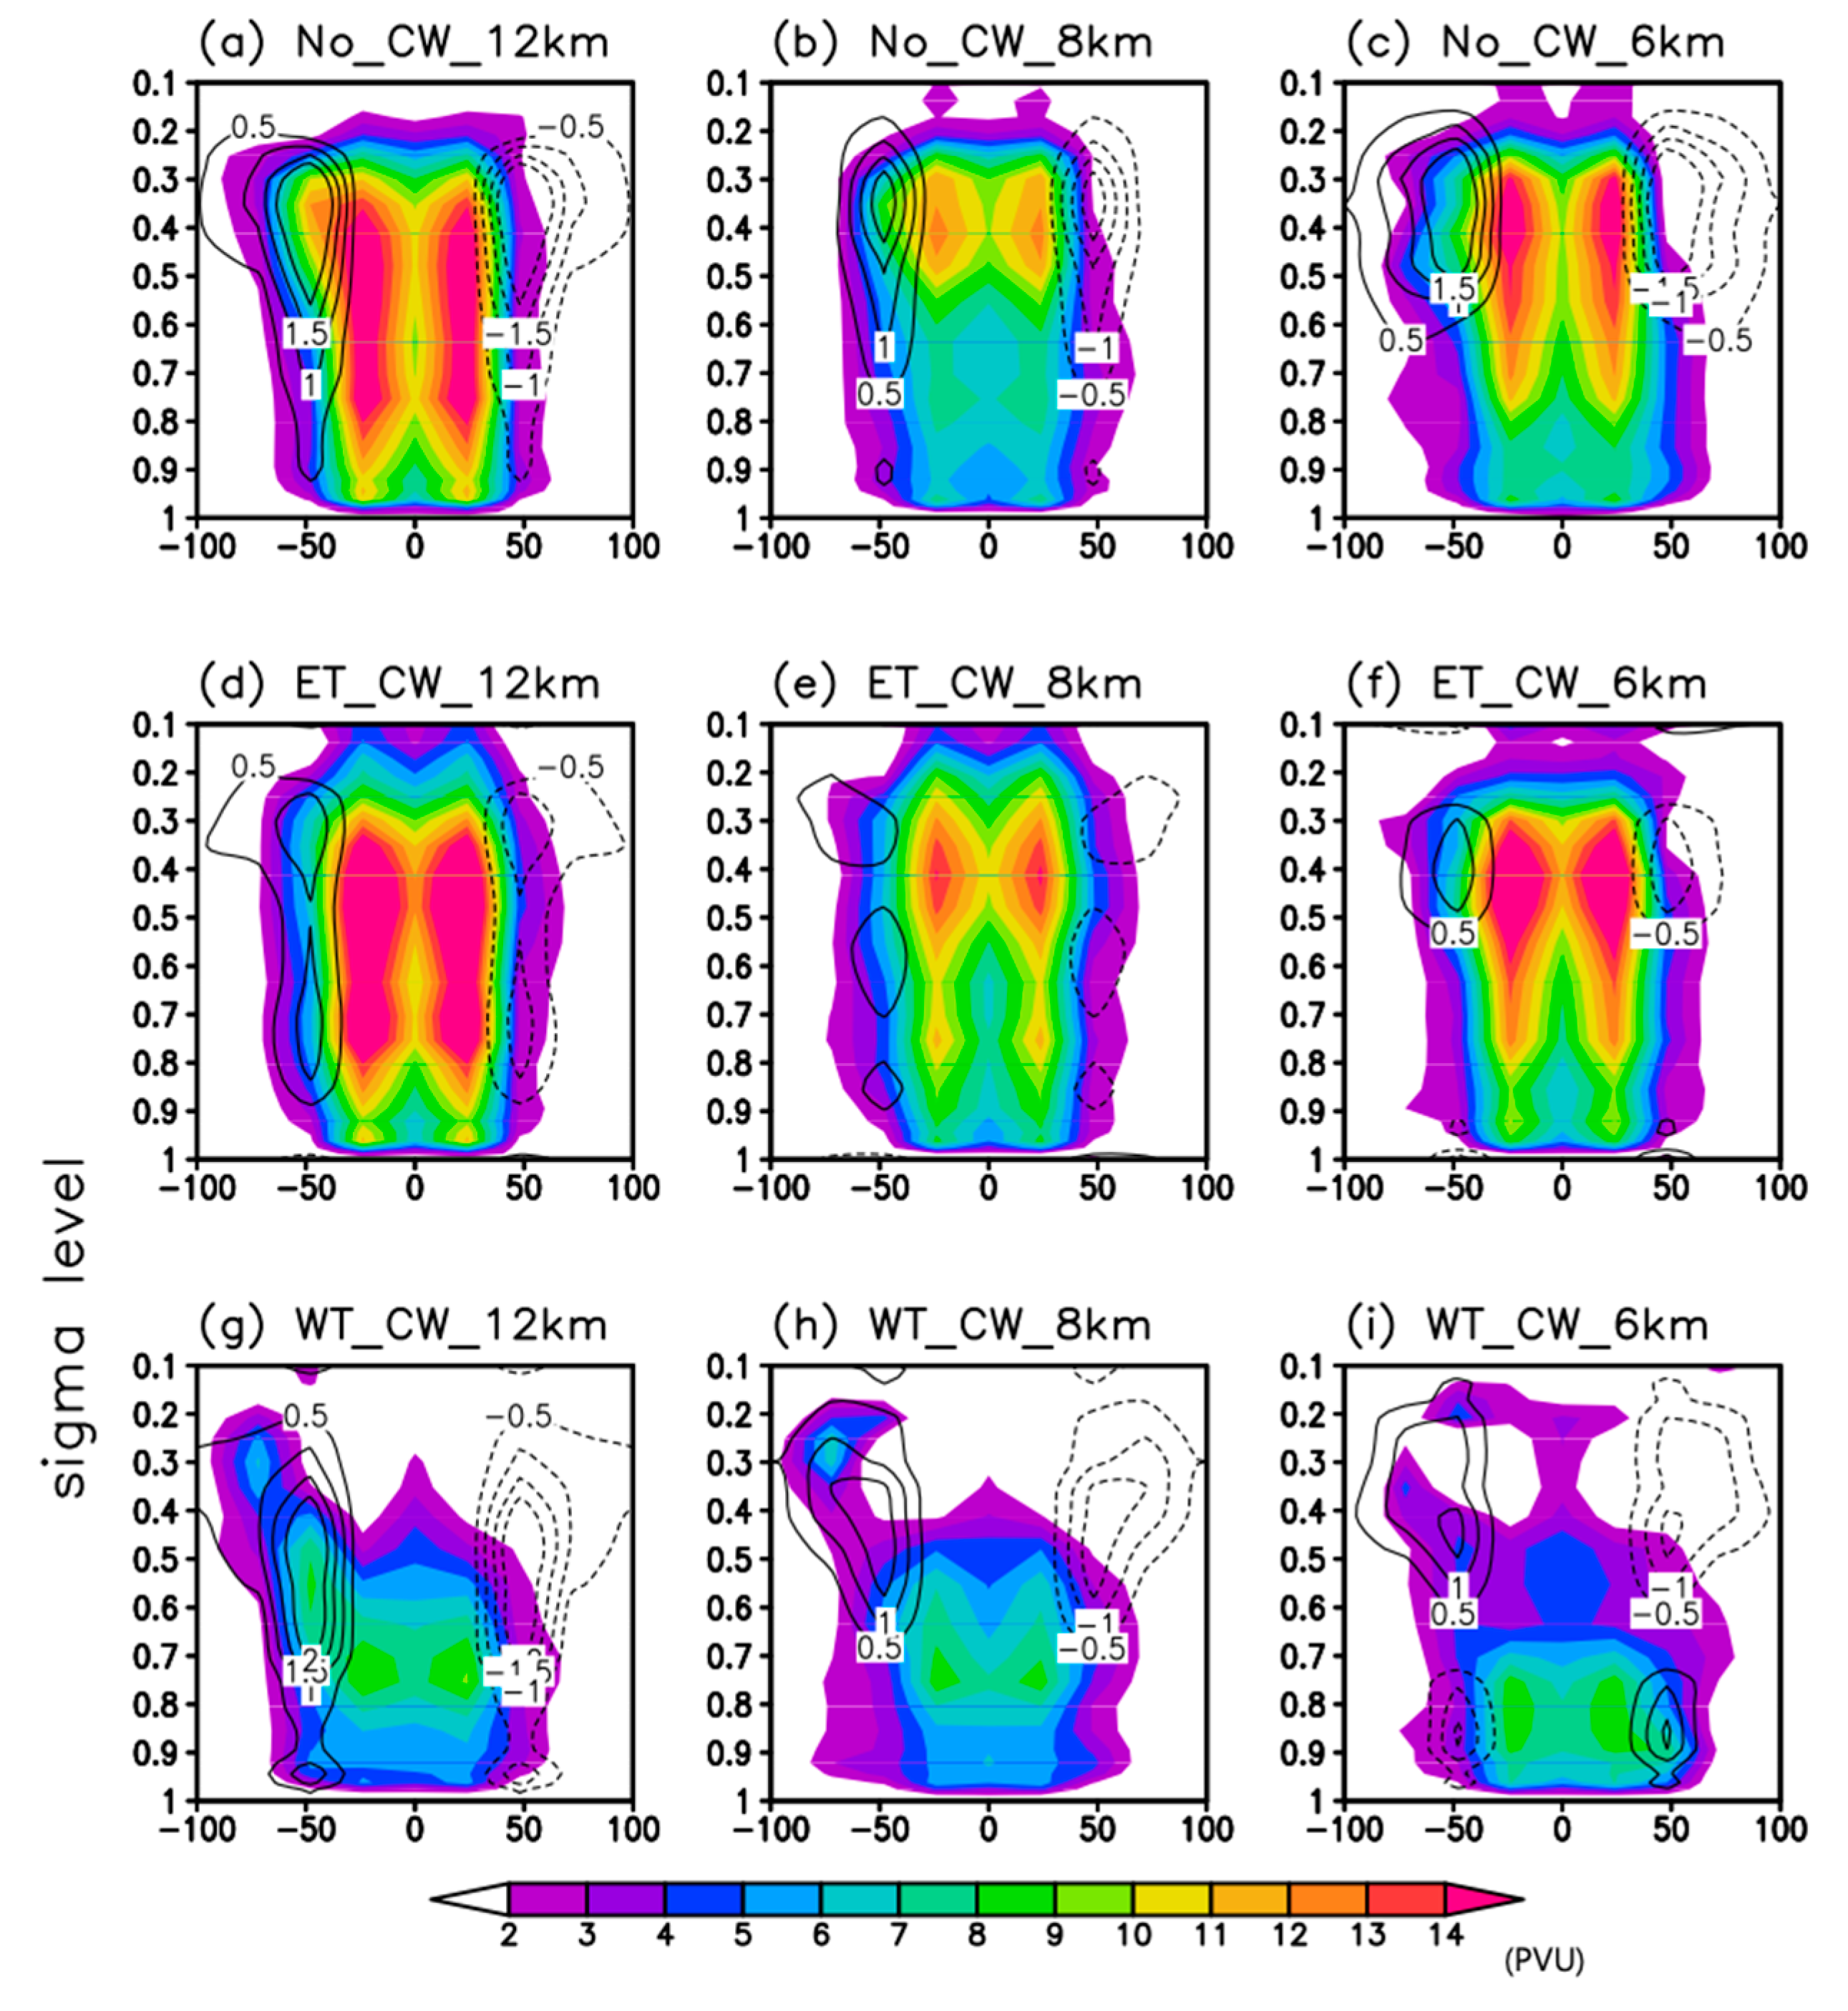
Figure 8.
The spatial pattern of the vertical averaged MSE during 48–60 h in (a) No_CW_12 km, (b) No_CW_8 km, (c) No_CW_6 km, (d) ET_CW_12 km, (e) ET_CW_8 km, (f) ET_CW_6 km, (g) WT_CW_12 km, (h) WT_CW_8 km and (i) WT_CW_6 km. left panel is lower layer(0.99 to 0.85 sigma level) and right panel is middle layer(0.85 to 0.55 sigma level).
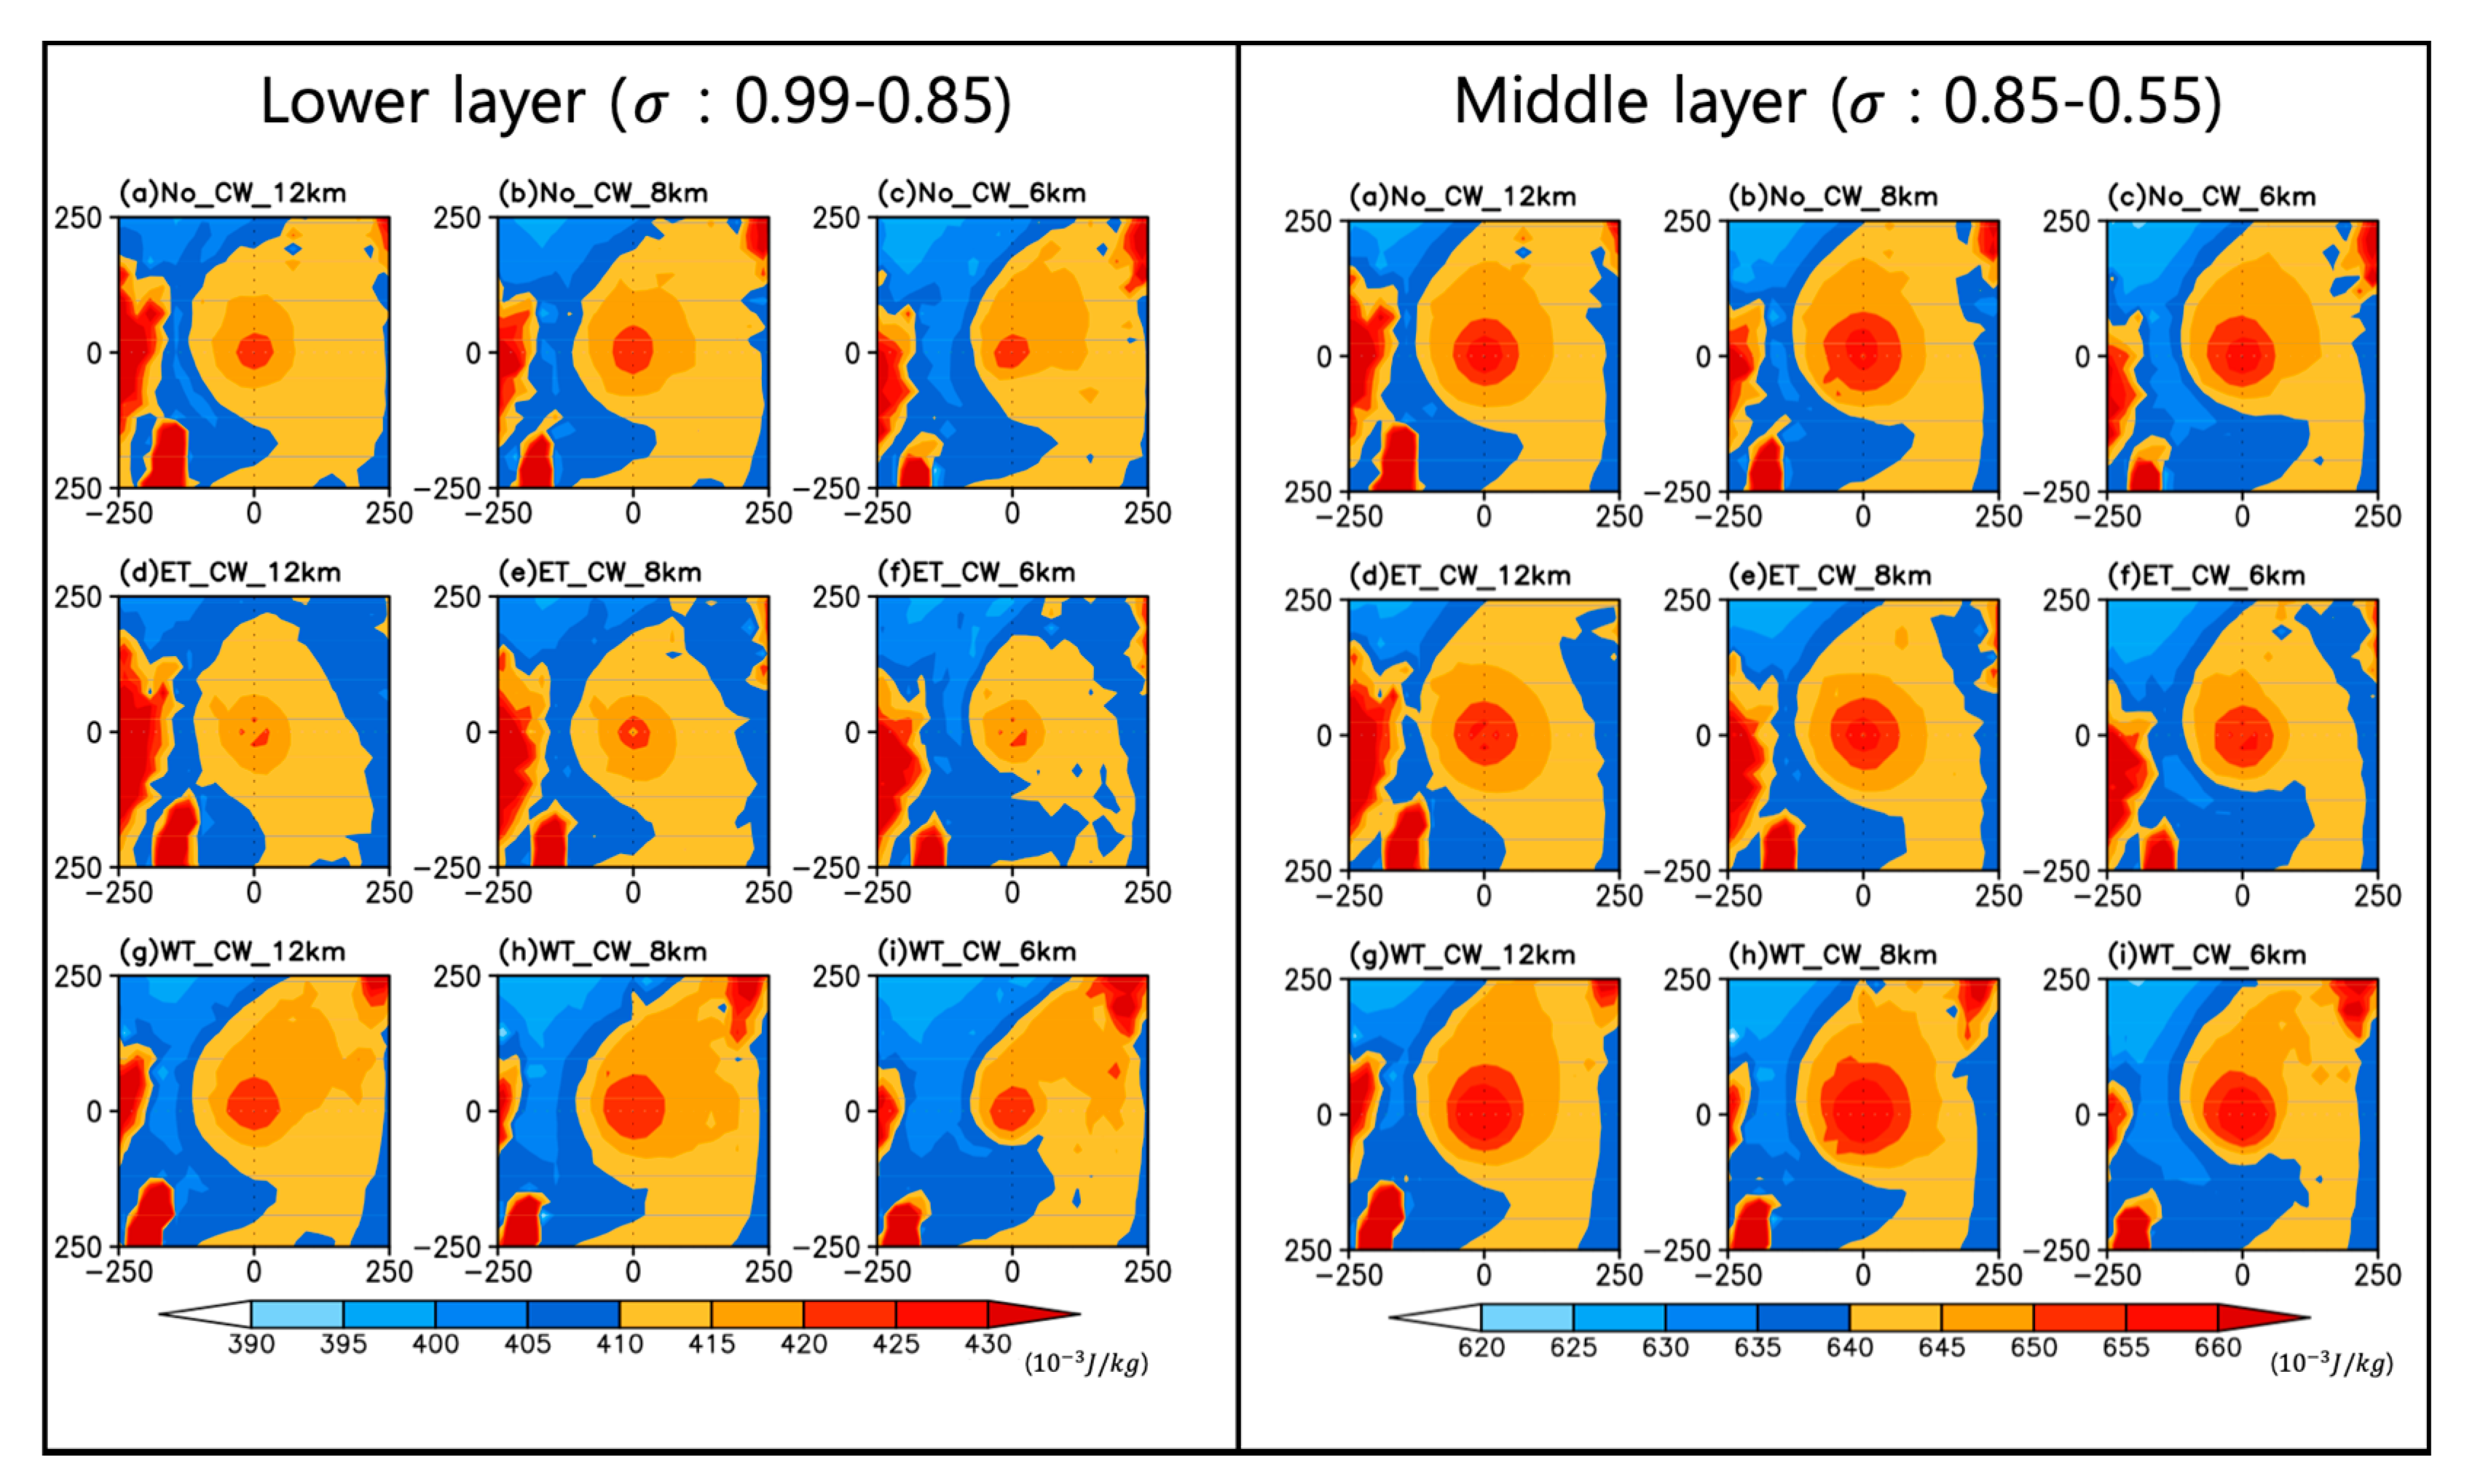
Figure 9.
The 12-h averaged wind shear(200 hPa–850 hPa) in the inner region of TC (250 km × 250 km) over periods (48~60 h) in (a) No_CW_12 km, (b) No_CW_8 km, (c) No_CW_6 km, (d) ET_CW_12 km, (e) ET_CW_8 km, (f) ET_CW_6 km, (g) WT_CW_12 km, (h) WT_CW_8 km and (i) WT_CW_6 km experiment of Typhoon Tembin.
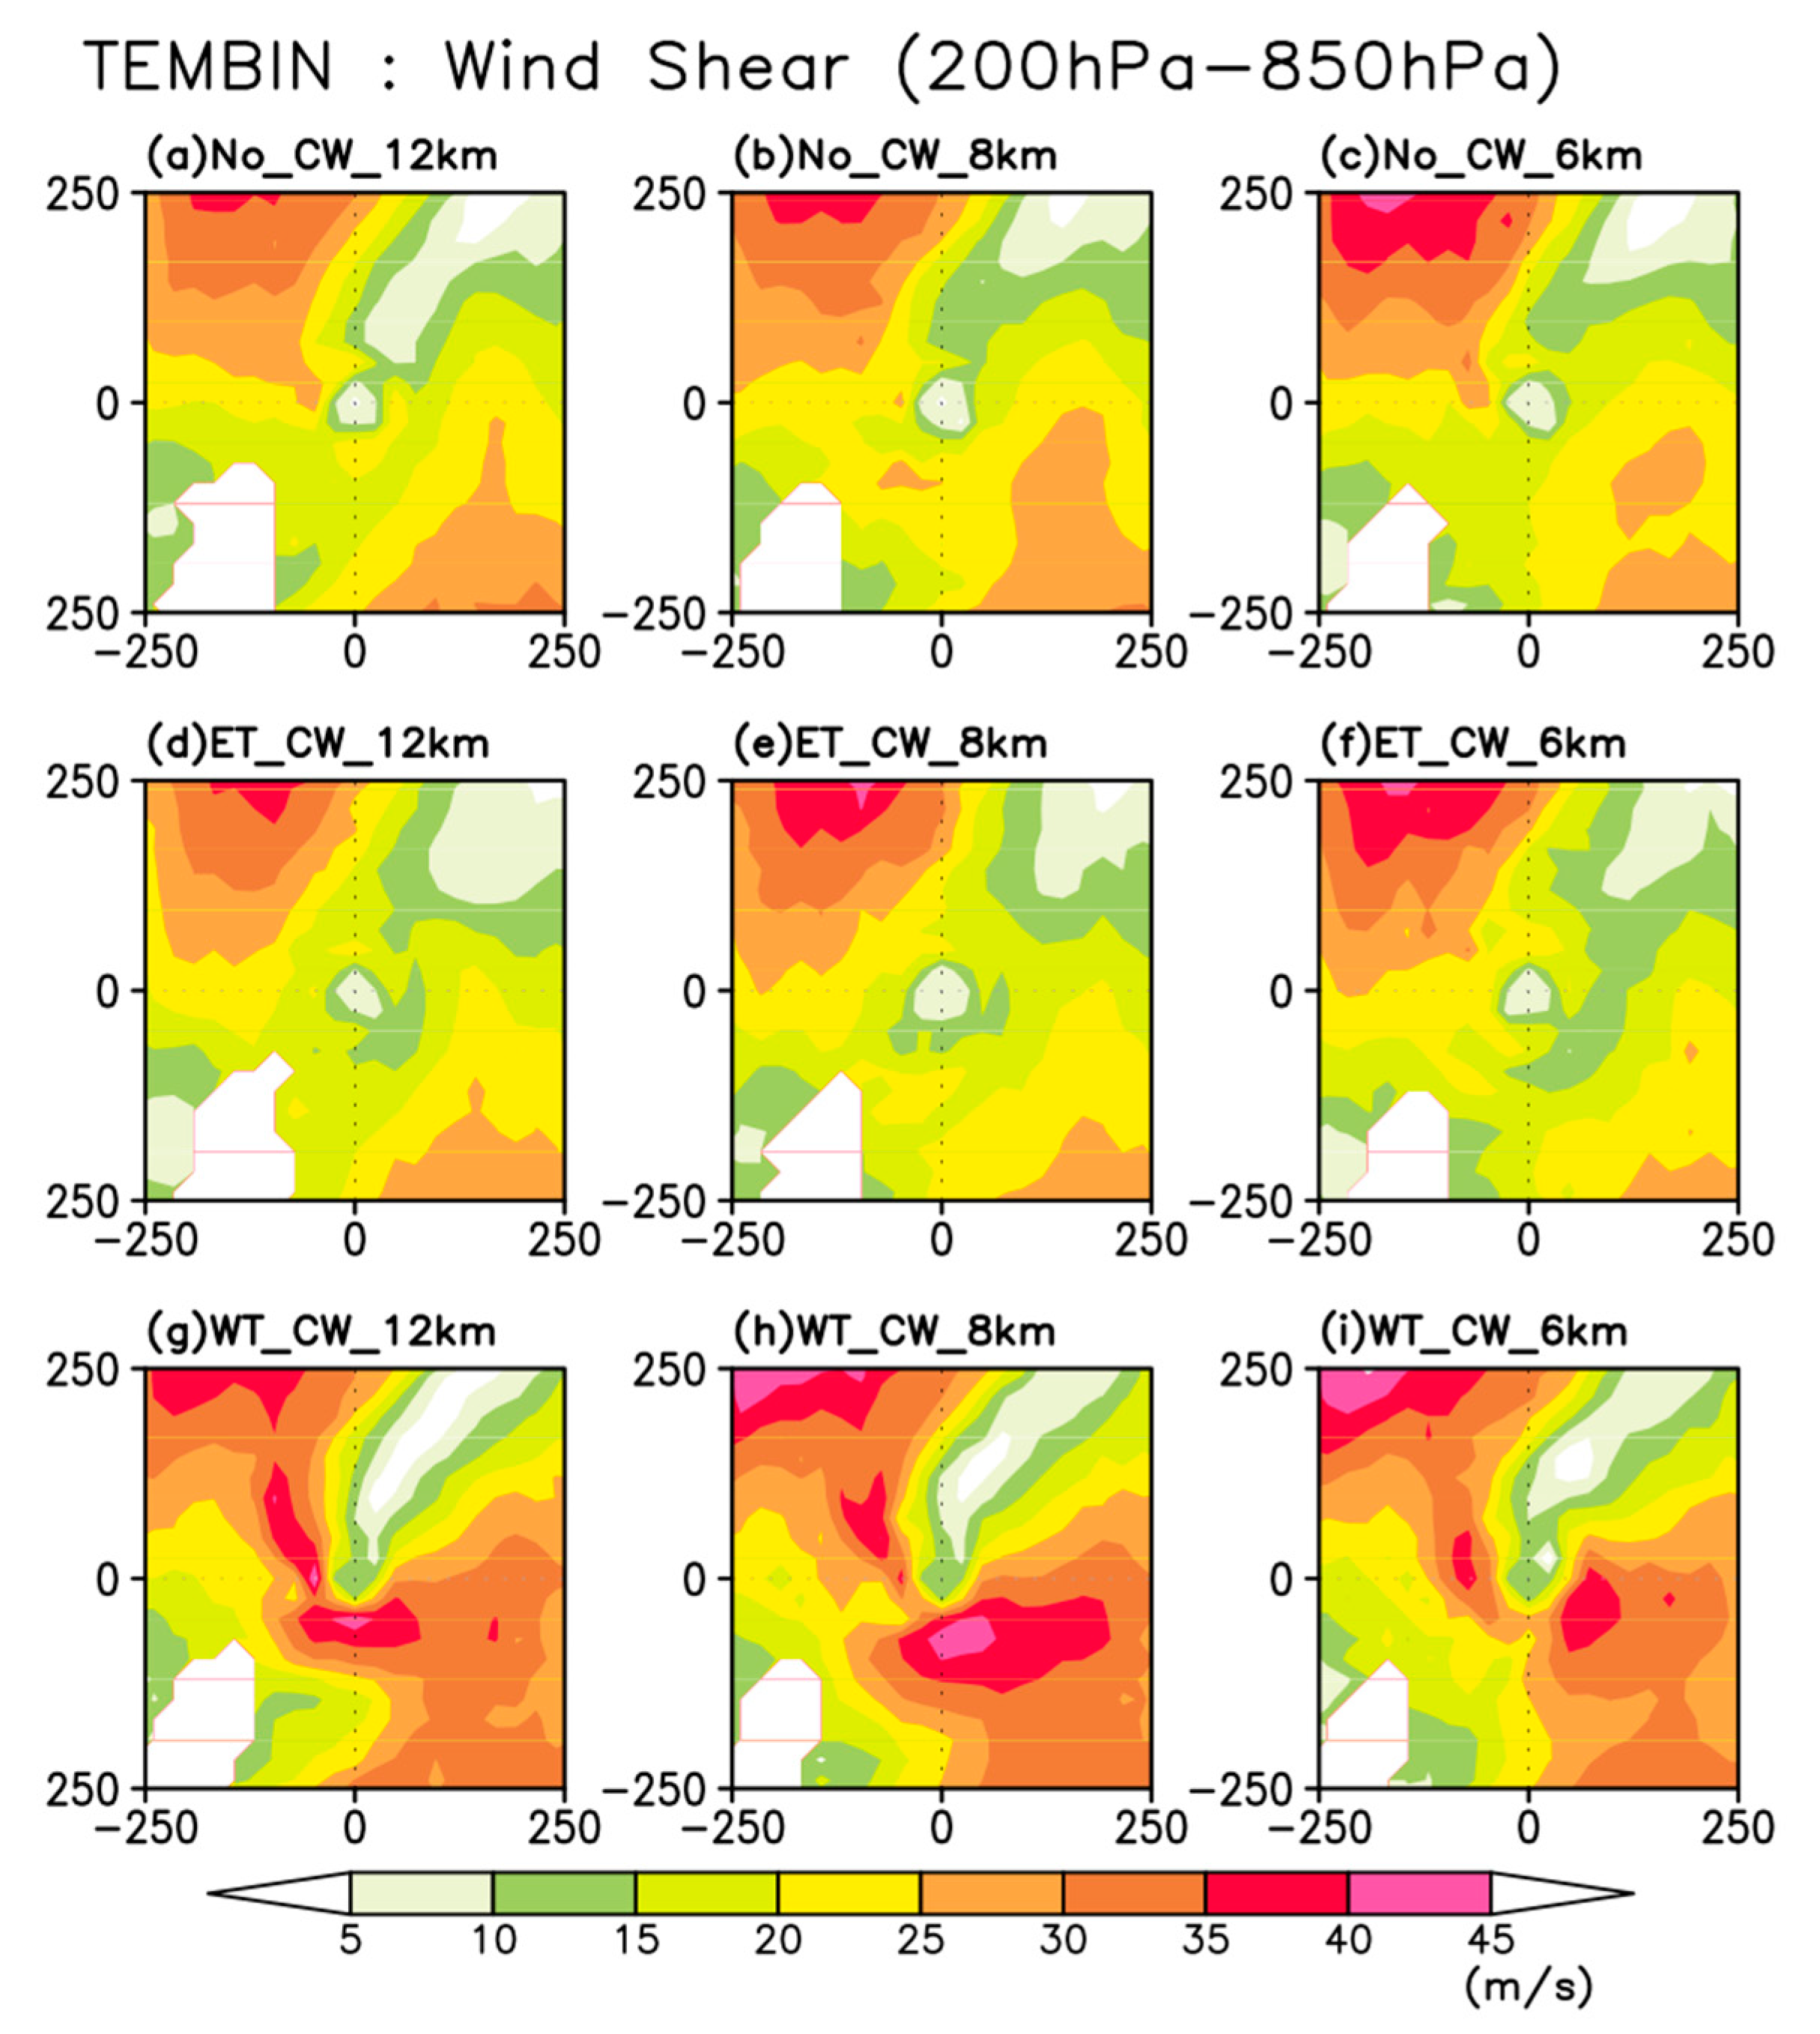
Figure 10.
The 12-h averaged latent heat flux in the inner region of TC (250 km × 250 km) over periods (48~60h) in (a) No_CW_12 km, (b) No_CW_8 km, (c) No_CW_6 km, (d) ET_CW_12 km, (e) ET_CW_8 km, (f) ET_CW_6 km, (g) WT_CW_12 km, (h) WT_CW_8 km and (i) WT_CW_6 km experiment of Typhoon Tembin.
Figure 10.
The 12-h averaged latent heat flux in the inner region of TC (250 km × 250 km) over periods (48~60h) in (a) No_CW_12 km, (b) No_CW_8 km, (c) No_CW_6 km, (d) ET_CW_12 km, (e) ET_CW_8 km, (f) ET_CW_6 km, (g) WT_CW_12 km, (h) WT_CW_8 km and (i) WT_CW_6 km experiment of Typhoon Tembin.
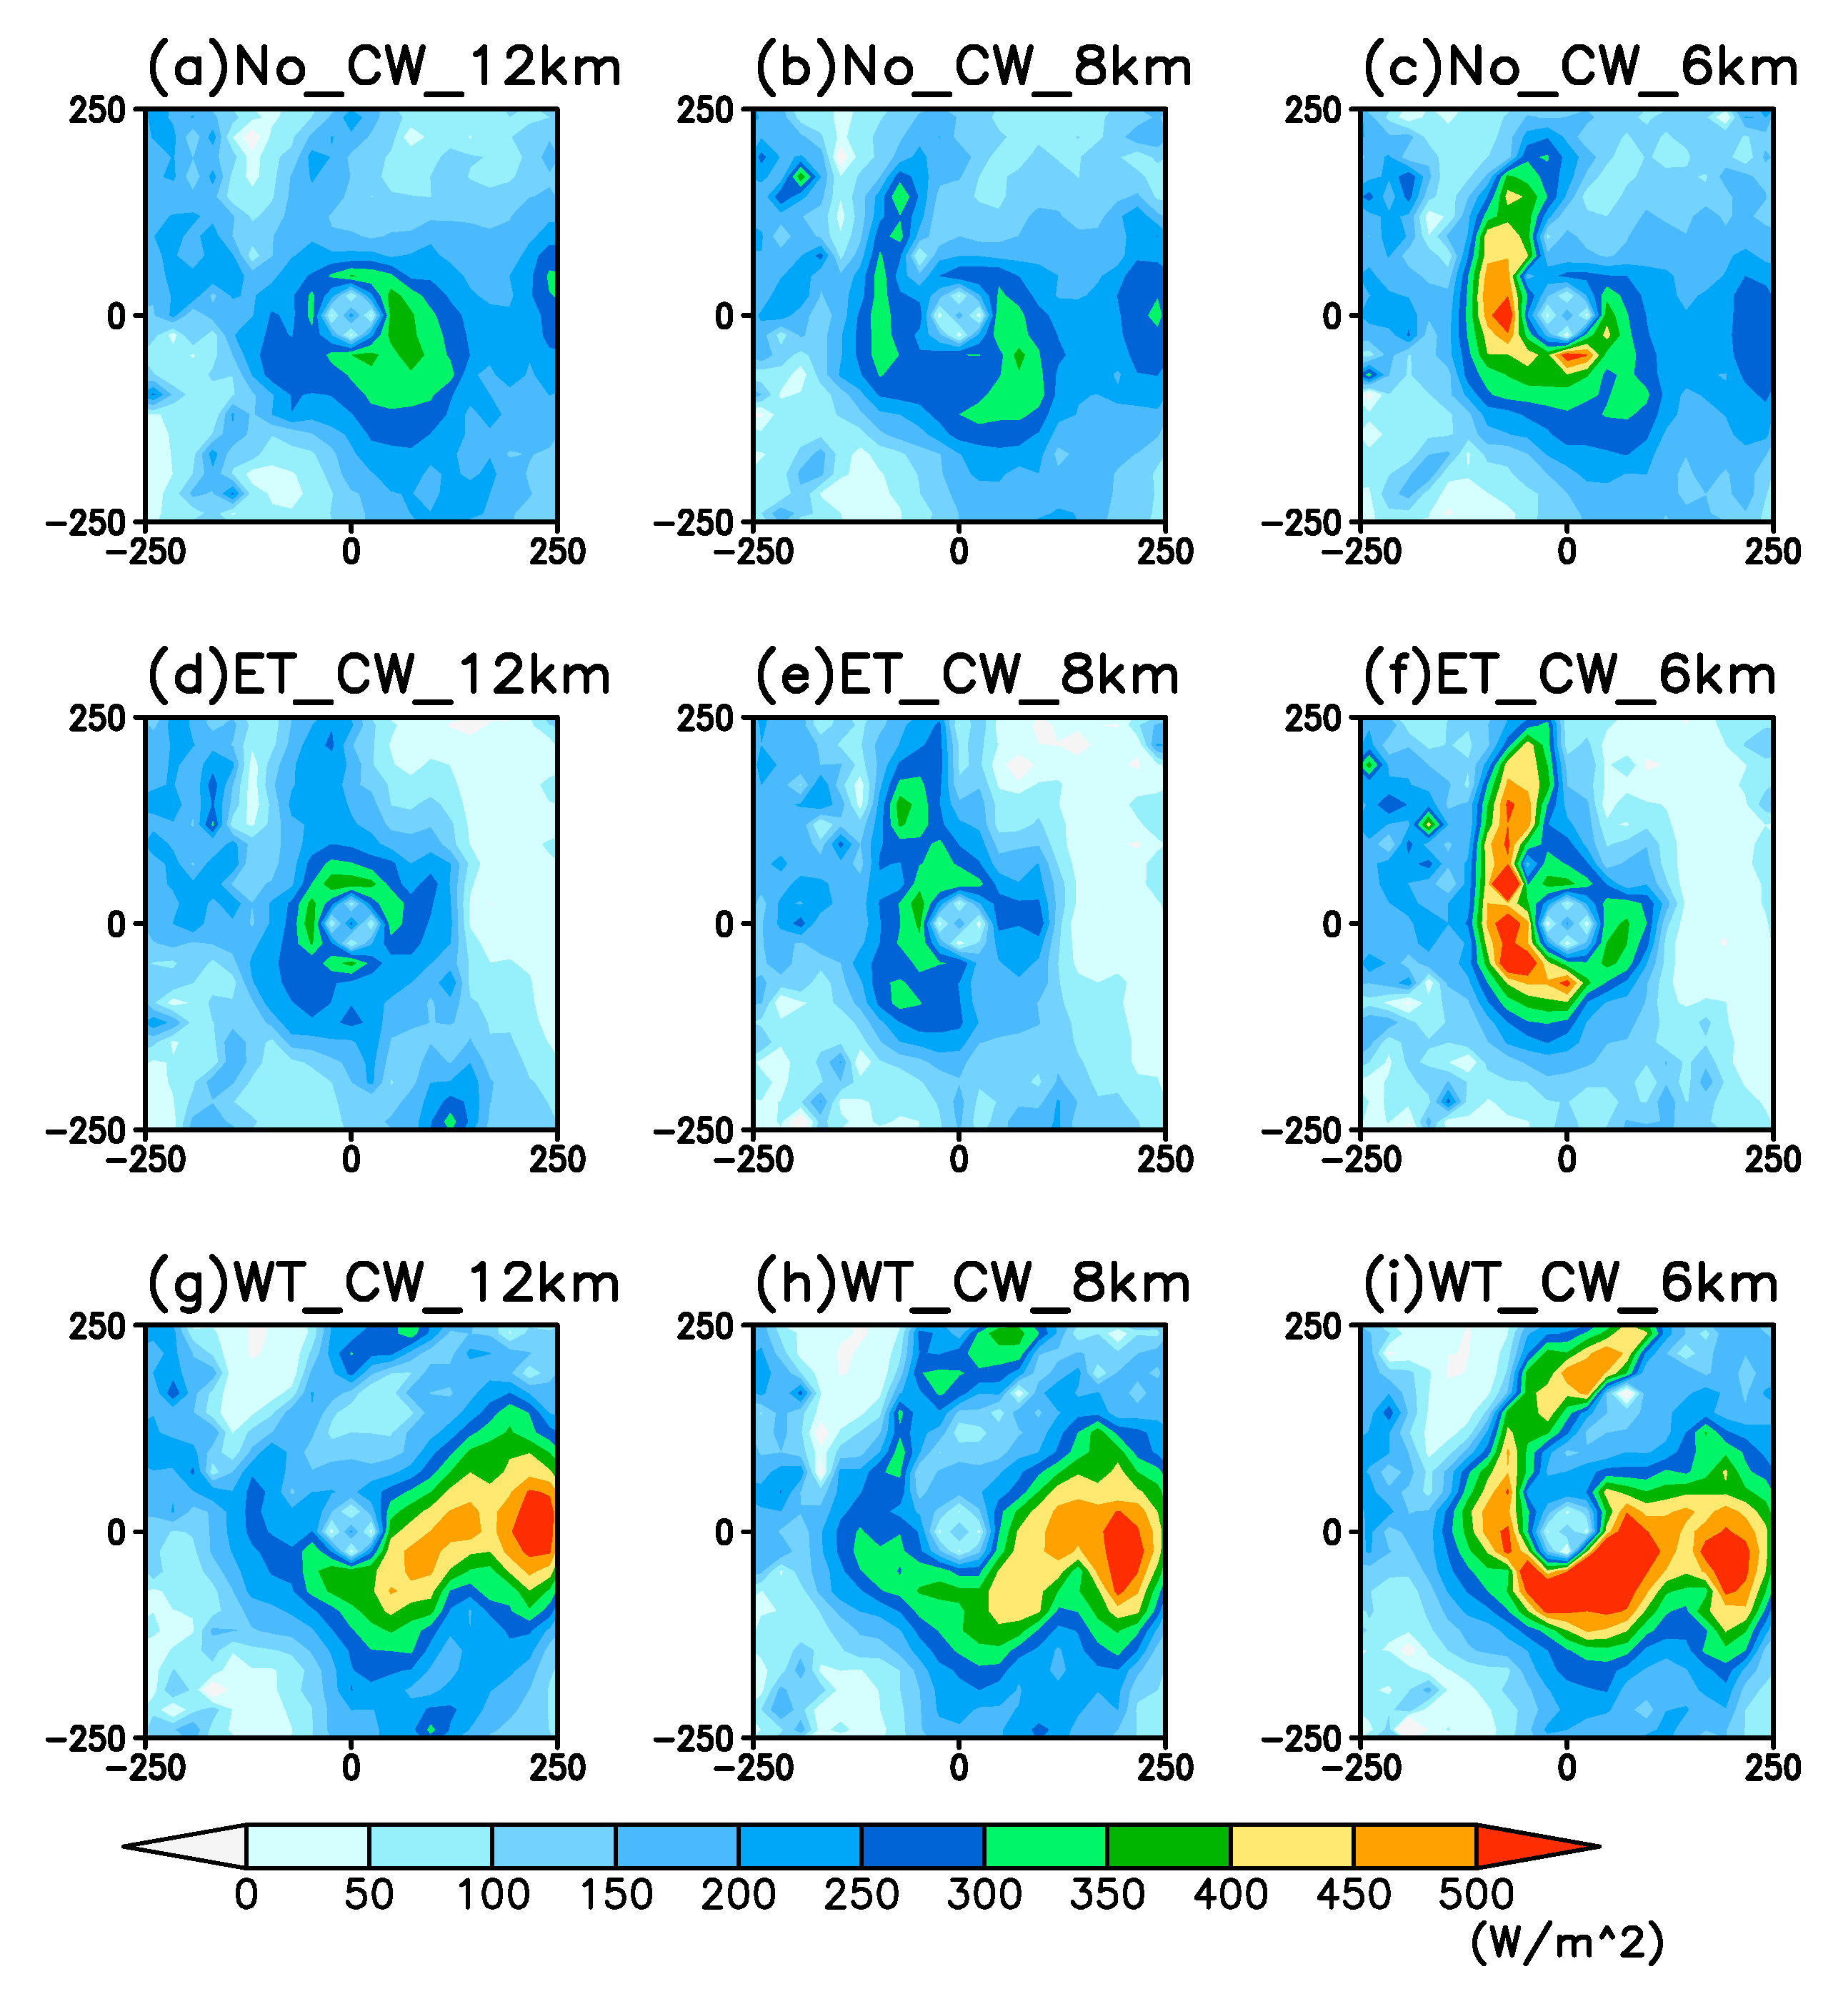
Figure 11.
The 12-h averaged CTT in the inner region of TC (250 km × 250 km) over periods (48~60 h) in (a) No_CW_12 km, (b) No_CW_8 km, (c) No_CW_6 km, (d) ET_CW_12 km, (e) ET_CW_8 km, (f) ET_CW_6 km, (g) WT_CW_12 km, (h) WT_CW_8 km and (i) WT_CW_6 km experiment of Typhoon Tembin.
Figure 11.
The 12-h averaged CTT in the inner region of TC (250 km × 250 km) over periods (48~60 h) in (a) No_CW_12 km, (b) No_CW_8 km, (c) No_CW_6 km, (d) ET_CW_12 km, (e) ET_CW_8 km, (f) ET_CW_6 km, (g) WT_CW_12 km, (h) WT_CW_8 km and (i) WT_CW_6 km experiment of Typhoon Tembin.
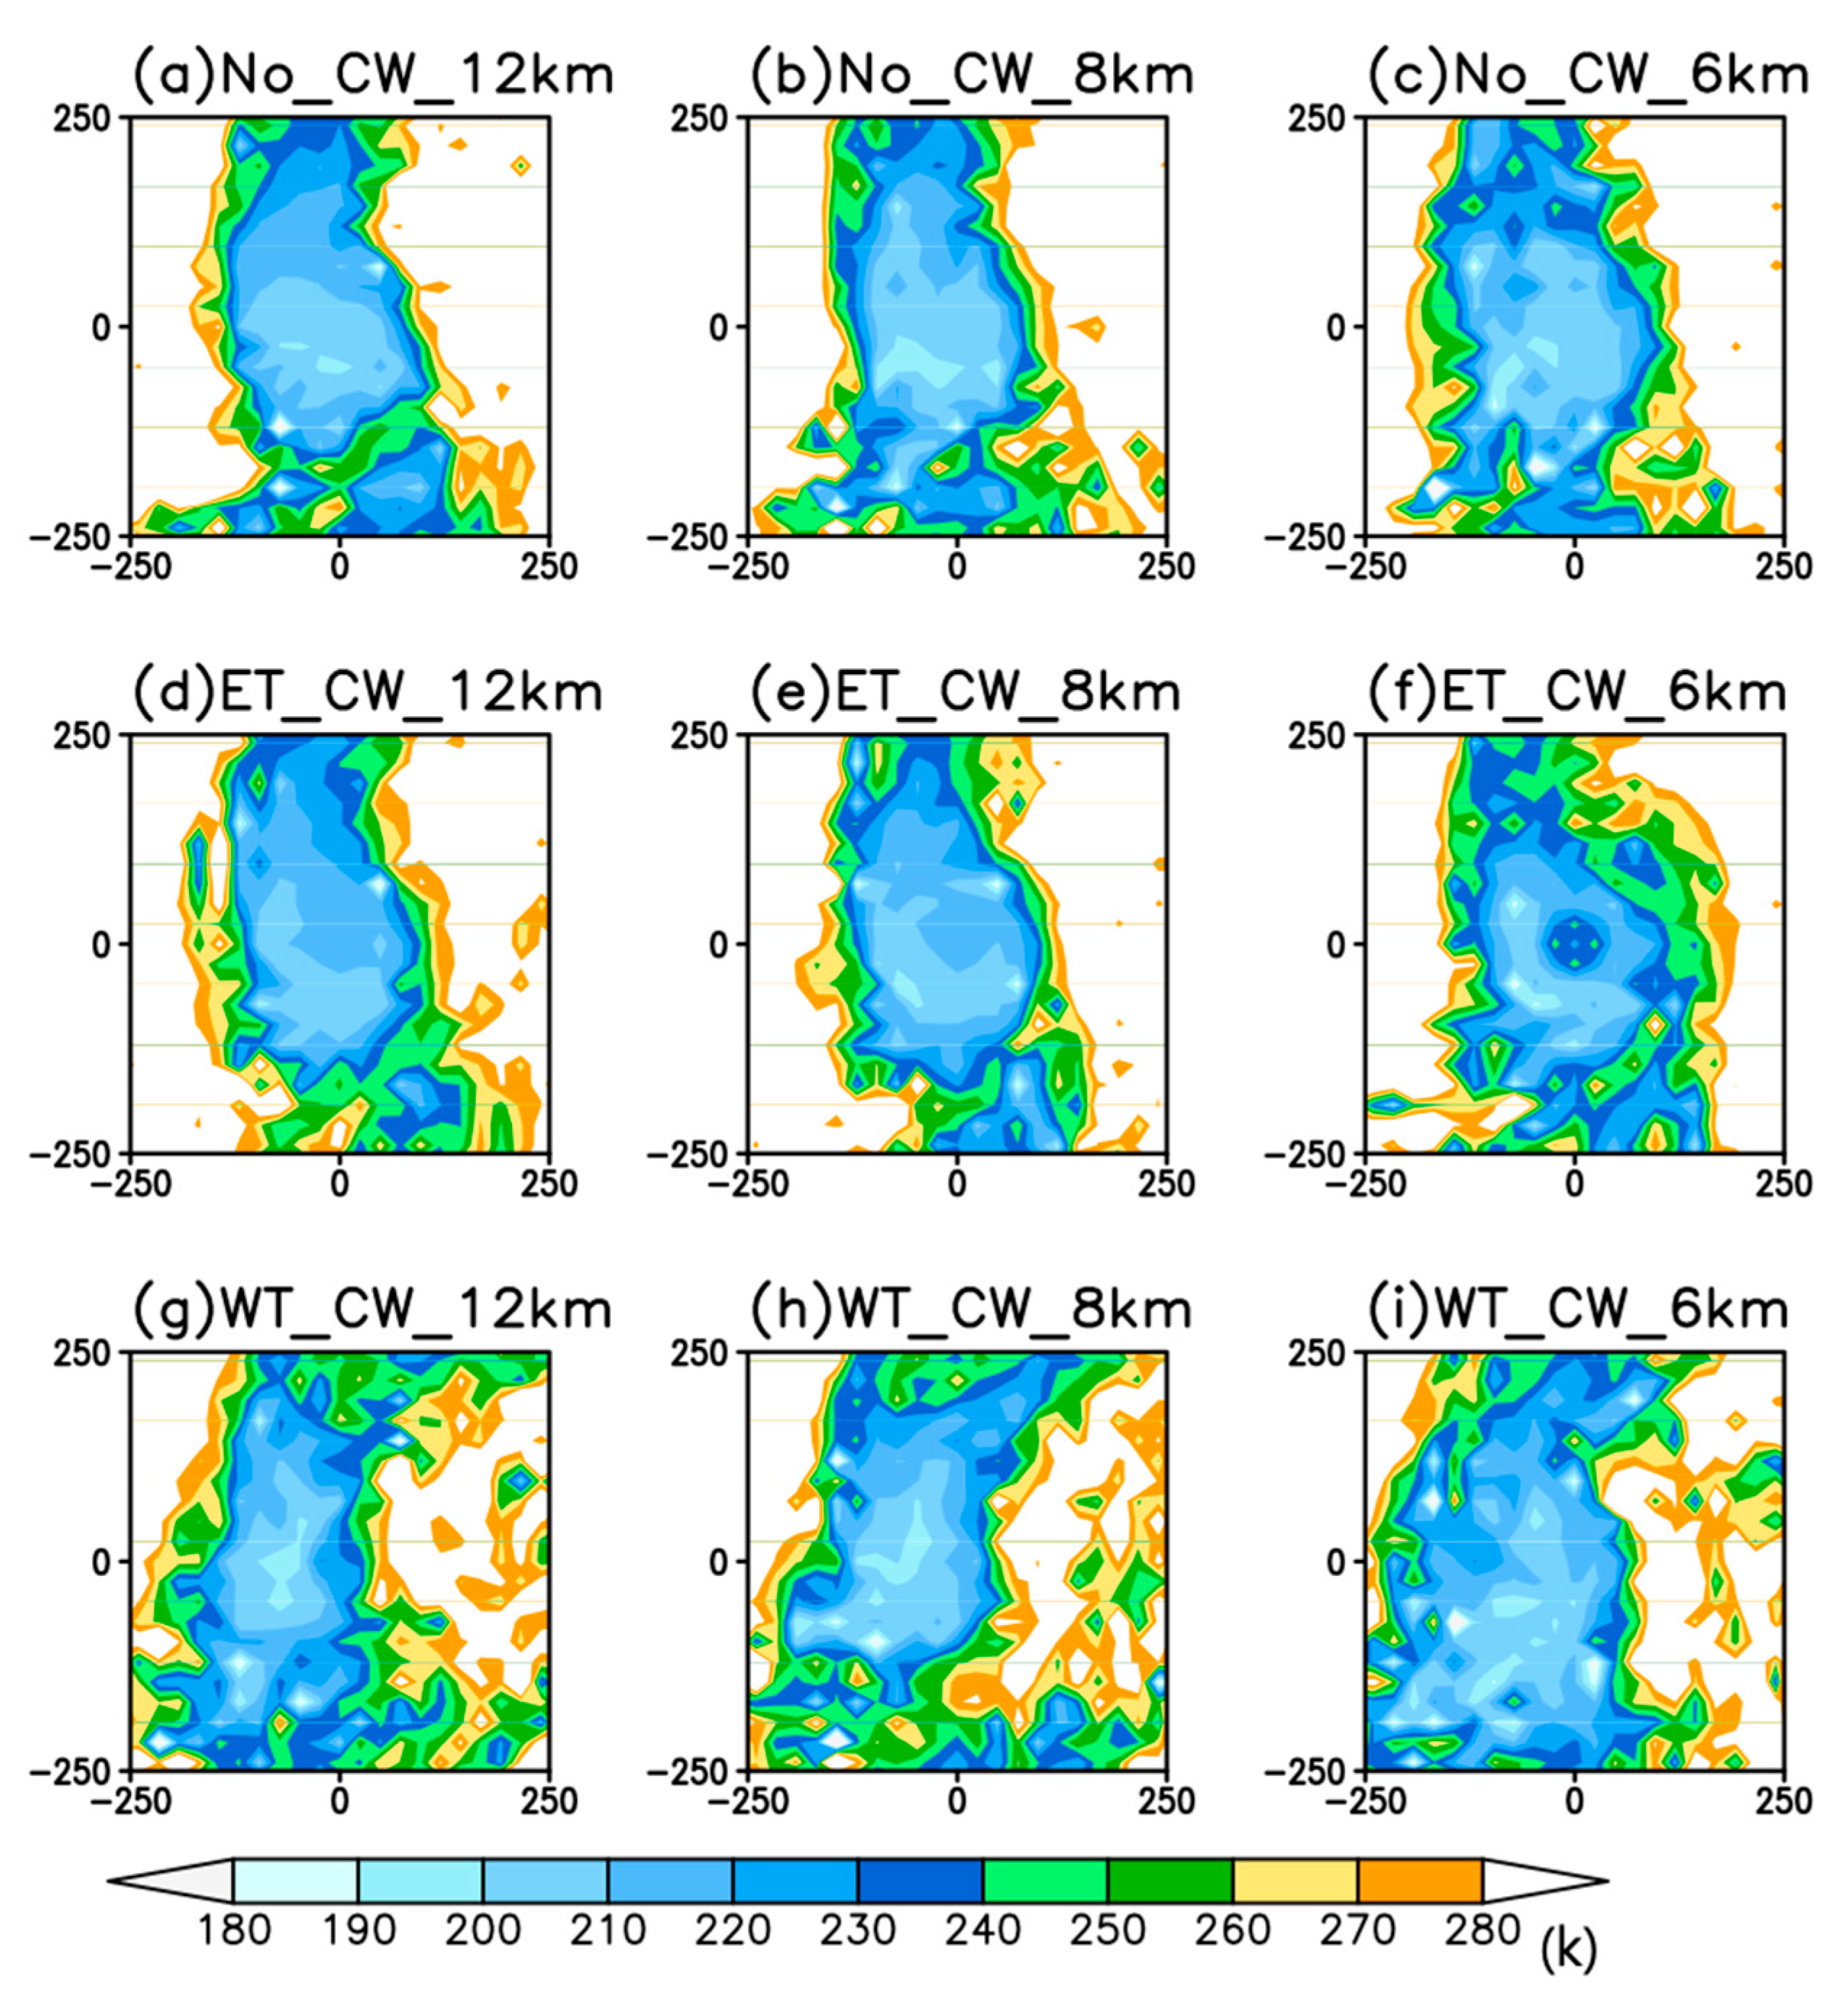
Figure 12.
Comparison of area-averaged precipitation rate from the center of TC to 500 km between (a) regional cold wake and Non-wake (b) higher resolution (8 km and 6 km) and 12 km. Blue (ET_CW) -solid: 12 km, dotted: 8 km, and hatched: 6 km same with red (WT_CW) and green (8 km)—solid: No_CW, dotted: ET_CW, and hatched: WT_CW same with orange (6 km) bar is the difference between each experiment and (a) No_CW and (b) 12 km.

Table 1.
The experimental design used in this study.
| SST | No_CW | ET_CW | WT_CW | |
|---|---|---|---|---|
| Res | ||||
| 12 km | Using 00 UTC 27 August SST : (No Cold Wake) ex) SST: No_CW, Res: 6 km, EXP: No_CW_6 km | : (Eastern region of Tembin Cold Wake) ex) SST: ET_CW, Res: 8 km, EXP: No_CW_8 km | : (Western region of Tembin Cold Wake) ex) SST: WT_CW, Res: 12 km, EXP: WT_CW_12 km | |
| 8 km | ||||
| 6 km | ||||
© 2019 by the authors. Licensee MDPI, Basel, Switzerland. This article is an open access article distributed under the terms and conditions of the Creative Commons Attribution (CC BY) license (http://creativecommons.org/licenses/by/4.0/).
Share and Cite
MDPI and ACS Style
Moon, M.; Ha, K.-J. Effect of Typhoon-Generated Cold Wake on the Subsequent Typhoon Tembin and Its Sensitivity to Horizontal Resolutions. Atmosphere 2019, 10, 644. https://doi.org/10.3390/atmos10110644
AMA Style
Moon M, Ha K-J. Effect of Typhoon-Generated Cold Wake on the Subsequent Typhoon Tembin and Its Sensitivity to Horizontal Resolutions. Atmosphere. 2019; 10(11):644. https://doi.org/10.3390/atmos10110644
Chicago/Turabian StyleMoon, Mincheol, and Kyung-Ja Ha. 2019. "Effect of Typhoon-Generated Cold Wake on the Subsequent Typhoon Tembin and Its Sensitivity to Horizontal Resolutions" Atmosphere 10, no. 11: 644. https://doi.org/10.3390/atmos10110644
Note that from the first issue of 2016, this journal uses article numbers instead of page numbers. See further details here.