Photooxidation of Emissions from Firewood and Pellet Combustion Using a Photochemical Chamber
by
Felipe Reyes
1, 
Yeanice Vasquez
1,
Ernesto Gramsch
2,
Pedro Oyola
1,
Bernhard Rappenglück
3 and
María A. Rubio
4,* 1
Mario Molina Center Chile, Santiago 7500494, Chile
2
Facultad de Ciencia, Departamento de Física, Universidad de Santiago de Chile, Santiago 9170124, Chile
3
Department of Earth and Atmospheric Science, University of Houston, Houston, TX 77204, USA
4
Facultad de Química y Biología, CEDENNA-Usach, Universidad de Santiago de Chile, Santiago 9170022, Chile
*
Author to whom correspondence should be addressed.
Atmosphere 2019, 10(10), 575; https://doi.org/10.3390/atmos10100575
Submission received: 14 August 2019
/
Revised: 4 September 2019
/
Accepted: 17 September 2019
/
Published: 24 September 2019
(This article belongs to the Section Aerosols)
Abstract
:The main emission source in Central and Southern Chilean cities is biomass combustion from residential heating and cooking due to old combustion technologies that are still widely utilized. In order to improve our understanding of biomass burning pollution and how it ages in the atmosphere, emissions from a pellet and wood stoves were studied with the aid of a photochemical chamber. Firewood combustion is an inefficient process that produces higher chamber loading of primary emission (gases and particles) compared to pellets. When these emissions are exposed to UV irradiation secondary particles are formed. However, with both fuels the secondary particle concentration was negligible with regards to the primary initial particle concentration. Observations show that when the initial mass is the same, firewood combustion emissions are more rapidly oxidized compared to emissions from pellet combustion. Particle aging evolution inside the chamber was evaluated using fragment tracer signals, via the mass fractions f44 vs f43 and f44 vs f60 triangles plots. For the same UV irradiation time, it was found that primary particles emitted form from firewood combustion show a slower aging rate compared to those emitted from pellet combustion, but this is due to high primary loading from wood combustion. Particle aging observed inside the chamber was similar to that found it in ambient urban air of Santiago de Chile in spring of 2011, indicating that chamber measurements can be a good indicator for some atmospheric processes. Levoglucosan, a well-known tracer for biomass combustion was also studied. It was found that wood stoves yielded higher levels than pellet stoves. This is due to the higher fuel combustion efficiency in pellet stoves, which yield low levoglucosan levels, making it difficult to use it for evaluation of the impact of pellet emissions on pollution.
1. Introduction
There is solid evidence that exposure to atmospheric particles has adverse effects on human health [1], even at concentrations below the air quality standard US [2]. Epidemiological studies have shown the association between exposure to atmospheric particulate matter (PM) and adverse health effects [3,4,5,6]. The adverse health effects depend on various simultaneous factors such as chemical composition, particle size, and exposure time. The final particle chemical composition depends on the type of emitting source and the atmospheric aging by photooxidation of gases and fine particles. Long term exposure to fine particles emitted in combustion constitutes a serious health risk because it has been shown that it causes mortality due to cardiopulmonary and pulmonary cancer [7]. Particulate matter of secondary origin plays an important role in the oxidative potential of an urban atmosphere and has an impact on health [8]. It has been shown that some components of PM have adverse results on health (elemental carbon (EC), Ni, V, Pb), and others show evidence that suggests effects on health (Al, Zn, and organic carbon (OC)) [9,10]. Apart from direct health impacts, primary particles emitted from wood combustion also have a clear climate warming effect [11].
Improving the knowledge of the chemical components of PM and its formation mechanism, from the emission sources to the final chemical composition after atmospheric photooxidation is fundamental for implementing reduction strategies.
The use of firewood for heating represents an important fraction of the energy consumed in Chile. About 25% of the total use of biomass energy has its origin in residential firewood combustion (RWC). In 2014 the consumption of biomass burning reached 24% of the gross consumption of primary energy [12]. It is accepted that RWC emits a substantial amount of particles and gases into the atmosphere, and it has been found that it contributes around 21% to the PM2.5 organics fraction in Santiago [13,14,15] and its contribution increased significantly in urban centers located to the south of Chile [16,17,18,19]. Most of these emissions come from small scale combustion equipment, some of them using outdated combustion technology. Only from 2012 new wood and pellet stoves of small scale must meet with a national emission standard. Besides, local authorities assign substantial economic resources to the replacement programs, in which old firewood heaters are replaced by new ones which are expected to have better combustion efficiency and lower particle emissions.
It is known that gas and particle emissions from biomass combustion depend on the characteristics of the heater (e.g., design, operating conditions, and amount of excess air) and on the type and condition of the fuel (for example, moisture content) [20]. Most of the particles formed during the burning process have an aerodynamic diameter of less than 1 µm, and they are formed by vaporization of the fuel, which later reaches a saturation state to form fine particles by nucleation. Later, the nucleated particles grow to a maximum of 1 µm by coagulation, agglomeration, condensation, and surface reactions. However, there are some particles generated in the combustion process which are larger. They are composed of pure refractory matter, mostly chars or ashes of species that cannot vaporize during the volatilization of the fuel. The particles emitted by combustion also include unburnt matter, like soot or organic particles, or noncombustible matter, such as ash particles consisting of inorganic components [21]. In the biomass combustion three phases can be identified. The first phase is ignition, in which the fuel is heated and dried with devolatilization of matter without the existence of a visible flame. Ignition is followed by a second phase, characterized by a strong flame where devolatilization, ignition, combustion of volatile compounds, and carbonization take place in the combustion chamber. The third phase, burning, is identified mainly by the combustion of char, and during this phase only small flames are visible, localized on the char particles [20]. Emission of anhydrous sugars increases considerably in the initial phase, when lower temperatures are registered, which are then reduced progressively until the flame phase [20,22,23].
The combustion of biomass also emits large amounts of gases and vapors, which can cause the formation of secondary particulate matter. In the presence of sunlight, the primary gases react with the atmospheric oxidants, ozone, hydroxyl, and peroxyl radicals. The inorganic gases turn into secondary inorganic aerosols (SIA) like ammonium nitrate (NH4NO3) and ammonium sulfate ([NH4]2SO4), while volatile organic compounds (VOC) turn into secondary organic aerosols (SOA) through photochemical reactions. The SOA are formed mainly by oxidation of VOC species with seven or more carbon atoms to yield products that then can partition between the gas and particle phases [24]. Still, current understanding of the formation of SOA is limited.
Photochemical chambers provide the opportunity to study the chemistry of the particles under well characterized aging conditions, pollutant concentrations, and type of fuel and combustion conditions. However, to our knowledge, there are only a limited number of studies on the transformation of biomass emissions under controlled conditions [25]. Reported on the physical and chemical evolution of the organic aerosols that burn biomass using the data of the aerosol mass spectrometer of field and chamber experiments. They found a large variability in the production of inorganic aerosols from plumes caused by burning biomass measured in field studies [26] performed smog chamber experiments with different kinds of firewood and found a highly variable production of secondary organic aerosols. Both studies reported that the photochemical transformation of organic particles was significant.
There is a predominant “static view” of the primary emission of particle concentrations in the atmosphere, which needs to be replaced by a “dynamic view” which includes the gas particle partitioning and the oxidation in the gaseous phase of low volatility vapors [27,28]. Most of the epidemiological studies consider the exposure of the population to aged particles; however, the particles in the air are a mixture of primary and secondary aerosols. Therefore, there is a knowledge gap related to how photooxidation in the atmosphere can alter the toxicological effects and how primary particles emitted from a specific source are photo oxidized to form secondary particles. The objective of this present work was to study the photochemical transformation of the combustion of biomass (pellets and firewood devices) under controlled conditions using a photochemical chamber, to evaluate the dependence of photooxidation on the fuel used, the composition, size, and yield of aerosols from each device.
2. Methods
2.1. Photochemical Chamber
The emissions of gases and particulate matter from the burning of biomass using pellets and domestic firewood were introduced into a smog chamber reactor. The design of the photochemistry chamber was based on previous photooxidation studies of coal fired electric power plant emissions from carbon [29,30] and photochemical aging of motor vehicle exhausts [31]. The reactor’s chamber was set up and all the biomass aging experiments were carried out in the facilities of the laboratory of the Centro de Control y Certificación de Vehículos (3CV), Ministerio de Transportes y Telecomunicaciones de Chile.
The design and manufacture of the chamber is described in detail elsewhere [32,33], and only general details are given here. The chamber is constructed of 127-μm-thick fluorinated ethylene propylene (FEP) Teflon film (Welch Fluorocarbon Inc., Dover, NH, USA), which allows UV-light transmission, and has a cube shape of 14 m3 that provides a relatively low surface (S) to volume (V) ratio of S/V = 2.5 m−1 to minimize particle wall-losses [34]. Because several previous studies have found significant losses [25,26,34] in photochemical chambers, an estimation of the particle losses is given in Section 3.2. The Teflon chamber was mounted inside a ventilated wooden enclosure that supports an array of ultraviolet (UV) lamps and protects researchers from UV light exposure. A total of 180 UVA-340 lamps (Q-Panel Lab Products, Miami, FL, USA) were mounted on three enclosure walls, spatially uniformly distributed. The UVA-340 lamps have a strong emission around 340 nm, providing an excellent simulation of the ground level solar spectrum between 295 nm and 365 nm [35] with a total power of 4.2 W/cm2 [33] This power represents a good solar mimic of Santiago summer midday (UV lamps power is only 12% lower than the solar UV-A power).
The chamber was cleaned overnight preceding each experiment, flushing it with air from a Clean Air System (CAS). CAS is a custom device designed by Harvard School Public Health, and consisted of four stages in series: A High-Efficiency Particulate Air (HEPA) filter (Whatman HEPA-CAP Venting Filter 6702-9500, Kingston, MA, USA) with 99.97% capture efficiency for particles larger than 0.3 μm, an activated carbon screen to eliminate volatile organic compounds (VOC), a basic substrate screen to eliminate acid gases and sulfur dioxide (SO2), and another HEPA filter to retain ultrafine particles (ULPA). The cleansing process was verified by measuring the concentration of NOx, CO, O3, and particles before each experiment, ensuring levels reached values close to instrument detection limits.
2.2. Firewood Domestic Appliances
The emission sources considered for this study were two small devices for burning biomass for heating purposes. One uses pellets (Model Memo, RIKA, Micheldorf, Austria) and the other firewood (Model KF 108-Primo, Wamsler, Ismaning, Germany) as fuel. The details of the combustion appliances are shown in Table 1. These heaters were chosen as they are widely used in the programs for the replacement of old devices in Chile due to their improved emission rates.
In the pellet stove, the burner is a cup connected to the fuel storage by a screw which supplies the fuel at a constant rate. As the screw rotates, pellets are transported from the bottom of the storage up to the end of the screw. Then, fuel falls through a tube to the burner cup, where the combustion takes places. The combustion begins by heating a resistance that is in contact with the fuel. Simultaneously, the flue combustion gases are removed from the stove by a fan. At the same time, ambient air enters the combustion cup through a tube that ends below the pellet storage on the rear side. The pellet device was always operated at maximum power (9 kW).
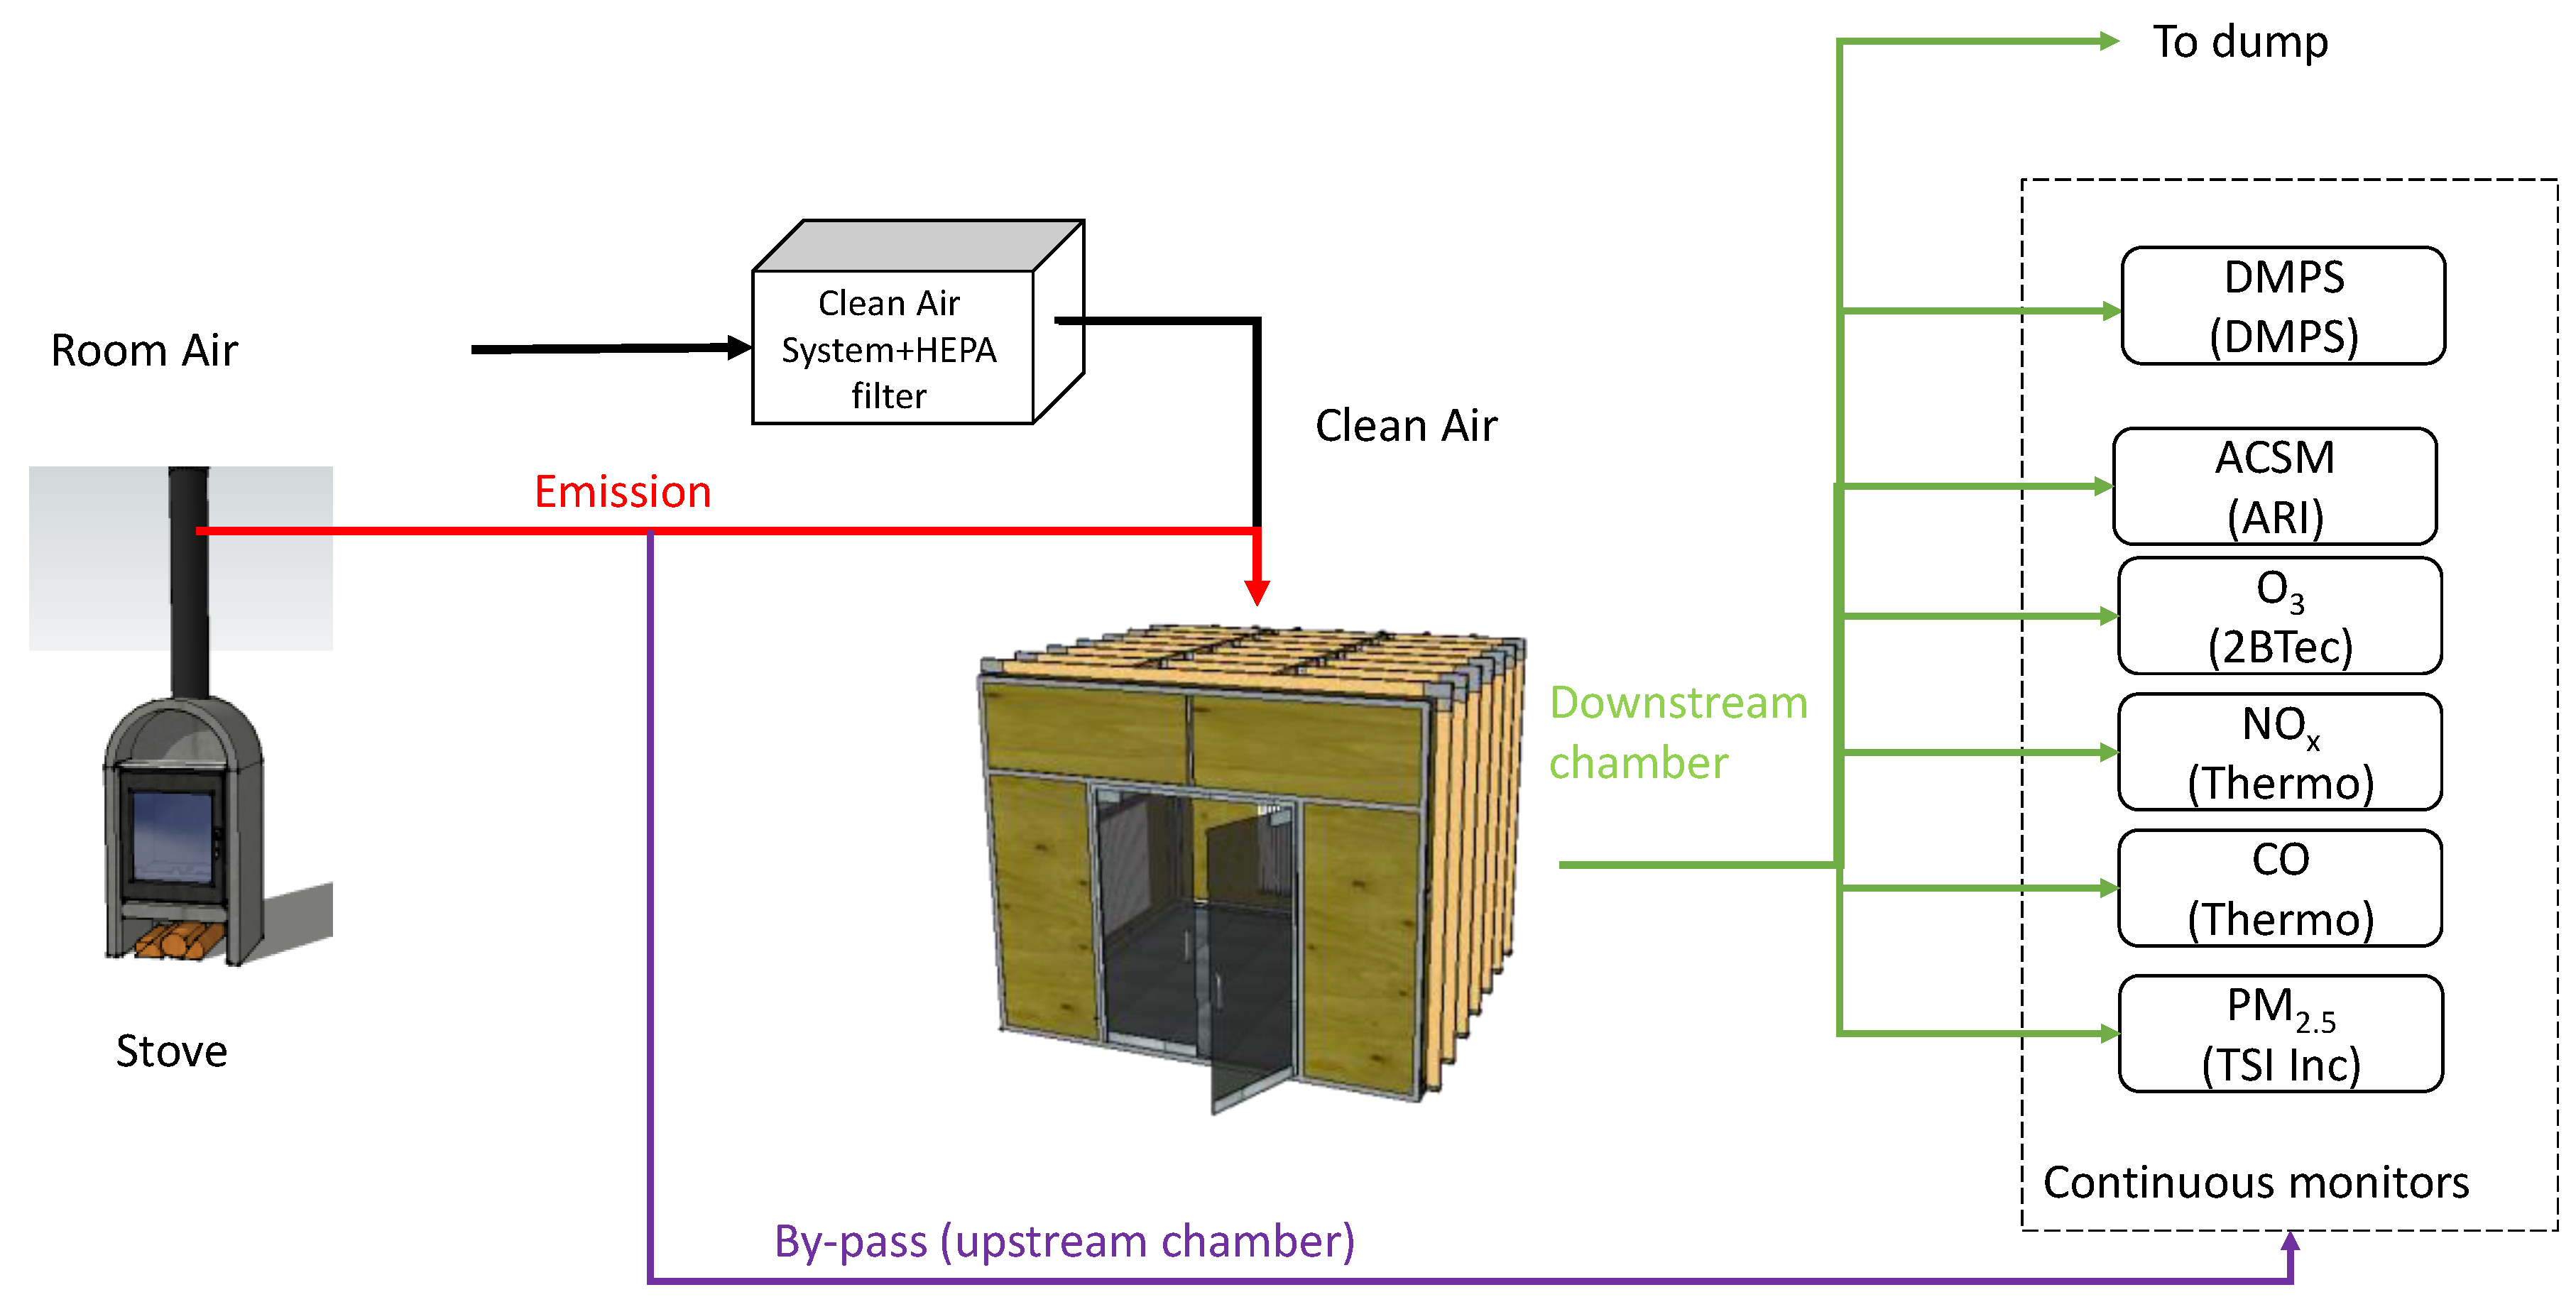
The firewood combustion heater was operated using the maximum boiler thermal power of 7 kW and at full load. The operator placed the fuel manually in a bed of the burner with approximately 20-cm logs. There is a single primary air supply that was controlled manually by means of a damper. The sizes of the openings determine the distribution of the air flow as well as of the movement of the fuel particles and the ash in the combustion bed. The combustion in this heater was started with a smaller ignition fire consisting of fine firewood parts. No fuel was added to the burner of the bed during the experiment. In each experiment samples of the primary emissions were taken through a 150-foot long and 2-inch thick static dissipative hose, directly from the heater to the reactor’s chamber (Figure 1). An aliquot of concentrated emission smoke was introduced in the photochemical chamber using an air blower at a constant rate.
2.3. Instrumentation
The wood stoves, the chamber and instruments were located in a laboratory of the Center for Vehicle Control and Certification (3CV). This Center is responsible for certification of all vehicle models entering the country [33]. Continuously measuring monitors were used (Table 2) to measure the emitted gases and aerosols. An aerosol chemical speciation monitor (ACSM) was used to measure non refractory aerosols like nitrates, sulfates, ammonia, chlorides, and organic compounds in real time [36].
A differential mobility particle sizer (DMPS) with an electrostatic classifier (model 3934, TSI, Shoreview, MN, USA) was used to monitor the size distribution of the particles. A differential mobility analyzer (DMA, model 3081, TSI) coupled to a water-based condensation particle counter (CPC, model 3785, TSI) was used to obtain the number of particles.
Monitors were installed in the chamber in two ways, upstream and downstream the chamber. This configuration allows to measure emission while the chamber is filling (upstream the chamber) or measure the outflow from the chamber during the UV irradiation (downstream the chamber). In the experiments with UV irradiation, ozone concentration was measured with an ozone monitor (model 202, 2BTEC, Boulder, CO, USA) and NO/NO2/NOx concentrations were determined by a Thermo, model 42i instrument. The temperature of the chamber and the relative humidity were measured by a temperature/relative humidity sensor (model HMD70Y, Vaisala, Helsinki, Finland). CO was monitored by infrared absorption (Analyzer Model 48; Thermo Scientific, Franklin, MA, USA).
The experimental design used is shown schematically in Figure 1. The typical experimental protocol was the following:
- Flushing the chamber with clean air overnight at a rate of 300 Liter/Minute (Lpm). During this period, chamber volume was replaced more than 20 times.
- Combustion ignition in the stove
- Injection of a concentrated aliquot of biomass emission into the chamber at a rate of 10 Lpm
- Stop emission filling and measuring air pollutants with UV lights OFF
- UV Lights ON and measuring air pollutants.
In some experiments the injection of aliquots into the chamber took place only with primary gases. For this purpose, an HEPA filter (Whatman 6702-9500 with 99.97% efficiency) was installed in the chamber during the injection step. To ensure chamber atmosphere free of combustion particles, continuous particles measurements was always carried, reaching values close to instrument detection limits. Another set of experiments were made by injecting primary particles and gases. Injecting aliquots always took place ensuring that the combustion was in the flame phase.
Here, experiments were classified as Unfiltered Emissions corresponding to emissions of gases and particles, while Filtered Emissions correspond to emissions of combustion gases only, after removing the PM.
3. Results and Discussion
3.1. UV-A Irradiation of the Filtered Emissions
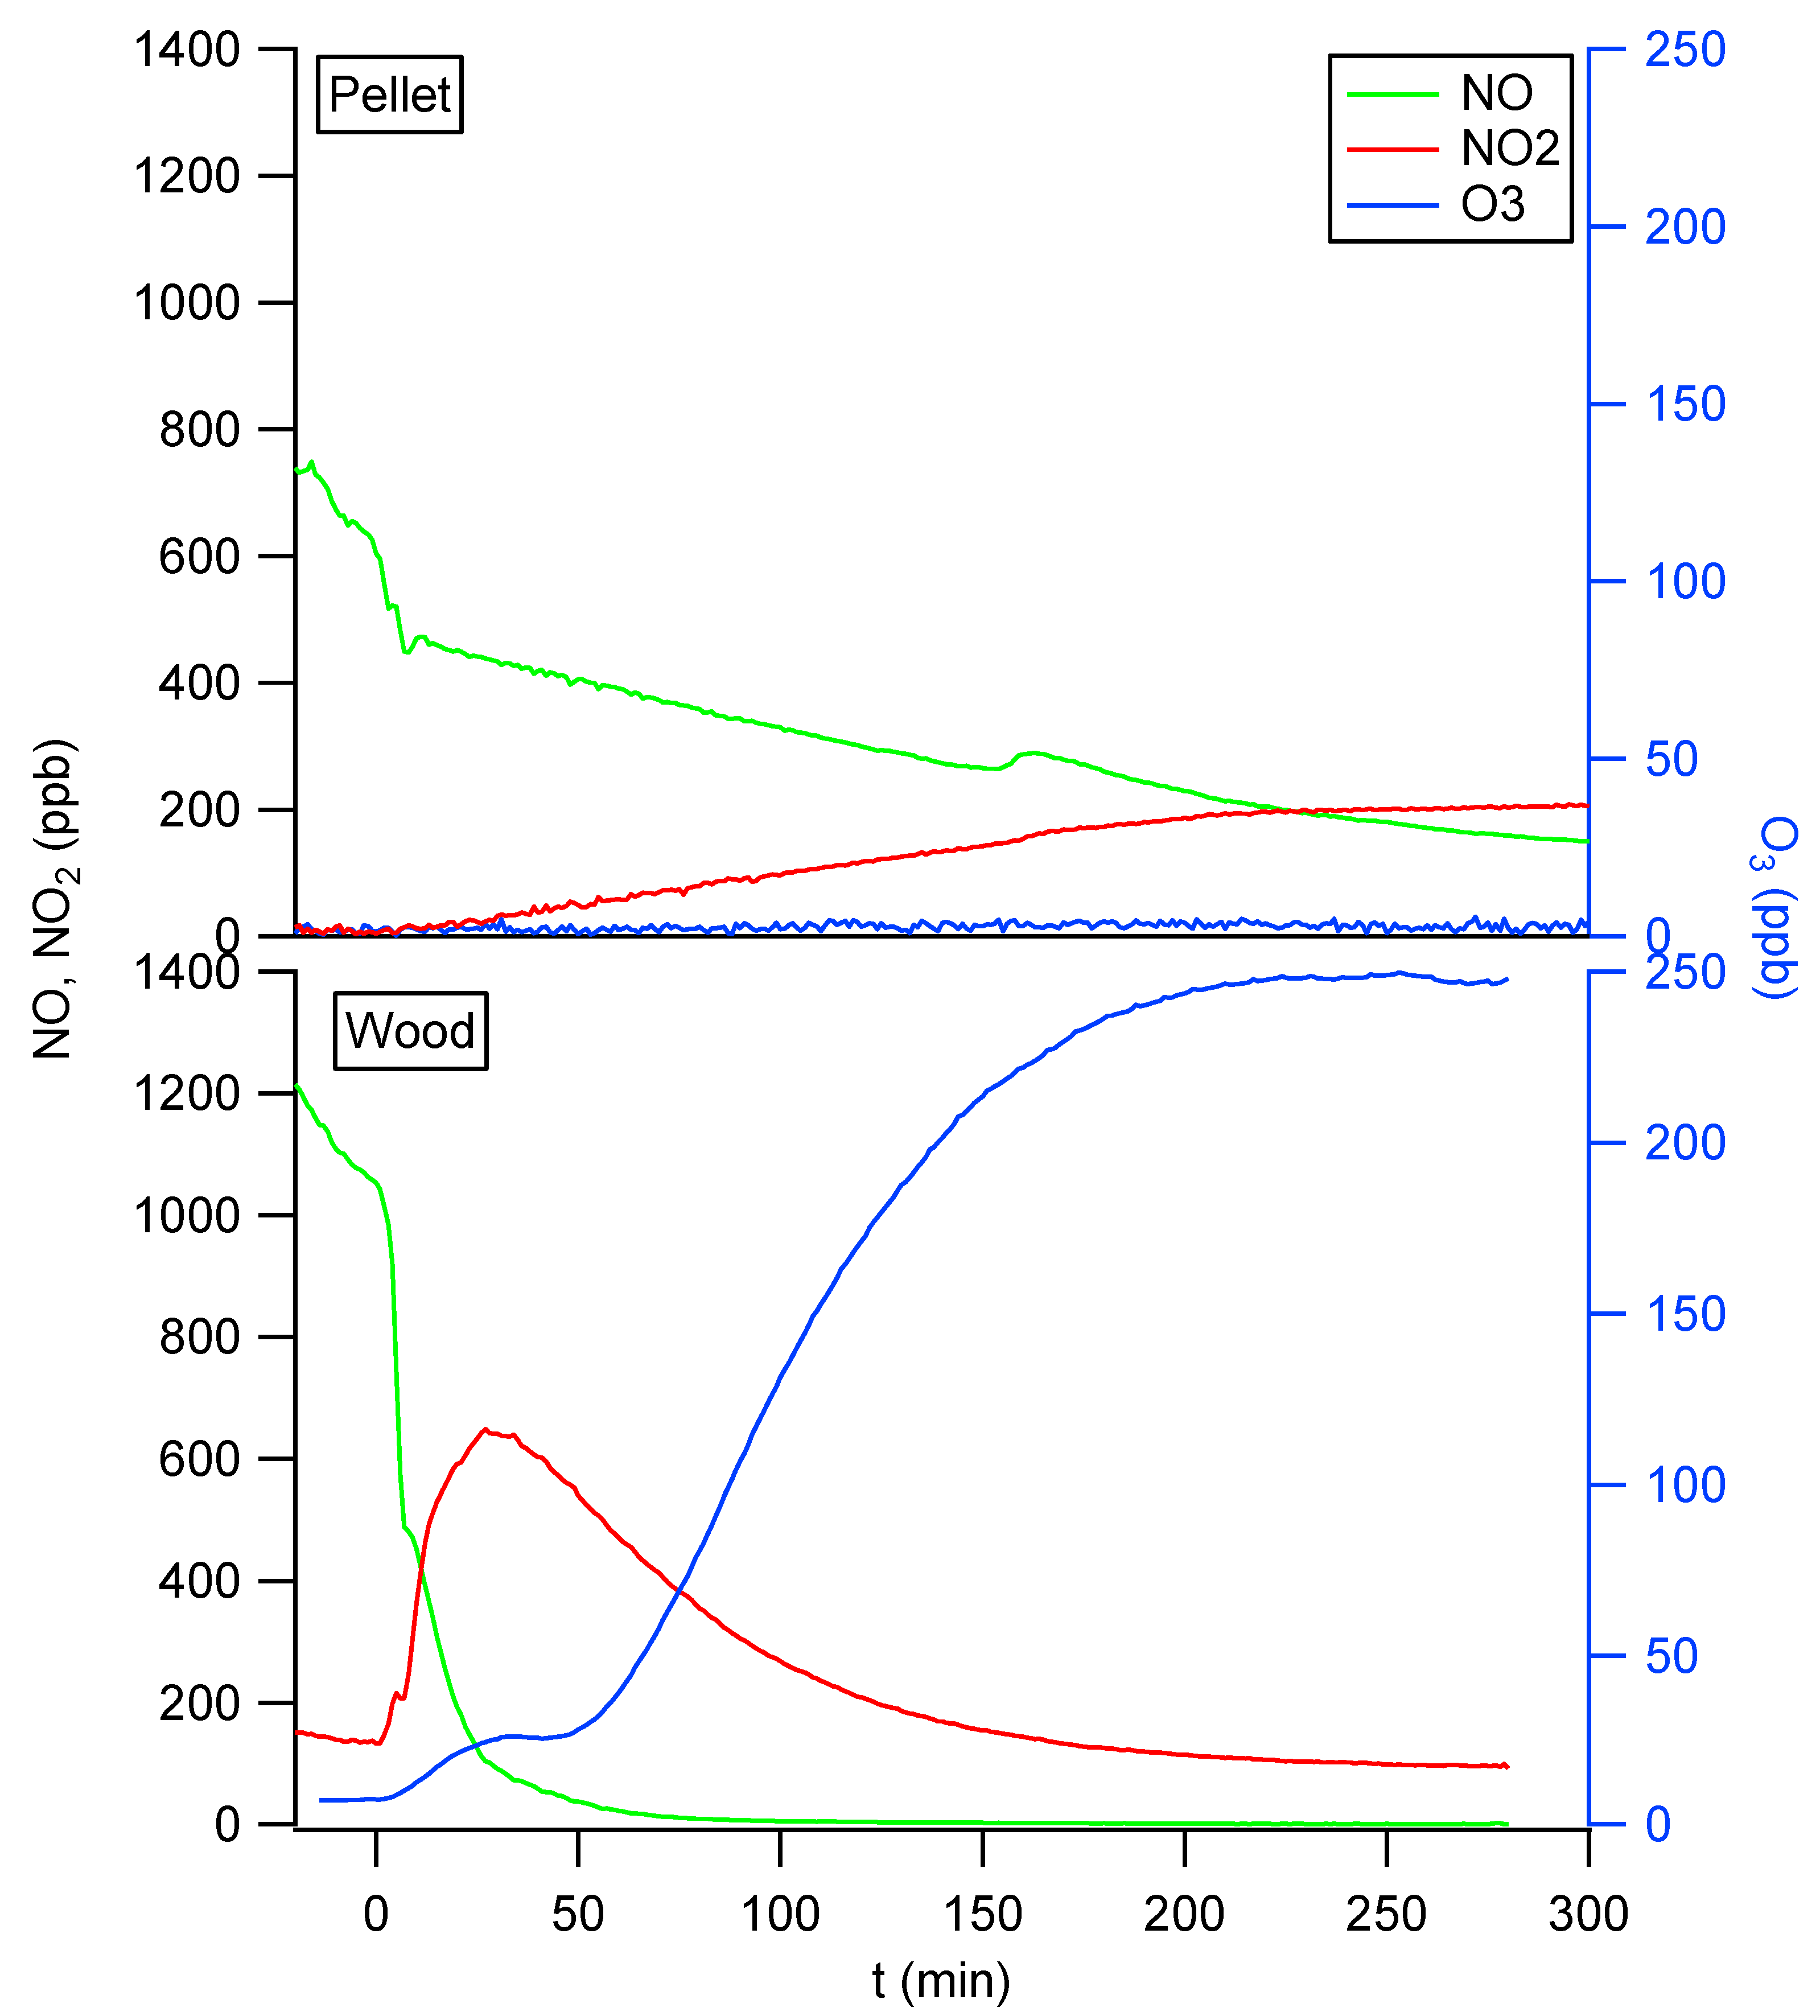
As mentioned previously, the chamber was flushed overnight with clean air prior each emission to make sure concentrations levels of particles, O3, NOx, and CO were close to the detection limit of each instrument. Then individual experiments were performed with each fuel, pellet and firewood. Figure 2 shows the evolution of the concentrations of NO, NO2, and O3 during the irradiation time (t = 0 is the initial UV irradiation time). For t < 0 the chamber was being filled with the heater’s emissions. The initial concentration of NO emitted during the combustion of pellets was lower by almost a factor of two than those emitted during the emission from firewood burning. This may be because NOx emissions in the combustion of biomass is more related to the nitrogen content of the fuel than to the combustion temperature [21,37]. The emission factor for NOx reported in Table 1 was quite close for both heaters, with averages of 83 and 63 mg/MJ for pellet and firewood heaters, respectively. In Gramsch et al., 2018 [33] there is a summary of the photochemical reactions in this chamber. In brief, the photolysis of HONO and HCHO emitted during the combustion of biomass starts a chain reaction that produces the OH radical. According to the spectra of the UV lamps, both species can be photolyzed rapidly in the chamber, and then the OH reacts with the primary organic gases (HR) to form peroxyl radicals (RO2) which then react with NO to form NO2, recovering the OH radical. The NO2 formed is also photolyzed by the UV lamps which produces O3 and NO. However, the NO is consumed rapidly by O3 again [24].
In the chamber there is an additional route for the consumption/production of ozone by photolysis of O3. The UV lamps provide some energy at short wavelengths, which can photolyze O3 to produce O(1D) in the chamber, this in turn reacts with H2O producing OH. The OH radical can follow a reaction chain similar to that presented above, oxidizing organic gases (RH) and NOx to produce O3. However, in the chamber it is expected that the photolysis of O3 will be less important compared to the reaction with NO2 because the UV lamps provide only a small amount of energy in the spectrum of O3.
The consumption profiles of NOx and the production of O3 are shown in Figure 2. NO is consumed, NO2 is produced, and then O3 is generated. The profiles obtained for the firewood and pellet emissions show a great difference. In the case of firewood there is a rapid decrease of NO concentration, and in less than 80 min of UV irradiation the NO is exhausted in the chamber (Figure 2). For the emissions from pellets, the consumption of NO is significantly slower, and after 300 min of UV irradiation there are still more than 50 ppb of NO in the chamber. In the profiles using firewood, the concentration of NO2 reaches its maximum level at 35–40 min of UV irradiation, while in the pellets case the NO2 levels kept growing during the experiment and slightly surpassed those of the firewood case close to the end of the experiment.
The production of O3 was found only in the irradiation of the emissions from the heaters with firewood, which reached a maximum of 200–280 ppb in 200 min, while in the experiments with pellets no O3 increase was found. Initial O3 concentration (prior to turning UV lights on) was zero concentration. After ~280 min of UV irradiation, only wood filtered emission experiment shown an increase of O3, reaching around 250 ppb. These results indicate that the gases emitted by pellets show a photochemical activity rate significantly slower than that of the gases emitted by firewood. This behavior may be due to the lower emission rate of volatile organic compounds (VOC) in the pellets heater, probably due to the improved combustion technology. Unfortunately, this study did not include measurements of volatile organic compounds. However, we can use the initial CO concentration as an indicator of the combustion efficiency. When CO and VOC emission are coming from the same condition (incomplete combustion) both have emission rates more or less correlated. In fact, in Reference [38] is shown that when both VOC and CO are coming from the same source, a good correlation between them can be found. In Reference [39] there is also strong evidence that newer improved devices makes combustion process more efficiency and then VOC and CO decreased. In hour experiments, the CO levels achieved after the filling process were 4 ppm for pellets and 80 ppm for firewood, which means that there is an 18 times higher factor for emissions from firewood compared to the experiments with pellets. Table 1 shows that the emissions of hydrocarbons reported for the CnHn parameter are lower in pellets than in firewood because organic compounds are burned more efficiently in the pellet heater. Reference [20] found that the total emission of CO and hydrocarbons achieved in the firewood combustion heaters shows a similar behavior and that the higher emissions are associated with lower combustion efficiency. Therefore, here we have assumed that the initial CO concentration in the chamber can be used as a qualitative measure of the VOC in the chamber, and it can be expected that the firewood heater will inject more VOC than the pellets. Moreover, the volatilization process is less extended in the pellet heater combustion because it has fewer volatile components and less humidity compared to the combustion of firewood.
In the chamber, VOC and NOx compete for the OH radical. In the emission from pellets the NO2-OH reaction prevails over the VOC-OH reaction due to the slight abundance of VOC from the combustion emission [24]. Since the NO2-OH reaction eliminates the OH radical from the oxidation cycle of reactive VOC, it can be expected that the production of O3 will be limited. Low O3 production can be seen in Figure 2 for the pellet stove. On the other hand, the experiment with firewood must create an abundant VOC scenario, so the VOC-OH reaction prevails and the photolysis of the intermediate products generated by the OH-VOC reaction produces new radicals [24], speeding up the production of O3, as seen in Figure 2, and subsequent production of O3 due to a higher NO2/NO ratio compared to the pellet case which leads to a lower removal mechanism for O3 through titration at the same time. We did not measure peroxy acylnitrates (PANs) during our chamber experiments. However, it is very likely that in the firewood experiment also PANs would be formed since wood burning provides an abundance VOCs [40], which could serve as precursors for PANs, including direct precursors such as acetaldehyde, acetone, and propanal. At constant ambient temperature (as it was the case in the chamber experiments) the atmospheric lifetime of PAN would increase with increasing NO2/NO ratio [41] or rather increasing O3 concentrations [42]. The formation of PANs would remove NO2 from the system. Together with wall losses of NO2 both processes would cause a decrease in NO2 concentration. This in turn would eventually slow down O3 production, as can be seen in Figure 2 after 100 min of irradiation time, albeit at very high O3 levels. It should be mentioned here that appreciable amounts of peroxacetyl nitrate (PAN) was found in the air of Santiago de Chile previously [43,44]. Those measurements did not include other PAN compounds.
3.2. Secondary Particle Formation
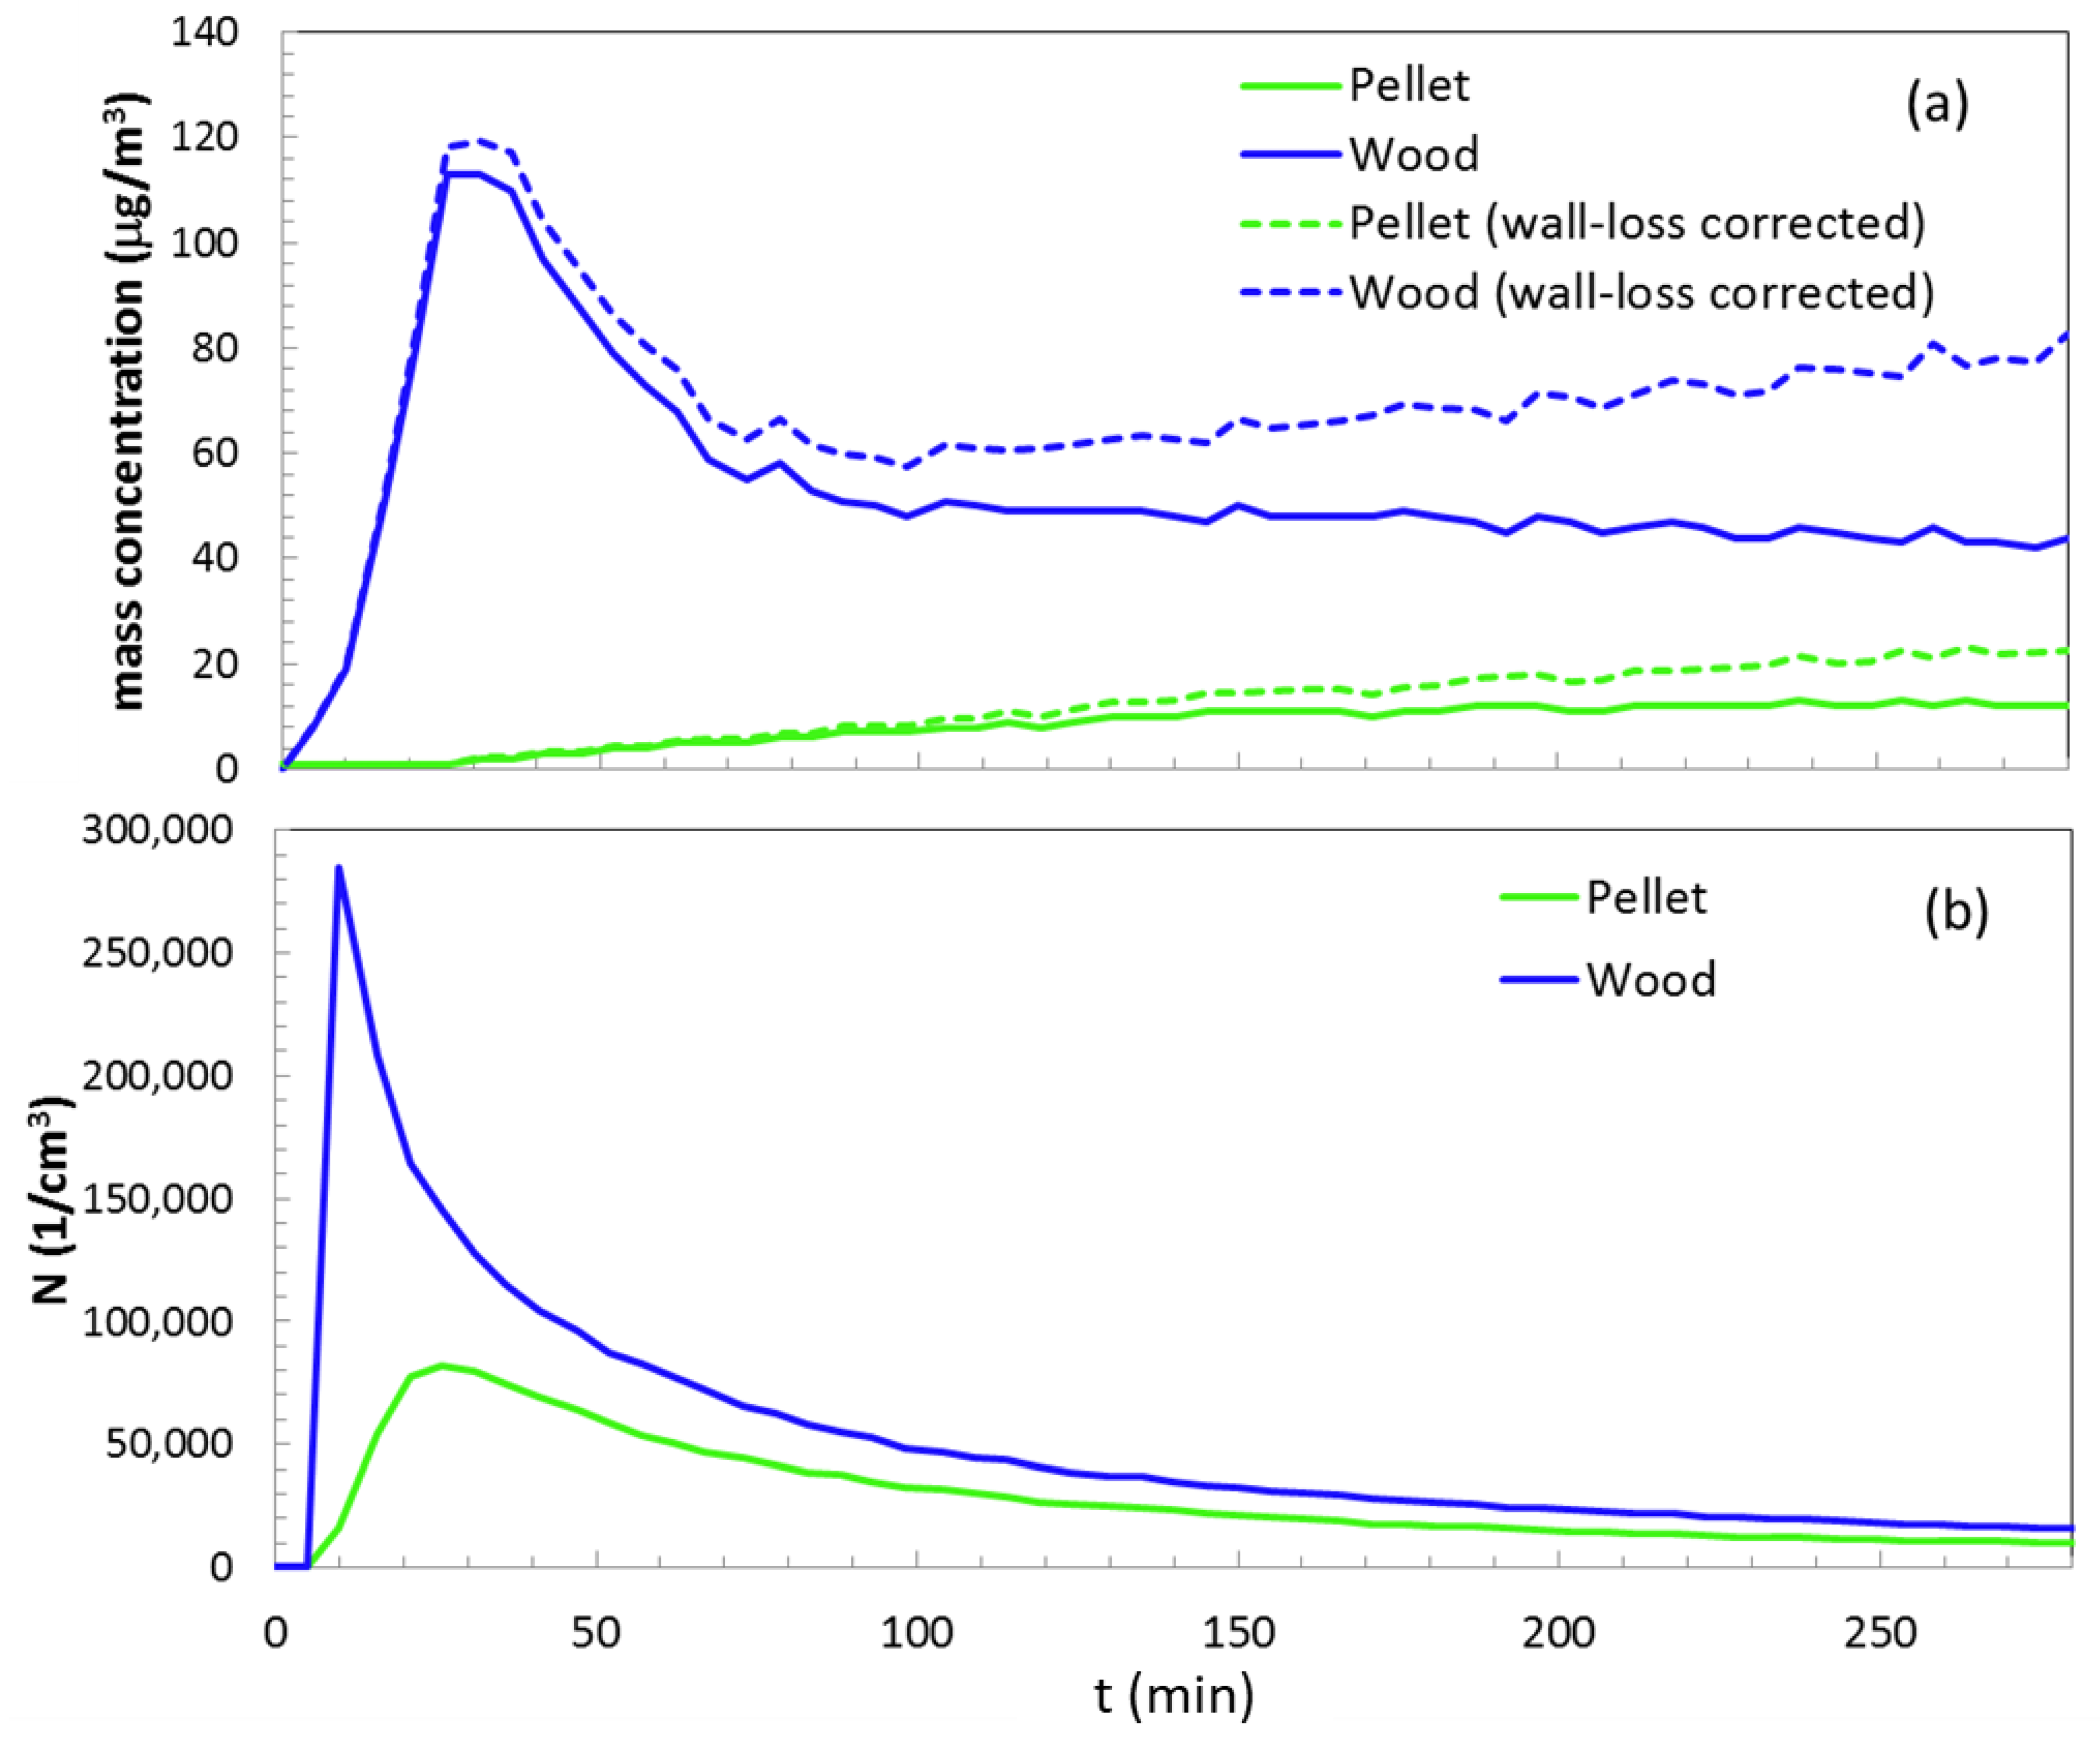
Figure 3a,b show the average values of formation of secondary particles in the firewood and pellet experiments, using DMPS. The values are expressed as mass and particle number concentrations. Only a relatively small increase of the mass concentration of particles (greater than 10 µg/m3) was found in the experiments with pellets after 300 min of UV irradiation. A greater increase of the particle mass was found in the experiments with firewood, with a maximum mass concentration of PM of 80–120 µg/m3 in the first hour of UV irradiation. The maximum particle mass concentration was achieved in shorter times using firewood compared to pellet. As shown in Figure 3b, the particle number concentration shows a fast increase in the firewood and pellets experiments, but after the first 20 min the number concentration decreased. This initial increase of the number of particles was faster in the firewood than in the pellets emission, and it is a consequence of the nucleation of the volatiles as can be seen in size distribution measurements, in Figure 4. Once the first fresh particles are formed, the coagulation, agglomeration, and loss due to wall processes start to predominate in the chamber, resulting in the decrease of particle levels. A simple estimation of the particle wall-loses is given according to Reference [45]. In that work the authors found a loss rate of 0.1 h−1 for particles larger than 100 nm in a 12 m3 undisturbed chamber, which was similar to this work’s chamber (14 m3). Figure 3 shows the uncorrected mass and number (green and blue lines) as well as the estimated loss-corrected mass concentration from Reference [45] as a dotted line.
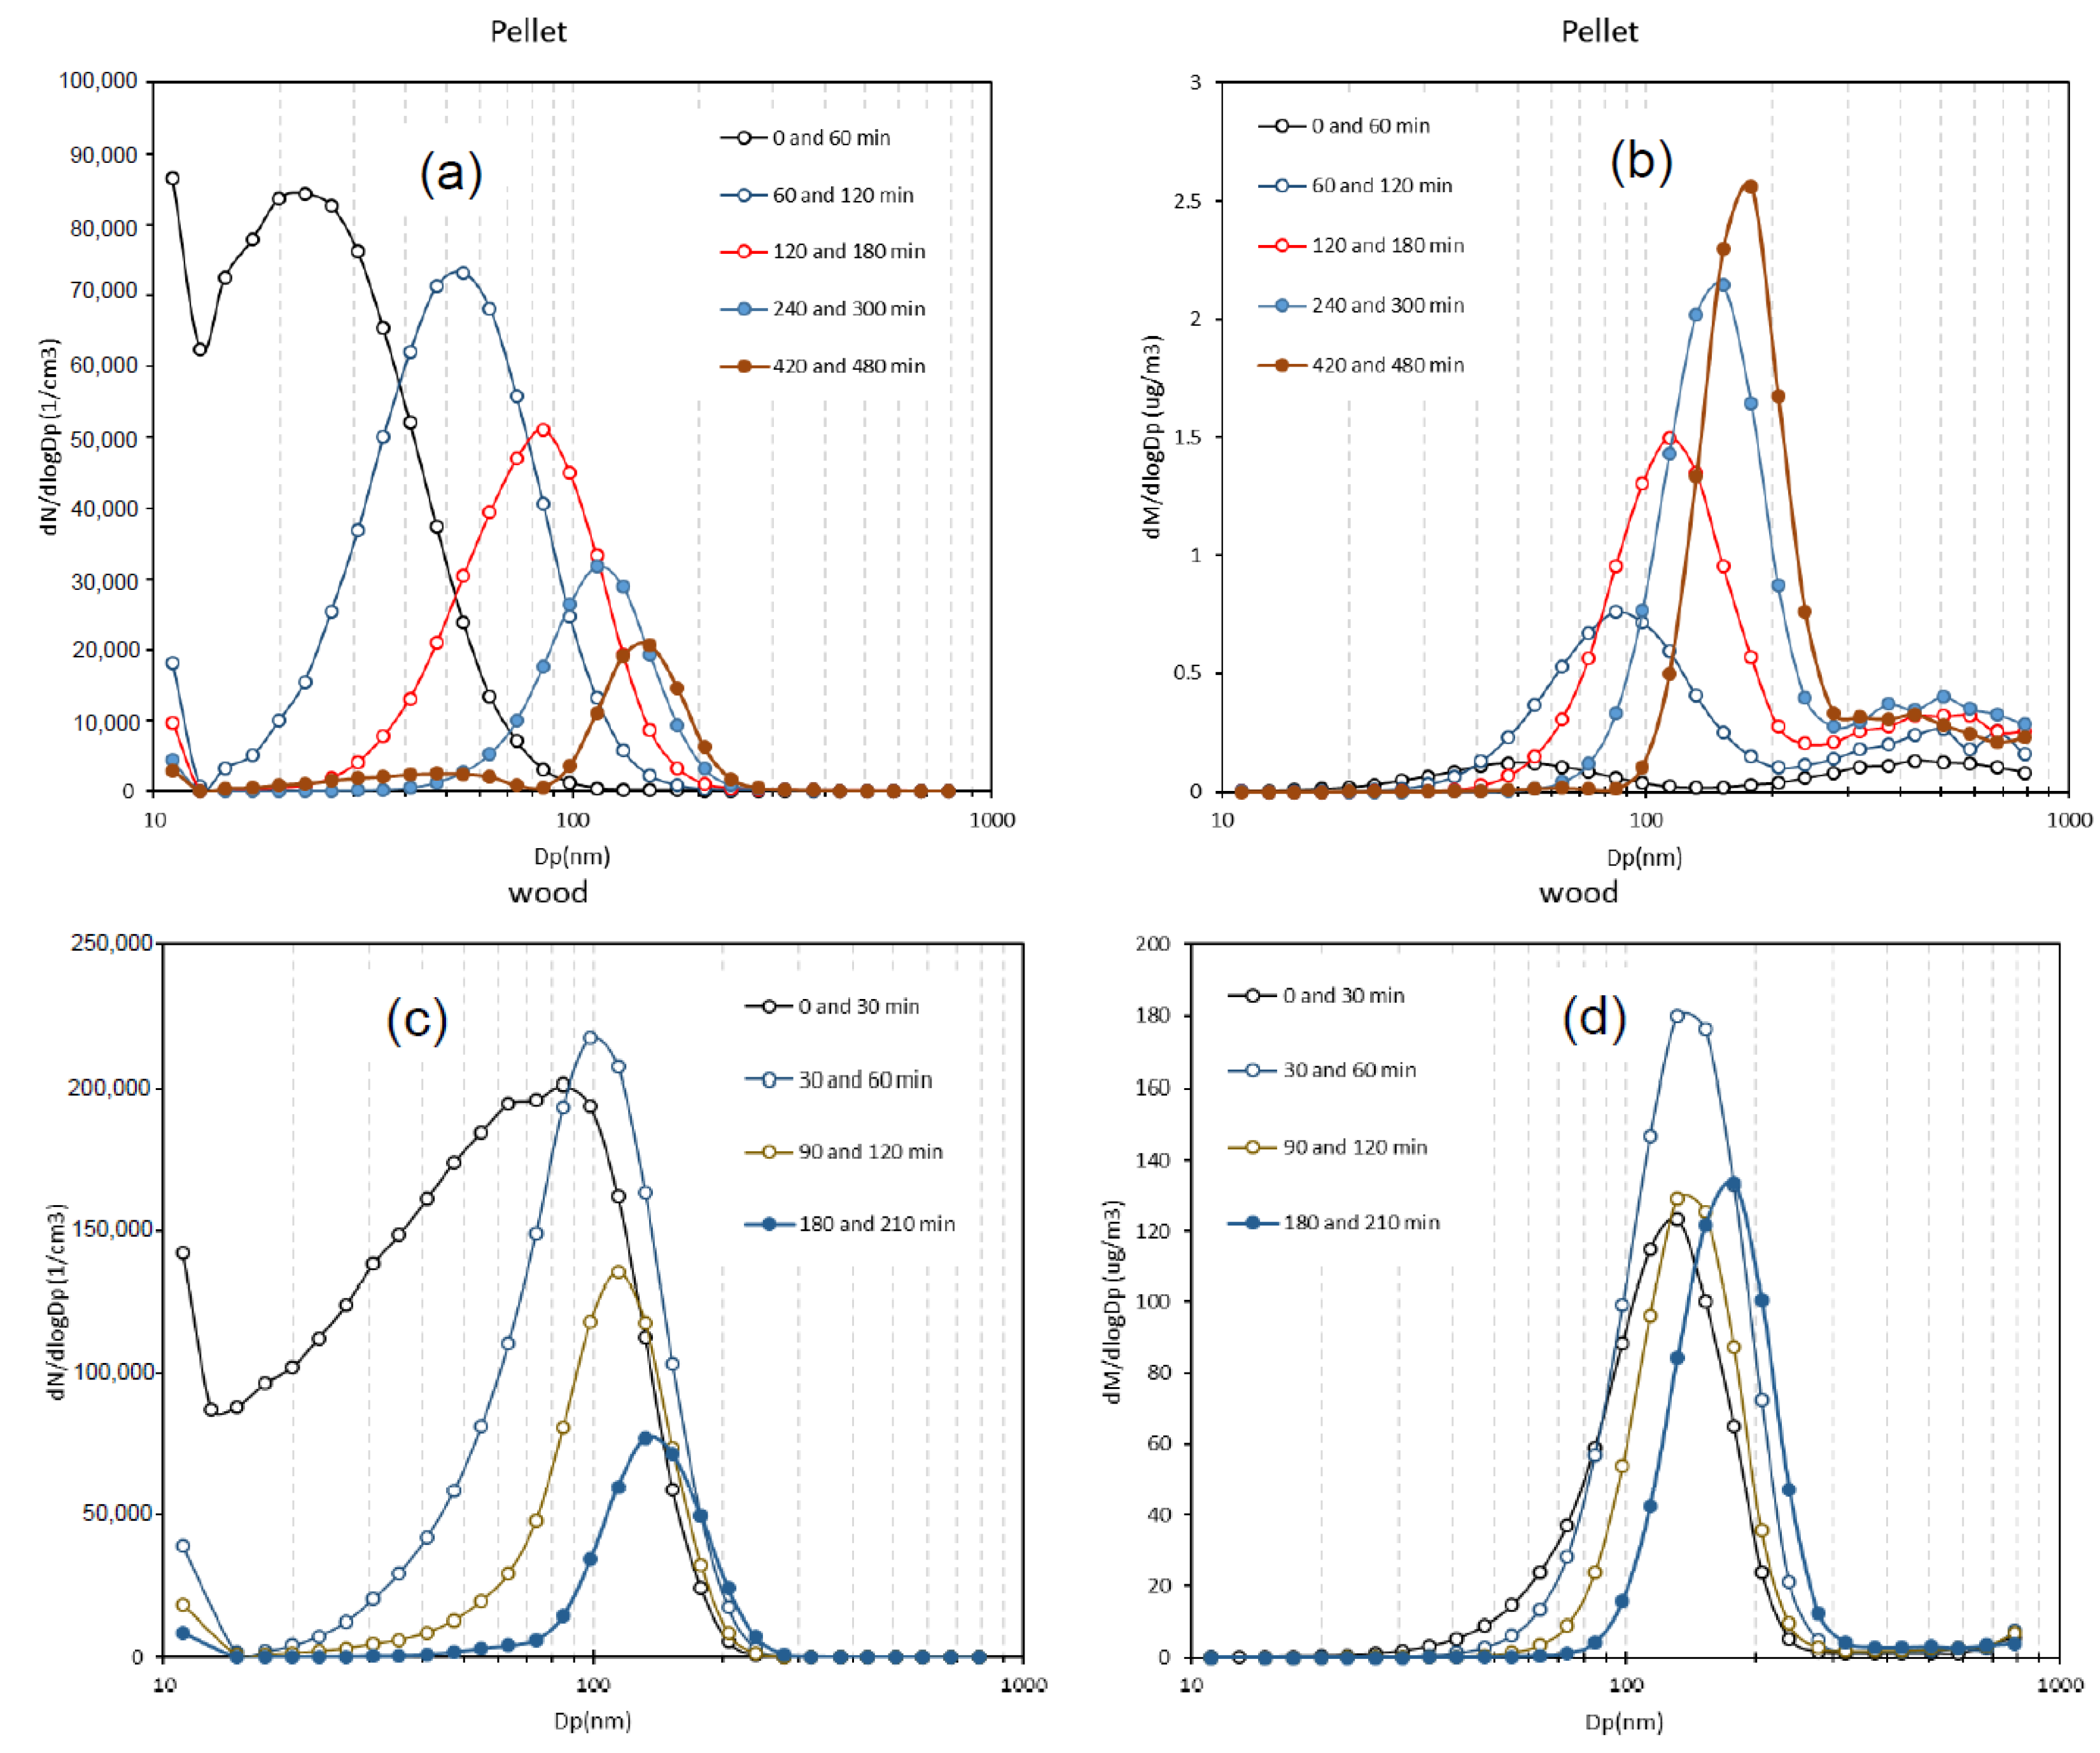
Figure 4 shows the evolution of particle size (mobility diameter) distribution during UV irradiation time for the firewood and pellets experiment for filtered emissions. The results show a continuous particle size increase after turning on the UV lamps. In the first hour the size distribution is governed by nucleation particles with a diameter close to 20 nm, and then the particles grow to a maximum of 200 nm after 7 h of UV irradiation. During irradiation the secondary particles are formed first by nucleation from the precursor gases emitted during the combustion. After the first 5 min there is a decreasing tendency in the particle number concentration as the new particles formed by the nucleation start agglomerating to form larger particles that increase the mass concentration. The formation of nucleation particles is seen more clearly in the experiments with pellets because the photochemical transformation of the combustion gases is slower in the pellet stove than in the firewood stove. The slower process in the pellet stove allows to see more clearly how nucleation particles are formed from gases reaction (takes more time). i.e., nucleation particles (~20 nm approx.) can be seen in the first hour of pellet emission irradiation. This size of particles cannot be seen in firewood secondary particle formation.
The significant difference in the absolute number and size distribution between pellet and wood is explained by the initial loading of gases components. Wood combustion is an inefficient process that emits more particles and gases compared to pellet combustion. Then, if there are more reactive gases inside the chamber, more products are formed. These shape of the size distribution of secondary particles in these chamber experiments is similar to the shape found in the chamber experiments for exhaust escape gases in tunnel experiments according to [31,46].
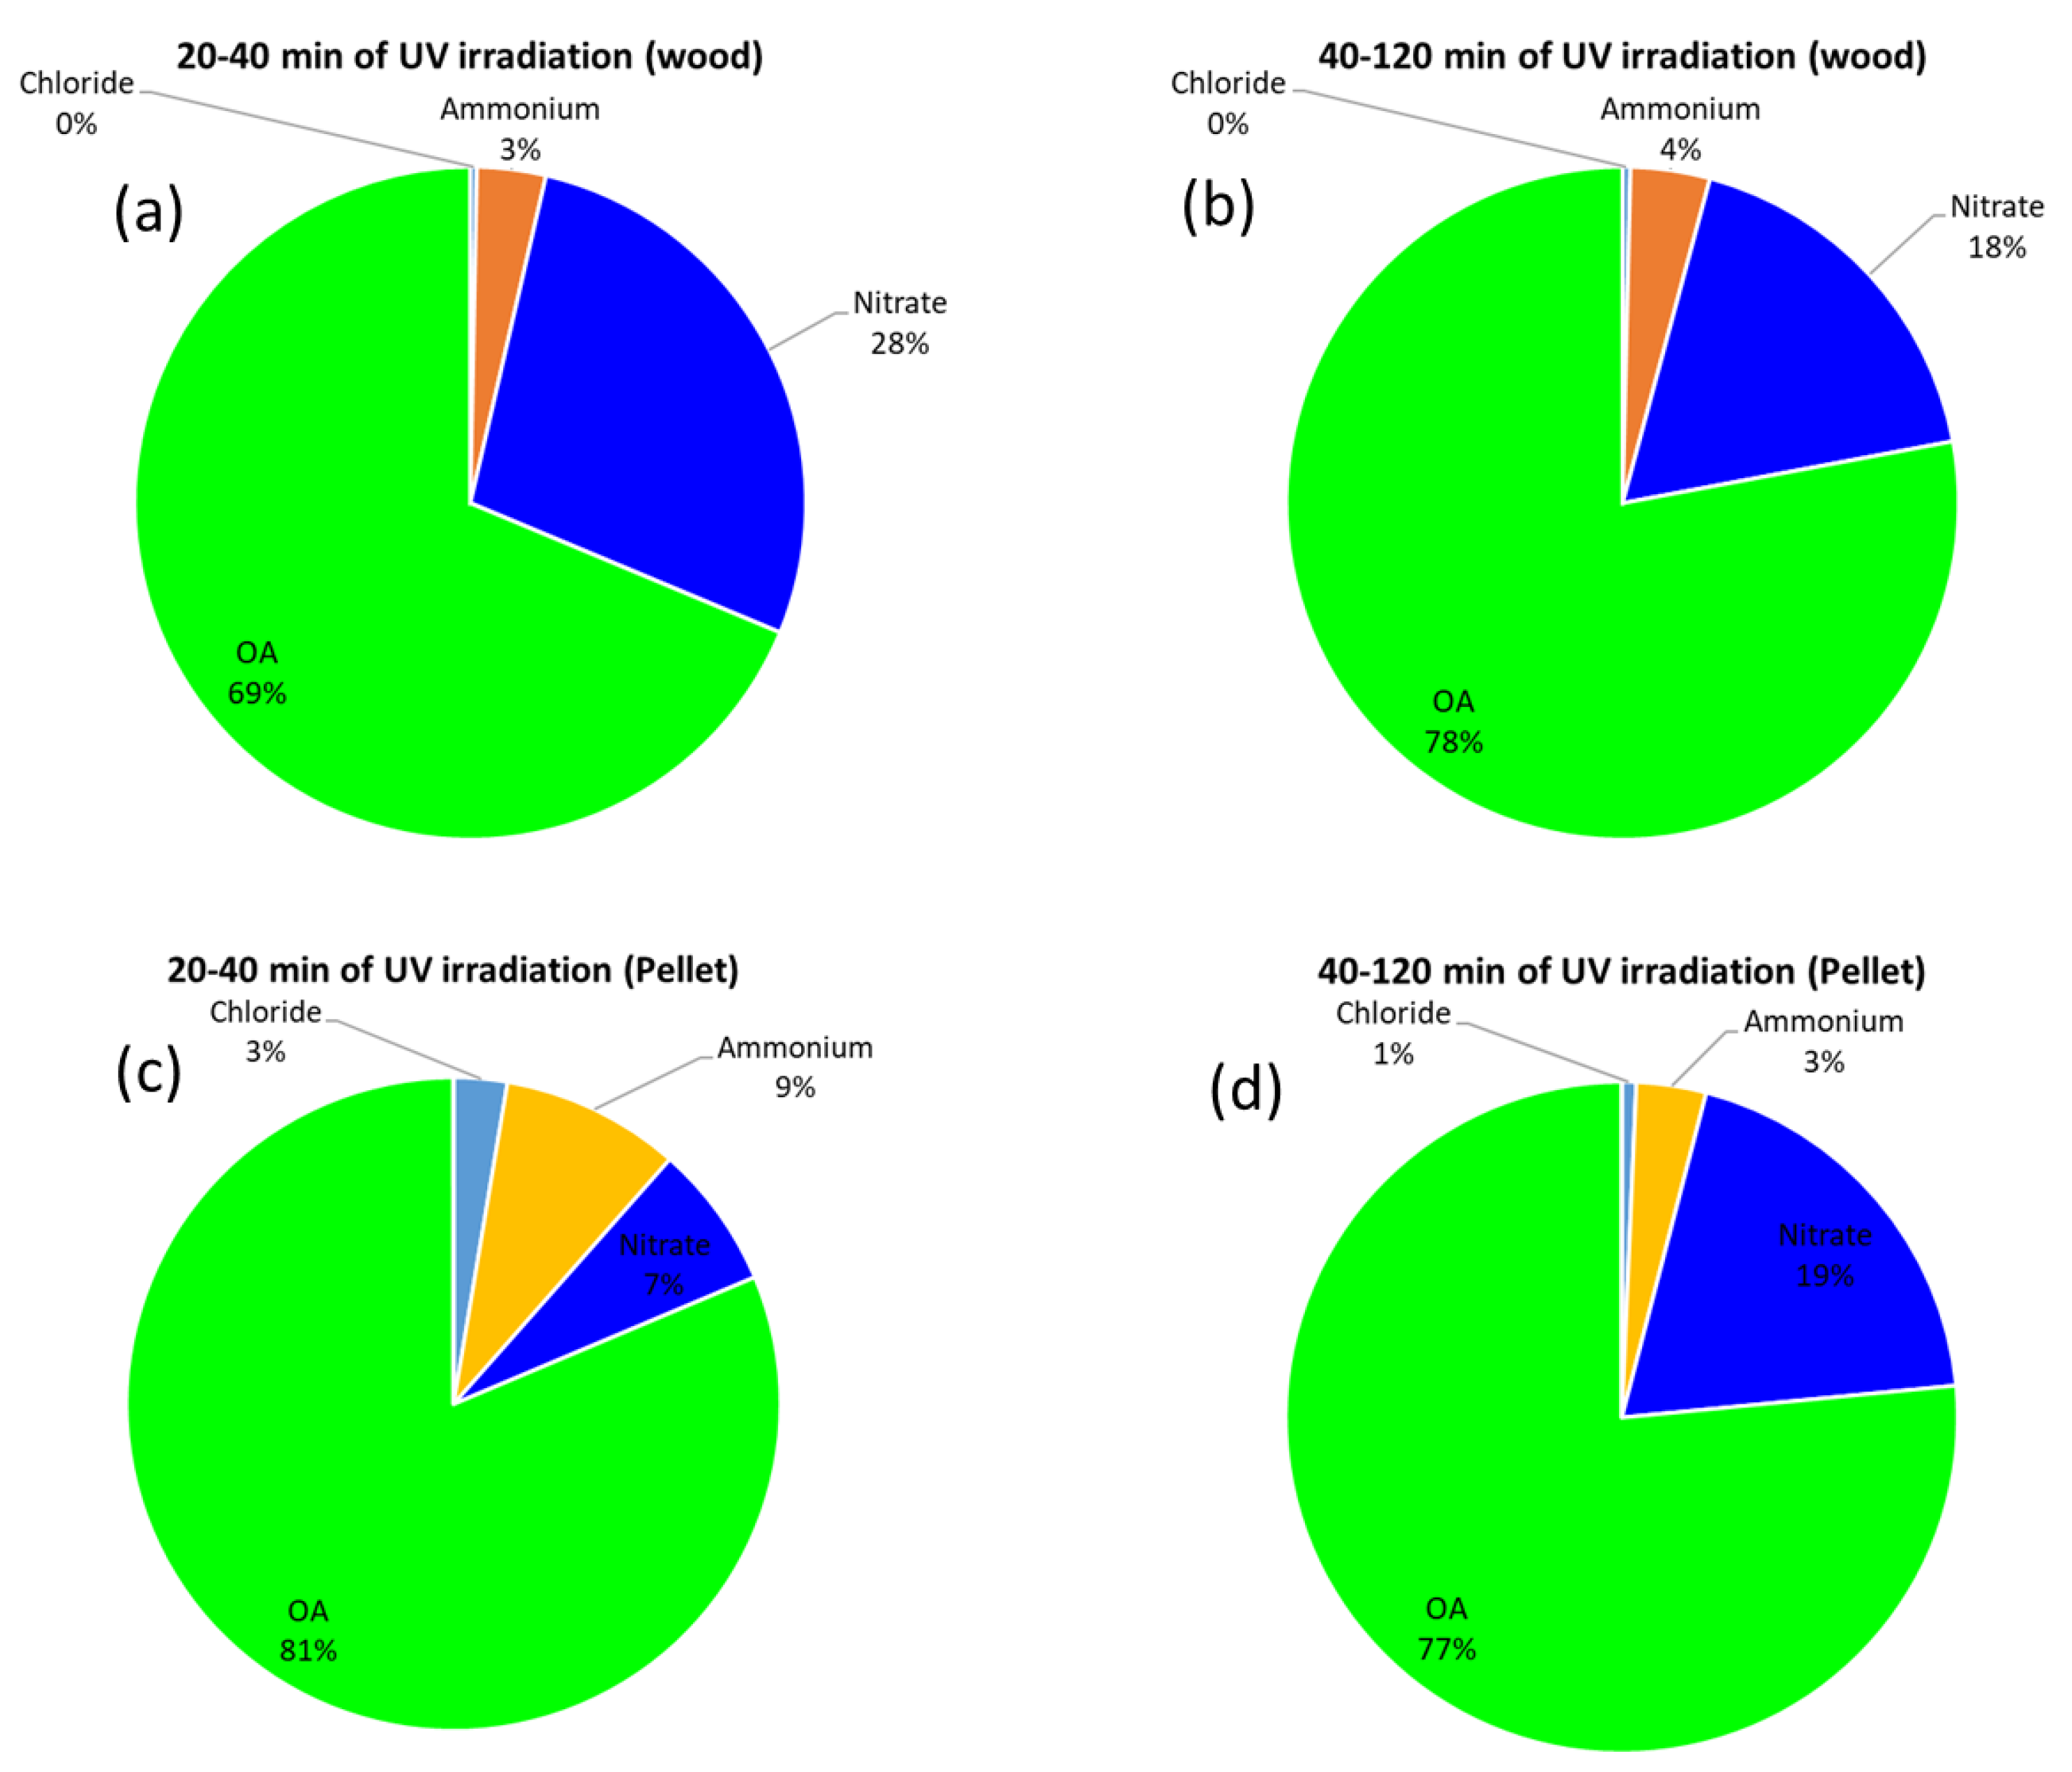
In the chamber, non-refractory PM1.0 was measured during the UV irradiation with the ACSM. Figure 5 shows the results. A significant increase of NO3 was seen in the experiments with pellets after 40 min. of irradiation. In the chamber, all species should be neutralized, but there not enough ammonia to neutralize the nitrate measured (Figure 5). There is another inorganics cation that could also be neutralizing it, like K+ and Ca+, especially in ashes. Unfortunately, we did not have capability to measure it, but in atmosphere these ions usually are in ng/m3, and the amount of nitrate found it in experiments were quite over that. On the other hand, there is evidence of organics nitrates formation from biogenics VOC oxidation. Reference [41] indicated that at high and even modest concentrations of NOx, the peroxy radicals react primarily with NO, forming mostly NO2 and an alkoxy radical (RO), and one of the following reactions is the addition of the NO to the peroxy radical, giving an organic nitrate (RONO2) product. Organics nitrates was also observed in chamber experiments using high-NOx photooxidation of limonene, α-pinene, Δ-3-carene, and tridecane, contributing significantly to the SOA [47]. In Reference [48] shows that a significant amount of nitroaromatics are generated due to photooxidation of phenols and metoxyphenols (intermediates of biomass burning) in the presence of NOx. So, it is postulated that most of the NO3 measured by ACSM in the chamber is in the form of organic nitrates. If there is another inorganics cations neutralizing the NO3, those cannot be measured by ACSM, because it only has capability to measure non-refractory PM refractory [36], and inorganics salts usually are refractory particles. This nitrate increases with UV irradiation, forming secondary organic particles. The formed NO2 reacts rapidly with OH, producing HNO3, which can later be adsorbed on the surface of the chamber or combined with ammonia (NH3), forming some ammonium nitrate.
3.3. UV-A Irradiation of Unfiltered Emissions
Total unfiltered emissions of gases and particulate matter from the firewood and pellet heaters were fed into the chamber and were irradiated with the UV-A radiation used in these experiments. The initial NOx concentration measured after the injection of the aliquot was extremely variable in both kinds of fuels. Table 3 shows the initial NOx levels (before UV irradiation) in various experiments, showing values from 66 ppb to 1691 ppb. The table also includes an indicator of the maximum NO2 production calculated as the ratio of the maximum NO2 concentration (NO2max) recorded in the chamber during the UV irradiation to the initial NO2 concentration (NO2), expressed as “NO2max/NO2”. As expected, the maximum NO2 production is proportional to the initial NOx concentration, but it is also independent of the type of fuel. At a higher initial NOx concentration, the NO2 maximum is ~15 times that NO2 for both the pellet and the firewood, while for a low initial concentration NO2max/NO is only ~6 times.
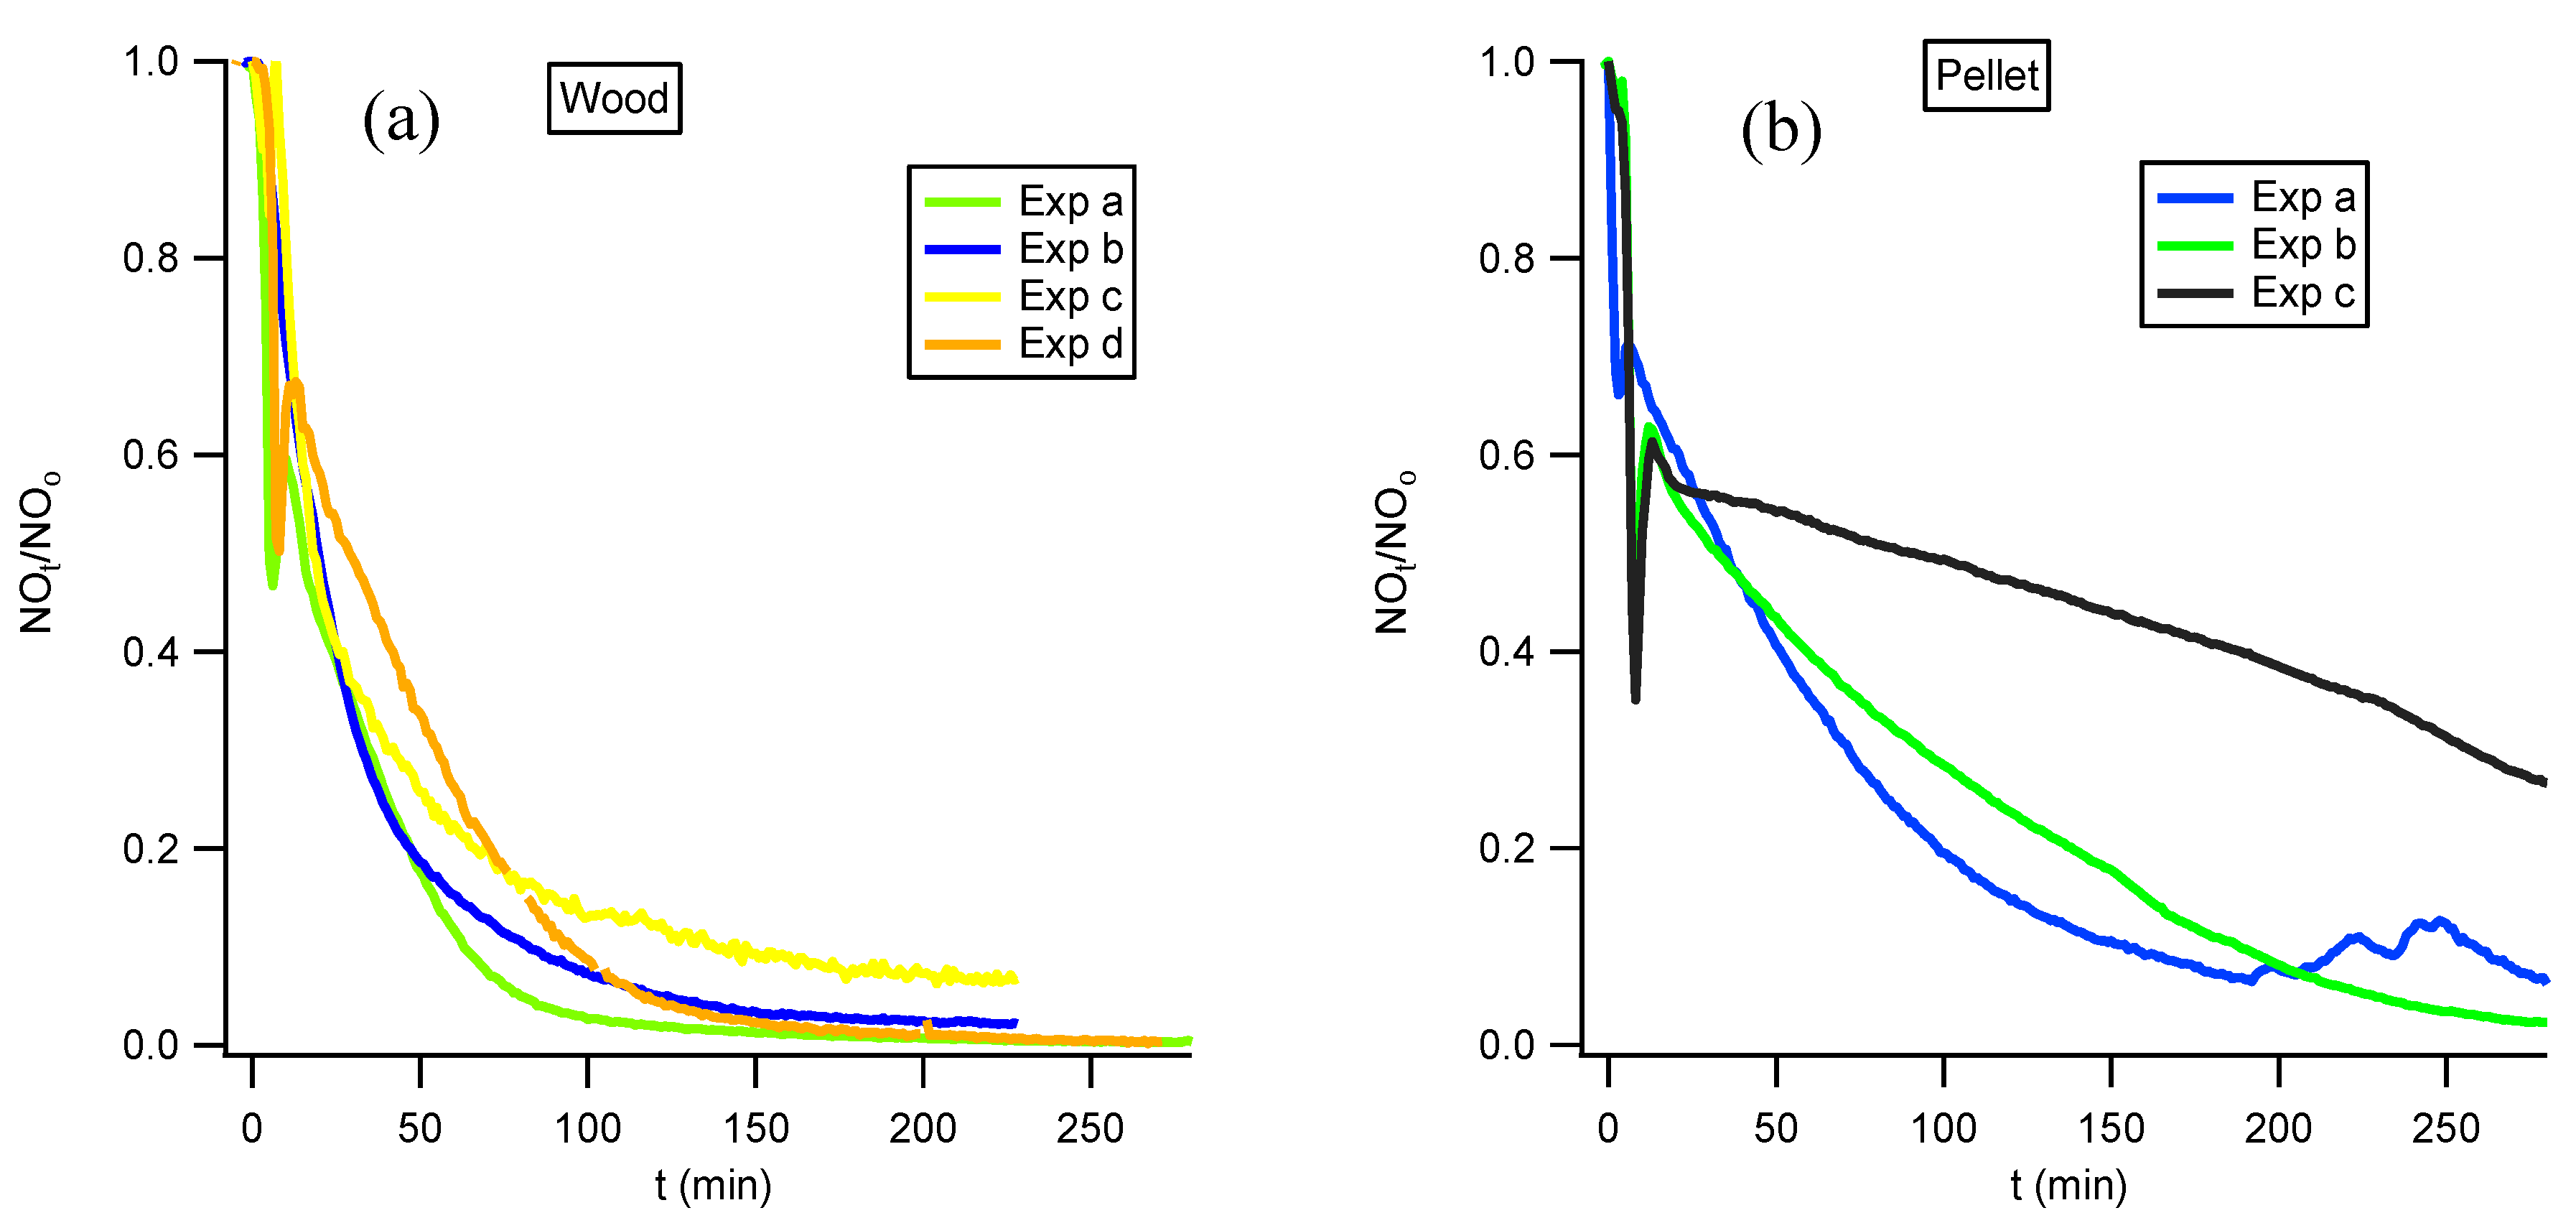
The NO concentrations at each irradiation time (NOt) were normalized by the NO initial concentration (NO°), and expressed as a NOt/NO° ratio in Figure 6. If we compare the time to reach the NO2 maximum (Table 3) with the NO consumption curves shown in Figure 6, it is seen that NO consumption appears to be lower in the experiments with pellets than those with firewood. It is seen that 50–70 min of UV irradiation are needed to obtain 20% of the initial NO concentration in the experiments with firewood, while the experiments with pellets require more than 100 min. These results are consistent with what was determined for the filtered experiments (previous section). The lower efficiency of the combustion in the experiments with firewood emits more VOC than with pellets, and this is reflected in the ozone values.
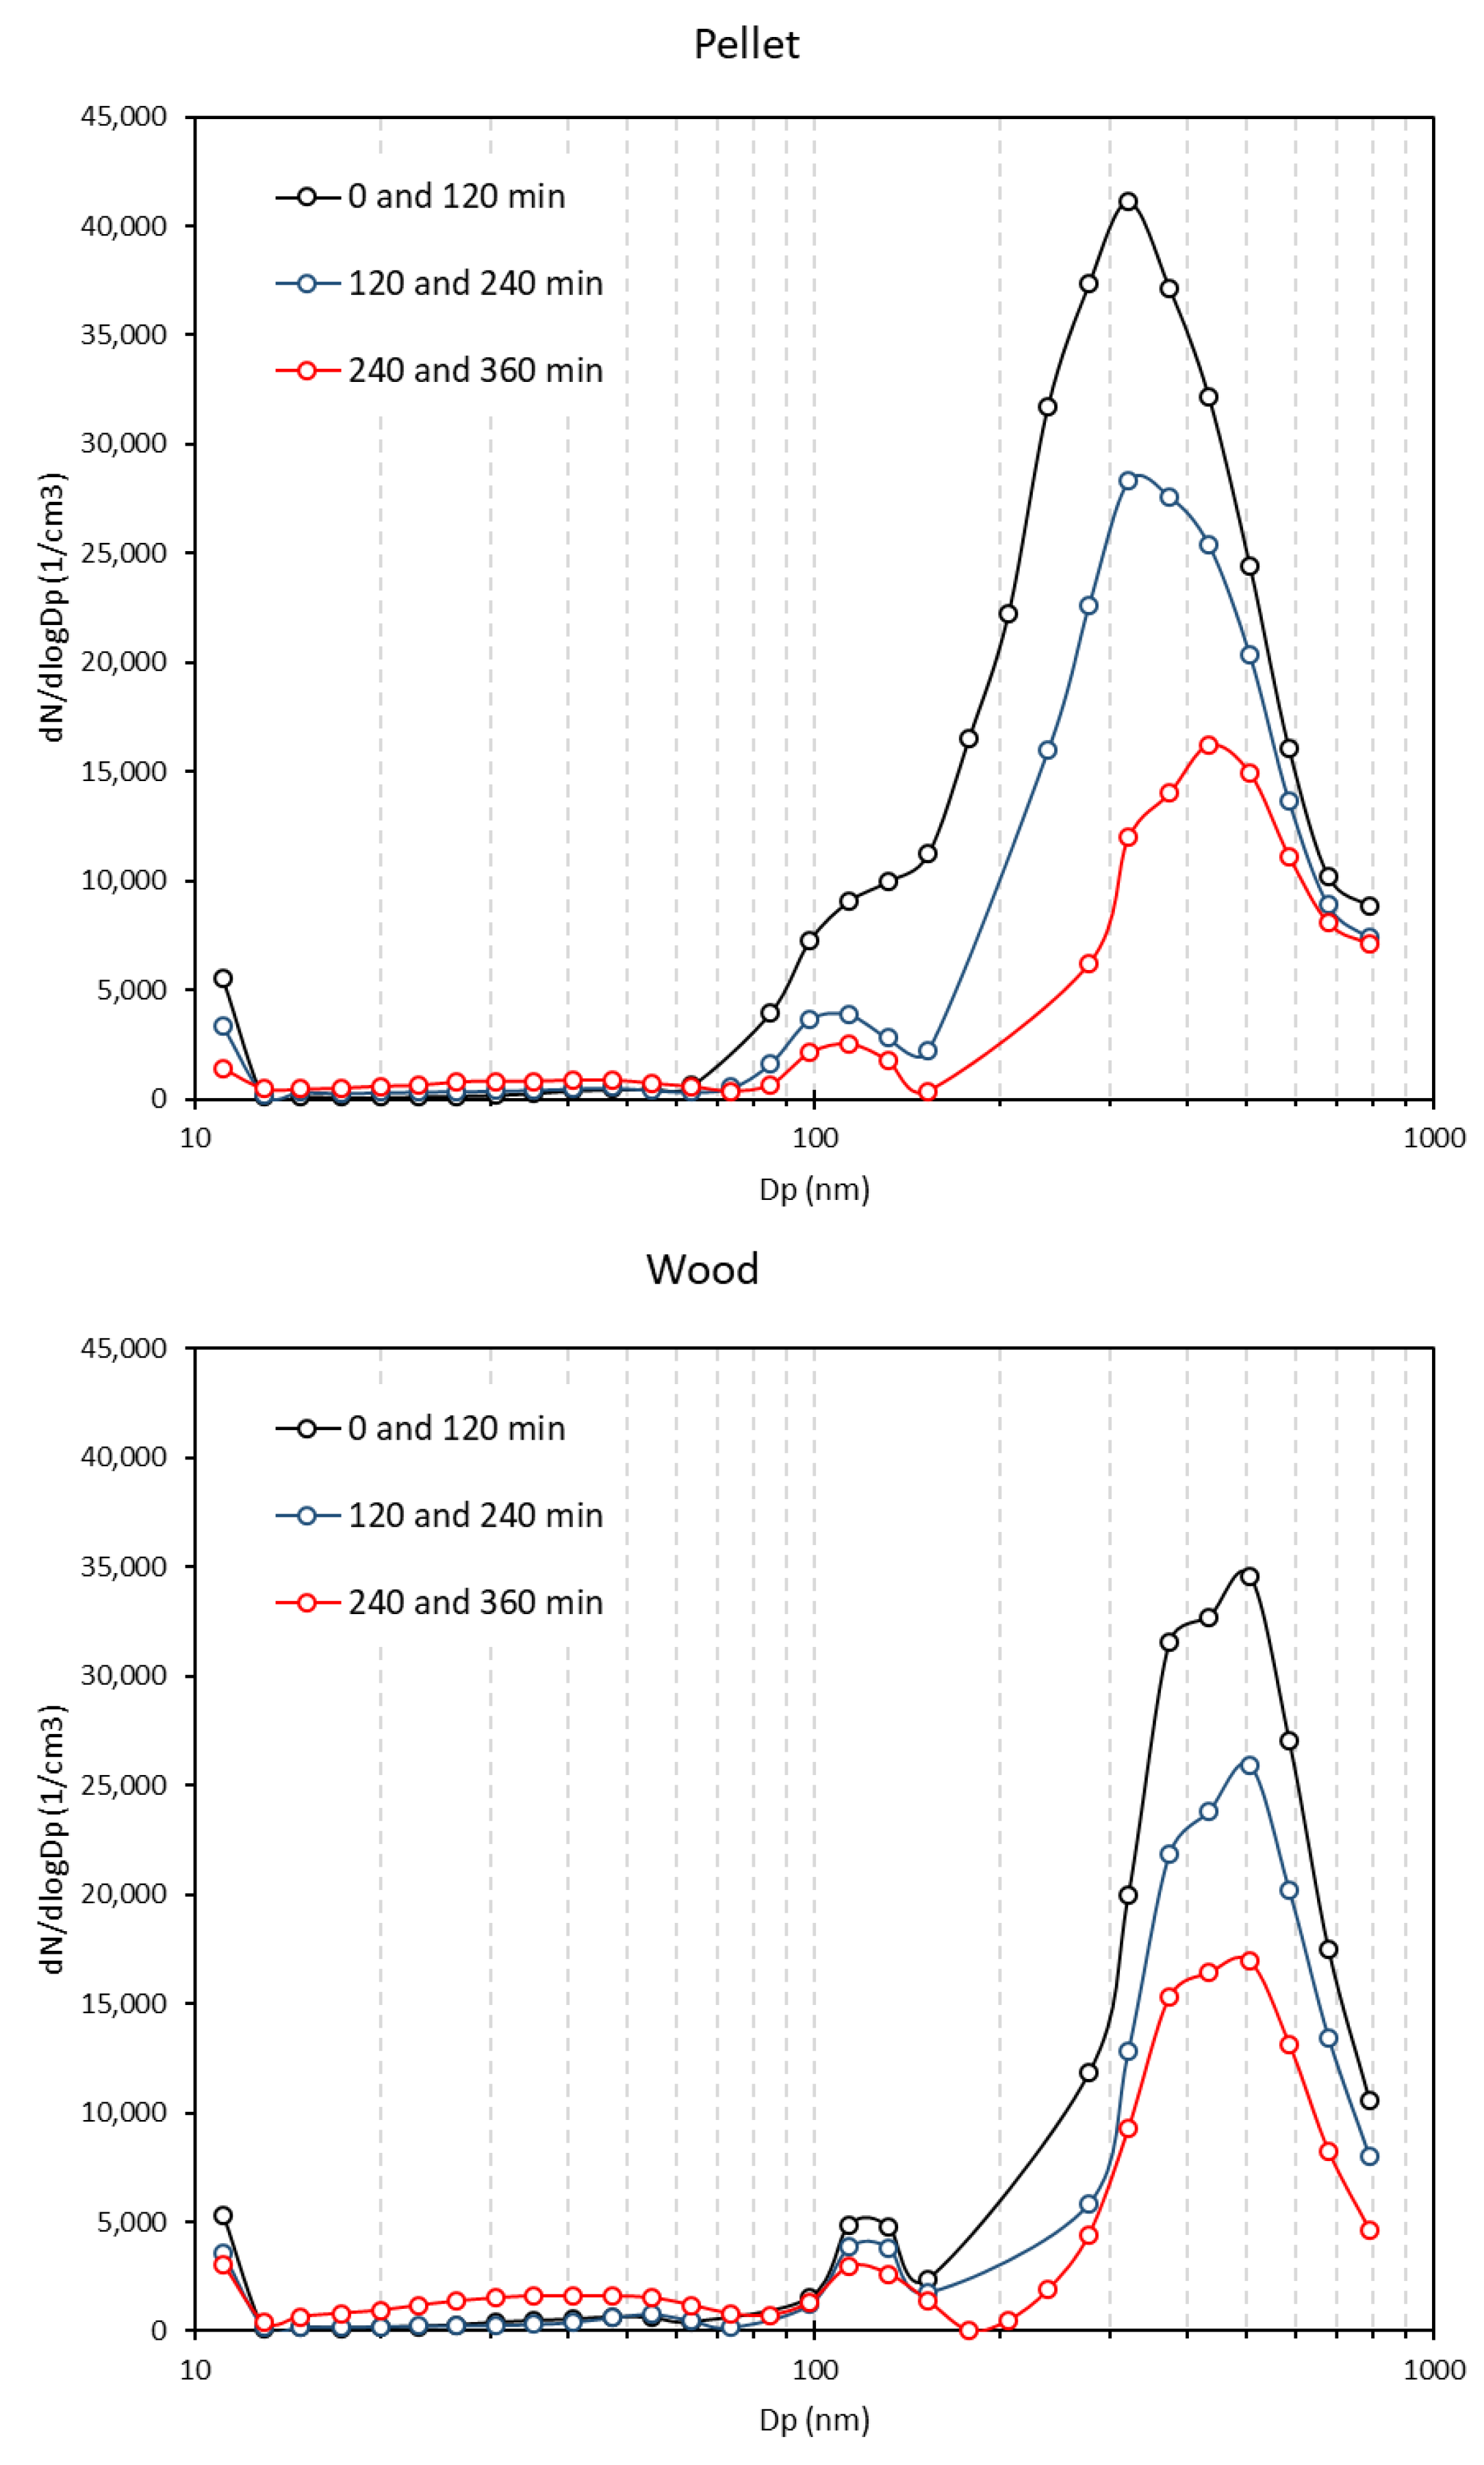
Biomass combustion presents a wide particle size range, from a few nanometers to some micrometers [22], but in general the combustion particles are dominated by the fine mode [21]. The particle number size distributions of the pellet and firewood experiment are shown in Figure 7 as a function of UV irradiation time (each curve is an average of every 120 min). In both cases, the distribution of the number size shows a bimodal shape centered around 300–400 nm (most of the particles) and 100 nm (lower particle number concentration). The 120–1000 nm size distribution corresponds to primary particles and it is a typical form of biomass burning. It should be noted that the DMPS used here can only measure particles smaller than 800 nm, so larger particles are not represented in these graphs. Due to the high primary particle concentration in the unfiltered experiments, the nucleation process is not seen clearly (Figure 7). During the UV irradiation of the filtered emissions (Figure 4), the maximum of the number size distribution increases 20 nm to almost 100 nm in 120 min. However, in the unfiltered emissions when gases and primary particles are irradiated, the maximum in the number size distribution is already close to 200 nm. In this case the UV radiation has no significant effect on the size of the particles, as shown in Figure 4. Therefore, these results indicate that when the primary particles and the gaseous emissions are irradiated, the particle mass and number is governed almost exclusively by primary particles and the formation of secondary particles cannot be separated clearly.
3.4. Transformation Chemistry of Organic Aerosols during Aging
The formation of secondary particles was low compared to the contribution of the primary particles during the combustion of firewood and pellets. But there can be a significant change in the chemical composition of the particles during the UV irradiation [25,26,45]. ACSM provides a measure of the evolution of the chemical composition of the organic aerosol (OA) during UV irradiation. ACSM recorded mass spectra approximately every 30 min, and some key mass fragments were used to distinguish the organic groups. The m/z 44 mass fragment is assumed to be dominated by the CO2+ ion often used as a measure of the extent of oxygenation because it is typically formed from the thermal decarboxylation of organic acid groups [49]. Therefore, this fragment can be used as an indicator of SOA and the aging of the OA. Similarly, it has been found that the m/z = 43 fragment can be an indicator of primary organic aerosols (POA) and fresh SOA [50]. It is important to have in mind that here it is assumed that the mass of the m/z 43 fragment does not originate from organic acids. Other key fragments of the burning of primary biomass are the signals at m/z 60 and 73, which correspond to anhydrosugar (C2H4O2+ and C3H5O2+) that are known to be emitted during the burning of biomass [51]. These fragments are often used as markers for POA emissions. This is due to the fact that levoglucosan and similar species (mannosan, galactosan) produce an enhanced signal at m/z 60 [25].
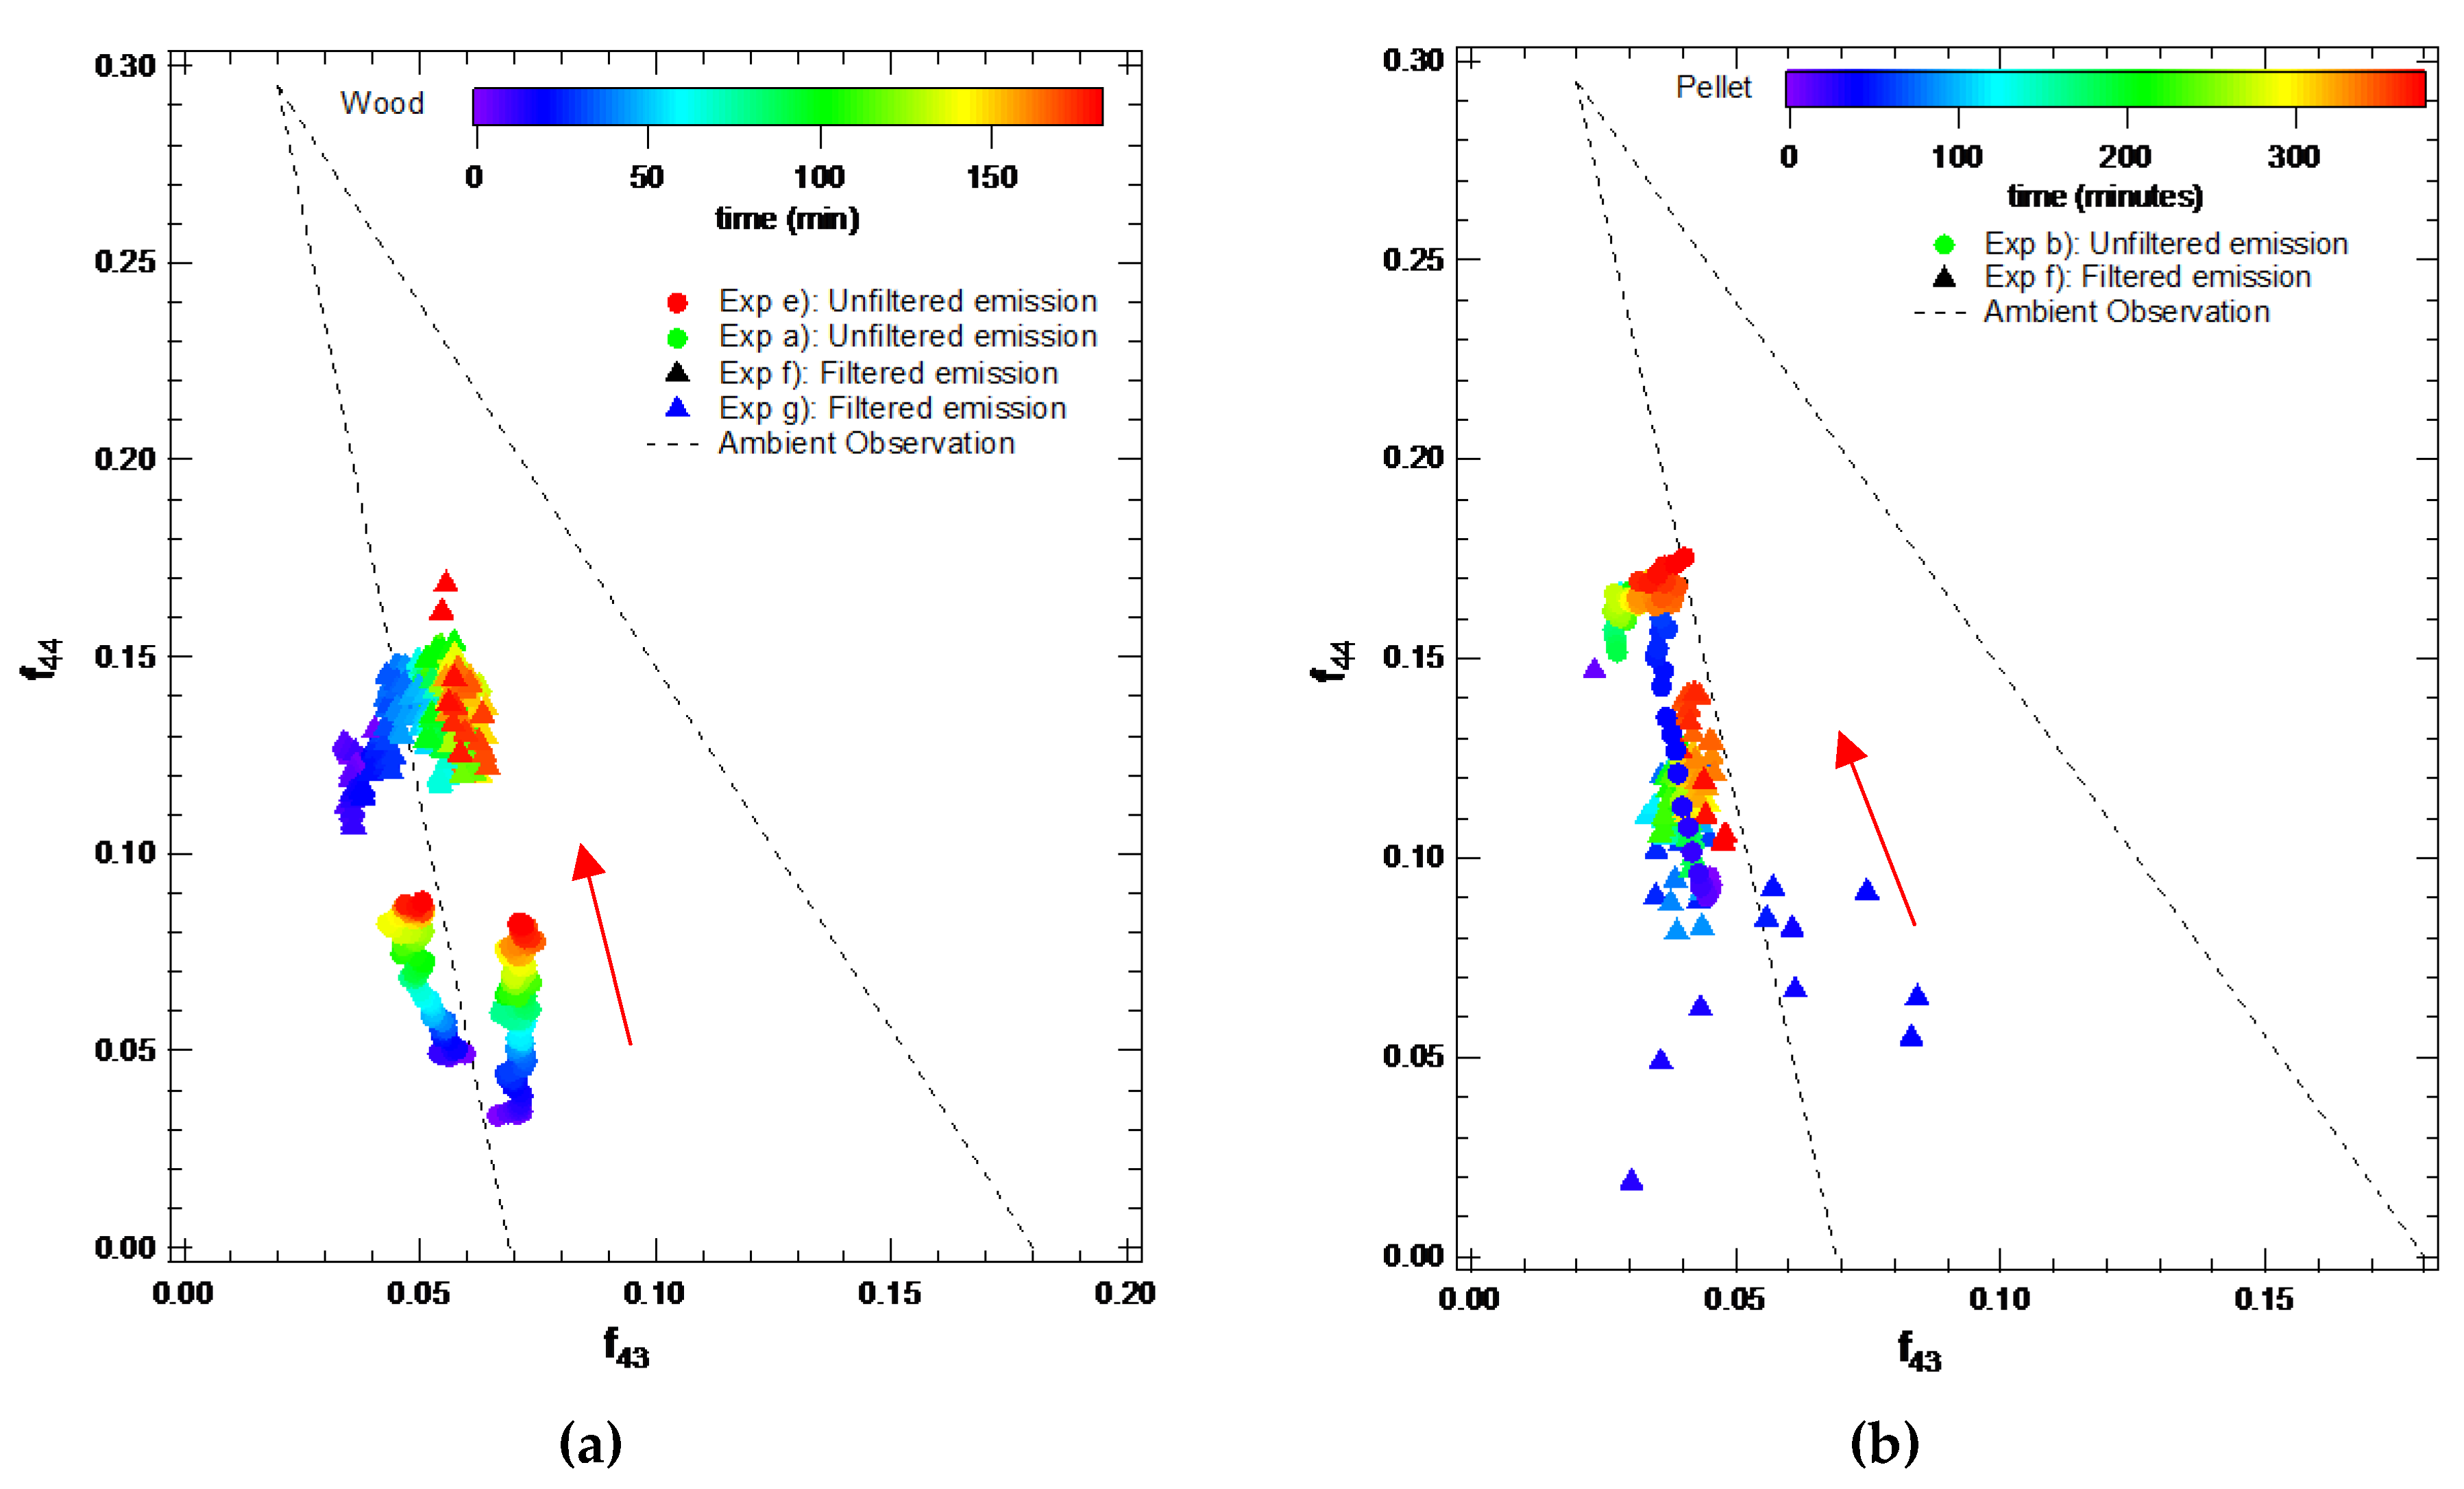
In the study of the evolution of organic aerosols during UV irradiation, the important fragments are presented as f43, f44, and f60. The ACSM team recorded the fractions of the signals at m/z 43, m/z 44, and m/z 60 in the total mass of organic aerosol. Figure 8 shows f44 vs. f43 for the results in firewood (a) and pellets (b). It also includes experiments with filtered emissions (only oxidation of gases) and unfiltered emissions (oxidation of particles + gases). When the environmental measurement of f44 is graphed against f43, all the OA components are found in a triangular space called “triangle graph” [50], which is useful for comparing the degree of oxidation of the organic compounds. The f44–f43 area between the dashed lines represents the range typically found in ambient measurements.
The colors of each series in the graphs in Figure 8 indicate the UV irradiation time. At the beginning of the UV irradiation, f44 and f43 were small (~0.05) for the unfiltered firewood emission, the data points were almost outside the f44–f43 triangle space, indicating that the aerosol is composed mainly of primary particles. In fact, this position at the bottom of the triangle is consisted to that indicated in [50] for biomass burning primary particles. However, as the UV irradiation progresses, the value of f44 increases and reaches a value close to f44 = 0.1. The f44 values reached in for primary emissions oxidation reach a triangle position where semivolatile oxidated organics aerosol (SV-OOA) occupy when ambient data is analyzed [50,51]. SV-OOA can be seen an intermediate state oxidized organics aerosol (not final oxidation states). However, unfiltered pellet emission (b) reaches a higher value of f44, then is an OA more oxidized than firewood. This can be due to lower primary contribution on particles, due higher combustion efficiency. In fact, oxidation start at higher f44 values. Then, independent the state, based on these graphs it can be seen that firewood reached a lower level of secondary oxidation compared to pellet. The data points of the experiments with firewood with filtered emissions (only oxidation of gases) take higher f44 values due to the lack of primary particles (note: f44 only consists of secondary OA). However, f43 is similar to that of the unfiltered emissions. When the UV irradiation begins, there are no great changes in f44 or f43. For the pellet emissions, all the points seem to be located outside the f44−f43 space, indicating a lower contribution of primary particles. The f44 values reached with the UV radiation are similar to those found in experiments with firewood.
Overall, the organic oxidation in the chamber is at a level similar to that typically found for semi volatile organic aerosols (SV-OOA) in field campaigns, i.e., Santiago de Chile [13]. Based on the work reported in [33], the chamber’s UV lamps can imitate well a summer midday in Santiago.
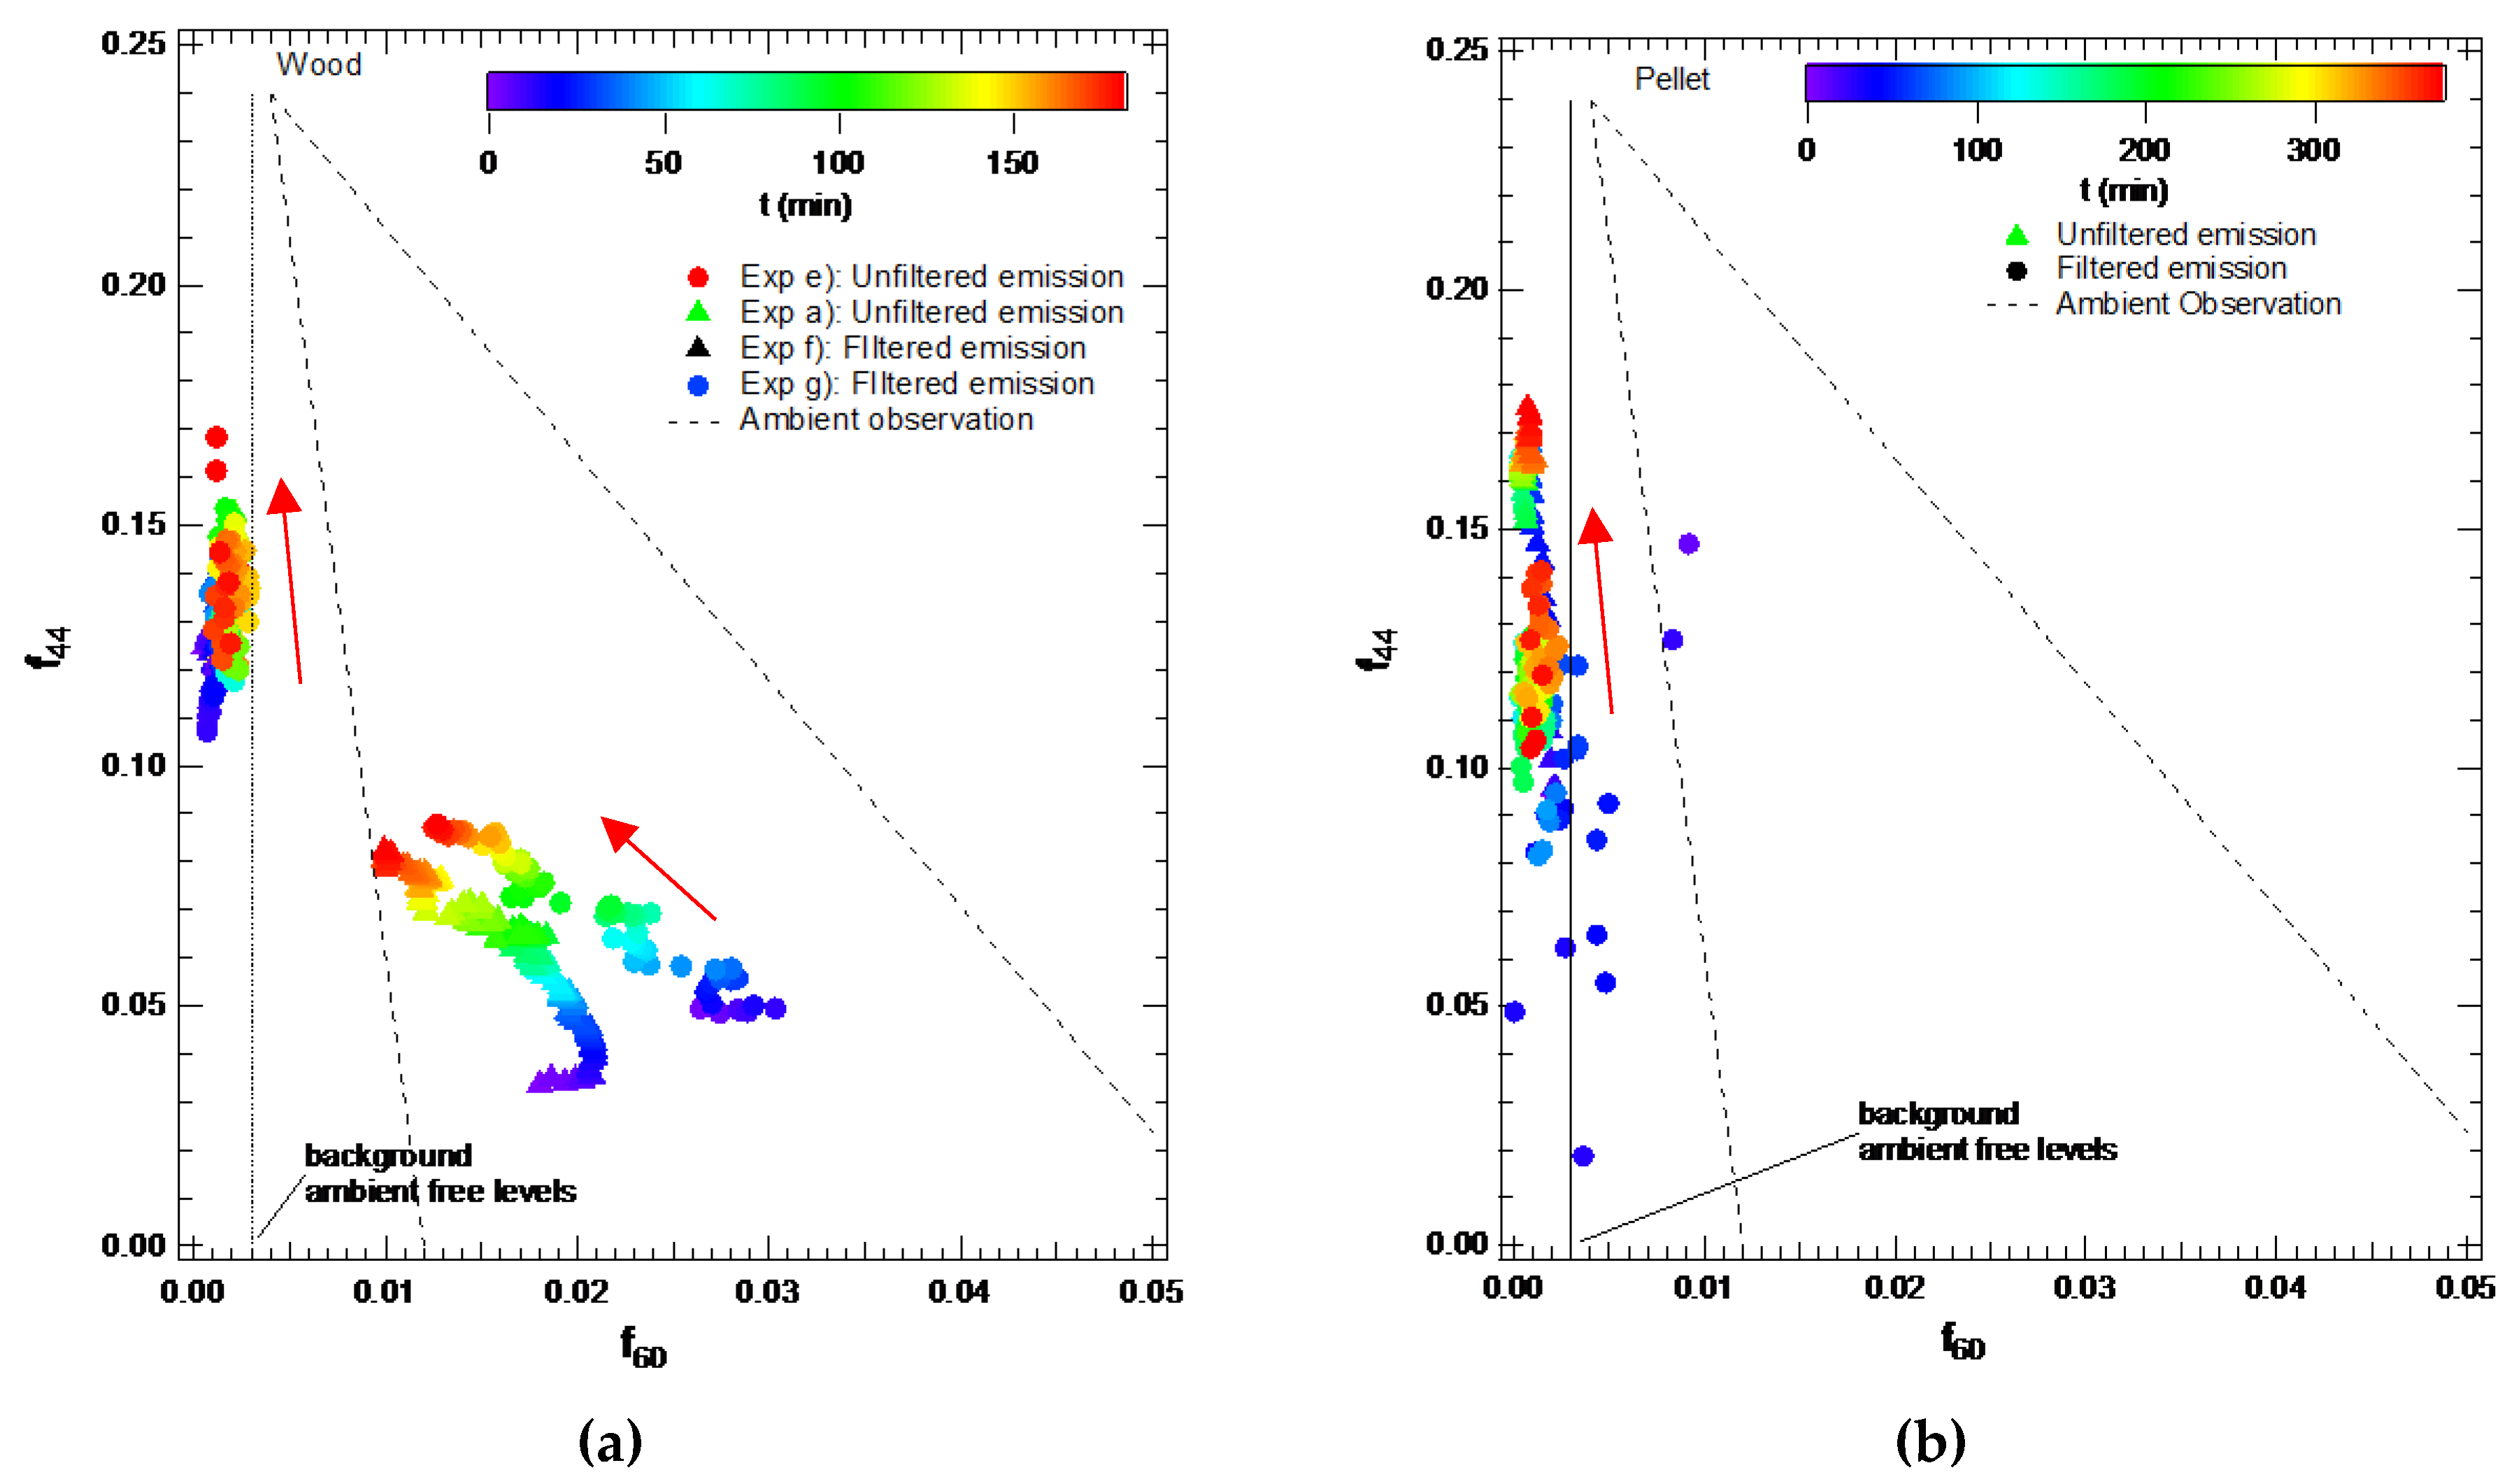
Ref. [25] proposed a similar spatial f44−f43 diagram, but using f60 instead of f43, to characterize the aging of the emissions in the burning of biomass, based on an important fragment of levoglucosan (m/z = 60). The f44 vs. f60 dispersion diagram facilitates the comparison of land, aircraft, and laboratory observations [26,45]. For these data, of all the experiments only the emission from unfiltered firewood falls within the environmental observations triangle and shows an evolution with UV oxidation (in Figure 9 graph on the left, green and red markers). Again, UV irradiation time is shown in various colors. The evolution of UV oxidation is shown by the decrease of f60 and the increase of f44. All the experiments with pellets (unfiltered and filtered emissions) take place in the region of particles that do not burn biomass. The experiment with filtered emissions is constantly found outside the triangle because there are no primary particles in the chamber. However, the reason for the filtered points to be outside is that the combustion of the pellets is more complete, and therefore there is no levoglucosan in the emission, so there is no f60 (or it is very low). The fact that levoglucosan is not an indicator of the emissions of pellets has been dealt with in previous studies [26].
4. Conclusions
Results from UV irradiation experiments of firewood and pellet emissions under controlled conditions in a photochemical chamber indicate different combustion efficiency and different emissions rates for these materials.
A large difference in O3 formation was observed for pellet and wood experiments, with the largest amount formed in the wood stove. These results indicate that the gases emitted by pellets show a photochemical activity rate significantly slower than that of the gases emitted by firewood. This behavior may be due to the lower emission rate of volatile organic compounds in the pellets heater, probably due to the improved combustion technology. In both cases it was possible to measure the formation of secondary particles. However, in all experiments the concentration levels of the secondary particles were negligible compared to the amount of primary particles, even after ~280 min of the UV irradiation. This result could be as consequence of the high primary emission loading reached in the chamber in each experiment which it was not possible to control on experimental set-up. High loading primary emissions could quench the secondary particle formation for several process, and in the atmosphere primary emission usually are efficiency diluted so probably secondary particle formation could be enhanced compared to our results.
Particle aging was evaluated using organics fragment tracers m/z = 43, 44, and 60. For the same UV irradiation time, it was found that firewood primary particles show a slower aging rate compared to pellets, probably due to high primary particle loading. The f44 marker, an indicator of the oxidation degree for organic aerosols, showed higher values in the case of the pellets compared to firewood.
Particle chemical composition evolution during UV irradiation shows that firewood burning emissions tend to have a similar contribution of organic components compared to the burning of pellets. As explained in the text, the organic aerosols formed consist predominantly of organic nitrates, not ammonium nitrate. This result is not expected to be the atmosphere, so any extrapolation of these experiments should take this into account.
Levoglucosan (m/z = 60) has been widely used as a biomass combustion tracer. We have found that the higher fuel combustion efficiency seen in pellet stoves only yield low levoglucosan levels, making it difficult to use it for pellet emission impact evaluation. However, larger levoglucosan levels are seen for wood emissions.
Author Contributions
F.R. and Y.V. performed sampling, chemistry analysis and prepared manuscript. M.A.R., E.G. and P.O. supervised the work and prepared the manuscript. B.R. prepared manuscript.
Funding
This research received no external funding.
Acknowledgments
This study has been supported by FONDECYT projects 1170456 and 1151117 and a doctoral scholarships of Felipe Reyes and Yeanice Vásquez from CONICYT. We gratefully acknowledge the technical support provided by Mr. Alfonso Cádiz, Mr. Raul Albarrán and Mr. Marcelo Cornejo at the Center for Certification and Control of vehicles, Chile.
Conflicts of Interest
The authors declare no conflict of interest.
References
- Kim, K.H.; Kabir, E.; Kabir, S. A review on the human health impact of airborne particulate matter. Environ. Int. 2015, 74, 136–143. [Google Scholar] [CrossRef]
- Shi, L.; Zanobetti, A.; Kloog, I.; Coull, B.A.; Koutrakis, P.; Melly, S.J.; Schwartz, J.D. Low-Concentration PM2.5 and Mortality: Estimating Acute and Chronic Effects in a Population-Based Study. Environ. Health Perspect. 2016, 124, 46–52. [Google Scholar] [CrossRef]
- Anderson, J.O.; Thundiyil, J.G.; Stolbach, A. Clearing the Air: A Review of the Effects of Particulate Matter Air Pollution on Human Health. J. Med. Toxicol. 2012, 8, 166–175. [Google Scholar] [CrossRef]
- Pope, C.A.; Thun, M.J.; Namboodiri, M.M.; Dockery, D.W.; Evans, J.S.; Speizer, F.E.; Heath, C.W. Particulate air pollution as a predictor of mortality in a prospective study of U.S. adults. Am. J. Respir. Crit. Care Med. 1995, 151, 669–674. [Google Scholar] [CrossRef]
- Dockery, D.W.; Pope, C.A. Acute respiratory effects of particulate air pollution. Annu. Rev. Public Health 1994, 15, 107–132. [Google Scholar] [CrossRef]
- Dockery, D.W.; Pope, C.A.; Xu, X.; Spengler, J.D.; Ware, J.H.; Fay, M.E.; Ferris, B.G.; Speizer, F.E. An Association between Air Pollution and Mortality in Six U.S. Cities. N. Engl. J. Med. 1993, 329, 1753–1759. [Google Scholar] [CrossRef] [Green Version]
- Pope, C.A.; Burnett, R.T.; Thun, M.J.; Calle, E.E.; Krewski, D.; Ito, K.; Thurston, G.D. Lung Cancer, Cardiopulmonary Mortality, and Long-term Exposure to Fine Particulate Air Pollution. JAMA 2002, 287, 1132–1141. [Google Scholar] [CrossRef] [Green Version]
- Liu, Q.; Baumgartner, J.; Zhang, Y.; Liu, Y.; Sun, Y.; Zhang, M. Oxidative Potential and Inflammatory Impacts of Source Apportioned Ambient Air Pollution in Beijing. Environ. Sci. Technol. 2014, 48, 12920–12929. [Google Scholar] [CrossRef]
- Lippmann, M. Targeting the components most responsible for airborne particulate matter health risks. J. Expo. Sci. Environ. Epidemiol. 2010, 20, 117–118. [Google Scholar] [CrossRef] [Green Version]
- Lippmann, M.; Chen, L.C. Health effects of concentrated ambient air particulate matter (CAPs) and its components. Crit. Rev. Toxicol. 2009, 39, 865–913. [Google Scholar] [CrossRef]
- Frey, A.K.; Saarnio, K.; Lamberg, H.; Mylläri, F.; Karjalainen, P.; Teinilä, K.; Carbone, S.; Tissari, J.; Niemelä, V.; Häyrinen, A.; et al. Optical and Chemical Characterization of Aerosols Emitted from Coal, Heavy and Light Fuel Oil, and Small-Scale Wood Combustion. Environ. Sci. Technol. 2014, 48, 827–836. [Google Scholar] [CrossRef]
- Ministerio de Energía de Chile Balance Nacional de Energy de Chile (BNE) Año 2014. Available online: http://www.energia.gob.cl/content/bne-2014-balance-energia-global (accessed on 28 May 2019).
- Carbone, S.; Saarikoski, S.; Frey, A.; Reyes, F.; Reyes, P.; Castillo, M.; Gramsch, E.; Oyola, P.; Jayne, J.; Worsnop, D.R.; et al. Chemical Characterization of Submicron Aerosol Particles in Santiago de Chile. Aerosol Air Qual. Res. 2013, 13, 462–473. [Google Scholar] [CrossRef] [Green Version]
- Gramsch, E.; Reyes, F.; Vásquez, Y.; Oyola, P.; Rubio, M.A. Prevalence of Freshly Generated Particles during Pollution Episodes in Santiago de Chile. Aerosol Air Qual. Res. 2016, 16, 2172–2185. [Google Scholar] [CrossRef] [Green Version]
- Villalobos, A.M.; Barraza, F.; Jorquera, H.; Schauer, J.J. Chemical speciation and source apportionment of fine particulate matter in Santiago, Chile, 2013. Sci. Total Environ. 2015, 512–513, 133–142. [Google Scholar] [CrossRef]
- Díaz-Robles, L.; Cortés, S.; Vergara-Fernández, A.; Ortega, J.C. Short Term Health Effects of Particulate Matter: A Comparison between Wood Smoke and Multi-Source Polluted Urban Areas in Chile. Aerosol Air Qual. Res. 2015, 15, 306–318. [Google Scholar] [CrossRef] [Green Version]
- Díaz-Robles, L.A.; Fu, J.S.; Vergara-Fernández, A.; Etcharren, P.; Schiappacasse, L.N.; Reed, G.D.; Silva, M.P. Health risks caused by short term exposure to ultrafine particles generated by residential wood combustion: A case study of Temuco, Chile. Environ. Int. 2014, 66, 174–181. [Google Scholar] [CrossRef]
- Díaz-Robles, L.A.; Ortega, J.C.; Fu, J.S.; Reed, G.D.; Chow, J.C.; Watson, J.G.; Moncada-Herrera, J.A. A hybrid ARIMA and artificial neural networks model to forecast particulate matter in urban areas: The case of Temuco, Chile. Atmos. Environ. 2008, 42, 8331–8340. [Google Scholar] [CrossRef] [Green Version]
- Kavouras, I.G.; Koutrakis, P.; Cereceda-Balic, F.; Oyola, P. Source Apportionment of PM10 and PM2.5 in Five Chilean Cities Using Factor Analysis. J. Air Waste Manag. Assoc. 2001, 51, 451–464. [Google Scholar] [CrossRef]
- Calvo, A.I.; Tarelho, L.A.C.; Alves, C.A.; Duarte, M.; Nunes, T. Characterization of operating conditions of two residential wood combustion appliances. Fuel Process. Technol. 2014, 126, 222–232. [Google Scholar] [CrossRef]
- Obaidullah, M.; Bram, S.; Verma, V.K.; Ruyck, J.D. A Review on Particle Emissions from Small Scale Biomass Combustion. Int. J. Renew. Energy Res. 2012, 2, 147–159. [Google Scholar]
- Bäfver, L.S.; Leckner, B.; Tullin, C.; Berntsen, M. Particle emissions from pellets stoves and modern and old-type wood stoves. Biomass Bioenergy 2011, 35, 3648–3655. [Google Scholar] [CrossRef]
- Toscano, G.; Duca, D.; Amato, A.; Pizzi, A. Emission from realistic utilization of wood pellet stove. Energy 2014, 68, 644–650. [Google Scholar] [CrossRef]
- Seinfeld, J.H.; Pandis, S.N. Atmospheric Chemistry and Physics: From Air Pollution to Climate Change; Wiley: Hoboken, NJ, USA, 2012; ISBN 978-1-118-59150-5. [Google Scholar]
- Cubison, M.J.; Ortega, A.M.; Hayes, P.L.; Farmer, D.K.; Day, D.; Lechner, M.J.; Brune, W.H.; Apel, E.; Diskin, G.S.; Fisher, J.A.; et al. Effects of aging on organic aerosol from open biomass burning smoke in aircraft and laboratory studies. Atmos. Chem. Phys. 2011, 11, 12049–12064. [Google Scholar] [CrossRef] [Green Version]
- Hennigan, C.J.; Miracolo, M.A.; Engelhart, G.J.; May, A.A.; Presto, A.A.; Lee, T.; Sullivan, A.P.; McMeeking, G.R.; Coe, H.; Wold, C.E.; et al. Chemical and physical transformations of organic aerosol from the photo-oxidation of open biomass burning emissions in an environmental chamber. Atmos. Chem. Phys. 2011, 11, 7669–7686. [Google Scholar] [CrossRef] [Green Version]
- Jimenez, J.L.; Canagaratna, M.R.; Donahue, N.M.; Prevot, A.S.H.; Zhang, Q.; Kroll, J.H.; DeCarlo, P.F.; Allan, J.D.; Coe, H.; Ng, N.L.; et al. Evolution of Organic Aerosols in the Atmosphere. Science 2009, 326, 1525–1529. [Google Scholar] [CrossRef]
- Robinson, A.L.; Donahue, N.M.; Shrivastava, M.K.; Weitkamp, E.A.; Sage, A.M.; Grieshop, A.P.; Lane, T.E.; Pierce, J.R.; Pandis, S.N. Rethinking Organic Aerosols: Semivolatile Emissions and Photochemical Aging. Science 2007, 315, 1259–1262. [Google Scholar] [CrossRef]
- Kang, C.M.; Gupta, T.; Ruiz, P.A.; Wolfson, J.M.; Ferguson, S.T.; Lawrence, J.E.; Rohr, A.C.; Godleski, J.; Koutrakis, P. Aged particles derived from emissions of coal-fired power plants: The TERESA field results. Inhal. Toxicol. 2011, 23, 11–30. [Google Scholar] [CrossRef]
- Ruiz, P.A.; Lawrence, J.E.; Wolfson, J.M.; Ferguson, S.T.; Gupta, T.; Kang, C.M.; Koutrakis, P. Development and evaluation of a photochemical chamber to examine the toxicity of coal-fired power plant emissions. Inhal. Toxicol. 2007, 19, 597–606. [Google Scholar] [CrossRef]
- Papapostolou, V.; Lawrence, J.E.; Diaz, E.A.; Wolfson, J.M.; Ferguson, S.T.; Long, M.S.; Godleski, J.J.; Koutrakis, P. Laboratory evaluation of a prototype photochemical chamber designed to investigate the health effects of fresh and aged vehicular exhaust emissions. Inhal. Toxicol. 2011, 23, 495–505. [Google Scholar] [CrossRef] [Green Version]
- Centro Mario Molina Chile. Health and Environmental Impacts of Exhaust from Biofuels; Inter-American Development Bank IDB: Washington, DC, USA, 2015. [Google Scholar]
- Gramsch, E.; Papapostolou, V.; Reyes, F.; Vásquez, Y.; Castillo, M.; Oyola, P.; López, G.; Cádiz, A.; Ferguson, S.; Wolfson, M.; et al. Variability in the primary emissions and secondary gas and particle formation from vehicles using bioethanol mixtures. J. Air Waste Manag. Assoc. 2018, 68, 329–346. [Google Scholar] [CrossRef]
- Cocker, D.R.; Flagan, R.C.; Seinfeld, J.H. State-of-the-Art Chamber Facility for Studying Atmospheric Aerosol Chemistry. Environ. Sci. Technol. 2001, 35, 2594–2601. [Google Scholar] [CrossRef]
- Carter, W.; Luo, D.; Malkina, I.; Pierce, J. Environmental Chamber Studies of Atmospheric Reactivities of Volatile Organic Compounds: Effects of Varying Chamber and Light Source; National Renewable Energy Lab.: Golden, CO, USA; California University: Riverside, CA, USA, 1995. [Google Scholar]
- Ng, N.L.; Herndon, S.C.; Trimborn, A.; Canagaratna, M.R.; Croteau, P.L.; Onasch, T.B.; Sueper, D.; Worsnop, D.R.; Zhang, Q.; Sun, Y.L.; et al. An Aerosol Chemical Speciation Monitor (ACSM) for Routine Monitoring of the Composition and Mass Concentrations of Ambient Aerosol. Aerosol Sci. Technol. 2011, 45, 780–794. [Google Scholar] [CrossRef]
- Mitchell, E.J.S.; Lea-Langton, A.R.; Jones, J.M.; Williams, A.; Layden, P.; Johnson, R. The impact of fuel properties on the emissions from the combustion of biomass and other solid fuels in a fixed bed domestic stove. Fuel Process. Technol. 2016, 142, 115–123. [Google Scholar] [CrossRef]
- von Schneidemesser, E.; Monks, P.S.; Plass-Duelmer, C. Global comparison of VOC and CO observations in urban areas. Atmos. Environ. 2010, 44, 5053–5064. [Google Scholar] [CrossRef]
- Ozil, F.; Tschamber, V.; Haas, F.; Trouvé, G. Efficiency of catalytic processes for the reduction of CO and VOC emissions from wood combustion in domestic fireplaces. Fuel Process. Technol. 2009, 90, 1053–1061. [Google Scholar] [CrossRef]
- McDonald, J.D.; Zielinska, B.; Fujita, E.M.; Sagebiel, J.C.; Chow, J.C.; Watson, J.G. Fine Particle and Gaseous Emission Rates from Residential Wood Combustion. Environ. Sci. Technol. 2000, 34, 2080–2091. [Google Scholar] [CrossRef]
- Ridley, B.A.; Shetter, J.D.; Gandrud, B.W.; Salas, L.J.; Singh, H.B.; Carroll, M.A.; Hübler, G.; Albritton, D.L.; Hastie, D.R.; Schiff, H.I.; et al. Ratios of peroxyacetyl nitrate to active nitrogen observed during aircraft flights over the eastern Pacific Oceans and continental United States. J. Geophys. Res. Atmos. 1990, 95, 10179–10192. [Google Scholar] [CrossRef]
- Perros, P.E. Large-scale distribution of peroxyacetylnitrate from aircraft measurements during the TROPOZ II experiment. J. Geophys. Res. Atmos. 1994, 99, 8269–8279. [Google Scholar] [CrossRef]
- Rappenglück, B.; Oyola, P.; Olaeta, I.; Fabian, P. The Evolution of Photochemical Smog in the Metropolitan Area of Santiago de Chile. J. Appl. Meteor. 2000, 39, 275–290. [Google Scholar] [CrossRef]
- Elshorbany, Y.F.; Kurtenbach, R.; Wiesen, P.; Lissi, E.; Rubio, M.; Villena, G.; Gramsch, E.; Rickard, A.R.; Pilling, M.J.; Kleffmann, J. Oxidation capacity of the city air of Santiago, Chile. Atmos. Chem. Phys. 2009, 9, 2257–2273. [Google Scholar] [CrossRef] [Green Version]
- Ortega, A.M.; Day, D.A.; Cubison, M.J.; Brune, W.H.; Bon, D.; de Gouw, J.A.; Jimenez, J.L. Secondary organic aerosol formation and primary organic aerosol oxidation from biomass-burning smoke in a flow reactor during FLAME-3. Atmos. Chem. Phys. 2013, 13, 11551–11571. [Google Scholar] [CrossRef] [Green Version]
- Papapostolou, V.; Lawrence, J.E.; Ferguson, S.T.; Wolfson, J.M.; Diaz, E.A.; Godleski, J.J.; Koutrakis, P. Development and characterization of an exposure generation system to investigate the health effects of particles from fresh and aged traffic emissions. Air Qual. Atmos. Health 2013, 6, 419–429. [Google Scholar] [CrossRef]
- Rollins, A.W.; Smith, J.D.; Wilson, K.R.; Cohen, R.C. Real Time in Situ Detection of Organic Nitrates in Atmospheric Aerosols. Environ. Sci. Technol. 2010, 44, 5540–5545. [Google Scholar] [CrossRef]
- Yee, L.D.; Kautzman, K.E.; Loza, C.L.; Schilling, K.A.; Coggon, M.M.; Chhabra, P.S.; Chan, M.N.; Chan, A.W.H.; Hersey, S.P.; Crounse, J.D.; et al. Secondary organic aerosol formation from biomass burning intermediates: Phenol and methoxyphenols. Atmos. Chem. Phys. 2013, 13, 8019–8043. [Google Scholar] [CrossRef]
- Alfarra, M.R.; Coe, H.; Allan, J.D.; Bower, K.N.; Boudries, H.; Canagaratna, M.R.; Jimenez, J.L.; Jayne, J.T.; Garforth, A.A.; Li, S.M.; et al. Characterization of urban and rural organic particulate in the Lower Fraser Valley using two Aerodyne Aerosol Mass Spectrometers. Atmos. Environ. 2004, 38, 5745–5758. [Google Scholar] [CrossRef] [Green Version]
- Ng, N.L.; Canagaratna, M.R.; Jimenez, J.L.; Chhabra, P.S.; Seinfeld, J.H.; Worsnop, D.R. Changes in organic aerosol composition with aging inferred from aerosol mass spectra. Atmos. Chem. Phys. 2011, 11, 6465–6474. [Google Scholar] [CrossRef] [Green Version]
- Alfarra, M.R.; Prevot, A.S.H.; Szidat, S.; Sandradewi, J.; Weimer, S.; Lanz, V.A.; Schreiber, D.; Mohr, M.; Baltensperger, U. Identification of the Mass Spectral Signature of Organic Aerosols from Wood Burning Emissions. Environ. Sci. Technol. 2007, 41, 5770–5777. [Google Scholar] [CrossRef]
Figure 1.
Photochemical chamber set up. The whole experiment was located inside a laboratory of the Center for Vehicle Control and Certification.
Figure 1.
Photochemical chamber set up. The whole experiment was located inside a laboratory of the Center for Vehicle Control and Certification.

Figure 2.
NO, NO2, and O3 concentrations and irradiation time in the firewood and pellet experiments (UV irradiation of filtered emissions).
Figure 2.
NO, NO2, and O3 concentrations and irradiation time in the firewood and pellet experiments (UV irradiation of filtered emissions).

Figure 3.
Mass (a) and number (b) of secondary particles during UV irradiation of pellet and wood combustion emissions, respectively.
Figure 3.
Mass (a) and number (b) of secondary particles during UV irradiation of pellet and wood combustion emissions, respectively.

Figure 4.
Evolution of particle number (a,c) and mass size distribution (b,d) during the UV irradiation of filtered emissions for pellet (first row) and wood (second row) combustion.
Figure 4.
Evolution of particle number (a,c) and mass size distribution (b,d) during the UV irradiation of filtered emissions for pellet (first row) and wood (second row) combustion.

Figure 5.
Average of several experiments in Chemical composition of PM1.0 non-refractory particles during UV irradiation. (a) Filtered emissions for wood from 20 to 40 min. of irradiation (b) Filtered emissions for wood from 40 to 120 min. (c) Emissions from pellets (20 to 40 min.) (d) Emissions from pellets for 40 to 120 min.

Figure 6.
NO consumption as a function of UV irradiation time for (a) wood and (b) pellet experiments. NO concentration is normalized to the initial concentration.
Figure 6.
NO consumption as a function of UV irradiation time for (a) wood and (b) pellet experiments. NO concentration is normalized to the initial concentration.

Figure 7.
Particle number size distribution over irradiation time for the pellet and wood experiments.
Figure 7.
Particle number size distribution over irradiation time for the pellet and wood experiments.

Figure 8.
(a) f44 (dominated by the CO2+ ion) vs. f43 (dominated by primary organic aerosols (POA)) for all wood experiments (b) for pellet experiments. The evolution with time of the factors is shown with the red arrow [25,50].

Figure 9.
(a) f44 (dominated by the CO2+ ion) vs. f60 (dominated by levoglucosan) for all wood experiments (b) for pellet experiments. The evolution of the factors with time is shown with the red arrow [25,50].


Table 1.
Characteristics of the combustion devices.
| Device Model | Memo, RIKA | Wamsler KF 108-Primo |
|---|---|---|
| Fuel | Wood pellet | Firewood |
| Rated power (kW) | 9 (adjustable) | 7 |
| Range of rated power (kW) | 2.4–9.0 | ----- |
| Fuel consumption rate (kg/h) | 0.5–2.2 | 2 |
| CO (mg/MJ) | 24 | 1218 |
| NOx (mg/MJ) | 83 | 63 |
| CnHn * (mg/MJ) | 2 | 51 |
| PM (mg/MJ) | 15 | 35 |
| Gas temperature (°C) | 140 | 220.7 |
* CnHn indicate hydrocarbon emissions.
Table 2.
Monitors used; models, manufacturers, quantification ranges. ACSM: aerosol chemical speciation monitor; DMPS: differential mobility particle sizer.
Table 2.
Monitors used; models, manufacturers, quantification ranges. ACSM: aerosol chemical speciation monitor; DMPS: differential mobility particle sizer.
| Monitor | Manufacturer | Model | Quantification Range |
|---|---|---|---|
| CO | Thermo Scientific, Waltham, MA, USA | 48i | 0.04 to 100 ppm |
| NOX | Thermo Scientific, Waltham, MA, USA | 42i | 50 ppt to 200 ppb |
| O3 | 2B Technologies, Inc. Boulder, CO, USA | 106-L | 4–100,000 ppb |
| ACSM | Aerodyne Research Inc. Billerica, MA, USA | ---- | Organics: 0.3 to 100 µg/m3 Sulfate: 0.04 to 100 µg/m3 Nitrate: 0.02 to 100 µg/m3 Ammonia: 0.5 to 100 µg/m3 Chloride: 0.02 to 100 µg/m3 |
| DMPS | TSI Inc. Shoreview, MN, USA | 3010 | 1 to 10,000 particles/cm3 |
Table 3.
NO and NOx concentrations for several unfiltered experiments as well as the time to reach the maximum concentration.
Table 3.
NO and NOx concentrations for several unfiltered experiments as well as the time to reach the maximum concentration.
| Fuel | Experiment | Initial NOx Concentration (ppb) | Time to Reach Max NO2 Concentration (min) | NO2tmax/NO2° |
|---|---|---|---|---|
| Wood | (a) | 993 | 75 | 10 |
| Wood | (b) | 260 | 50 | 6.3 |
| Wood | (c) | 66 | 23 | 3.3 |
| Wood | (d) | 1691 | 108 | 14.9 |
| Pellet | (a) | 204 | 137 | 6.7 |
| Pellet | (b) | 986 | 179 | 10.6 |
| Pellet | (c) | 1517 | >400 | ~15 |
© 2019 by the authors. Licensee MDPI, Basel, Switzerland. This article is an open access article distributed under the terms and conditions of the Creative Commons Attribution (CC BY) license (http://creativecommons.org/licenses/by/4.0/).
Share and Cite
MDPI and ACS Style
Reyes, F.; Vasquez, Y.; Gramsch, E.; Oyola, P.; Rappenglück, B.; Rubio, M.A. Photooxidation of Emissions from Firewood and Pellet Combustion Using a Photochemical Chamber. Atmosphere 2019, 10, 575. https://doi.org/10.3390/atmos10100575
AMA Style
Reyes F, Vasquez Y, Gramsch E, Oyola P, Rappenglück B, Rubio MA. Photooxidation of Emissions from Firewood and Pellet Combustion Using a Photochemical Chamber. Atmosphere. 2019; 10(10):575. https://doi.org/10.3390/atmos10100575
Chicago/Turabian StyleReyes, Felipe, Yeanice Vasquez, Ernesto Gramsch, Pedro Oyola, Bernhard Rappenglück, and María A. Rubio. 2019. "Photooxidation of Emissions from Firewood and Pellet Combustion Using a Photochemical Chamber" Atmosphere 10, no. 10: 575. https://doi.org/10.3390/atmos10100575
Note that from the first issue of 2016, this journal uses article numbers instead of page numbers. See further details here.