Visualization of Climate Factors for Sports Events and Activities–The Tokyo 2020 Olympic Games


1
Research Centre Human Biometeorology, Deutscher Wetterdienst, D-79104 Freiburg, Germany
2
Chair of Environmental Meteorology, Albert-Ludwigs-University Freiburg, Werthmannstr. 10, D-79085 Freiburg, Germany
3
Health & Science Department, IAAF. 6-8, Quai Antoine 1er, BP 359, MC 98000 Monaco Cedex
4
LAMHESS, Université Côte d’Azur, 06205 Nice, France
5
Department of Movement, Human and Health Sciences, University of Rome “Foro Italico”, 00100 Rome, Italy
*
Author to whom correspondence should be addressed.
Atmosphere 2019, 10(10), 572; https://doi.org/10.3390/atmos10100572
Submission received: 31 July 2019
/
Revised: 9 September 2019
/
Accepted: 14 September 2019
/
Published: 23 September 2019
(This article belongs to the Section Biometeorology)
Abstract
:Detailed climate information in an easily interpretable form is demanded by the general public, as well as by decision-makers on different planning levels. One example is the group of planners in the field of sports and tourism. A promising approach is the visualization of climate thresholds in a Climate-Tourism/Transfer-Information Scheme (CTIS) for the prevailing local climate conditions. The presented approach is adaptable to specific destinations and target activities and integrates meteorological, as well as recreational, touristic and specific activity-related parameters and thresholds. All parameters are simplified in terms of factors and combined in one individual graph, the CTIS diagram. The detailed information on local climate can be applied by non-experts like tourists intending to attend a sports event. They are able to prepare for different aspects of the local climate by, e.g., selecting appropriate clothing when planning their stay. The example of the Tokyo 2020 Olympic Games is presented and discussed. Results show that heat stress together with sultriness is likely to occur during the scheduled time of the Olympics, while cold stress will most probably not be relevant.
1. Introduction
Spectators of sports events and tourists in general are exposed to unaccustomed or sometimes extreme meteorological and climatological conditions, which may affect them in a positive or negative way [1,2,3,4,5]. In addition, activities during events for athletes and visitors can be driven and affected by mean and extreme climate conditions [6]. These conditions, as well as general information about the climatic setting, need to cover the patterns of meteorological parameters and significant climate at an appropriate temporal resolution [1]. The relationship of and interactions between climate and tourism are well studied. However, most methodologies applied in the past have been of a qualitative manner. Recent research has often focused on quantifying the effect of strategies counteracting the local effect of global climate change (e.g., [7]). Interdisciplinary approaches are required to assess the effects on tourism (e.g., [8]).
The interactions between weather, climate, and tourism are well known and have been previously described [5,7,8,9,10,11,12,13,14]. Growing attention has recently been paid mostly to sustainable tourism (e.g., [7]) but less to specific events and the effect on athletes and visitors [1,15]. This has been considered by approaches like the Climate Index for Tourism [13,14], as well as the Climate-Tourism/Transfer-Information-Scheme (CTIS) [16], that allow the results provided by recent science in the field of human biometeorology and tourism climatology to be quantified [16].
Impacts of climate on touristic activities cannot be assessed by analyzing only air temperature and precipitation. Recent methodologies have allowed for an assessment considering various facets of biometeorology (thermal aspects and aesthetical, as well as physiological, facets) [16]. The thermal aspects of climate can only be assessed using complex thermal indices based on the human energy balance, e.g., the physiologically equivalent temperature (PET) [17]. It summarizes the effect of the prevailing climate on a human being for cold, as well as for hot, conditions. The result can be considered as an assessment of thermal perception [17]. The aesthetical, as well as physical, facet can be analyzed by the assessment of individual meteorological parameters, e.g., the daily sunshine duration [8,9,10].
The aim of this study is to detect the appropriate and inappropriate periods of time in terms of human thermal comfort, to enable the development and implementation of necessary countermeasures in time to minimize or totally avoid unpleasant impacts. At the same time, the methodology is provided to enable members of planning and organizing committees and other responsible persons to apply this approach to other locations. Unlike in previous works, the study presented here is not based on individual meteorological parameters affecting human thermal comfort like air temperature (Ta) and is not restricted to a coarse temporal resolution of monthly data. The analysis is rather based on the variability of a complex thermal index (PET) at a high temporal resolution of 3 h and a long meteorological dataset of almost 52 y. The methodology is designed to provide results assisting in the organization and planning of sporting events in various different climates and cultures [15]. The results are presented in figures that can easily be interpreted by non-experts in terms of human thermal comfort, e.g., people responsible for the planning of sports events.
The present study describes a method to process, assess, and present meteorological data. The analysis of selected factors of climate targeting tourism is presented for the example of Tokyo.
2. Methodology and Data
2.1. Study Area
The agglomeration of Tokyo is located in the eastern center of the Japanese main island Honshū at approximately 35°41′ N and 139°45′ E. The Japanese capital city together with the “Greater Tokyo Area” surrounding the “Bay of Tokyo” is considered to exceed 38 million inhabitants. The local climate with hot, perhumid summers and cool, humid winters is classified as “temperate–humid” by the Köppen climate classification. The region experiences a one-month seasonal lag with the warmest month, on average, being August (with an average maximum Ta of 29.9 °C). The coldest month is January with an average minimum Ta of 3.2 °C (see [15]). Precipitation in terms of snow is sporadic but is recorded almost every year. The overall average Ta is 16.3 °C. Tokyo is hit by (mostly weak) typhoons almost every year. With an average sum of annual precipitation of 2546 mm, the city does receive a lot of precipitation. The wettest month in Tokyo, therefore, is September (333.6 mm), while the least monthly precipitation is recorded in January (88.4 mm).
2.2. Methods
2.2.1. Physiologically Equivalent Temperature (PET)
The assessment of human thermal comfort does require complex thermal indices [12], mostly relying on the evaluation of the energy balance for a sample human. Popular examples for thermal indices for the assessment of human thermal perception are Fanger’s predicted mean vote [18], PET [17], or the standard effective temperature [19], as already applied in several studies [20,21,22]. They do combine meteorological parameters and physiological aspects of the human body, e.g., the person’s age, height, weight, activity or workload, and the current clothing insulation. To consider the effect of wind speed on the energy exchange between the human body and its environment, the measured wind speed readings need to be transferred from the height at which they were recorded (usually 10 m above ground level) to the reference height of 1.1 m representing the gravimetric center of an average human body [18].
The Physiologically Equivalent Temperature (PET) is one of the most commonly applied thermal indexes applied in all kinds of studies dealing with human thermal comfort. It is defined “as the air temperature at which, in a typical indoor setting (without wind and solar radiation), the energy balance of the human body is balanced with the same core and skin temperature as under the complex outdoor conditions to be assessed” [17]. The frequent application of PET (e.g., [20,21,22]) allows for the results to be compared easily to findings by other studies [1]. PET also has the advantage of using °C as a unit. This makes it easy to interpret the results for people without any knowledge of human thermal comfort. The thermal effect of the environment in PET is considered based on the “Munich energy balance model for individuals” (MEMI) [23,24]. One of the most important input parameters in the estimation of PET is the “mean radiant temperature” (Tmrt). This especially holds during summer at daytime [1]. Tmrt is defined as “the temperature of a perfect black and equal surrounding environment, which leads to the same energy balance as the current environment” [18].
2.2.2. RayMan Model
RayMan is a micro-scale model that is applied for analyzing the long-term development of thermal comfort in this study. RayMan has been developed to calculate “radiation fluxes in simple and complex environments” [25,26]. This allows for the estimation of the mean radiant temperature, which can be used to calculate thermal bioclimatic indices, e.g., PET [17]. The RayMan model performs calculations meeting the requirements by the German VDI-Guidelines 3789 Part II [27] and VDI-Guidelines 3787 Part I [28]. The model has been developed for use in the field of biometeorology and urban climatology, but can be applied in tourism studies as well. Results in terms of PET are partly presented and classified into nine classes of thermal perception (Table 1) [29].
2.2.3. Meteorological Data
Meteorological data covering the time from August 1966 to June 2018 at a temporal resolution of 3 h recorded at WMO meteorological station 47662 in Tokyo provided by the synoptic database were used in this study. The station is located at 35°41′30″ N, 139°45′04″ E on a hill with a terrain height of 25.2 m surrounded by an urban park. The station was selected for its location in the central district of Chiyoda as its data are considered the best-possible representative. Wind speed was measured at an anemometer height of 10 m above ground level and was altitude-corrected to a target height of 1.1 m based on a power-law profile also applied in [30]. The altitude-corrected wind speed does range from 0.0 to 33.3 m/s with a most frequent incident daytime wind direction of North to North-Northwest and South and North-Northwest to North, as well as South to Southwest, during the night. Air temperature, vapor pressure, and global radiation were used without altitude correction as they were measured at a 2 m height and, thus, the difference to the destination height was too small to cause relevant uncertainties.
2.2.4. CTIS
Quantification and visualization of the different facets of climate in tourism can be done by applying an approach based on thresholds of different meteorological parameters, the “Climate-Tourism/Transfer-Information-Scheme” (CTIS) [16]. The method combines meteorological aspects with components related to tourism and integrates the information into one simple graph. The factors to be included in the CTIS do obviously differ from one climate region to another. The definitions of the several threshold values, therefore, do not necessarily correspond to the universal meteorological threshold values. For example, a “stormy day” is defined in meteorology as a day with a wind strength of 8 bft or stronger, corresponding to a wind speed exceeding 17.2 m/s. In tourism climatology, however, a wind speed of 8 m/s is considered to be perceived as unpleasant and uncomfortable. Furthermore, the relevant parameters themselves will vary as, e.g., tourists or attendees of winter sport events will prefer snow, while others, e.g., attending events in hot and dry climates, prefer to avoid heat stress. The selection of parameters and thresholds is thus based on the target region or event and should be adjusted to different climate regions and cultures [1,5,8].
For Tokyo, the following parameters and thresholds have been selected: In the diagram, “Thermal comfort” is counted if the PET ranges from 13 to 29 °C, and the result is thus part of the classes of slight cold stress to slight heat stress according to Table 1. “Heat stress” in terms of the CTIS diagram is counted if the PET exceeds 35 °C. In this study, both the classes of strong and extreme heat stress are counted as heat stress for people standing closely together for a long time (spectators), and people with a high workload (athletes) will suffer from heat stress earlier. “Cold stress” is counted if the PET is 4 °C or less, translating to extreme cold stress according to Table 1. Only the lowest class is selected here as countermeasures can easily be taken by adding more clothing layers. For the meteorological parameters, “Sunny days” are considered as days without precipitation. Tourists usually prefer fair weather. Therefore, more sun together with few clouds is considered more suitable in the diagram. “Days with fog” are defined by a relative humidity (RH) exceeding 93%. “Wet days” are counted for precipitation more than 5 mm, while “Dry days” must have a total precipitation of less than 1 mm. “Sultriness” is based on a vapor pressure greater than 18 hPa and “Stormy days” are defined by a wind speed more than 8 m/s. Ranges of PET are adjusted to meet the thermal perception classification for humans, which is presented in Table 1.
For the easiest interpretation, a probability scale in terms of a suitability factor is applied in the CTIS [16]. It comprises of 20 classes ranging from “unsuitable” to “ideal,” which is 5% of the probability for each incorporated class. Some factors are thereby considered positive (more counts will increase suitability). Others are considered negative, resulting in an inverted assessment scale for those parameters. For Tokyo, “Thermal comfort,” “Sunny days,” and “Dry days” are considered positive. ”Ideal”, therefore, relates to a lot of, e.g., thermal comfort, while the opposite holds for “Heat stress,” “Cold stress,” “Foggy days,” “Rainy days,” “Sultriness,” and “Stormy days.”
3. Results
In this section, the thermal conditions in Tokyo throughout the year are described based on the thermal index PET to provide an overview over thermal comfort and stress for each decade. Another important factor for tourists and athletes is precipitation, which is analyzed in detail below. Finally, the overall suitability of climatological conditions for tourism and outdoor sports are visualized according to the CTIS.
3.1. Frequencies of PET Classes
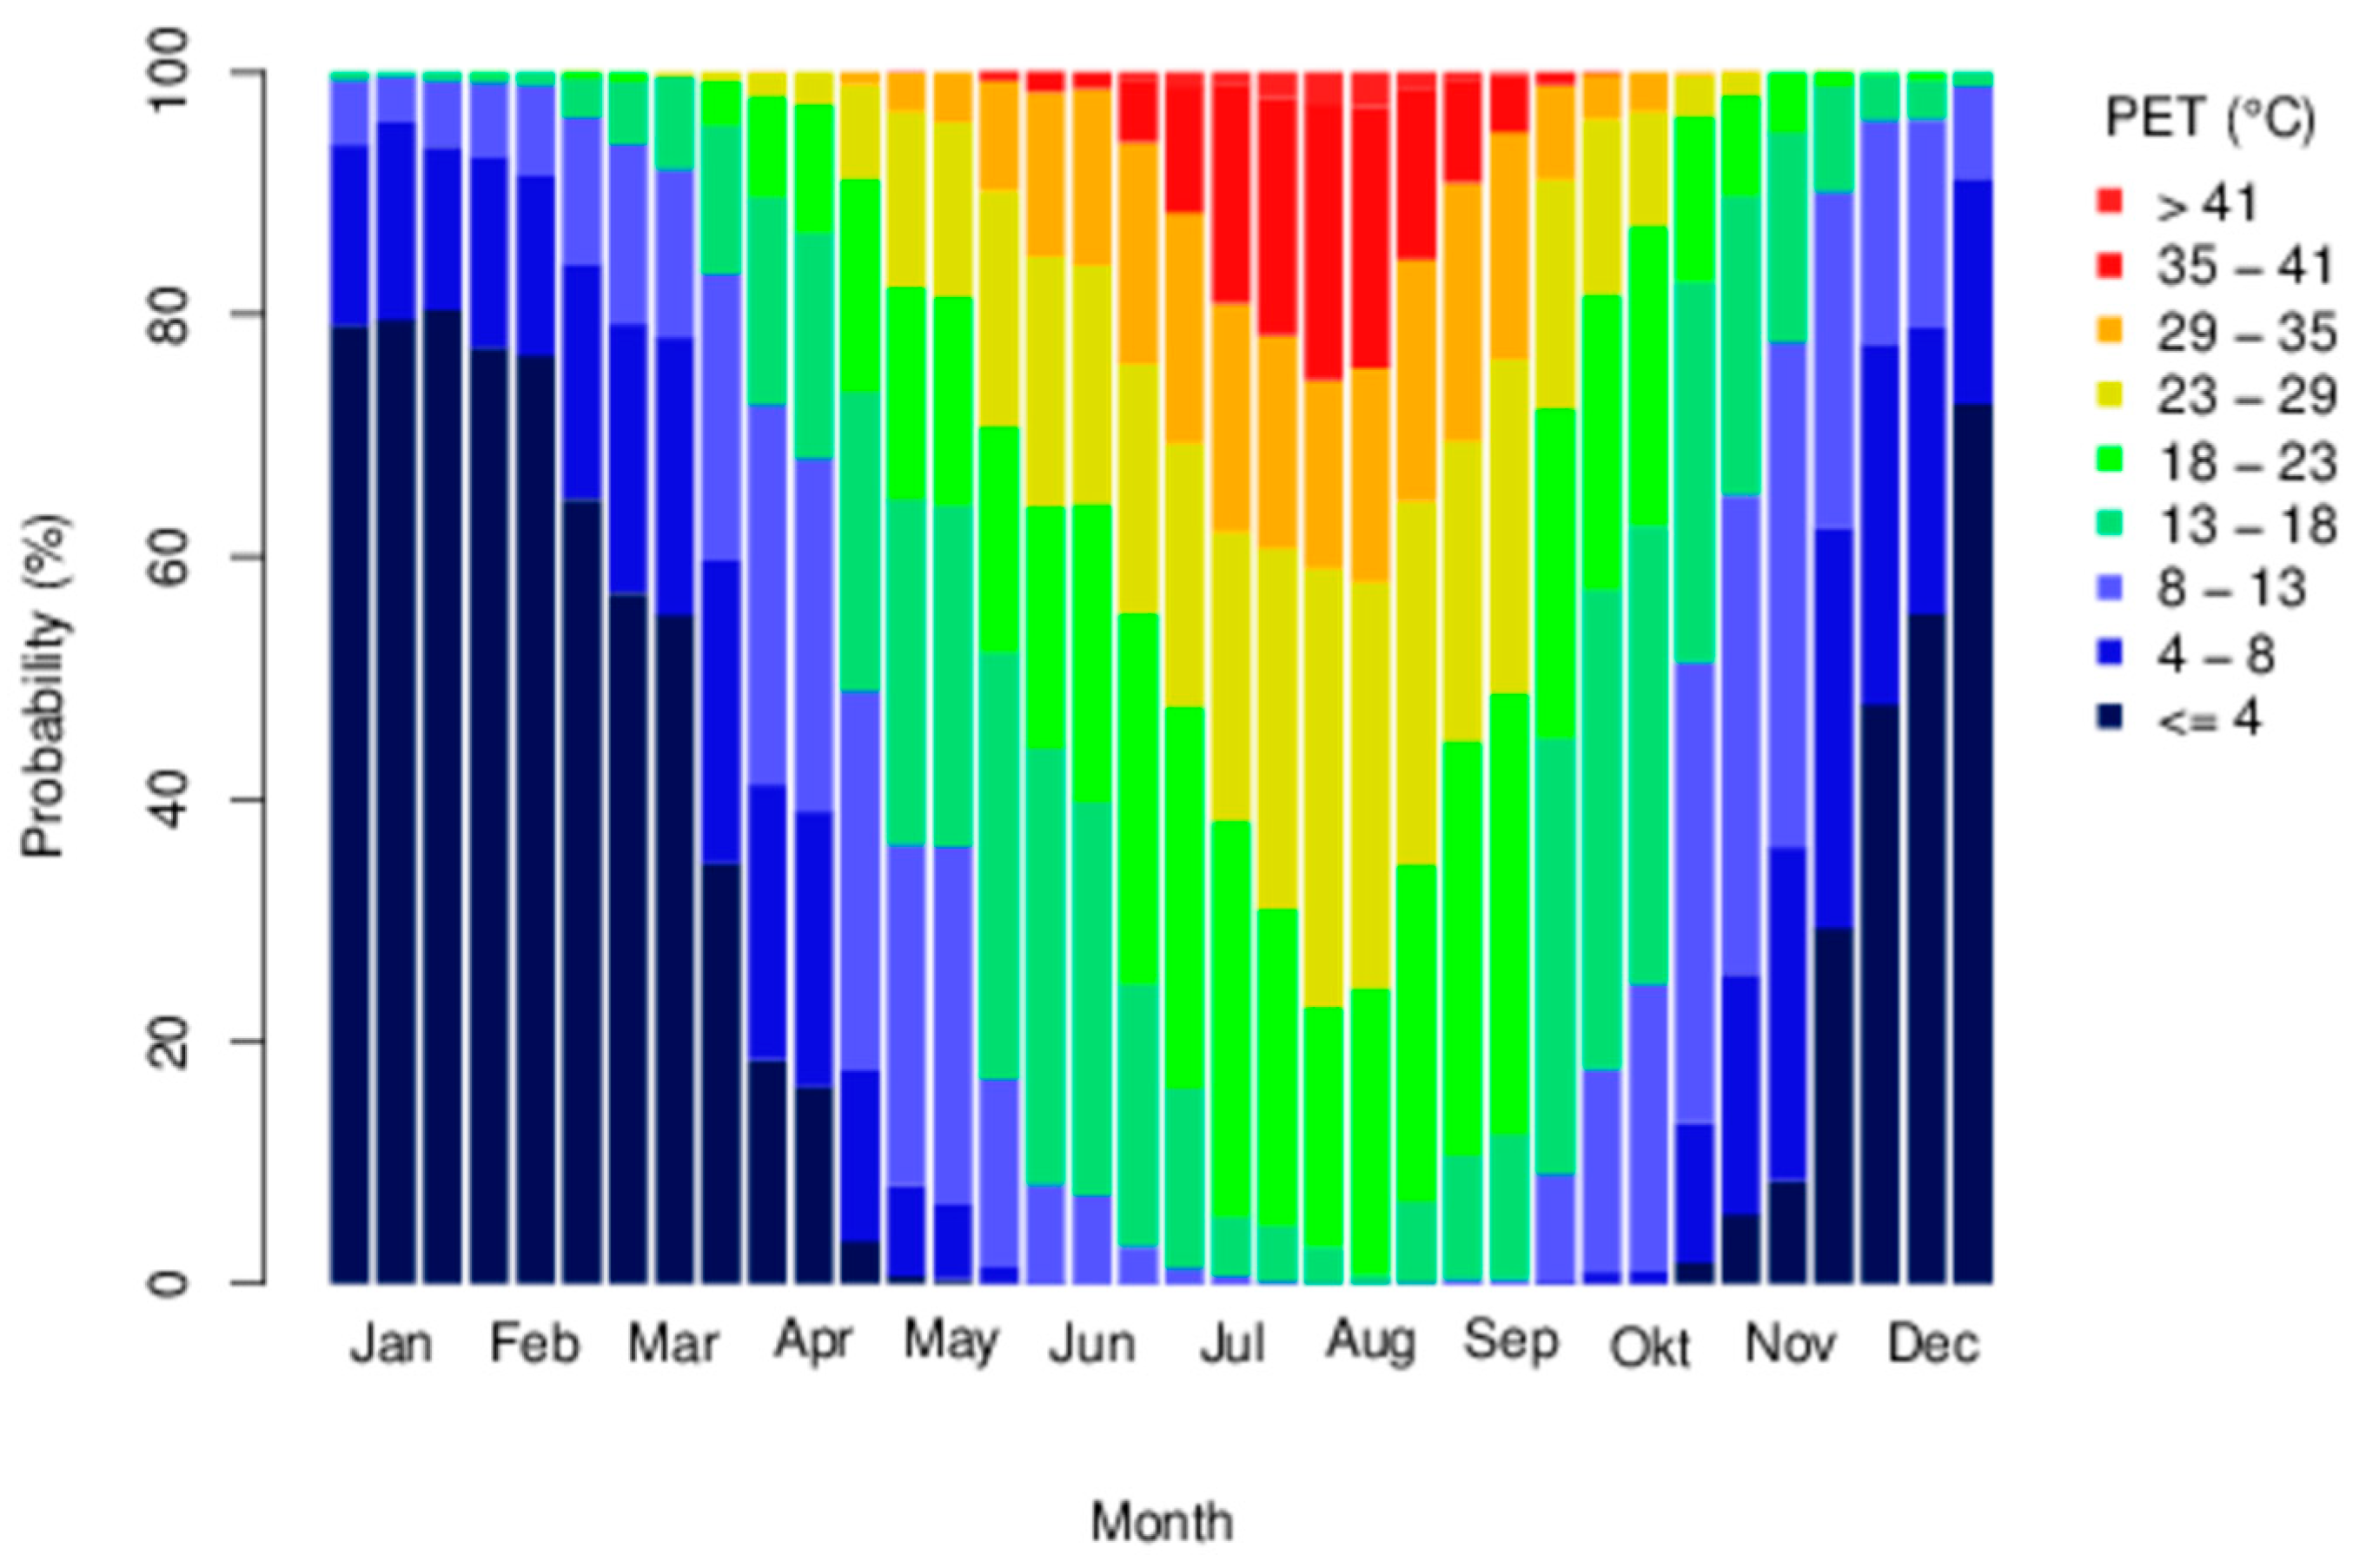
The annual distribution of thermal comfort in a general form can easily be visualized by a frequency-distribution plot showing the probability for ranges of PET for each decade of the year (Figure 1). The ranges of PET results, therefore, do match the ranges of the thermal perception classification provided by Table 1 to facilitate the interpretation.
Looking at Figure 1, one can see that the winter decades belonging to the months from December to February are dominated by classes of PET less than 13 °C, indicating cold stress. The most frequent comfortable conditions in terms of the classes 13–18 °C, 18–23 °C, and 23–29 °C can be found in the last decade of May to the end of June and in September. From the end of June to mid-September, conditions with heat stress (PET of at least 35 °C) can be found and exceed 22% of all readings in the first decade of August. When interpreting Figure 1, it needs to be considered that the figure comprises of day- and night-time conditions. The overall conditions, therefore, appear cooler than experienced on-site.
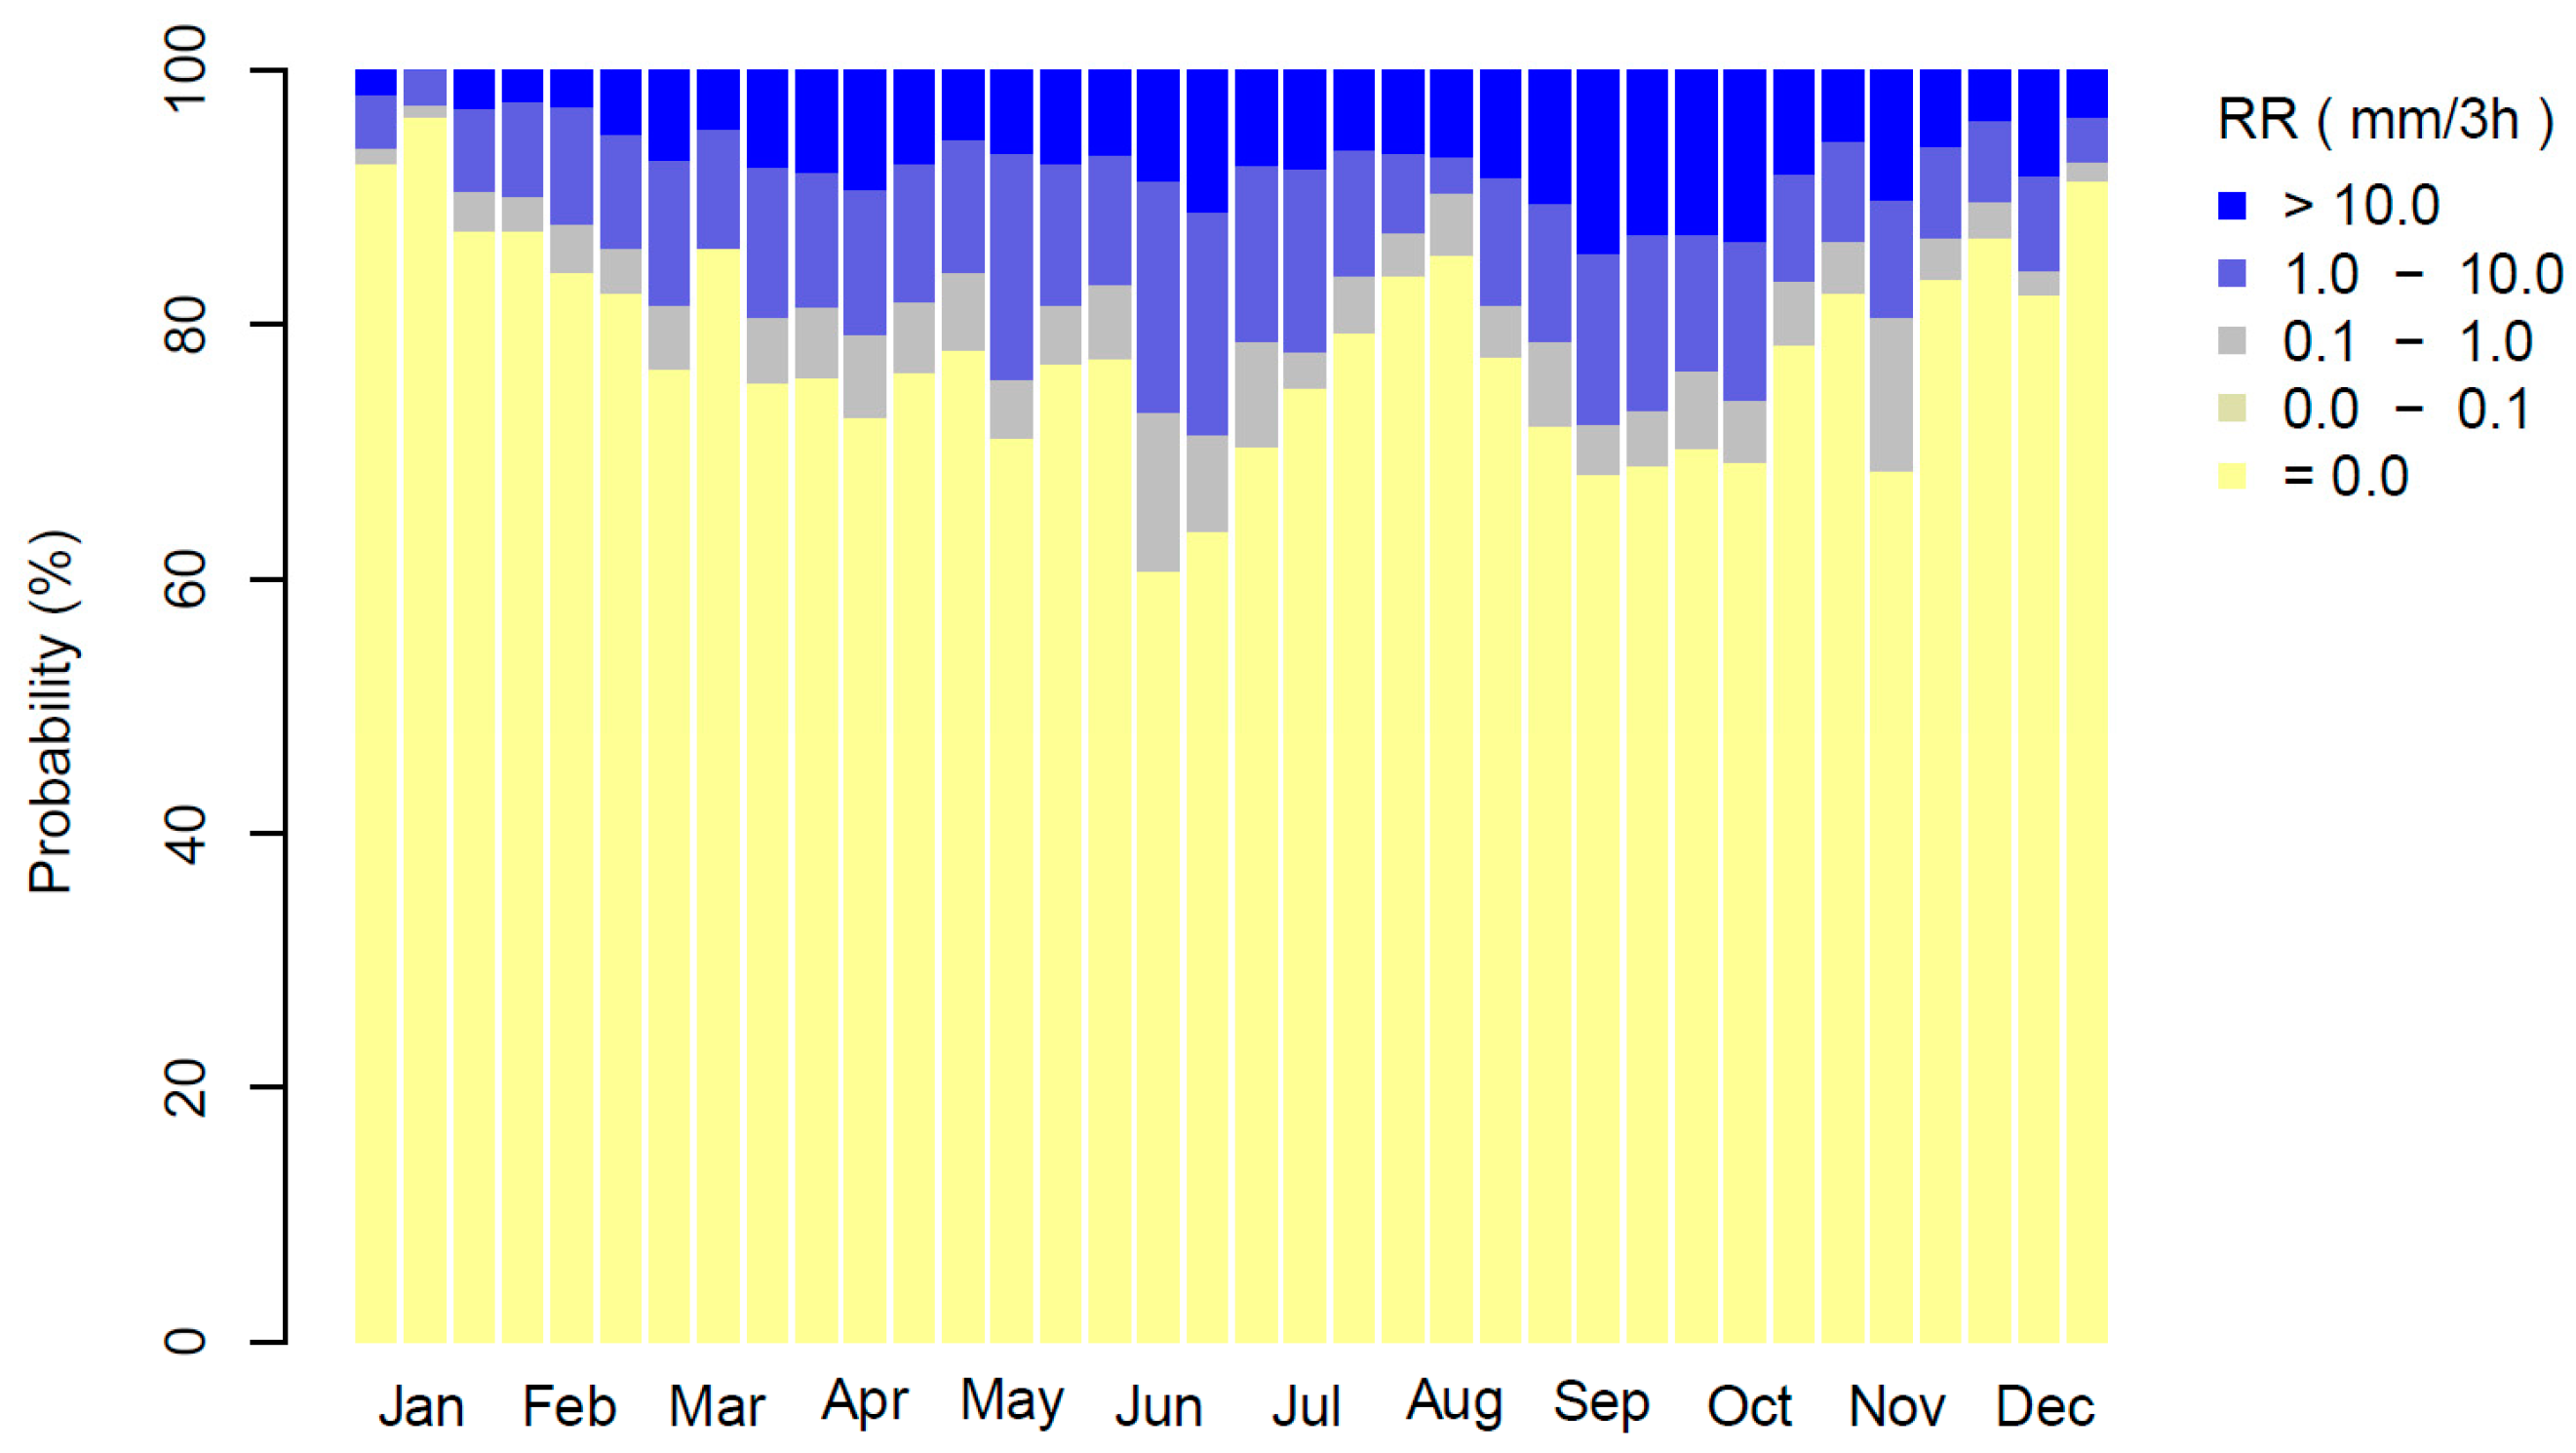
3.2. Frequencies of Precipitation
Tokyo does receive precipitation quite regularly (Figure 2). While there are hours with precipitation found throughout the year, the probability of precipitation events is lower in January, while rain is quite frequent in the second half of June, as well as in the time from the second decade of September to the end of October. August, especially the end of August, thereby shows fewer light rain events than the other summer months. The probability of heavy rain events, however, is almost the same (around 8%).
3.3. CTIS
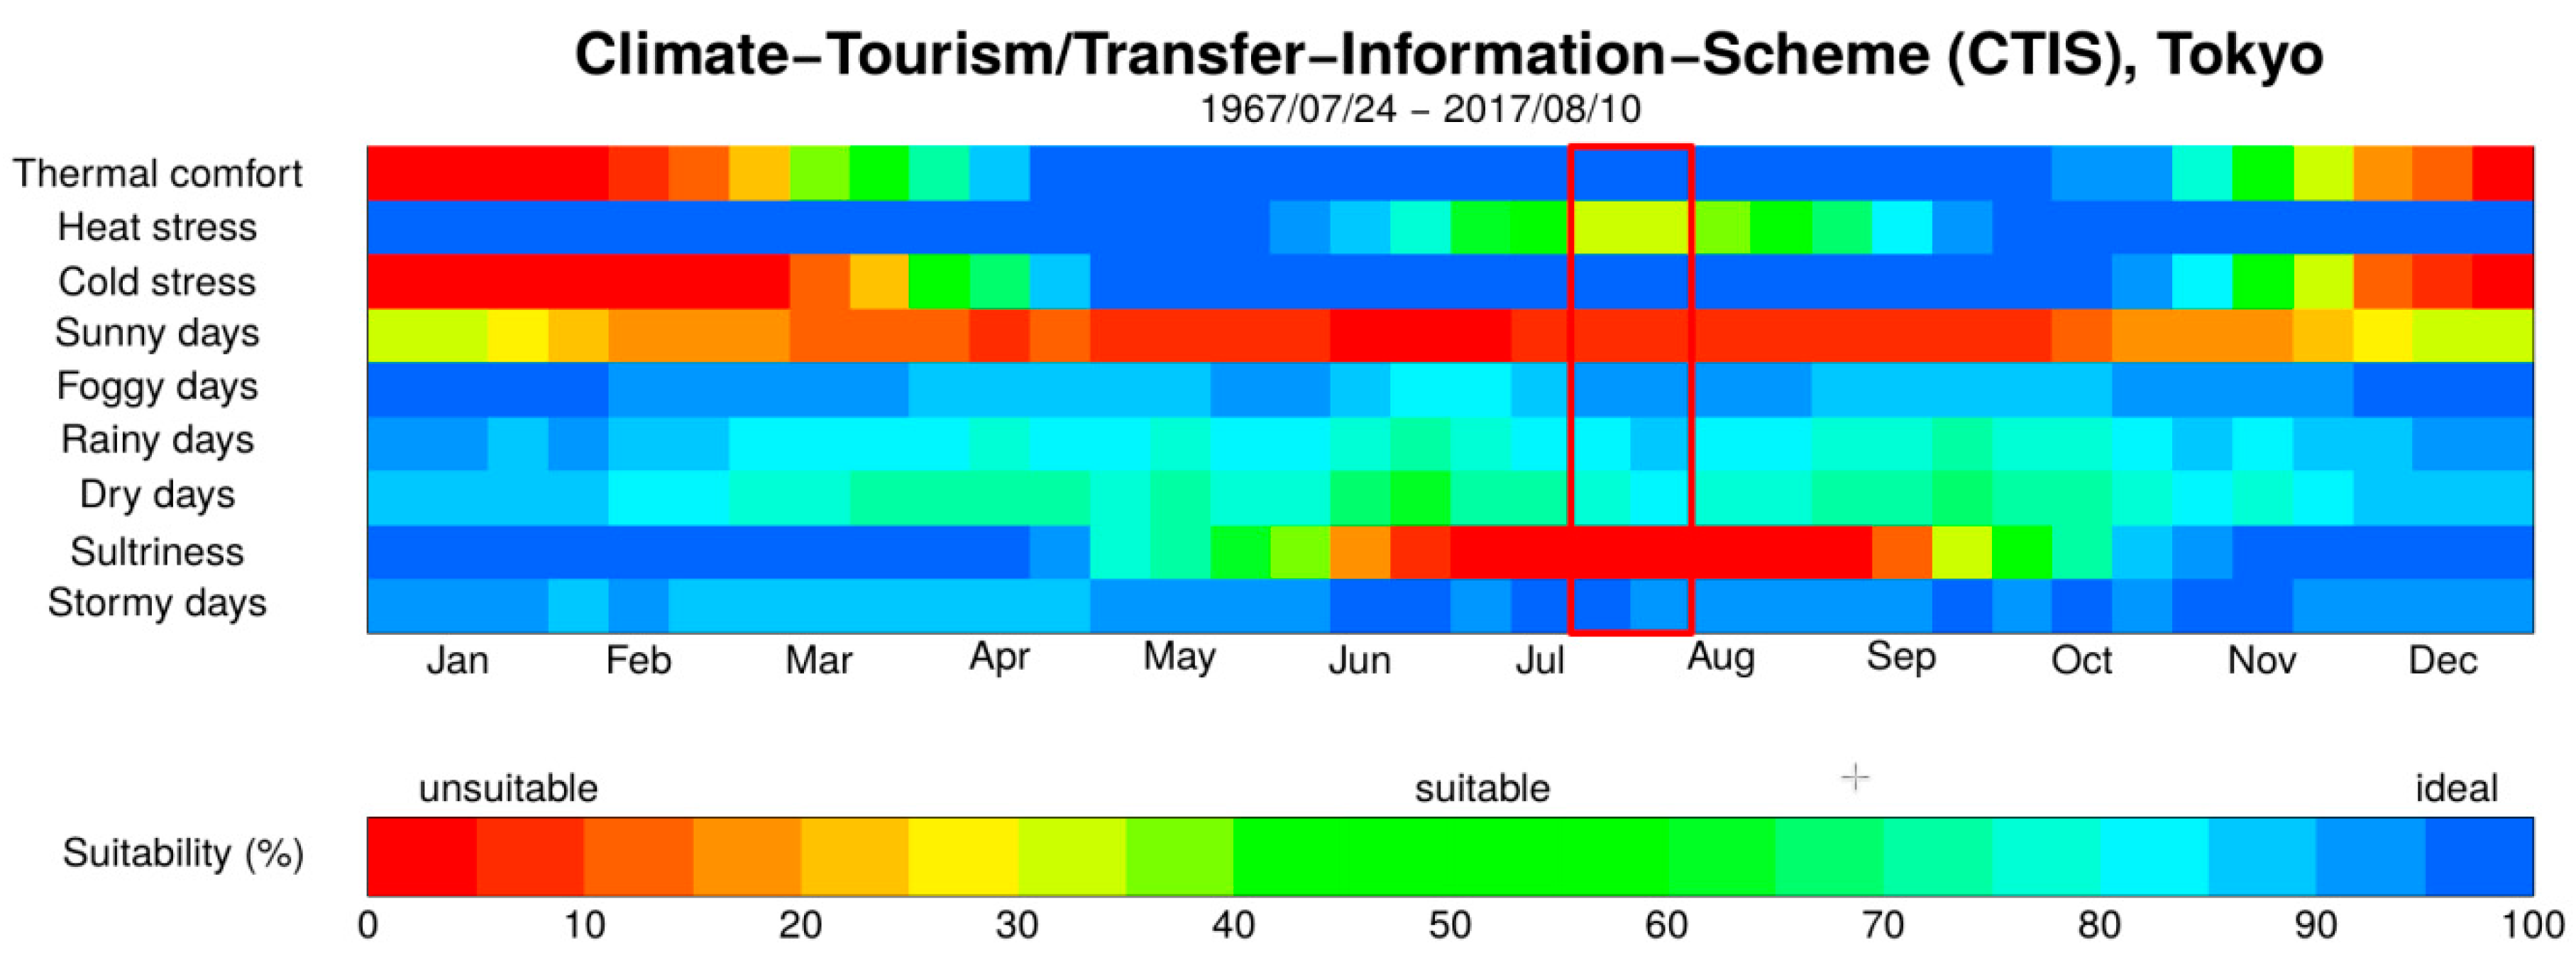
To make biometeorological information like heat stress or the likelihood of precipitation more obvious to non-experts, the “Climate-Tourism/Transfer-Information-Scheme” (CTIS) is applied (compare to Section 2.2.4). The CTIS for Tokyo (Figure 3) shows that the time from spring to fall is most suitable in terms of thermally comfortable conditions (first row in Figure 3). The winter months, however, are mostly unsuitable. While heat stress is not very frequent in total (minimal suitability of almost 30% in the third decade of July, as well as in the first decade of August), there is quite frequent cold-stress in the winter months (more than 90% of all hours from the end of December to mid-February). Sunny conditions are scarce throughout the year in Tokyo with only up to 40% in December and January. Foggy, as well as rainy, days are less frequent (increasing suitability) in the winter months, while they are more frequent at the end of July and end of September. This is very similar to the distribution of suitability in terms of dry days (the absence of rainy days does occur quite similar at the same time as the occurrence of dry days). From the end of July to the first decade of September, there is a high probability for a sultriness of up to 90% in Tokyo, strongly decreasing the touristic potential at this time. Stormy days are rare all over the year with maximum frequencies in Spring decreasing the suitability for tourism to less than 90%.
For the specific time the Tokyo Olympics is scheduled, the 24th of July to the 8th of August, the CTIS indicates that the time is well-selected in terms of the presence of thermal comfort and cold stress. Sunny days are few in the time selected. However, this holds almost throughout the year except for the winter. In addition, in terms of foggy, rainy, dry, and stormy days, the time range selected can be considered suitable. Another image can be seen looking at the rows of heat stress and sultriness. While for heat stress, the selected decades are the worst throughout the year with a suitability of only 30%, the heat stress perceived by the audience and athletes will likely be worse due to the high probability of sultriness. Both decades show suitabilities of less than 5% in terms of this factor.
The extrema for the same time range for a time from 8:00 to 22:00 LST indicate that both heat stress and sultriness can be worse than indicated by the diagram. While the air temperature ranges from 18.3 °C to 34.0 °C in the given time and the PET is almost the same with a range from 12.5 °C to 33.4 °C, vapor pressure might become a key parameter ranging from a minimum of 12.1 hPa to a maximum of 38.2 hPa, being 26.5 hPa on average.
4. Discussion and Conclusions
Climate conditions, which are assets of touristic areas, as well as all locations hosting any sports events, can be described by human biometeorological and tourism-climatological methods [1]. In the past, most studies and analyses only delivered results and visualizations on a monthly basis [31]. Results presented in the study at hand, however, show a way to transfer information about climate to sophisticated and comprehensive, but simple, graphs for tourism purposes. The combination of analyzing a thermal index like PET, as well as individual meteorological parameters like precipitation, and combining both into one information scheme is a promising approach that can be applied for various climates and regions while being useful to decision-makers and planners [1,5,8,15,16]. The CTIS approach can, therefore, be applied to different destinations while always considering the most relevant parameters for the specific location.
The CTIS scheme can, therefore, be generated from readily available data, e.g., from a meteorological station on-site, or from results of climate models, to provide insight on future conditions. CTIS results are a handy source of information for the preparation of holiday time, sports events, and all kinds of touristic activities. In addition, health resorts and public authorities can prepare for climatic events to avoid negative impacts on tourism, recreation, sports, and, in general, health and free-time activities.
Results for decades 21 to 22, the time of the 2020 Olympics in Tokyo, show almost ideal conditions in terms of the availability of thermal comfort (Figure 3). However, this mostly holds for the night-time. At the same time, heat stress is an issue until the second decade of September (compare Figure 1 and Figure 3). Most discomfort in the given time frame is to be expected from heat stress in combination with sultriness and the absence of sunny conditions, while cold stress is unlikely to cause any inconvenience. It, therefore, has to be considered that the approach applied by this study is based on climatic averages and can, therefore, give insight into the conditions that are likely to occur at a given time. Conditions can, therefore, be better or worse in the case the Olympics are hit by extreme weather events.
The CTIS can provide detailed information, as described above, in an easily and intuitively understandable way to non-experts in the field of human biometeorology and climatology, in general (e.g., [31,32,33]). The scheme can be used as a summary of basic climatological and bioclimatological conditions at a specific location [1,15], e.g., Tokyo. It can also be applied for specific sport events and for both visitors and athletes. Sticking with the example of Tokyo, the same methodology could also be applied for the Tokyo Marathon, which is scheduled for March. For the advantages described above, the methodology provided by this study is proposed as a gold standard of good biometeorological practices when it comes to tourism and sports and is recommended for all major events.
Author Contributions
Conceptualization, A.M.; methodology, A.M.; software, A.M., and D.F.; validation, A.M., D.F., S.B., and P.E.A.; formal analysis, A.M., D.F., S.B., and P.E.A.; investigation, A.M., D.F., S.B., and P.E.A.; resources, A.M., D.F., S.B., and P.E.A.; data curation, D.F.; writing—original draft preparation, A.M., D.F., S.B., and P.E.A.; writing—review and editing, A.M., D.F., S.B., and P.E.A.; visualization, D.F.; supervision, A.M.; project administration, A.M.; funding acquisition, A.M., S.B., and P.E.A.
Funding
This research received no external funding.
Conflicts of Interest
The authors declare no conflict of interest.
References
- Matzarakis, A.; Fröhlich, D. Sport events and climate for visitors—The case of FIFA World Cup in Qatar 2022. Int. J. Biometeorol. 2015, 59, 481–486. [Google Scholar] [CrossRef] [PubMed]
- Wong, P.; Lai, P.-C.; Hart, M. Microclimate Variations between Semienclosed and Open Sections of a Marathon Route. Adv. Meteorol. 2013, 287934. [Google Scholar] [CrossRef]
- Hirabayashi, S.; Abe, T.; Imamura, F.; Morioka, C. Development of a Distributed Modeling Framework to Estimate Thermal Comfort along 2020 Tokyo Olympic Marathon Course. Atmosphere 2018, 9, 210. [Google Scholar] [CrossRef]
- Kosaka, E.; Iida, A.; Vanos, J.; Middel, A.; Yokohari, M.; Brown, R. Microclimate Variation and Estimated Heat Stress of Runners in the 2020 Tokyo Olympic Marathon. Atmosphere 2018, 9, 192. [Google Scholar] [CrossRef]
- Lin, T.P.; Matzarakis, A. Tourism climate and thermal comfort in Sun Moon Lake, Taiwan. Int. J. Biometeorol. 2008, 52, 281–290. [Google Scholar] [CrossRef] [PubMed]
- Armstrong, L.E.; Casa, D.J.; Millard-Stafford, M.; Moran, D.S.; Pyne, S.W.; Roberts, W.O. American College of Sports Medicine position stand. Exertional heat illness during training and competition. Med. Sci. Sports Exerc. 2007, 39, 556–572. [Google Scholar] [CrossRef] [PubMed]
- Scott, D. Why sustainable tourism must address climate change. J. Sustain. Tour. 2010, 19, 17–34. [Google Scholar] [CrossRef]
- Nastos, P.; Matzarakis, A. Present and Future Climate—Tourism Conditions in Milos Island, Greece. Atmosphere 2019, 10, 145. [Google Scholar] [CrossRef]
- Matzarakis, A. Weather- and climate- related information for tourism. Tour. Hosp. Plan. Dev. 2006, 3, 99–115. [Google Scholar] [CrossRef]
- Matzarakis, A. Climate change: Temporal and spatial dimension of adaptation possibilities at regional and local scale. In Tourism and the Implications of Climate Change: Issues and Actions; Schott, C., Ed.; Emerald Group Publishing: Bingley, UK, 2010. [Google Scholar]
- Scott, D.; de Freitas, C.R.; Matzarakis, A. Adaptation in the tourism and recreation sector. In Biometeorology for Adaptation to Climate Variability and Change; McGregor, G.R., Burton, I., Ebi, K., Eds.; Springer: Heidelberg, Germany, 2009. [Google Scholar]
- de Freitas, C.R. Tourism climatology: Evaluating environmental information for decision making and business planning in the recreation and tourism sector. Int. J. Biometeorol. 2003, 48, 45–54. [Google Scholar] [CrossRef]
- Mieczkowski, Z. The tourism climate index: A method for evaluating world climates for tourism. Can. Geogr. 1985, 29, 220–233. [Google Scholar] [CrossRef]
- de Freitas, C.R.; Scott, D.; McBoyle, G. A second generation climate index for tourism (CIT): Specification and verification. Int. J. Biometeorol. 2008, 52, 399–407. [Google Scholar] [CrossRef] [PubMed]
- Matzarakis, A.; Fröhlich, D.; Bermon, S.; Adami, P.E. Quantifying Thermal Stress for Sport Events—TheCase of the Olympic Games 2020 in Tokyo. Atmosphere 2018, 9, 479. [Google Scholar] [CrossRef]
- Matzarakis, A. Transfer of climate data for tourism applications—The Climate-Tourism/Transfer-Information-Scheme. Sustain. Environ. Res. 2014, 24, 273–280. [Google Scholar]
- Höppe, P.R. The physiological equivalent temperature—A universal index for the bioclimatological assessment of the thermal environment. Int. J. Biometeorol. 1999, 4, 71–75. [Google Scholar]
- Fanger, P.O. Thermal Comfort; McGraw-Hill: New York, NY, USA, 1972. [Google Scholar]
- Gagge, A.P.; Fobelets, A.P.; Berglund, L.G. A standard predictive index of human response to the thermal environment. ASHRAE Trans. 1986, 92, 709–731. [Google Scholar]
- Matzarakis, A.; Mayer, H.; Iziomon, M.G. Applications of a universal thermal index: Physiological equivalent temperature. Int. J. Biometeorol. 1999, 43, 76–84. [Google Scholar] [CrossRef] [PubMed]
- Lin, T.P.; Matzarakis, A.; Hwand, R.L. Shading effect on long-term outdoor thermal comfort. Build. Environ. 2010, 45, 213–221. [Google Scholar] [CrossRef]
- Nastos, P.; Matzarakis, A. The effect of air temperature and Physiologically Equivalent Temperature on mortality in Athens, Greece. Theor. Appl. Climatol. 2012, 108, 591–599. [Google Scholar] [CrossRef]
- Höppe, P.R. Indoor Climate. Experientia 1993, 49, 775–779. [Google Scholar] [CrossRef]
- Höppe, P.R. Die Energiebilanz des Menschen. Dissertation, Wissenschaftliche Mitteilungen des Meteorologischen Instituts der Universität München 49, Munich, Germany, 1984. [Google Scholar]
- Matzarakis, A.; Rutz, F.; Mayer, H. Modelling Radiation fluxes in simple and complex environments—Application of the RayMan model. Int. J. Biometeorol. 2007, 51, 323–334. [Google Scholar] [CrossRef] [PubMed]
- Matzarakis, A.; Rutz, F.; Mayer, H. Modelling Radiation fluxes in simple and complex environments—Basics of the RayMan model. Int. J. Biometeorol. 2010, 54, 131–139. [Google Scholar] [CrossRef] [PubMed]
- VDI. Methods for the Human Biometeorological Evaluation of Climate and Air Quality for Urban and Regional Planning; Part I: Climate; VDIguideline 3787, Part 2; VDI: Berlin, Germany, 1998. [Google Scholar]
- VDI. Environmental Meteorology, Methods for the Human-Biometeorological Evaluation of Climate and Air Quality for the Urban and Regional Planning at Regional Level; Part I. Climate; VDI/DIN—Handbuch Reinhaltung der Luft. Band 1b: Düsseldorf, Germany, 1998. [Google Scholar]
- Matzarakis, A.; Mayer, H. Another kind of environmental stress: Thermal stress. Who Newsl. 1996, 18, 7–10. [Google Scholar]
- Matzarakis, A.; De Rocco, M.; Najjar, G. Thermal bioclimate in Strasburg—The 2003 heat wave. Theor. Appl. Climatol. 2009, 98, 209–220. [Google Scholar] [CrossRef]
- Zaninovic, K.; Matzarakis, A. The bioclimatological leaflet as a means conveying climatological information to tourists and the tourism industry. Int. J. Biometeorol. 2009, 53, 369–374. [Google Scholar] [CrossRef] [PubMed]
- Cohen, P.; Potchter, O.; Matzarakis, A. Human thermal perception of Coastal Mediterranean outdoor urban environments. Appl. Geogr. 2013, 37, 1–10. [Google Scholar] [CrossRef]
- Matzarakis, A.; Nastos, P. Analysis of tourism potential for Crete Island, Greece. Glob. Nest J. 2011, 13, 141–149. [Google Scholar]
Figure 1.
Decadal frequency diagram of PET classes for Tokyo based on data covering the period from August 1966 to June 2018 at a resolution of 3 h. Results are classified according to the thermal perception classes provided by Table 1 (modified after [29]).

Figure 2.
Frequency diagram of precipitation (RR, mm/3h) for Tokyo showing average precipitation classes throughout the year in decadal resolution.
Figure 2.
Frequency diagram of precipitation (RR, mm/3h) for Tokyo showing average precipitation classes throughout the year in decadal resolution.

Figure 3.
“Climate-Tourism/Transfer-Information-Scheme” (CTIS) showing average frequency classes for several relevant parameters in Tokyo. For a detailed description of the categories, please refer to Section 2.2.4 “CTIS.” The red box highlights the scheduled time for the 2020 Olympics in Tokyo.
Figure 3.
“Climate-Tourism/Transfer-Information-Scheme” (CTIS) showing average frequency classes for several relevant parameters in Tokyo. For a detailed description of the categories, please refer to Section 2.2.4 “CTIS.” The red box highlights the scheduled time for the 2020 Olympics in Tokyo.


Table 1.
Thermal perception and stress classification for human beings (internal heat production, 80 W; heat transfer resistance by clothing, 0.9 clo) modified after [29].
Table 1.
Thermal perception and stress classification for human beings (internal heat production, 80 W; heat transfer resistance by clothing, 0.9 clo) modified after [29].
| PET (°C) | Thermal Perception | Grade of Physical Stress |
|---|---|---|
| <4 | Very cold | Extreme cold stress |
| 4–8 | Cold | Strong cold stress |
| 8–13 | Cool | Moderate cold stress |
| 13–18 | Slightly cool | Slight cold stress |
| 18–23 | Comfortable | No thermal stress |
| 23–29 | Slightly warm | Slight heat stress |
| 29–35 | Warm | Moderate heat stress |
| 35–41 | Hot | Strong heat stress |
| >41 | Very hot | Extreme heat stress |
© 2019 by the authors. Licensee MDPI, Basel, Switzerland. This article is an open access article distributed under the terms and conditions of the Creative Commons Attribution (CC BY) license (http://creativecommons.org/licenses/by/4.0/).
Share and Cite
MDPI and ACS Style
Matzarakis, A.; Fröhlich, D.; Bermon, S.; Adami, P.E. Visualization of Climate Factors for Sports Events and Activities–The Tokyo 2020 Olympic Games. Atmosphere 2019, 10, 572. https://doi.org/10.3390/atmos10100572
AMA Style
Matzarakis A, Fröhlich D, Bermon S, Adami PE. Visualization of Climate Factors for Sports Events and Activities–The Tokyo 2020 Olympic Games. Atmosphere. 2019; 10(10):572. https://doi.org/10.3390/atmos10100572
Chicago/Turabian StyleMatzarakis, Andreas, Dominik Fröhlich, Stéphane Bermon, and Paolo Emilio Adami. 2019. "Visualization of Climate Factors for Sports Events and Activities–The Tokyo 2020 Olympic Games" Atmosphere 10, no. 10: 572. https://doi.org/10.3390/atmos10100572
Note that from the first issue of 2016, this journal uses article numbers instead of page numbers. See further details here.