Modeling Climate Change Impacts on Rice Growth and Yield under Global Warming of 1.5 and 2.0 °C in the Pearl River Delta, China

 ,
,  , ,
, ,
Abstract
:1. Introduction
2. Methods
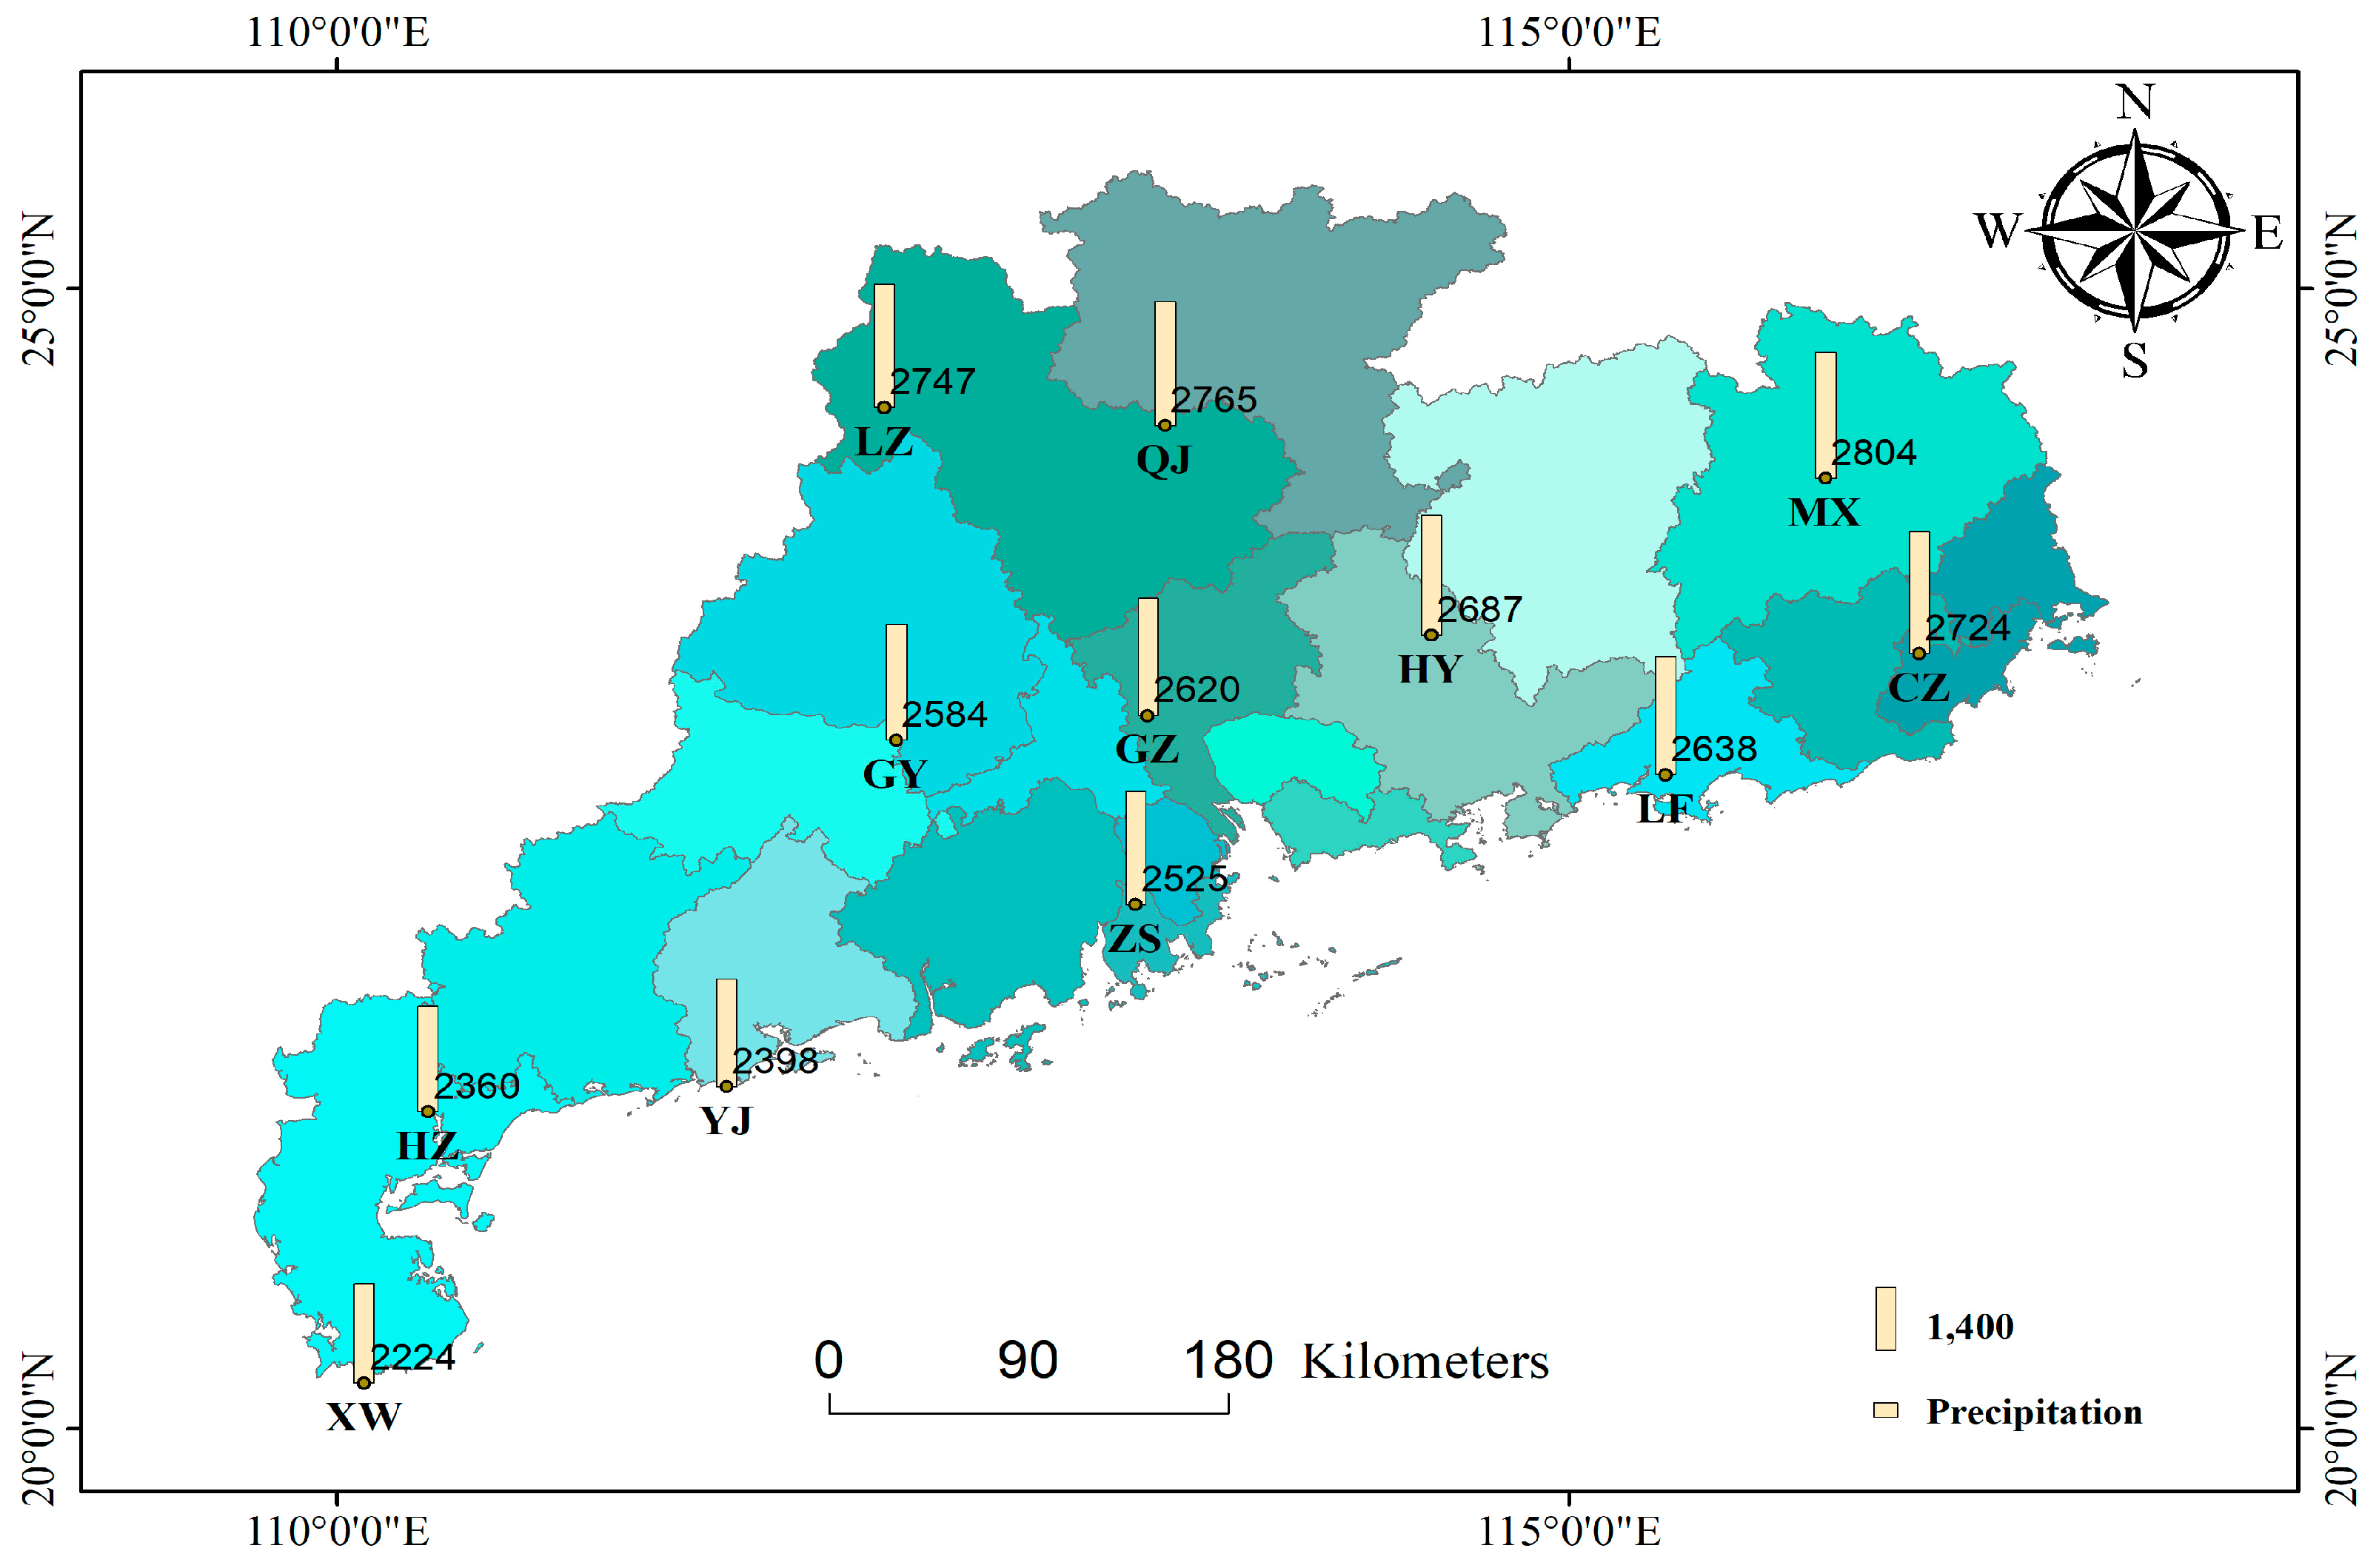
2.1. Study Area
2.2. Ceres-Rice Model
2.2.1. Model Description
2.2.2. Model Input
(a) Climatic Data
(b) Soil Data
(c) Crop Management Options
2.2.3. Model Parameterization
2.2.4. Simulating the Impact of Climate Change on Rice Crop
2.2.5. Simulating Adaptive Measures to Increase Rice Yield
2.3. Analysis of Climatic Variables and Rice Yields
3. Results
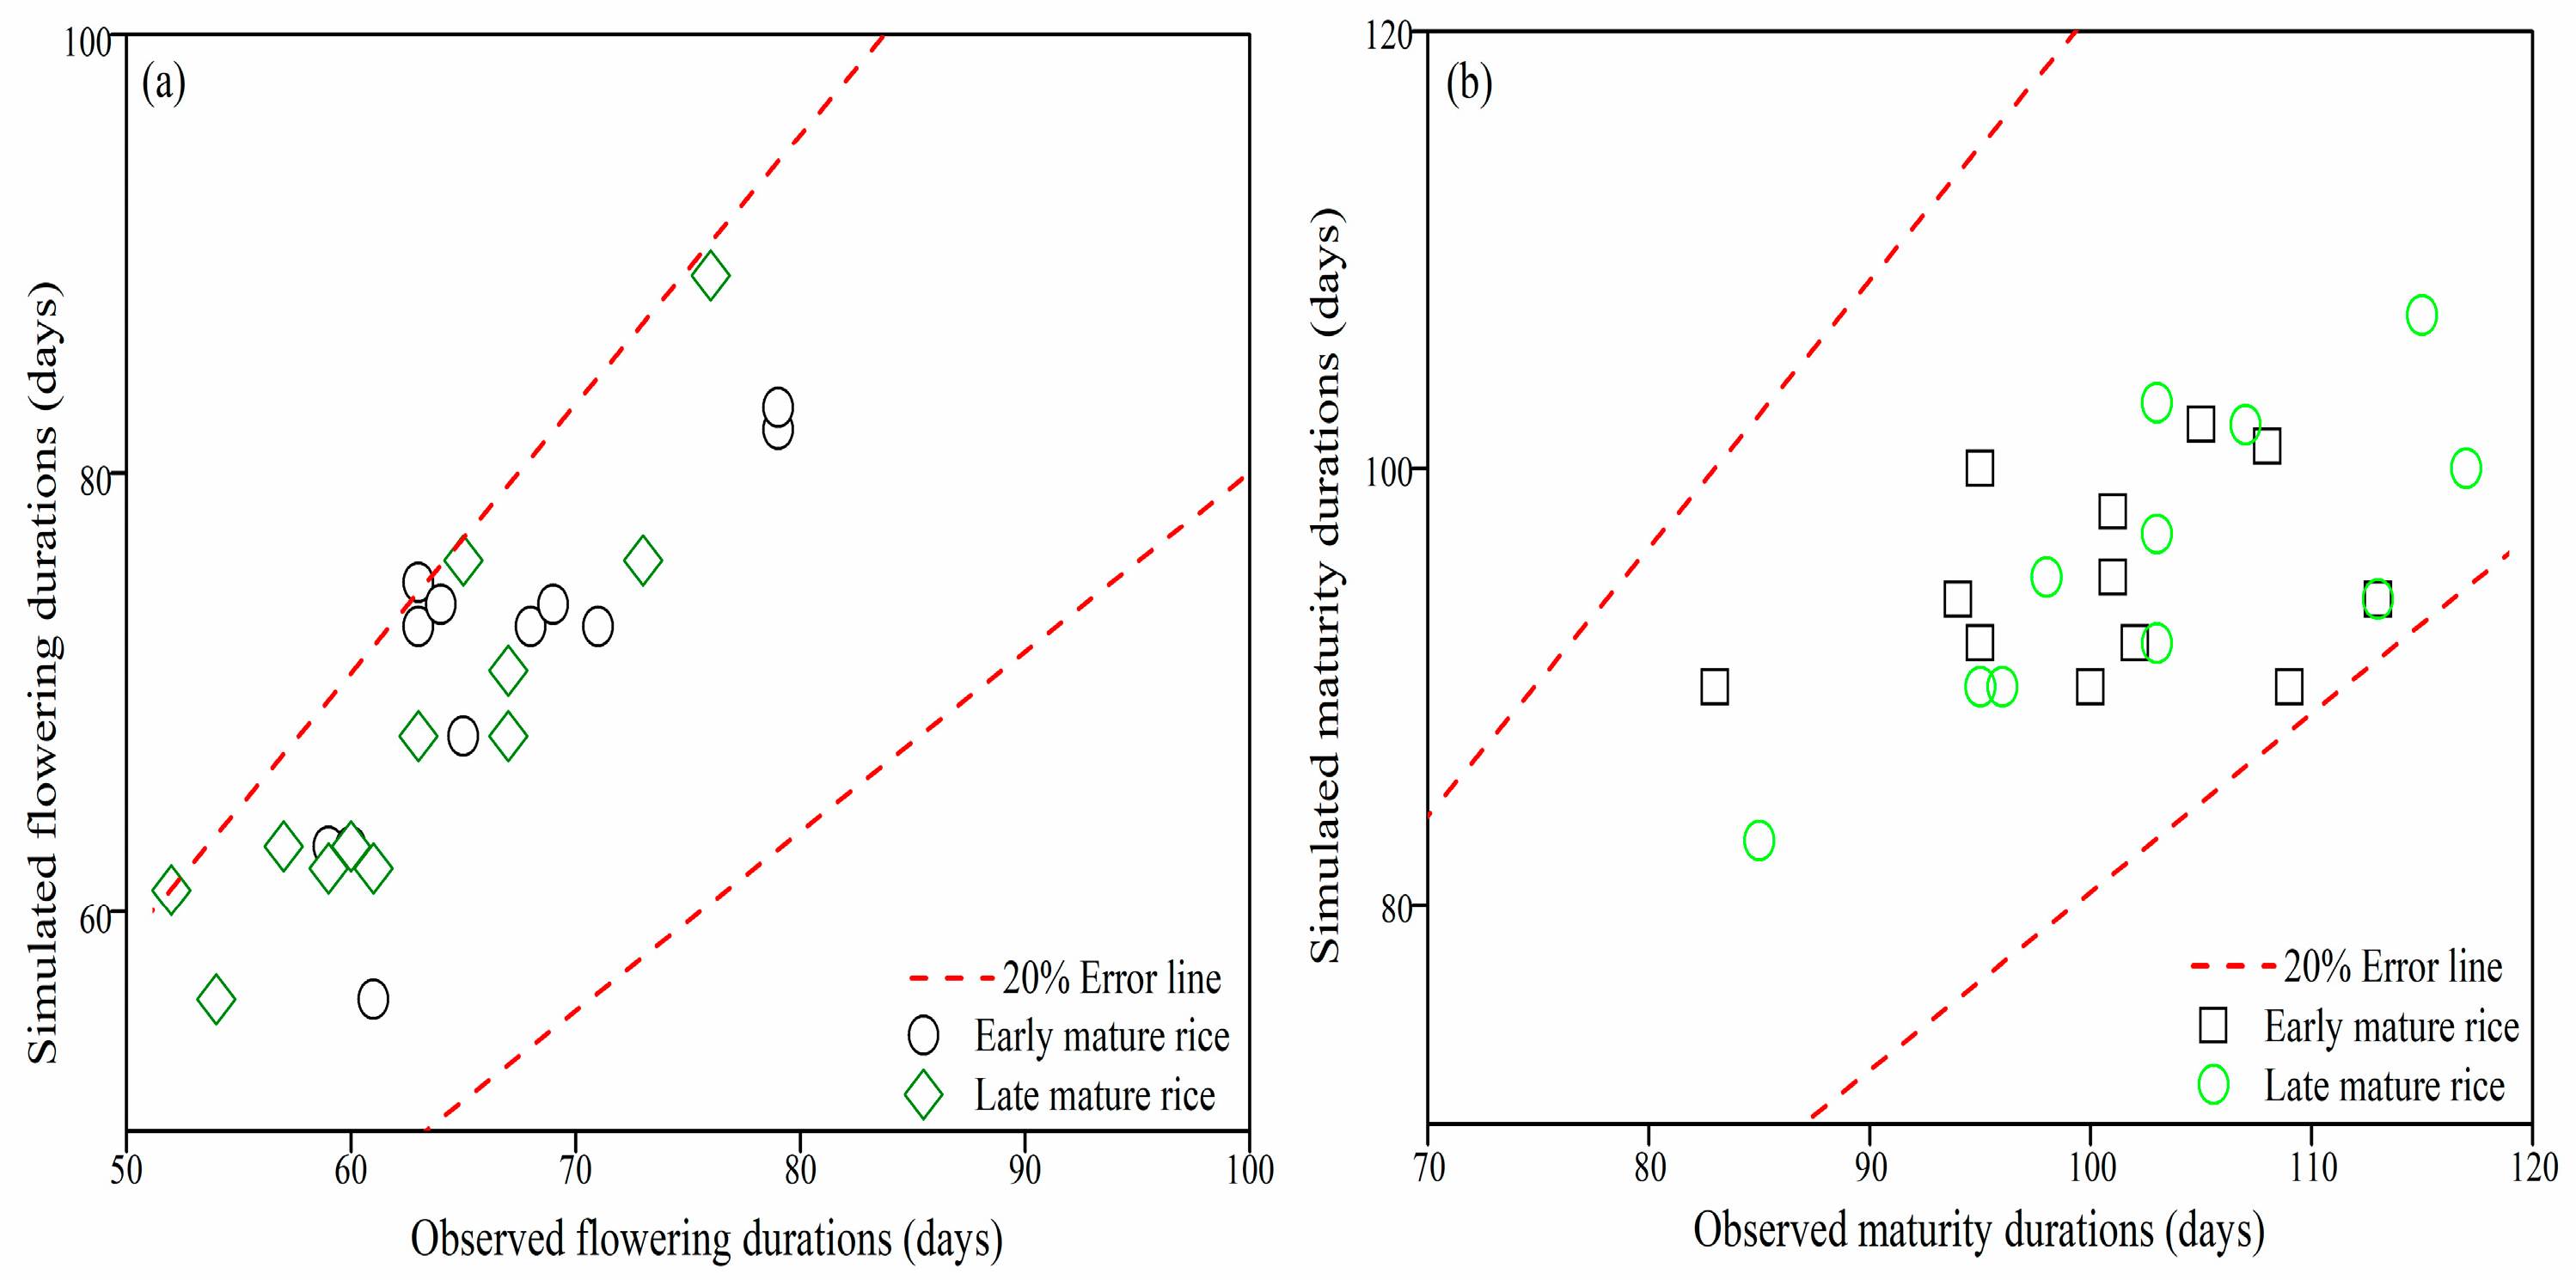
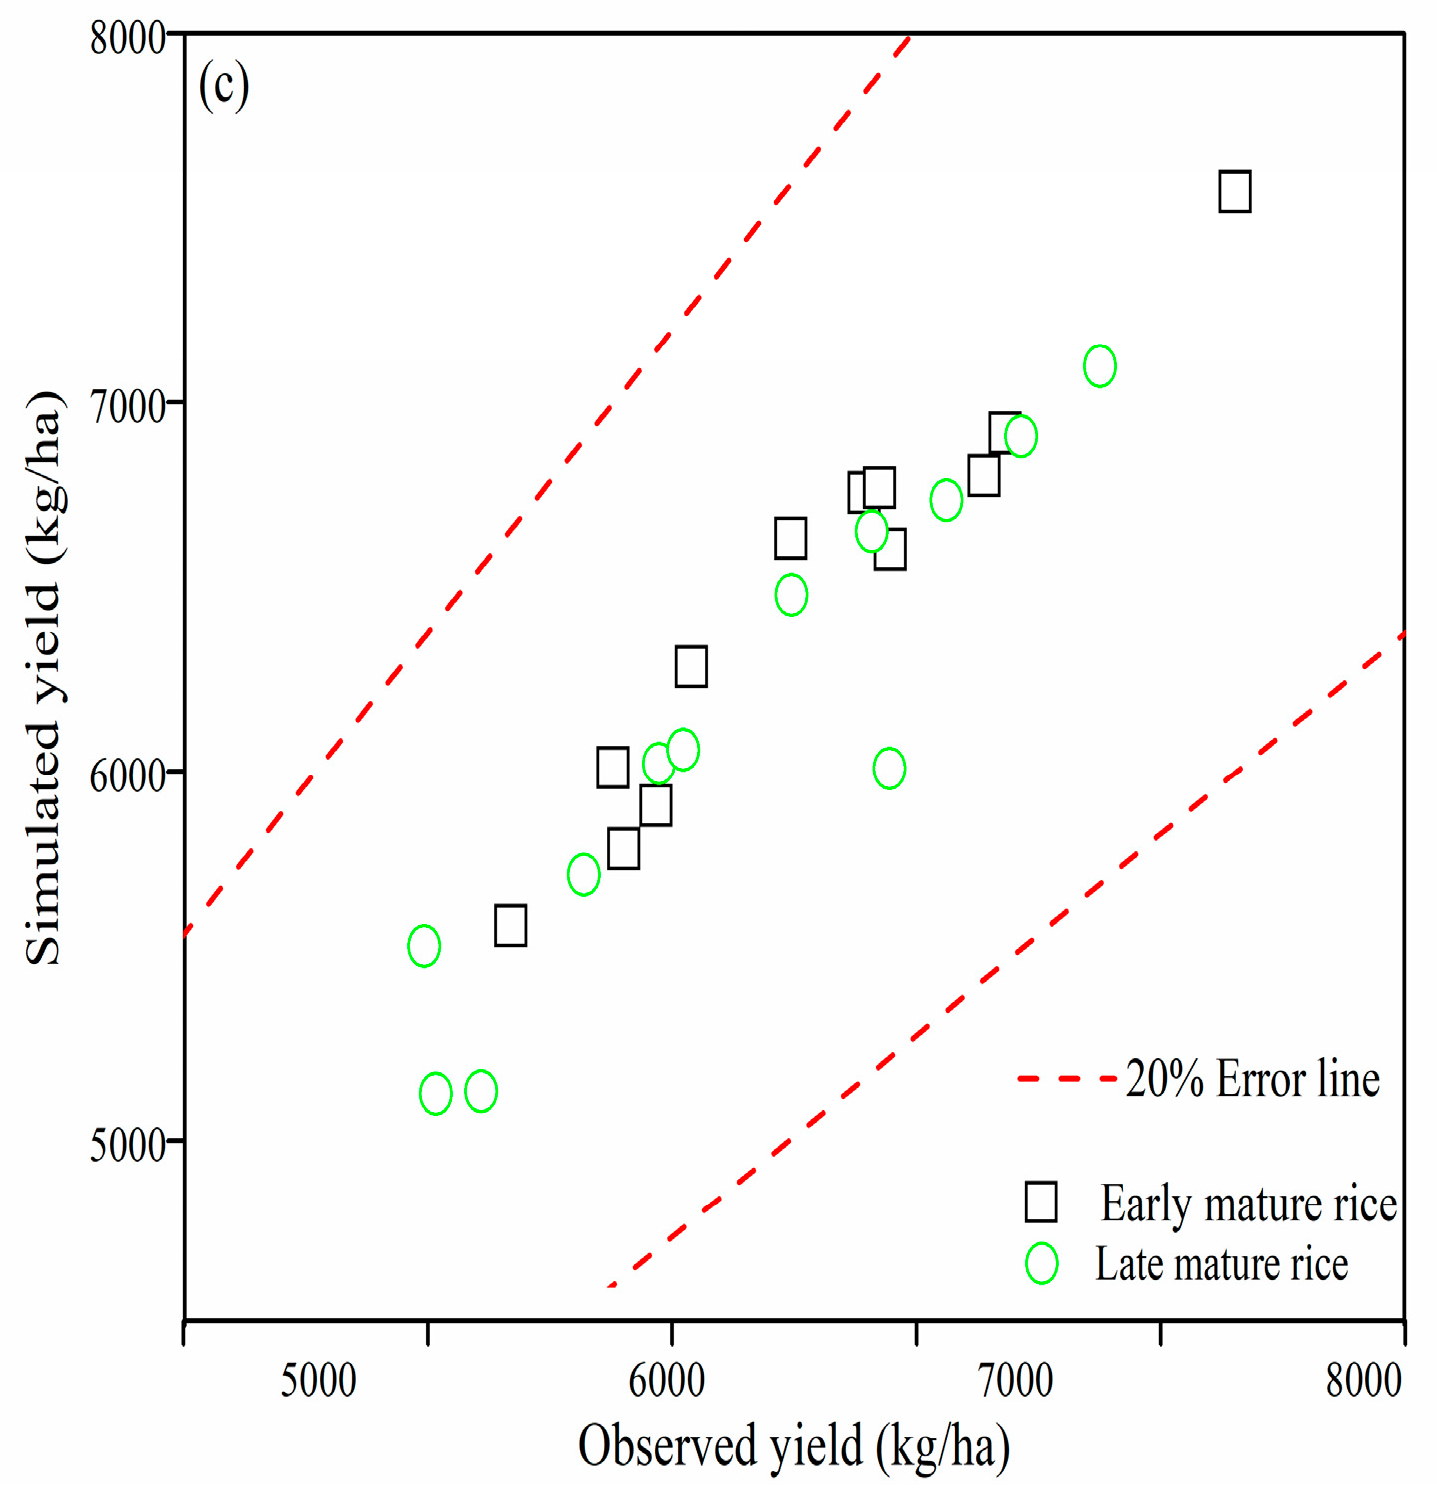
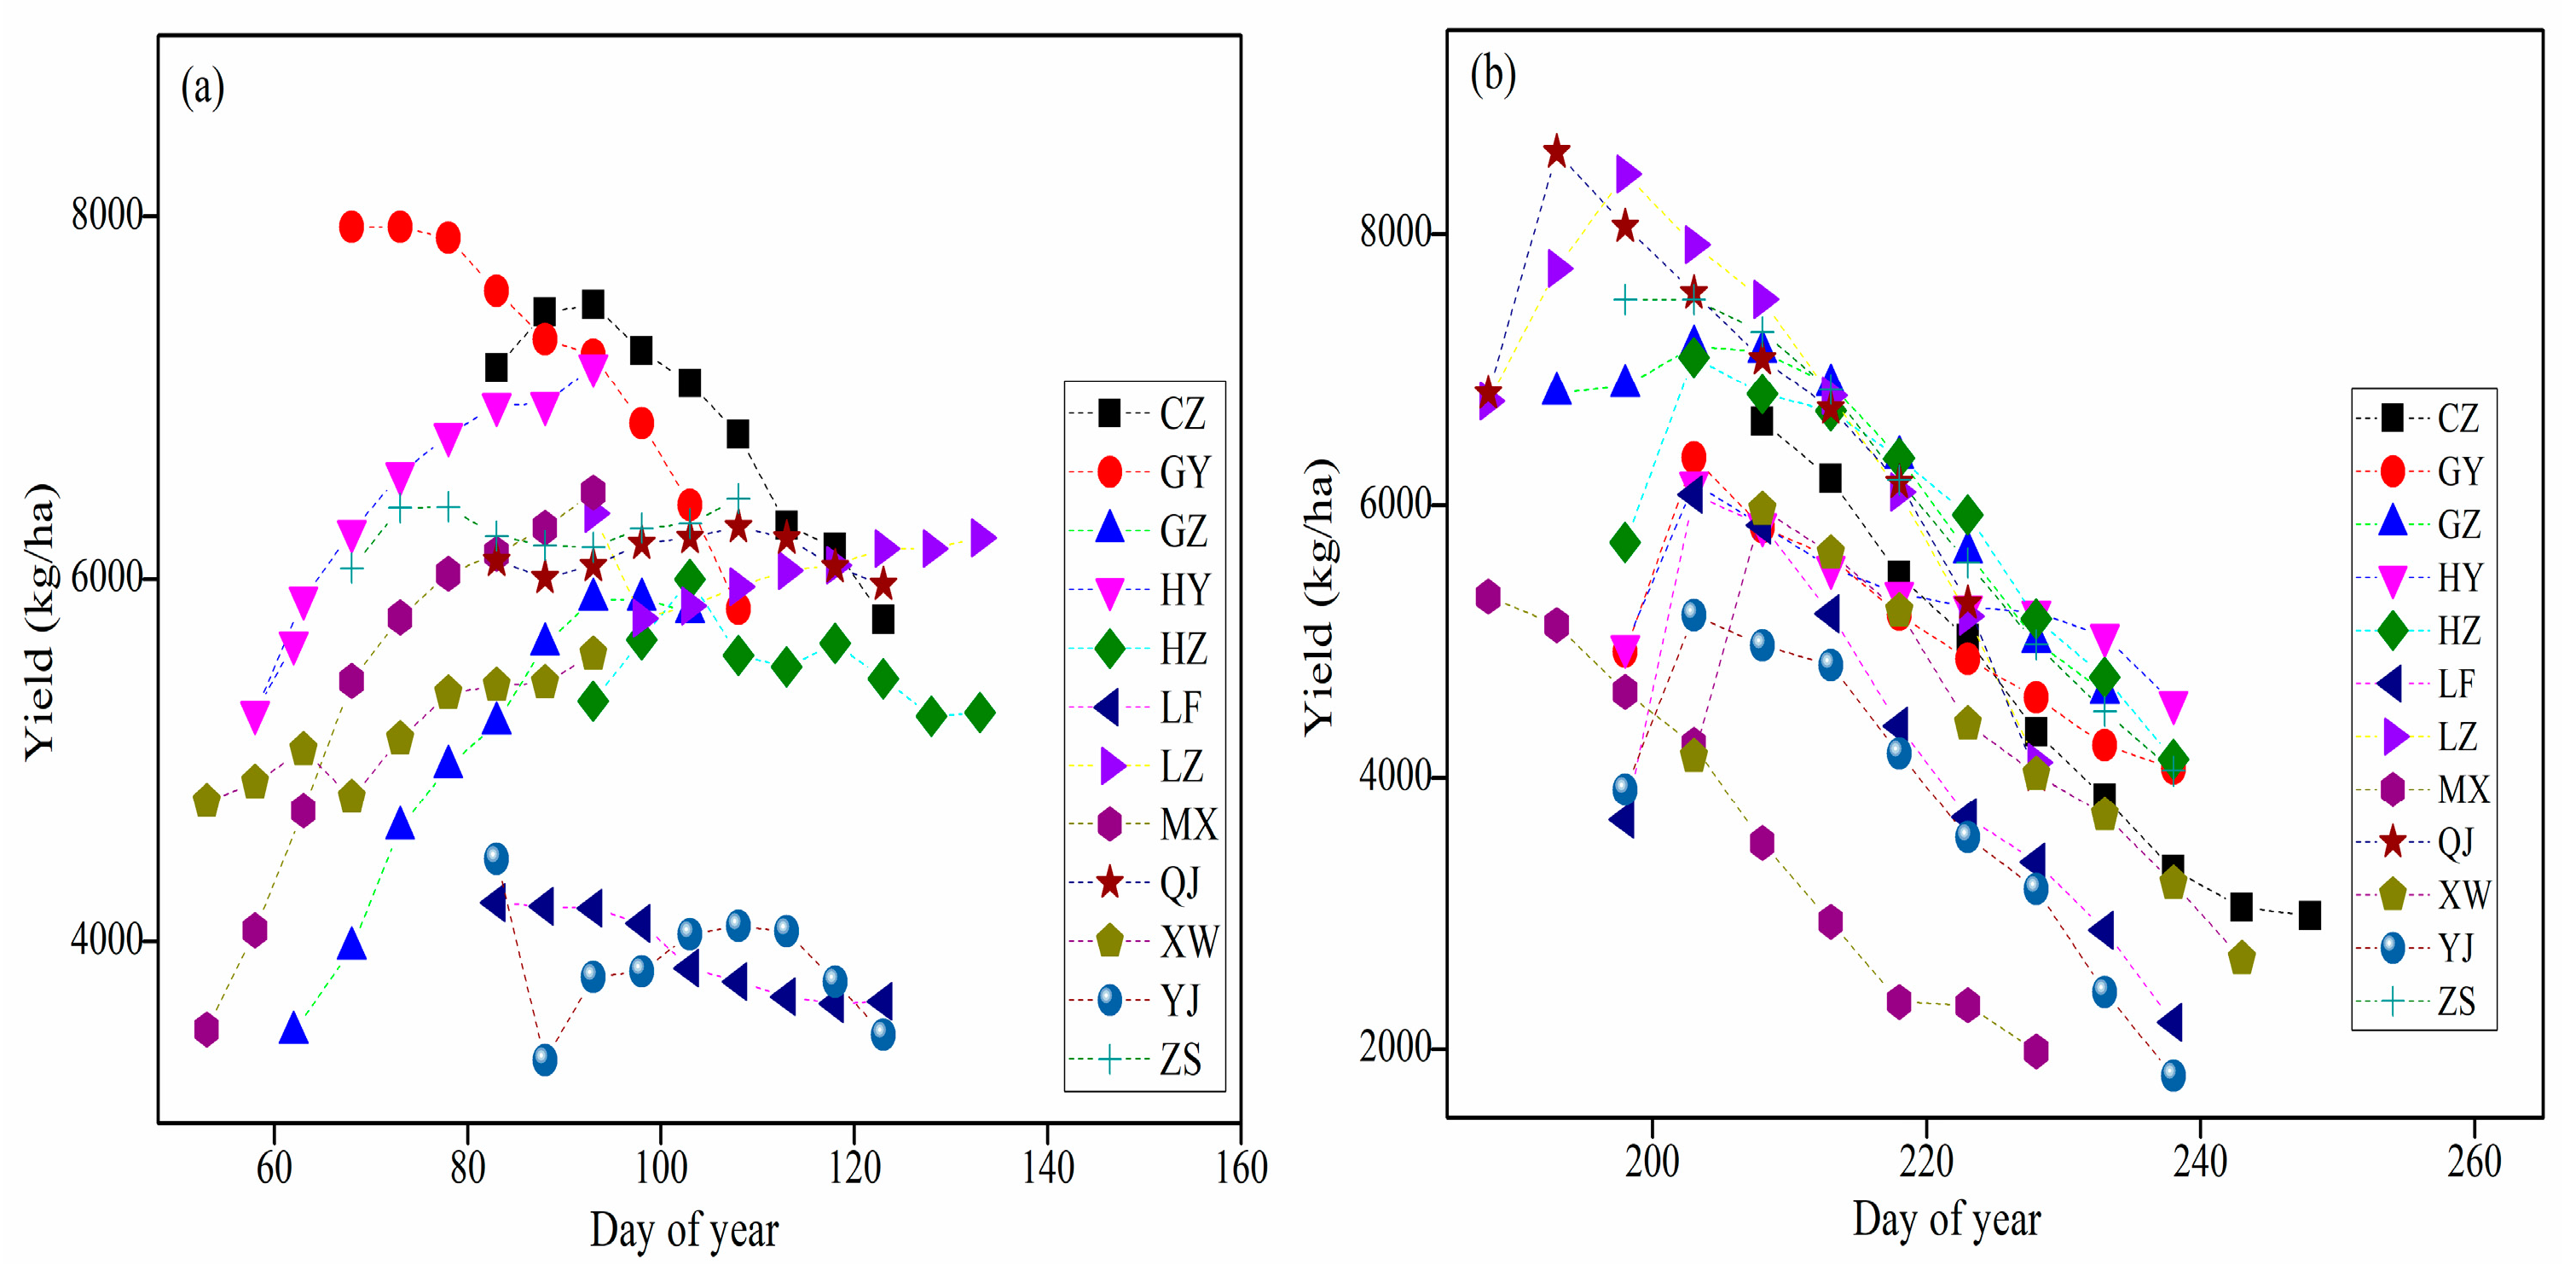
3.1. Calibration and Validation of Models
3.2. Changes in Climatic Variables Under the 1.5 and 2.0 °C Warming Scenarios
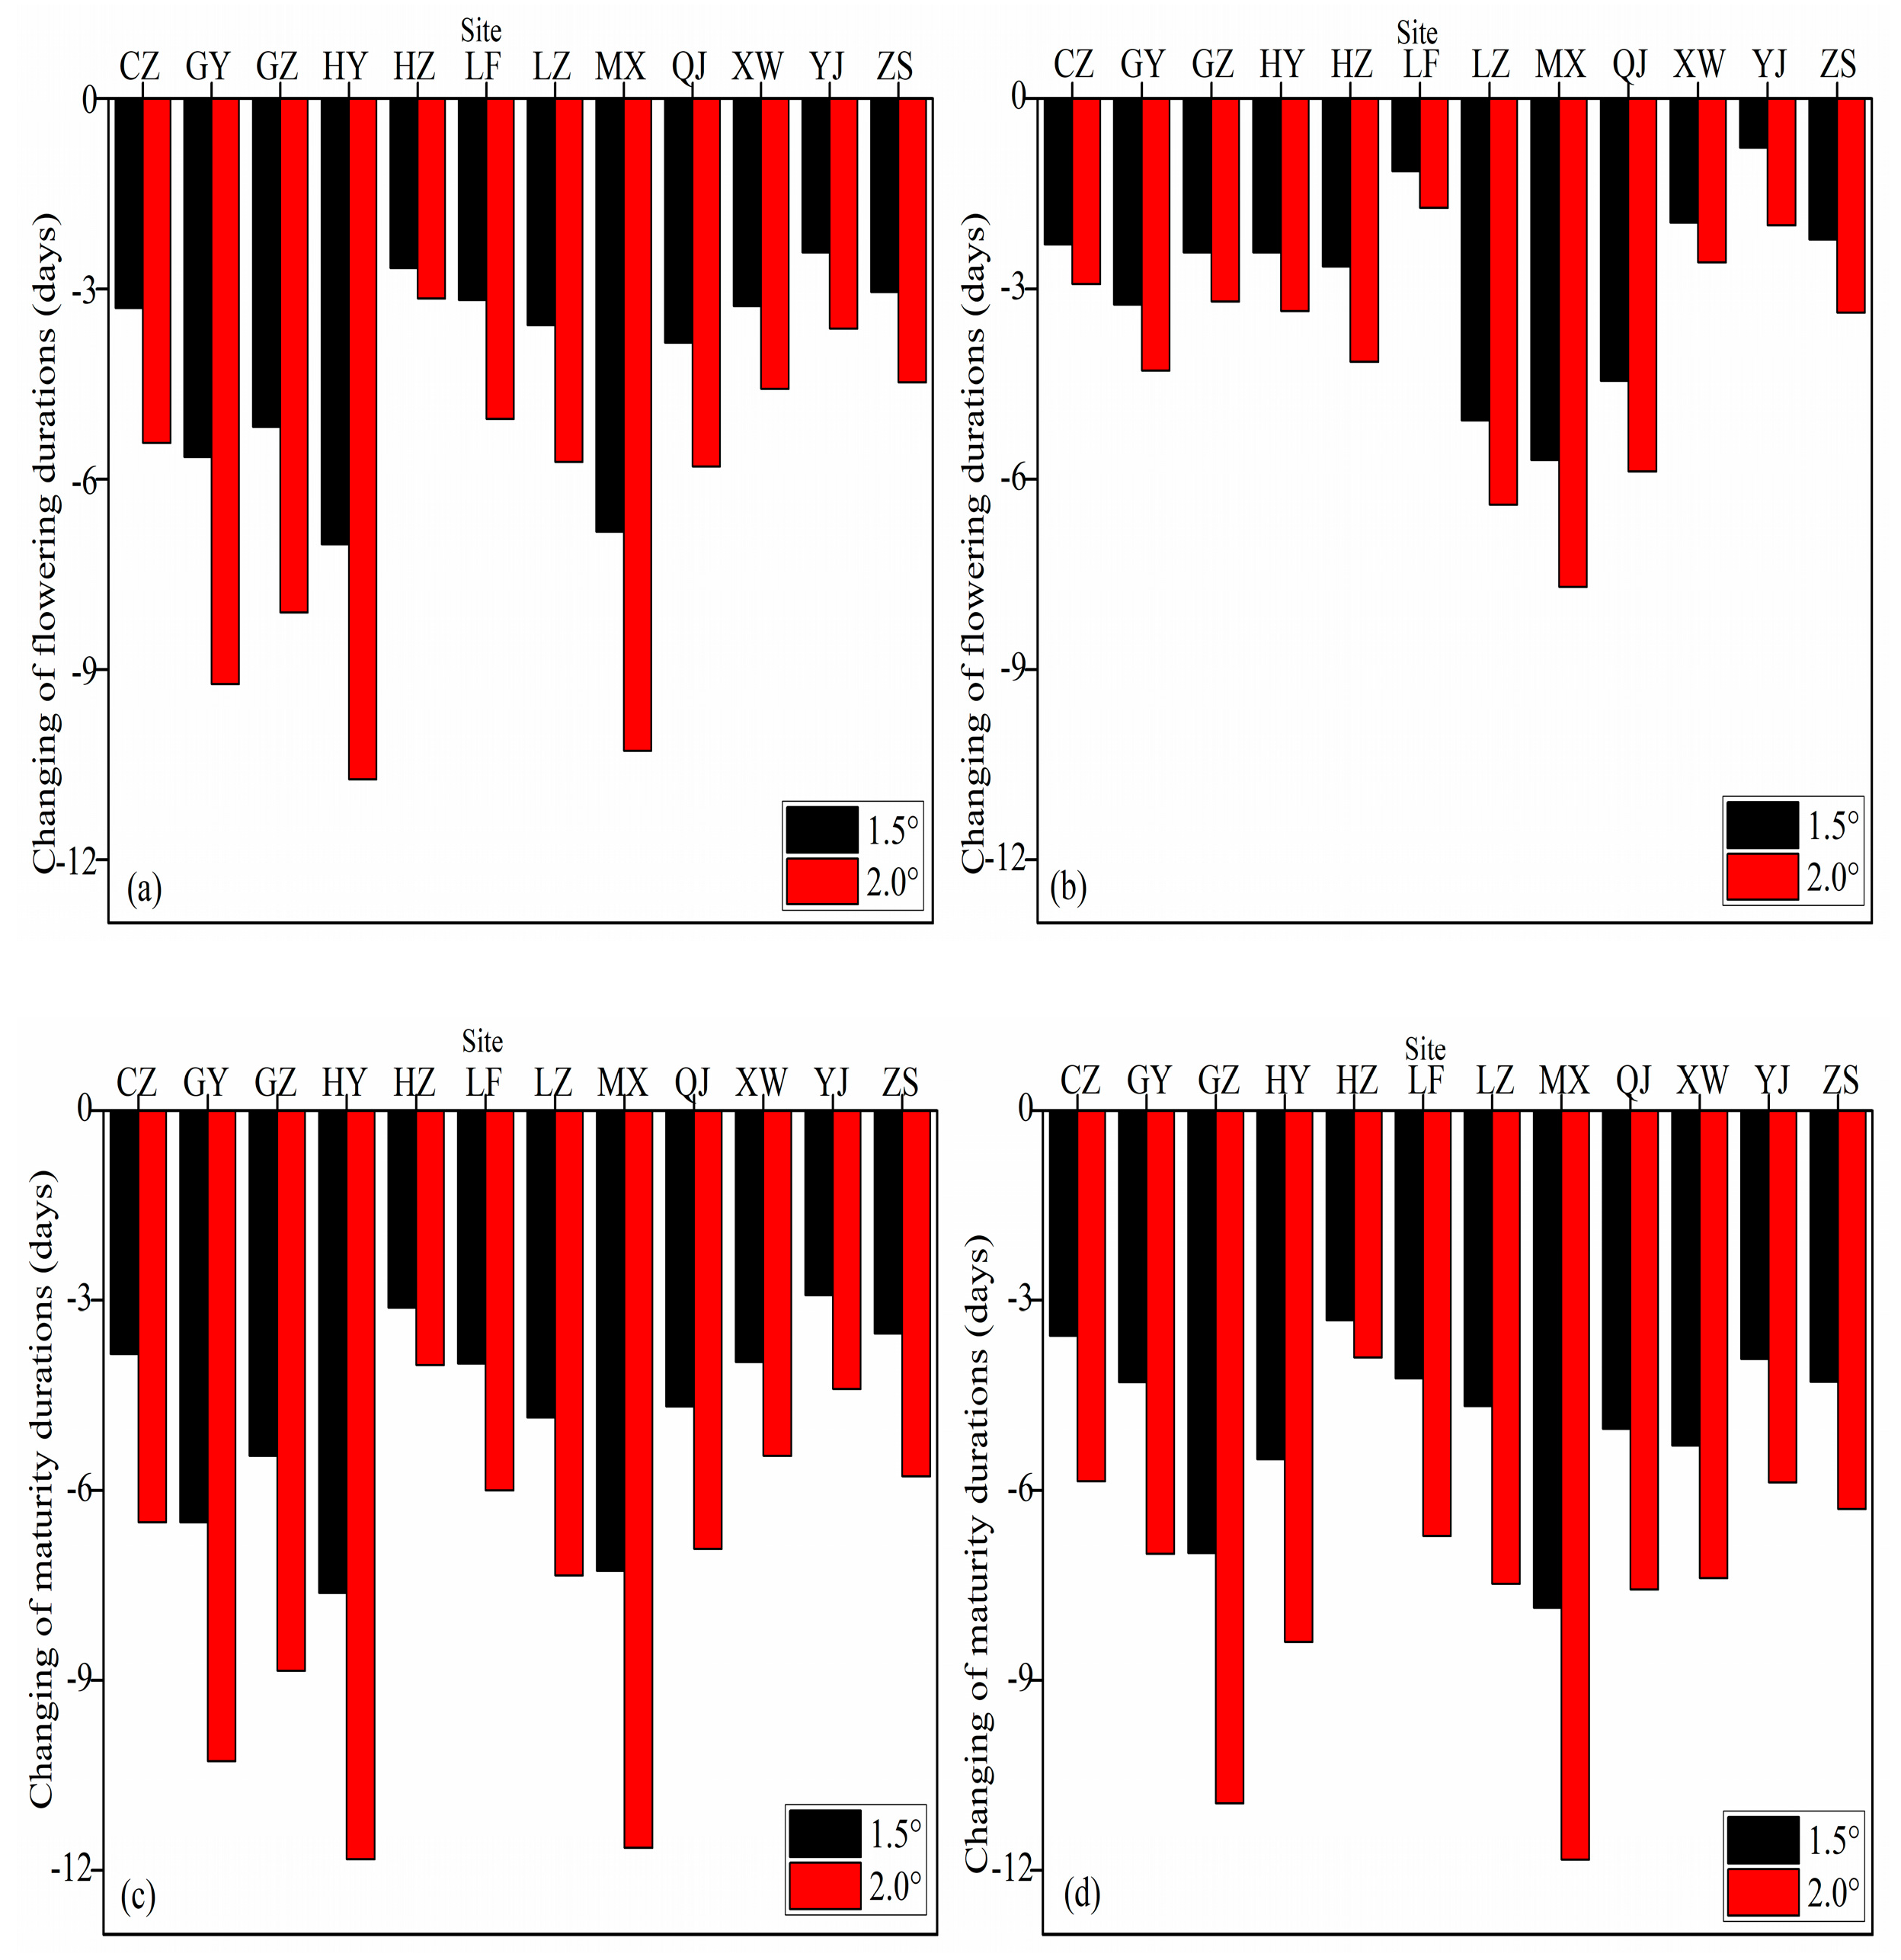
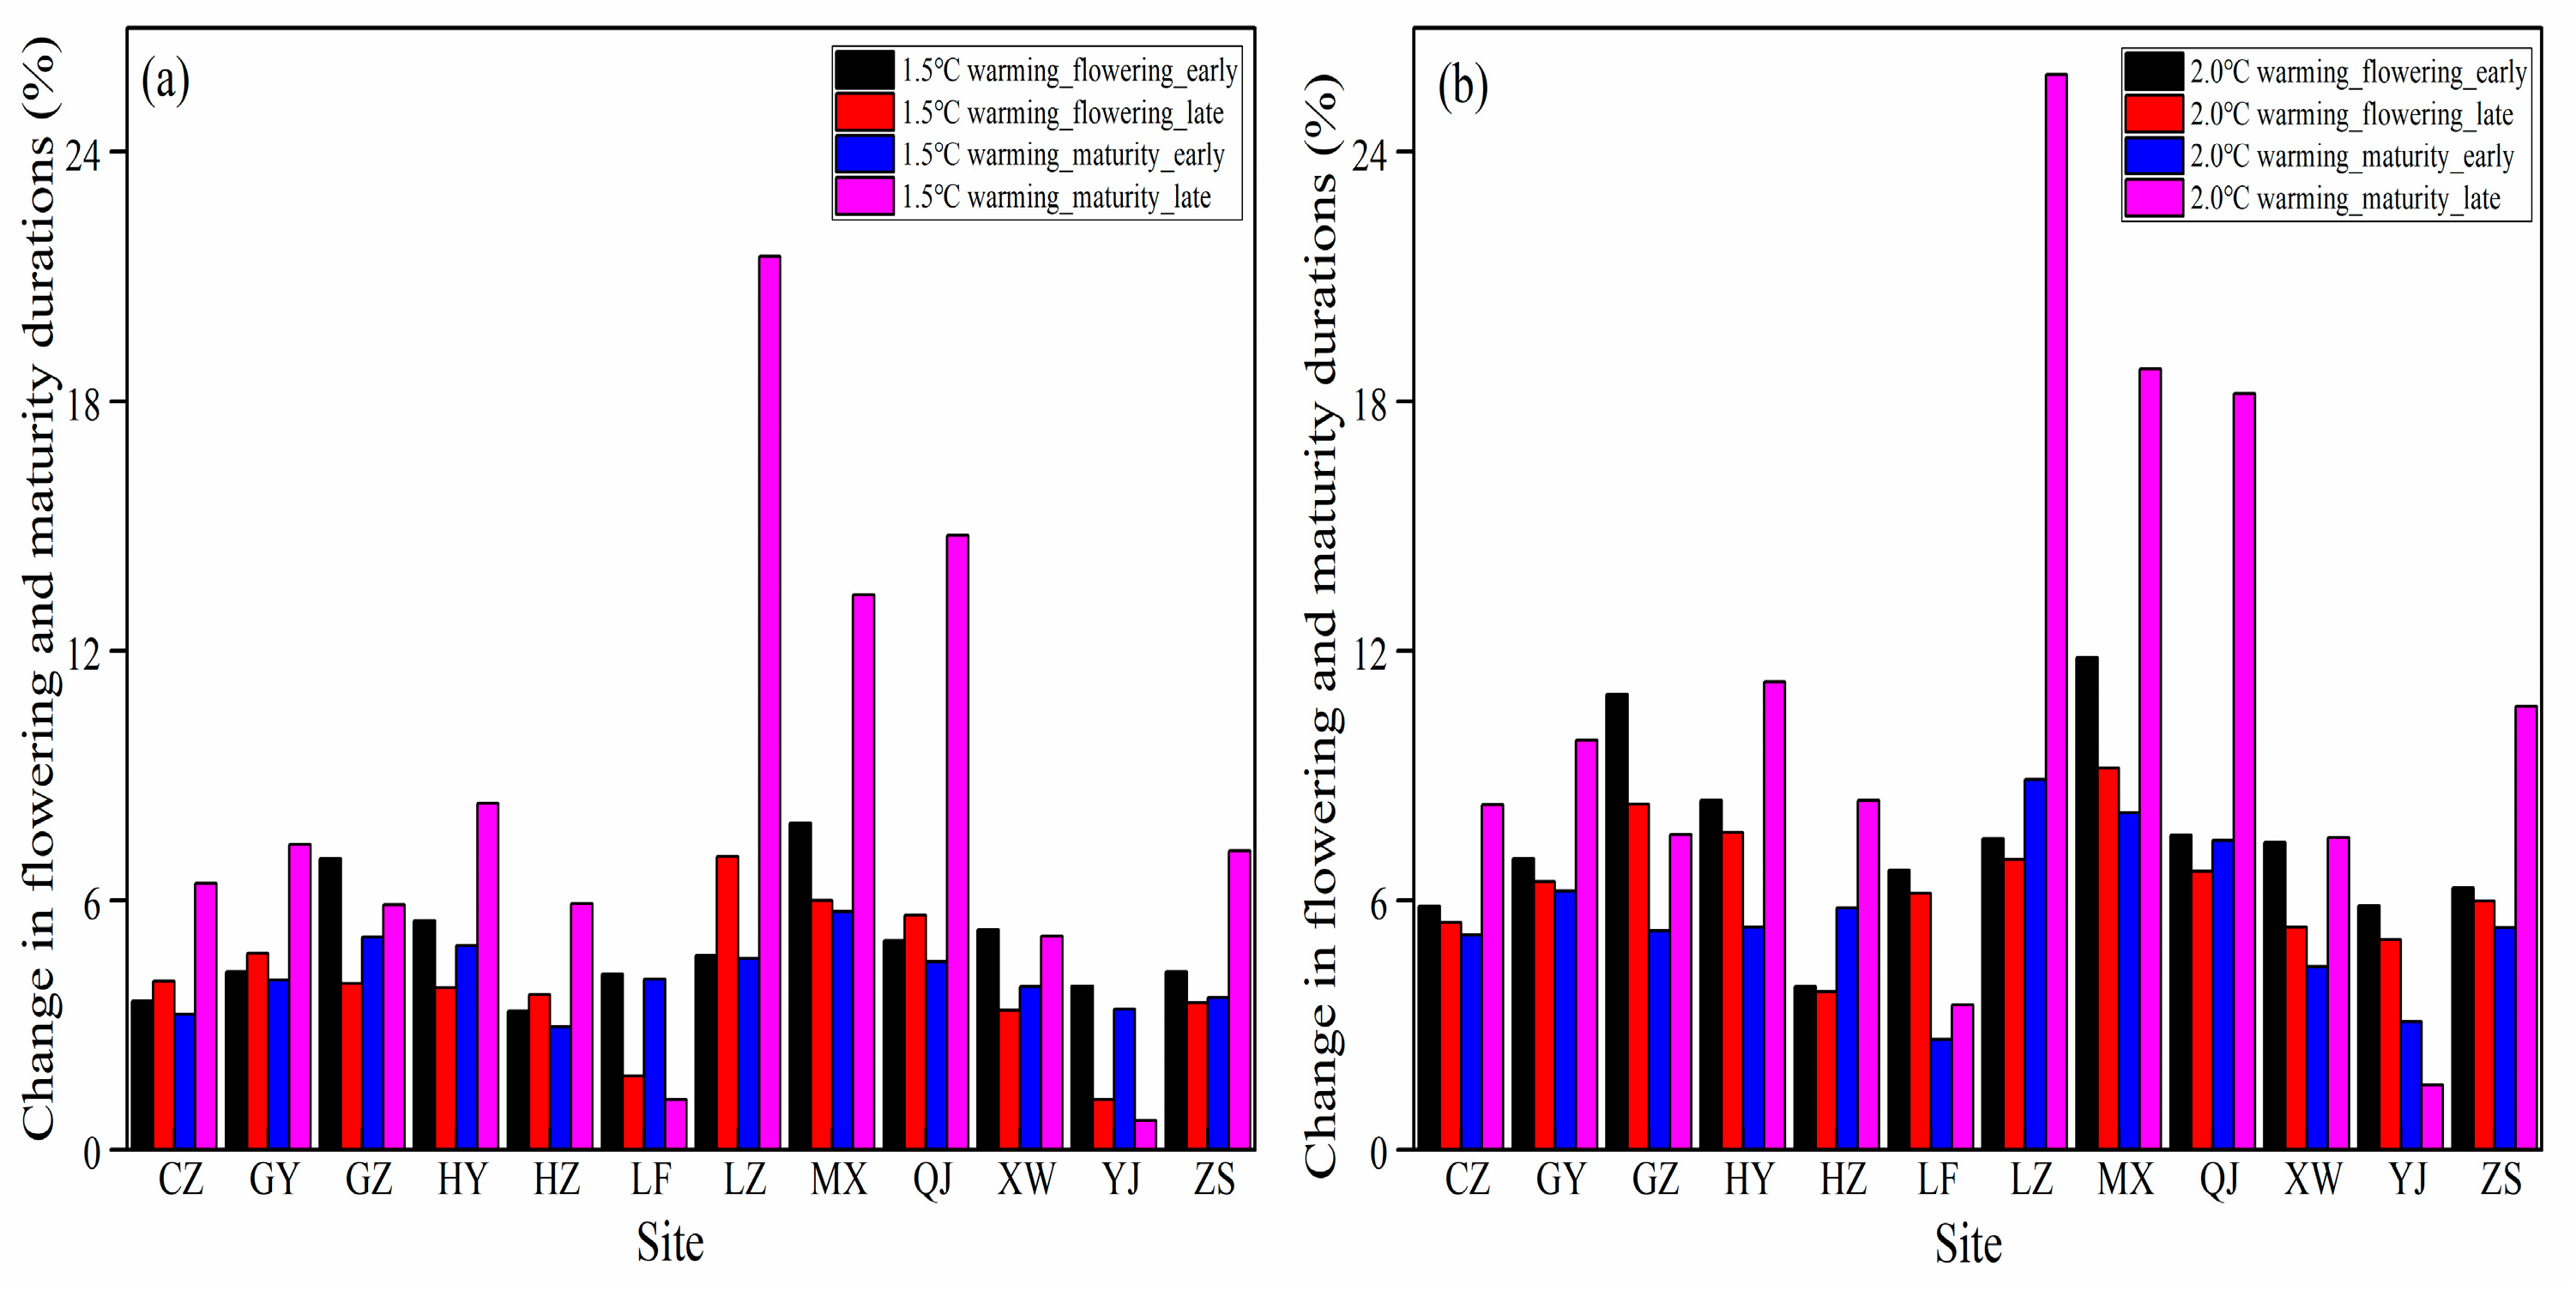
3.3. Impacts of Climate Change on the Growth Stages of the Rice Crop
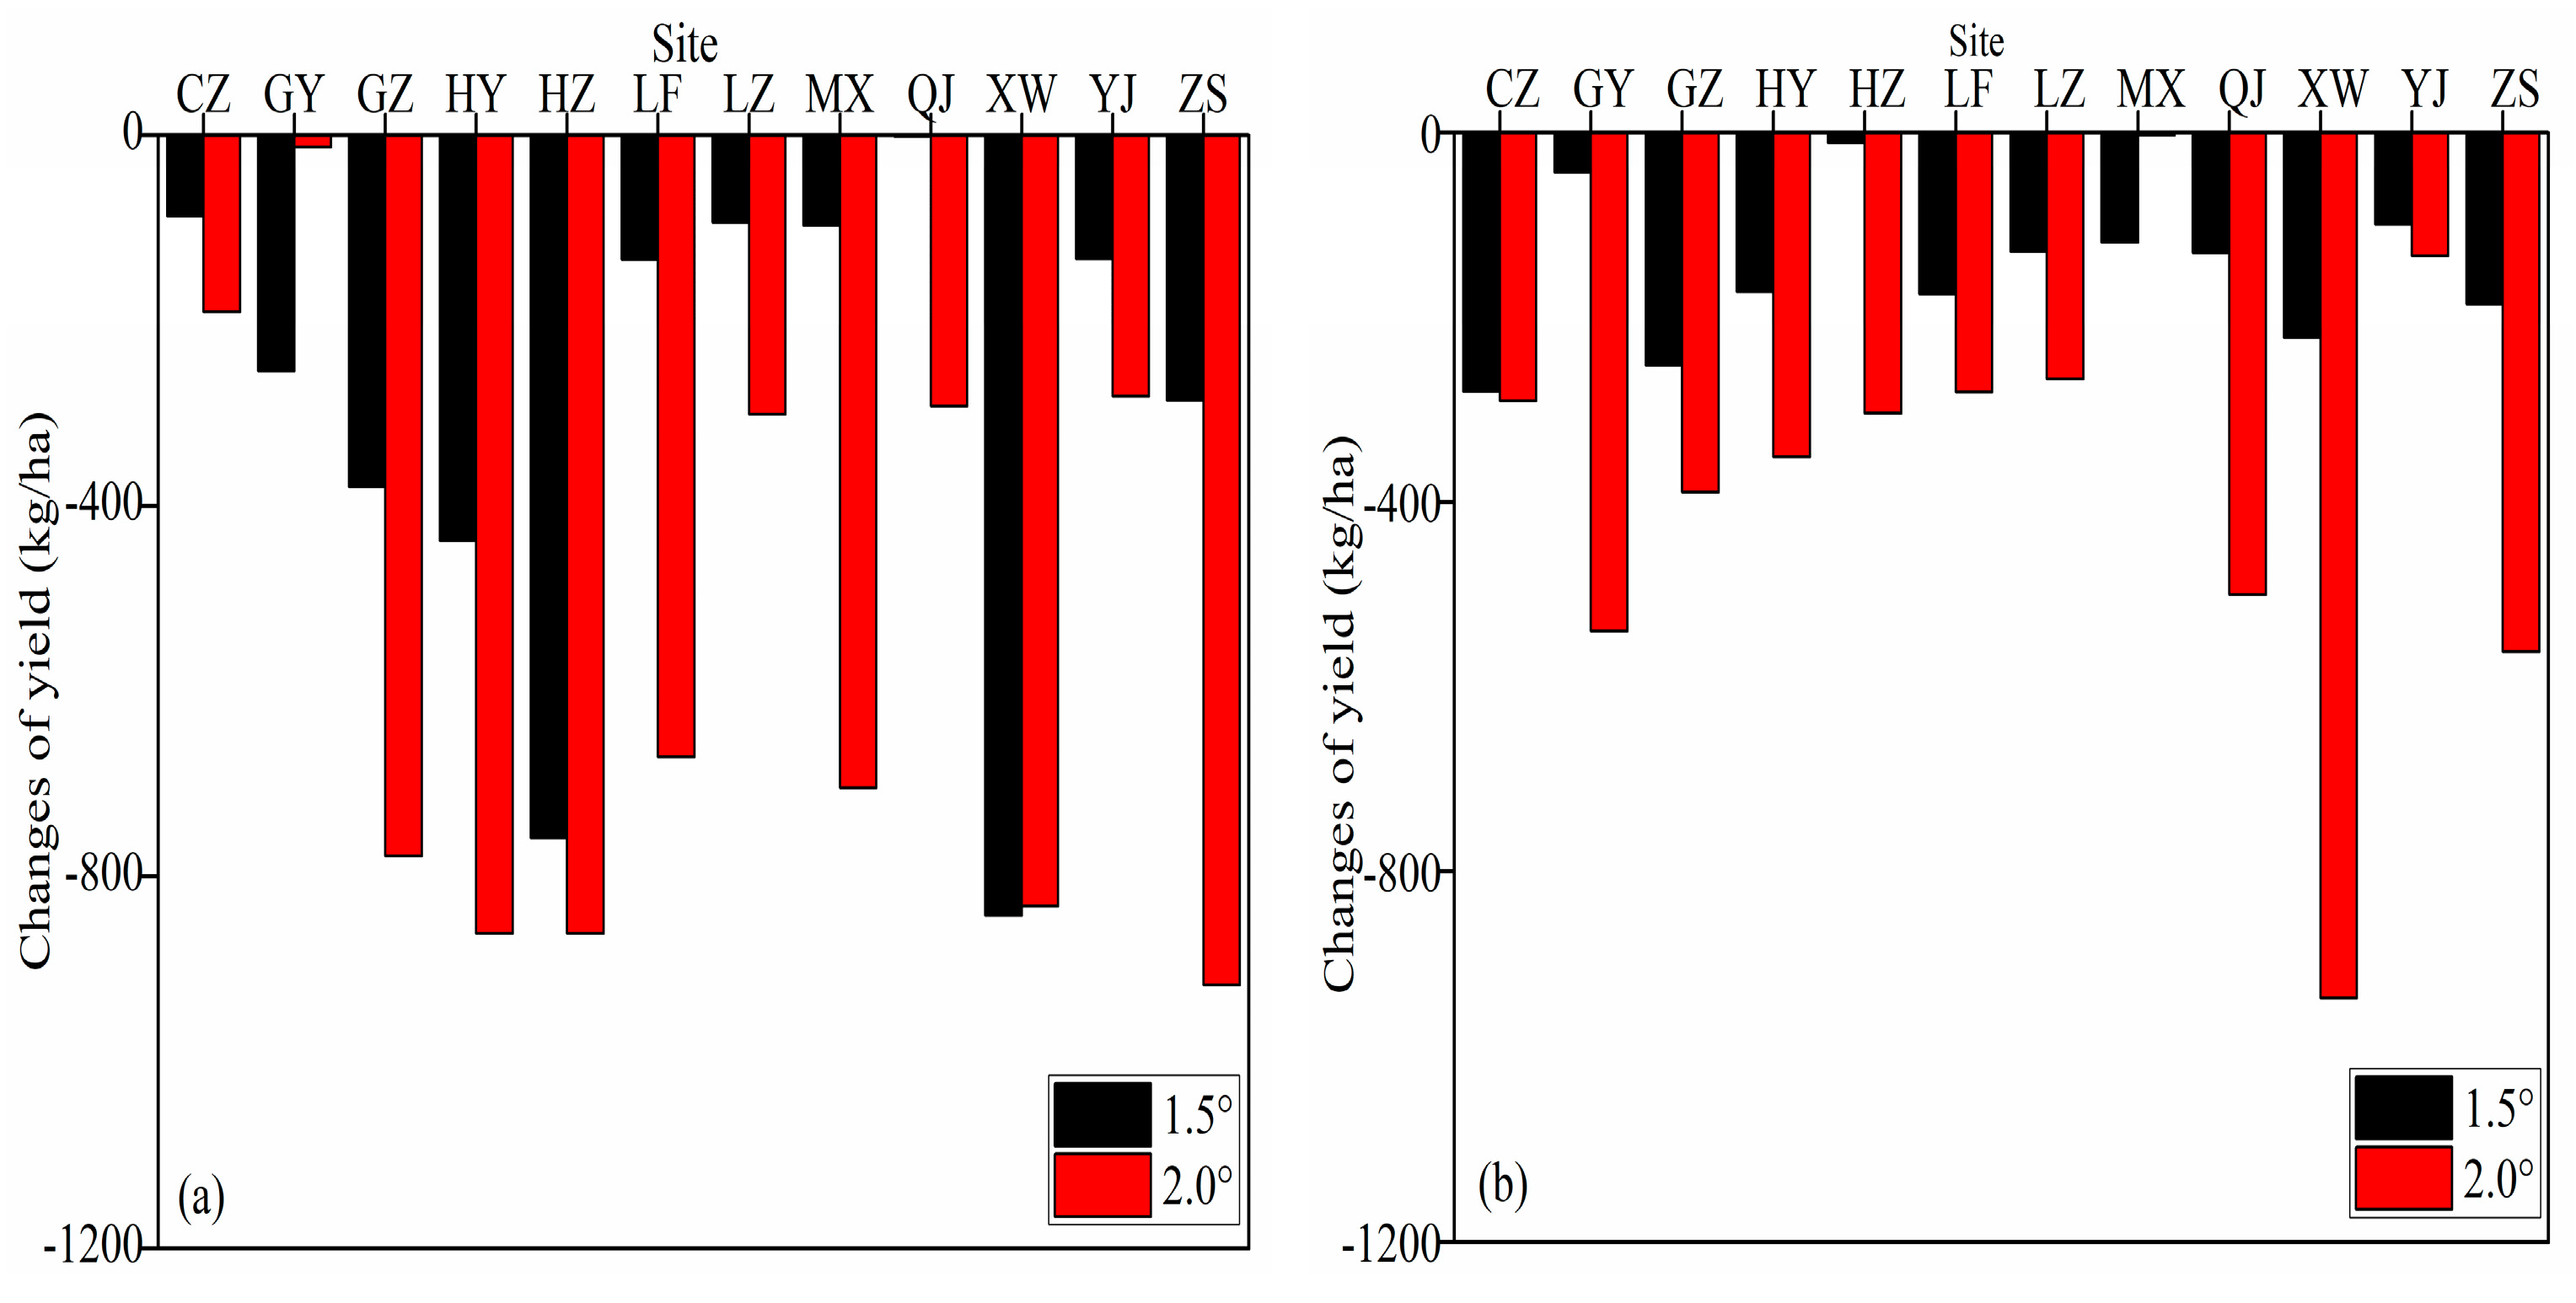
3.4. Impacts of Climate Change on Rice Yields
3.4.1. Impacts of Climate Change on Rice Yields without the CO2 Fertilization Effect
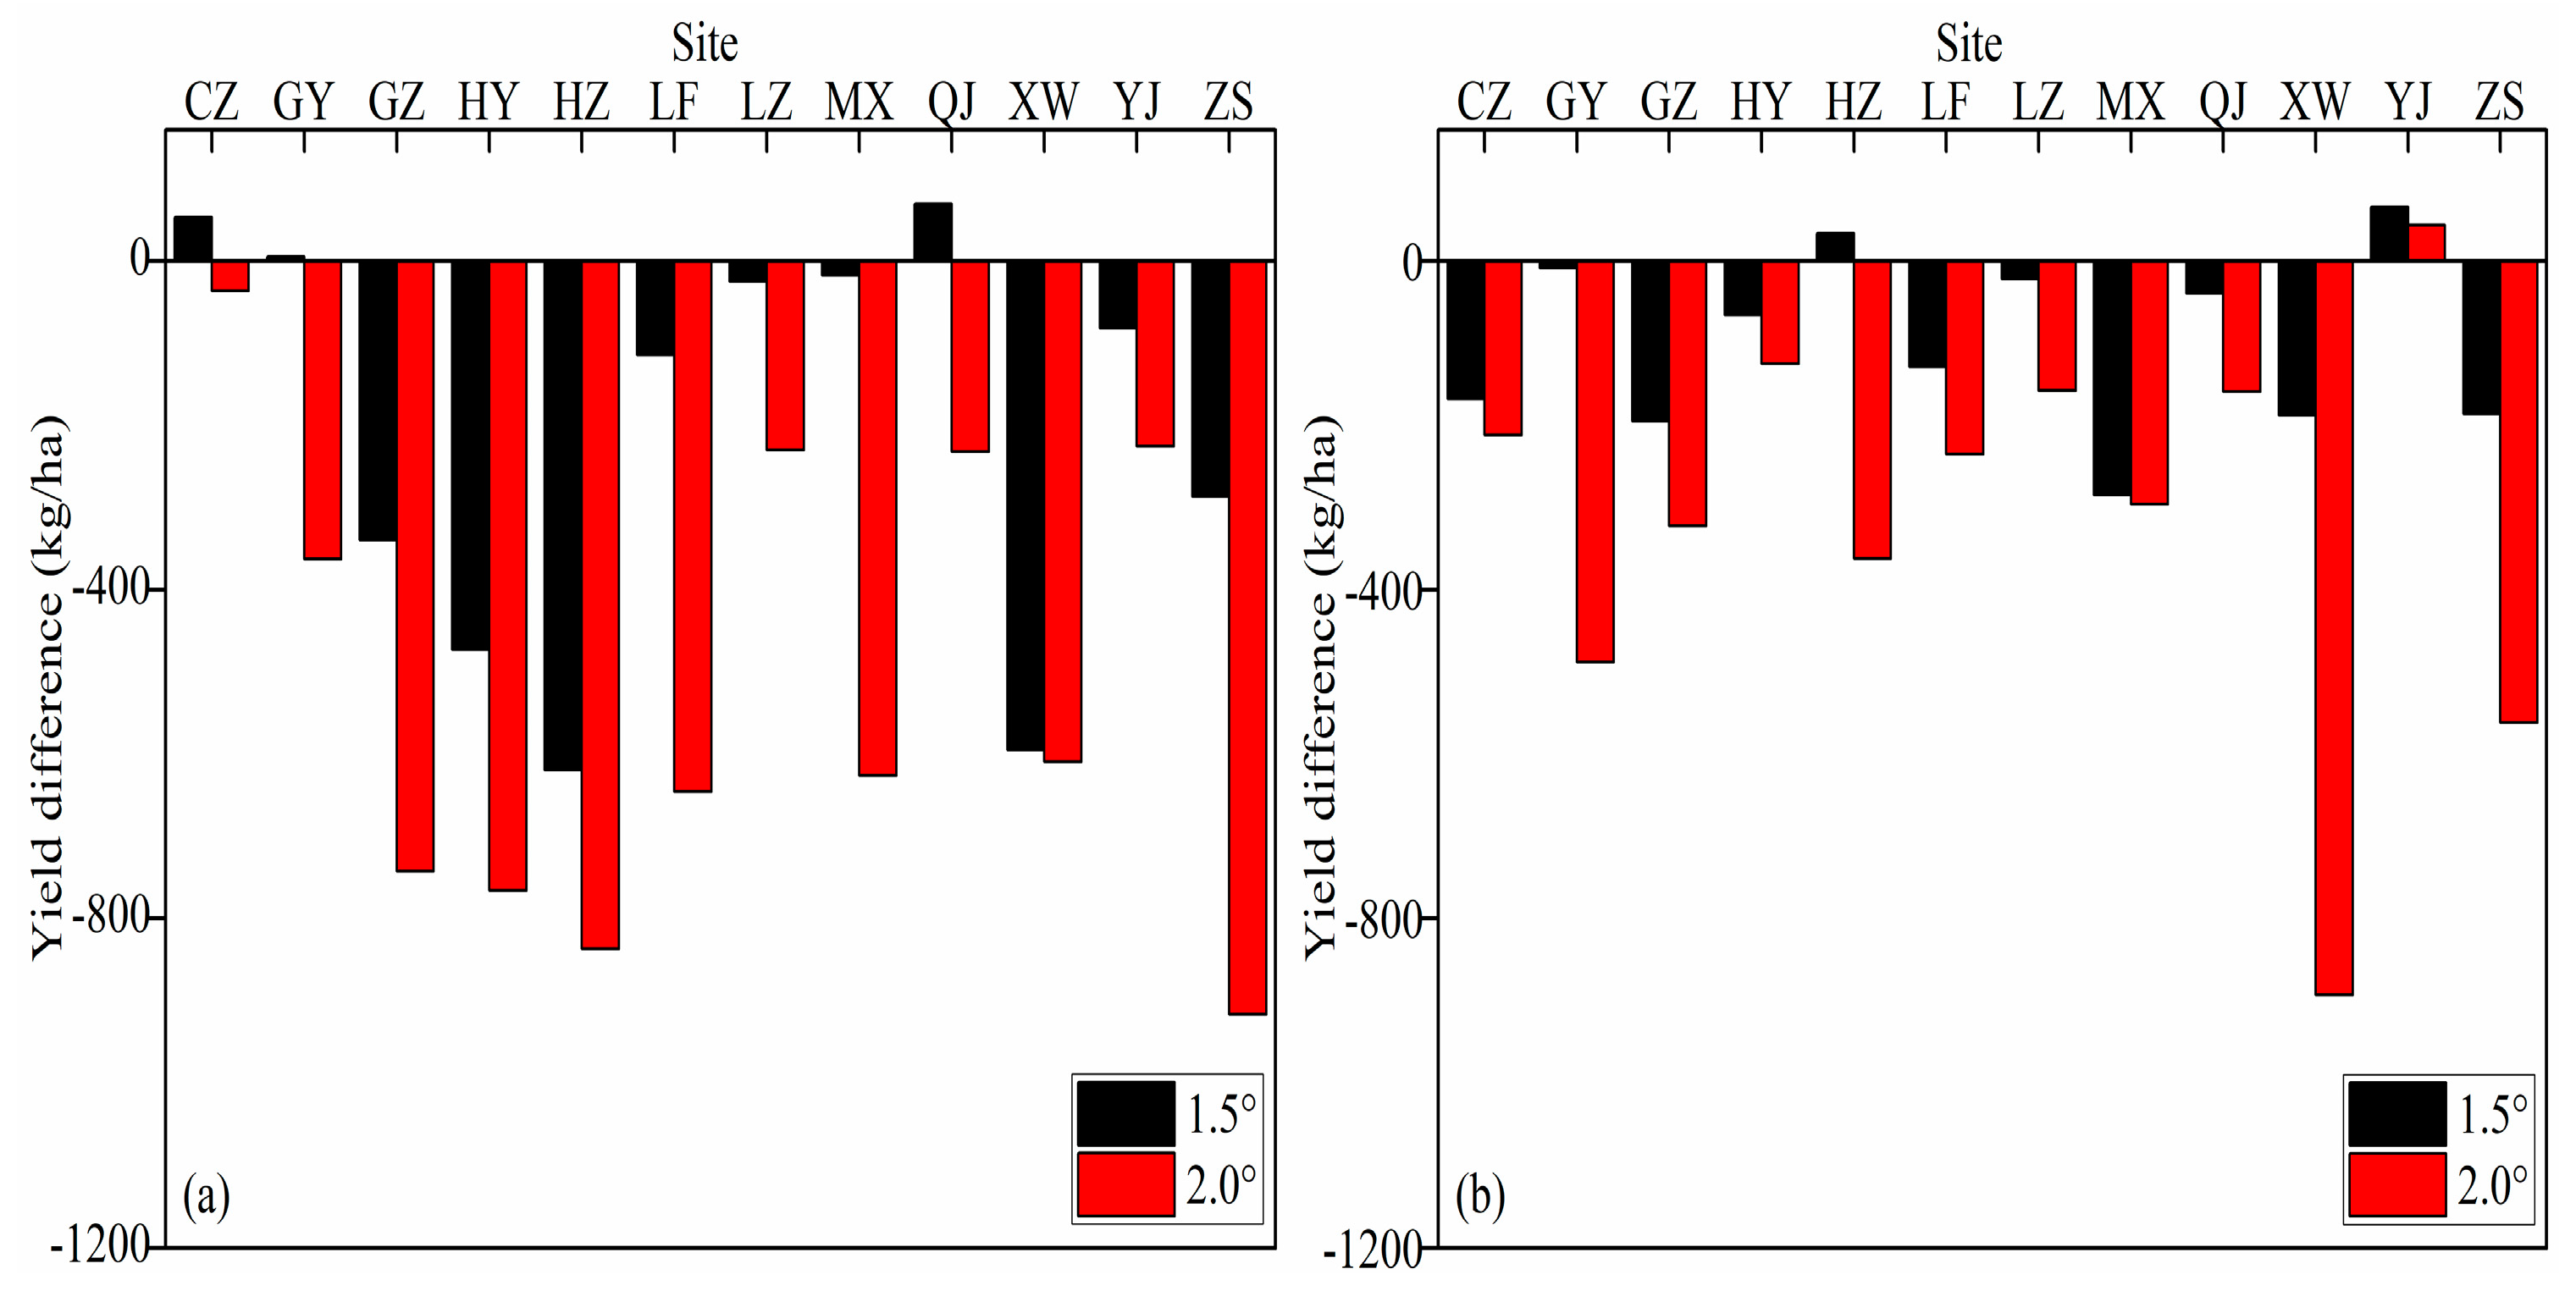
3.4.2. Impacts of CO2 Fertilization on Rice Yields
3.4.3. Analysis of the Relationship between the Climatic Variables and Rice Yields
3.5. Adaptive Measures to Increase Rice Yields
3.5.1. Adjusting Planting Dates
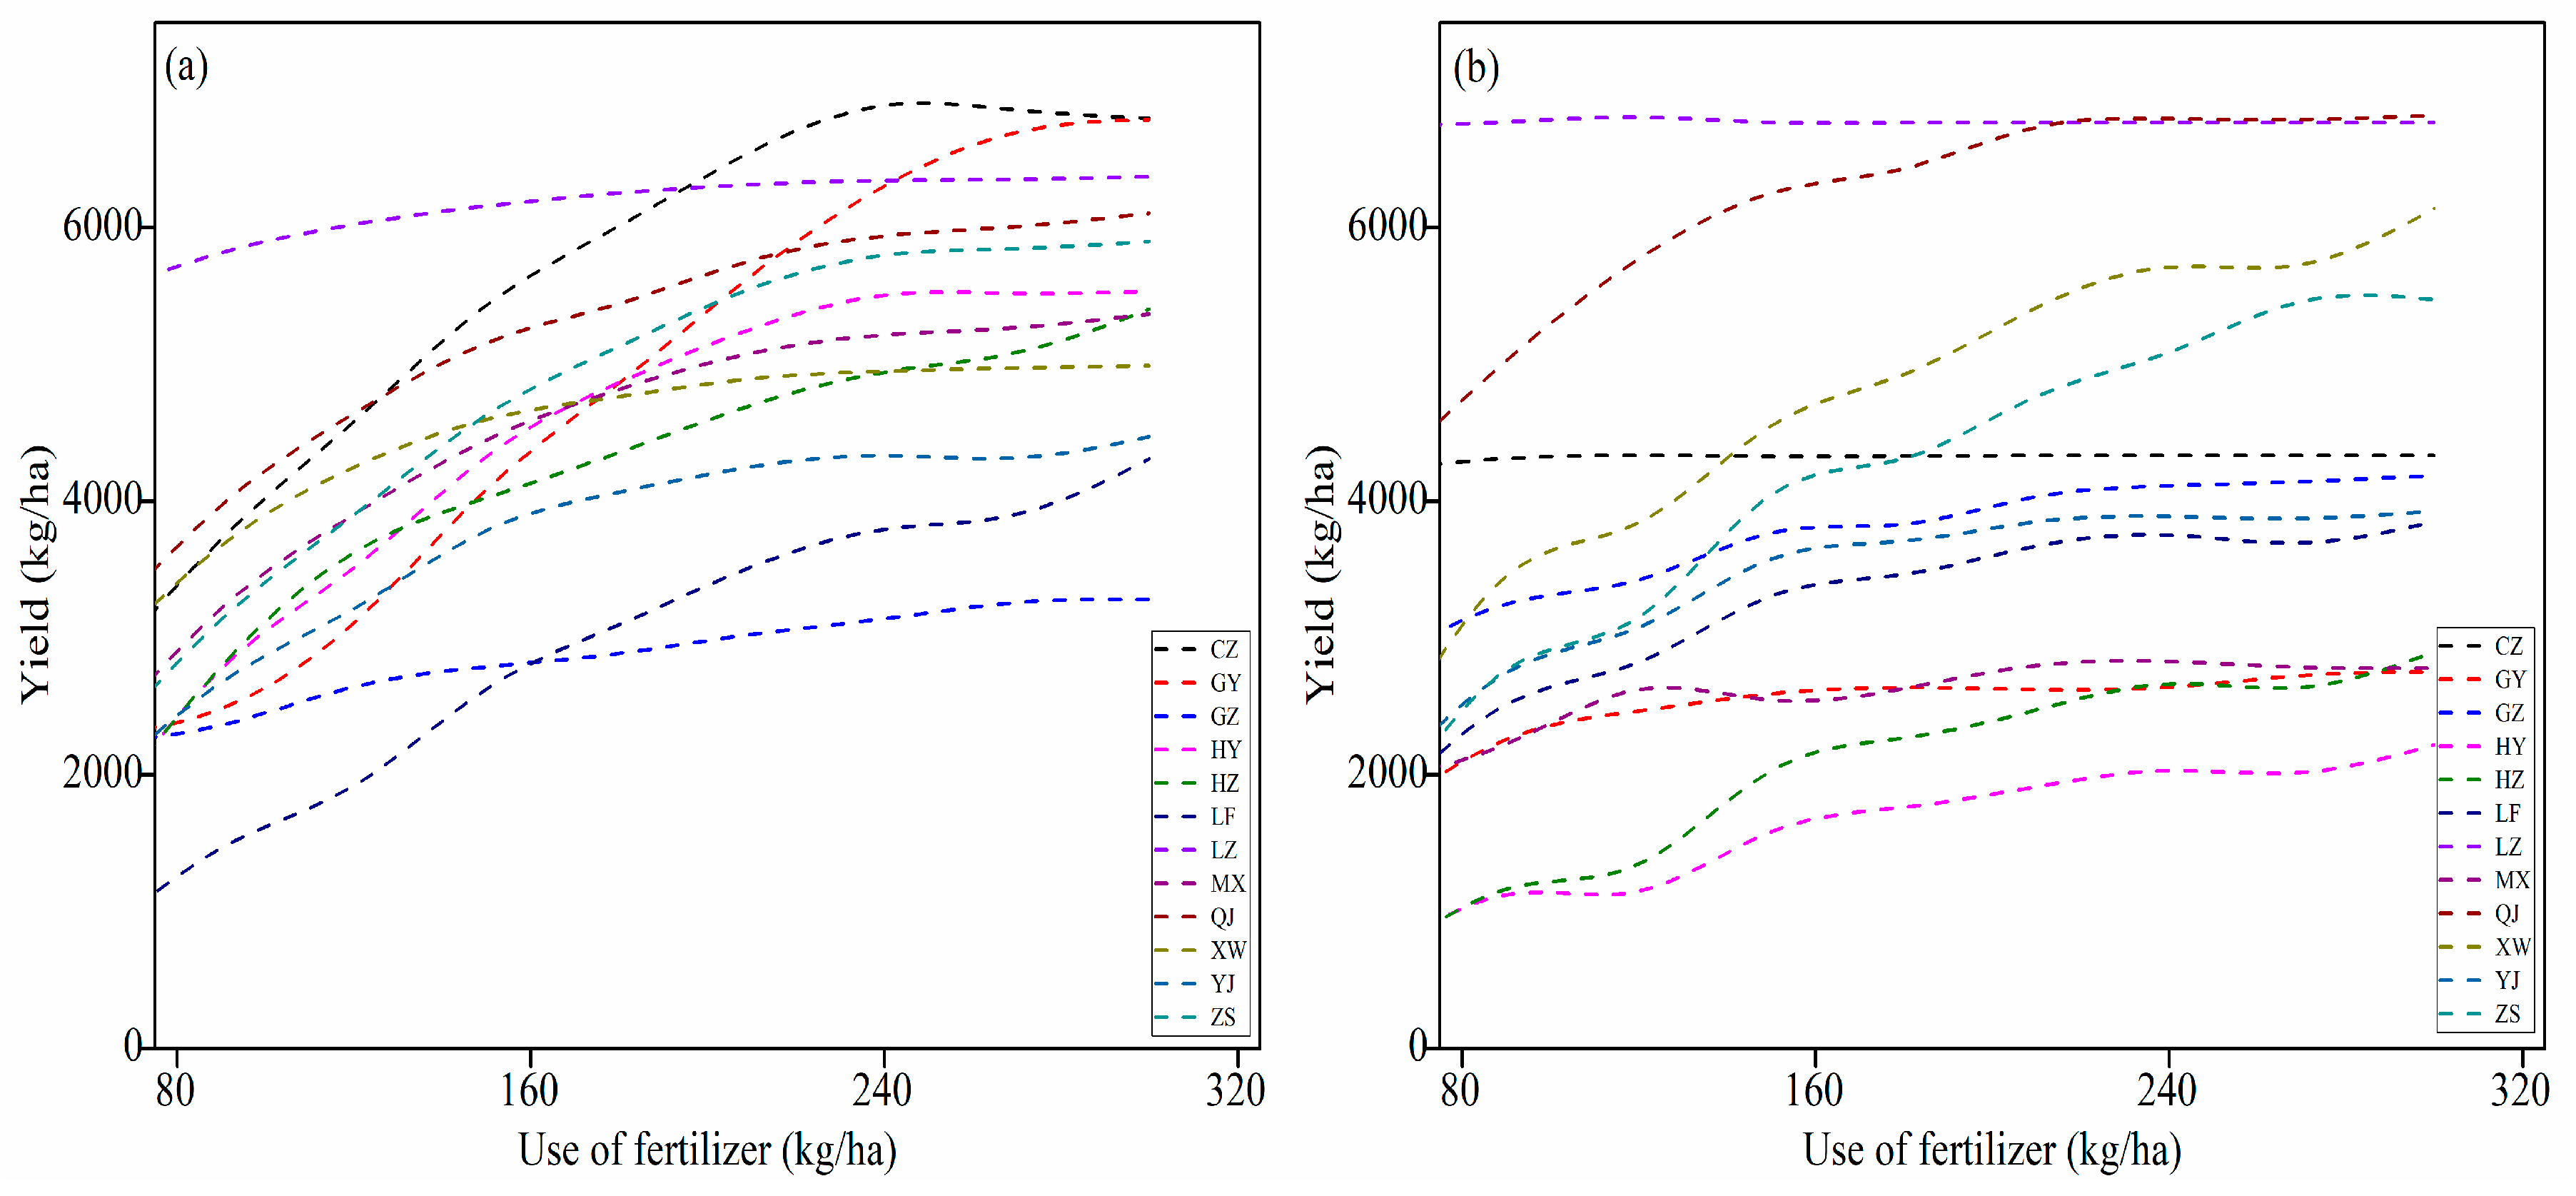
3.5.2. Identifying the Optimal Usage of Fertilizers
4. Discussion
4.1. Climate Change Impacts on Rice Yields Under the 1.5 and 2.0 °C Warming Scenarios
4.2. Optimal Management Practices to Increase Rice Yields
5. Conclusions
Author Contributions
Funding
Conflicts of Interest
Appendix A

| Sit | Color | Drainage | Runoff | Clay (%) | Organic (%) | pH | Exchange (cmol/kg) | Nitrogen (%) |
|---|---|---|---|---|---|---|---|---|
| MX | Brown | Well | Moderately High | 34.2 | 1.79 | 4.9 | 2.4 | 0.16 |
| GY | Yellow | Moderately Well | Moderately High | 18.4 | 1.4 | 5 | 3.1 | 2.11 |
| GZ | Red | Moderately Well | Moderately High | 14 | 3.46 | 7.1 | 1 | 0.18 |
| SG | Red | Moderately Well | Moderately High | 21.5 | 1.61 | 7.3 | 2.3 | 0.1 |
| LZ | Brown | Well | Moderately High | 32.9 | 3.3 | 8.1 | 3.4 | −99 |
| XW | Red | Moderately Well | Moderately High | 20.1 | 2.21 | 5.8 | 0.1 | 0.12 |
| CZ | Red | Moderately Well | Moderately High | 35 | 2.43 | 7.5 | 1 | 0.11 |
| YJ | Red | Well | Moderately High | 14.2 | 2.06 | 4.8 | 1.1 | 0.12 |
| HY | Yellow | Moderately Well | Moderately High | 14 | 1.99 | 4.9 | 1.3 | 0.09 |
| HZ | Red | Moderately Well | Moderately High | 6.7 | 0.89 | 5 | 0.7 | 0.06 |
| LF | Red | Moderately Well | Moderately High | 11.5 | 2.51 | 5 | 2.5 | 0.13 |
| ZS | Red | Well | Moderately High | 14.2 | 2.06 | 4.8 | 1.1 | 0.12 |
| Site | Cropping | Cultivar | Planting | Emergence | Tillering | Jointing | Booting | Heading | Maturing | Urea (kg) | Compound (kg) |
|---|---|---|---|---|---|---|---|---|---|---|---|
| CZ | Early mature | Teyou254 | 2/18 | 2/22 | 4/2 | 5/8 | 5/30 | 6/10 | 7/11 | 25.5 | 60 |
| Late mature | Xieyou3550 | 7/18 | 7/22 | 8/14 | 9/10 | 9/22 | 10/2 | 11/10 | 27 | 60 | |
| GY | Early mature | Xuehuanian | 3/7 | 3/12 | 4/20 | 5/18 | 6/4 | 6/14 | 7/9 | 10 | 50 |
| Late mature | Xuehuanian | 7/6 | 7/10 | 8/18 | 9/6 | 9/16 | 9/30 | 11/4 | 5 | 45 | |
| HY | Early mature | Zayou | 3/23 | 3/27 | 5/6 | 5/26 | 6/10 | 6/20 | 7/18 | 1.5 | 35 |
| Late mature | Zayou | 7/11 | 7/15 | 8/18 | 9/4 | 9/14 | 9/24 | 10/26 | 42.5 | ||
| HZ | Early mature | Qishanzhan | 3/28 | 3/31 | 5/2 | 5/26 | 6/12 | 6/19 | 7/18 | 15 | 85 |
| Late mature | Gaozhoubaigu | 7/16 | 7/19 | 8/16 | 9/8 | 9/24 | 10/3 | 10/31 | 50 | 20 | |
| LZ | Early mature | Jinyou207 | 3/27 | 3/29 | 5/3 | 5/25 | 6/15 | 6/22 | 7/18 | 40 | 20 |
| Late mature | Jinyou253 | 7/5 | 7/7 | 7/29 | 8/21 | 9/14 | 9/20 | 10/25 | 50 | 50 | |
| LF | Early mature | YouI402 | 3/12 | 3/19 | 4/20 | 5/27 | 6/17 | 6/22 | 7/28 | 20 | 30 |
| Late mature | Yueyou350 | 7/22 | 7/24 | 8/20 | 9/2 | 9/23 | 10/6 | 11/7 | 10 | 30 | |
| MX | Early mature | Meiyou6 | 3/8 | 3/10 | 4/24 | 5/18 | 5/28 | 6/4 | 7/8 | 30.5 | 18 |
| Late mature | Meiyou6 | 7/17 | 7/19 | 8/14 | 9/8 | 9/18 | 9/26 | 11/4 | 34 | 16 | |
| QJ | Early mature | Jufengnian | 3/7 | 3/10 | 4/27 | 5/16 | 6/3 | 6/11 | 7/11 | 16 | 30 |
| Late mature | Baikenian | 7/7 | 7/11 | 8/4 | 8/22 | 9/14 | 9/20 | 10/20 | 15 | 45 | |
| GZ | Early mature | Meixiangzhan | 3/20 | 3/23 | 5/3 | 5/25 | 6/6 | 6/15 | 7/13 | 20 | 25 |
| Late mature | Teshan25 | 7/23 | 7/26 | 8/26 | 9/10 | 9/24 | 10/3 | 11/3 | 25 | 27.5 | |
| XW | Early mature | Gaokang999 | 2/26 | 3/2 | 4/24 | 5/10 | 5/30 | 6/7 | 7/6 | 35 | |
| Late mature | Boyou15 | 7/19 | 7/22 | 8/28 | 9/20 | 10/4 | 10/12 | 11/10 | 10 | 25 | |
| YJ | Early mature | Zayou | 3/21 | 3/24 | 5/3 | 6/2 | 6/14 | 6/23 | 7/19 | 35 | 12 |
| Late mature | Zayou | 7/21 | 7/23 | 8/20 | 9/21 | 9/29 | 10/7 | 11/8 | 45 | 30 | |
| ZS | Early mature | Tainanzhan | 2/21 | 2/27 | 4/23 | 5/14 | 6/1 | 6/11 | 7/3 | 22 | |
| Late mature | Tainanzhan | 7/14 | 7/16 | 8/12 | 9/8 | 9/16 | 9/23 | 10/14 | 50 |
| Site | Latitude | Longitude | Cropping | Cultivar | P1 | P2R | P5 | P2O | G1 | G2 | G3 | G4 |
|---|---|---|---|---|---|---|---|---|---|---|---|---|
| CZ | 23.4 | 116.42 | Early mature | Teyou254 | 500.0 | 200.0 | 400.0 | 12.1 | 100.0 | 0.0270 | 0.11 | 1.00 |
| Late mature | Xieyou3550 | 550.0 | 250.0 | 400.0 | 12.2 | 120.0 | 0.0270 | 0.11 | 1.00 | |||
| GY | 23.02 | 112.27 | Early mature | Xuehuanian | 200.0 | 400.0 | 400.0 | 11.2 | 300.0 | 0.0220 | 1.00 | 1.00 |
| Late mature | Xuehuanian | 210.0 | 410.0 | 400.0 | 11.3 | 300.0 | 0.0220 | 1.00 | 1.00 | |||
| HY | 23.48 | 114.44 | Early mature | Zayou | 400.0 | 400.0 | 600.0 | 11.1 | 300.0 | 0.0110 | 0.55 | 1.00 |
| Late mature | Zayou | 400.0 | 400.0 | 500.0 | 11.2 | 300.0 | 0.0110 | 0.55 | 1.00 | |||
| HZ | 21.39 | 110.37 | Early mature | Qishanzhan | 400.0 | 300.0 | 400.0 | 12.1 | 200.0 | 0.0240 | 0.44 | 1.00 |
| Late mature | Gaozhoubaigu | 410.0 | 320.0 | 400.0 | 12.1 | 200.0 | 0.0240 | 0.44 | 1.00 | |||
| LZ | 24.48 | 112.22 | Early mature | Jinyou207 | 100.0 | 300.0 | 500.0 | 12.2 | 500.0 | 0.0220 | 1.00 | 1.00 |
| Late mature | Jinyou253 | 110.0 | 320.0 | 310.0 | 12.2 | 500.0 | 0.0220 | 1.00 | 1.00 | |||
| LF | 22.87 | 115.39 | Early mature | YouI402 | 100.0 | 300.0 | 300.0 | 12.1 | 100.0 | 0.0270 | 0.11 | 1.00 |
| Late mature | Yueyou350 | 300.0 | 300.0 | 500.0 | 12.3 | 300.0 | 0.0270 | 0.11 | 1.00 | |||
| MX | 24.17 | 116.04 | Early mature | Meiyou6 | 120.0 | 300.0 | 580.0 | 12.2 | 500.0 | 0.0220 | 1.00 | 1.00 |
| Late mature | Meiyou6 | 400.0 | 400.0 | 500.0 | 12.2 | 500.0 | 0.0220 | 1.00 | 1.00 | |||
| QJ | 24.4 | 113.36 | Early mature | Jufengnian | 200.0 | 200.0 | 350.0 | 12.1 | 350.0 | 0.0230 | 1.00 | 1.00 |
| Late mature | Baikenian | 300.0 | 300.0 | 500.0 | 12.2 | 500.0 | 0.0220 | 0.66 | 1.00 | |||
| GZ | 23.13 | 113.29 | Early mature | Meixiangzhan | 100.0 | 300.0 | 500.0 | 12.3 | 100.0 | 0.0270 | 0.11 | 1.00 |
| Late mature | Teshan25 | 120.0 | 320.0 | 500.0 | 12.3 | 100.0 | 0.0280 | 0.11 | 1.00 | |||
| XW | 20.2 | 110.11 | Early mature | Gaokang999 | 300.0 | 200.0 | 350. | 12.1 | 350.0 | 0.0230 | 1.00 | 1.00 |
| Late mature | Boyou15 | 310.0 | 220.0 | 350.0 | 12.1 | 350.0 | 0.0230 | 1.00 | 1.00 | |||
| YJ | 21.5 | 111.58 | Early mature | Zayou | 100.0 | 200.0 | 350.0 | 12.1 | 310.0 | 0.0350 | 0.26 | 1.00 |
| Late mature | Zayou | 400.0 | 200.0 | 350.0 | 12.1 | 350.0 | 0.0350 | 1.00 | 1.00 | |||
| ZS | 22.3 | 113.24 | Early mature | Tainanzhan | 500.0 | 200.0 | 350.0 | 13.8 | 300.0 | 0.025 | 1.00 | 1.00 |
| Late mature | Tainanzhan | 220.0 | 240.0 | 700.0 | 12.1 | 310.0 | 0.035 | 0.26 | 1.00 |
| Site | CZ | GY | GZ | HY | HZ | LF | LZ | MX | SG | XW | YJ | ZS |
|---|---|---|---|---|---|---|---|---|---|---|---|---|
| 11.9 | 9.9 | 10.4 | 11.3 | 10.4 | 12.0 | 8.6 | 11.1 | 9.2 | 11.1 | 12.0 | 10.8 | |
| 9.8 | 8.2 | 8.6 | 9.1 | 9.7 | 10.4 | 7.1 | 8.8 | 7.4 | 11.9 | 10.3 | 9.4 | |
| 11.4 | 10.1 | 10.1 | 10.5 | 12.1 | 11.8 | 8.9 | 10.0 | 8.8 | 14.5 | 11.7 | 10.2 | |
| 12.6 | 11.6 | 11.6 | 12.0 | 14.0 | 13.7 | 10.1 | 11.4 | 10.2 | 17.6 | 13.7 | 12.7 | |
| 16.5 | 15.6 | 15.8 | 16.2 | 18.6 | 17.6 | 14.0 | 15.7 | 14.3 | 20.9 | 17.5 | 17.9 | |
| 16.3 | 16.4 | 16.4 | 16.2 | 18.6 | 18.2 | 14.8 | 15.6 | 15.1 | 21.4 | 18.1 | 18.1 | |
| 17.3 | 16.7 | 16.7 | 16.9 | 16.8 | 19.0 | 15.7 | 17.1 | 15.9 | 20.1 | 19.0 | 17.9 | |
| 16.8 | 15.7 | 15.9 | 16.4 | 16.3 | 18.7 | 14.9 | 16.6 | 15.0 | 18.8 | 18.6 | 16.9 | |
| 15.3 | 14.3 | 14.7 | 15.1 | 15.3 | 16.7 | 13.4 | 14.9 | 13.5 | 15.8 | 16.5 | 15.1 | |
| 14.7 | 14.5 | 14.8 | 14.7 | 14.6 | 16.1 | 13.3 | 14.2 | 13.8 | 15.0 | 15.9 | 14.4 | |
| 14.4 | 14.4 | 14.5 | 14.7 | 14.9 | 15.2 | 13.4 | 14.1 | 13.8 | 14.6 | 15.1 | 14.6 | |
| 12.8 | 12.3 | 12.5 | 12.8 | 12.5 | 13.3 | 11.2 | 12.6 | 11.7 | 12.6 | 13.3 | 12.5 | |
| 18.8 | 17.2 | 18.6 | 18.9 | 19.9 | 19.3 | 13.7 | 17.1 | 15.6 | 21.2 | 19.4 | 18.0 | |
| 19.0 | 17.5 | 18.9 | 19.1 | 20.2 | 19.6 | 14.3 | 17.6 | 16.1 | 22.8 | 19.9 | 18.3 | |
| 21.5 | 20.4 | 21.6 | 22.0 | 23.1 | 22.1 | 17.3 | 20.6 | 19.0 | 26.2 | 22.7 | 21.1 | |
| 24.7 | 24.0 | 25.1 | 25.4 | 26.6 | 25.0 | 21.6 | 24.1 | 23.0 | 29.7 | 25.9 | 24.7 | |
| 28.7 | 29.3 | 30.4 | 30.0 | 31.9 | 28.8 | 27.3 | 28.4 | 28.6 | 33.4 | 30.1 | 29.2 | |
| 30.8 | 31.4 | 32.3 | 30.0 | 33.4 | 30.7 | 29.8 | 30.5 | 31.2 | 34.7 | 31.9 | 31.2 | |
| 31.8 | 31.9 | 32.7 | 32.2 | 33.3 | 31.3 | 30.6 | 31.5 | 32.0 | 34.3 | 32.7 | 31.8 | |
| 31.9 | 31.5 | 32.3 | 32.2 | 32.7 | 31.6 | 30.0 | 31.4 | 31.5 | 33.4 | 32.8 | 31.6 | |
| 30.9 | 30.2 | 31.2 | 31.1 | 31.5 | 30.9 | 28.3 | 30.0 | 29.9 | 31.7 | 31.5 | 30.4 | |
| 28.5 | 27.9 | 29.1 | 28.8 | 29.2 | 28.8 | 25.5 | 27.4 | 27.3 | 29.5 | 29.0 | 27.8 | |
| 25.4 | 24.2 | 25.4 | 25.4 | 26.6 | 25.8 | 21.5 | 24.1 | 23.2 | 26.9 | 25.5 | 24.6 | |
| 21.1 | 19.9 | 21.2 | 21.3 | 22.4 | 21.7 | 16.9 | 19.7 | 18.6 | 23.1 | 21.6 | 20.4 | |
| 11.0 | 9.7 | 10.7 | 10.5 | 13.3 | 12.1 | 6.0 | 7.6 | 7.5 | 15.1 | 12.1 | 11.6 | |
| 12.7 | 11.6 | 12.7 | 12.5 | 14.8 | 13.7 | 8.0 | 10.0 | 9.6 | 16.2 | 13.6 | 12.9 | |
| 15.2 | 14.2 | 15.4 | 15.3 | 17.6 | 16.2 | 10.8 | 13.0 | 12.4 | 19.3 | 16.3 | 16.1 | |
| 18.5 | 17.7 | 18.9 | 18.7 | 20.9 | 19.3 | 14.7 | 16.6 | 16.4 | 22.3 | 19.3 | 19.6 | |
| 22.4 | 22.0 | 23.2 | 22.7 | 25.2 | 22.9 | 19.4 | 20.3 | 21.0 | 25.4 | 22.9 | 23.5 | |
| 25.1 | 24.7 | 25.8 | 25.4 | 26.7 | 25.5 | 22.6 | 23.2 | 24.1 | 26.5 | 25.5 | 25.7 | |
| 25.8 | 25.1 | 26.2 | 25.8 | 26.6 | 26.0 | 23.3 | 24.0 | 24.7 | 26.5 | 26.0 | 26.2 | |
| 25.4 | 24.3 | 25.4 | 25.3 | 25.9 | 25.7 | 22.4 | 23.4 | 23.7 | 25.8 | 25.5 | 25.7 | |
| 24.5 | 23.3 | 24.5 | 24.5 | 25.0 | 25.1 | 20.9 | 22.3 | 22.4 | 25.4 | 25.0 | 24.8 | |
| 21.2 | 19.7 | 21.0 | 21.1 | 22.4 | 22.2 | 16.7 | 18.3 | 18.2 | 23.6 | 22.0 | 22.3 | |
| 16.5 | 14.3 | 15.7 | 15.8 | 18.4 | 17.5 | 10.8 | 12.9 | 12.3 | 20.2 | 17.4 | 17.9 | |
| 12.3 | 10.6 | 11.9 | 11.7 | 14.8 | 13.5 | 7.0 | 8.6 | 8.4 | 16.7 | 13.5 | 13.5 | |
| 6.2 | 8.2 | 6.4 | 5.2 | 7.5 | 7.2 | 10.9 | 4.6 | 8.3 | 10.2 | 4.5 | 6.1 | |
| 16.7 | 18.1 | 17.7 | 16.9 | 17.3 | 16.5 | 18.6 | 17.6 | 18.6 | 14.6 | 16.4 | 16.4 | |
| 17.8 | 18.9 | 18.9 | 18.9 | 16.3 | 18.2 | 21.3 | 18.7 | 21.1 | 16.6 | 17.8 | 19.7 | |
| 19.3 | 21.5 | 21.2 | 20.0 | 18.8 | 20.6 | 22.4 | 18.8 | 21.8 | 19.5 | 20.3 | 20.5 | |
| 23.5 | 23.0 | 22.7 | 22.3 | 24.5 | 25.5 | 22.7 | 20.7 | 21.9 | 26.6 | 24.6 | 27.1 | |
| 28.1 | 27.0 | 27.0 | 27.5 | 26.9 | 29.7 | 26.7 | 26.2 | 26.5 | 25.8 | 29.3 | 28.5 | |
| 29.9 | 28.4 | 28.4 | 29.2 | 28.7 | 30.6 | 28.8 | 28.2 | 28.4 | 28.9 | 30.5 | 29.1 | |
| 30.0 | 29.3 | 29.2 | 28.8 | 30.1 | 30.6 | 29.0 | 27.5 | 29.1 | 28.3 | 30.6 | 30.4 | |
| 26.0 | 19.8 | 20.1 | 22.4 | 25.9 | 28.4 | 17.5 | 20.5 | 18.6 | 27.6 | 26.4 | 25.8 | |
| 15.3 | 11.2 | 8.5 | 8.3 | 16.5 | 14.9 | 8.5 | 9.2 | 9.7 | 20.5 | 15.6 | 16.4 | |
| 7.4 | 5.4 | 5.5 | 7.4 | 4.7 | 6.3 | 5.6 | 4.3 | 4.8 | 10.4 | 7.7 | 6.0 | |
| 3.5 | 4.9 | 3.7 | 4.1 | 4.7 | 8.5 | 6.0 | 2.8 | 5.1 | 6.8 | 3.7 | 6.8 |
| Site | CZ | GY | GZ | HY | HZ | LF | LZ | MX | SG | XW | YJ | ZS |
|---|---|---|---|---|---|---|---|---|---|---|---|---|
| 13.0 | 11.0 | 11.6 | 12.4 | 12.1 | 13.4 | 9.8 | 12.2 | 10.4 | 13.2 | 13.4 | 12.4 | |
| 11.4 | 9.4 | 9.9 | 10.5 | 10.9 | 12.1 | 8.3 | 10.3 | 8.6 | 13.6 | 12 | 11.1 | |
| 12.7 | 11.1 | 11.2 | 11.8 | 12.4 | 13.9 | 10.0 | 11.4 | 9.9 | 15.7 | 13.9 | 12.7 | |
| 14.1 | 12.4 | 12.3 | 13.2 | 14.7 | 14.2 | 10.8 | 12.8 | 10.9 | 18.2 | 14.1 | 13.2 | |
| 15.6 | 14.4 | 14.6 | 15.2 | 17.0 | 17.2 | 12.8 | 14.7 | 13.1 | 20.2 | 17.1 | 16.3 | |
| 15.2 | 15.6 | 15.5 | 15.1 | 16.2 | 16.8 | 14.0 | 14.5 | 14.3 | 18.9 | 16.7 | 16 | |
| 18.3 | 17.7 | 17.7 | 17.8 | 17.0 | 19.9 | 16.6 | 18.1 | 16.8 | 20.0 | 19.9 | 17.5 | |
| 18.1 | 17.7 | 17.9 | 17.9 | 17.4 | 19.7 | 16.9 | 17.9 | 17.0 | 18.7 | 19.6 | 18.4 | |
| 16.7 | 16.1 | 16.5 | 16.8 | 16.6 | 18.2 | 15.1 | 16.2 | 15.2 | 17.0 | 18.1 | 17.6 | |
| 15.6 | 15.0 | 15.3 | 15.6 | 16.1 | 17.2 | 13.7 | 15.1 | 14.2 | 16.0 | 17.1 | 16.7 | |
| 14.2 | 14.8 | 14.9 | 14.6 | 14.9 | 15.4 | 13.8 | 13.9 | 14.2 | 14.9 | 15.3 | 14.8 | |
| 12.9 | 12.2 | 12.2 | 12.8 | 12.4 | 13.3 | 10.8 | 12.7 | 11.4 | 12.9 | 13.2 | 12.4 | |
| 18.9 | 17.5 | 18.8 | 19.0 | 20.2 | 19.4 | 14.0 | 17.3 | 15.9 | 21.7 | 19.5 | 18.2 | |
| 20.3 | 19.1 | 20.4 | 20.5 | 21.4 | 20.8 | 15.8 | 18.9 | 17.7 | 24.0 | 21.1 | 19.5 | |
| 22.2 | 21.2 | 22.4 | 22.6 | 23.3 | 22.8 | 18.1 | 21.3 | 19.8 | 27.0 | 23.4 | 22 | |
| 25.4 | 24.8 | 25.9 | 26.2 | 27.5 | 25.7 | 22.4 | 24.9 | 23.8 | 30.5 | 26.6 | 25.4 | |
| 28.8 | 29.2 | 30.2 | 29.9 | 31.7 | 28.9 | 27.1 | 28.4 | 28.4 | 33.4 | 30.1 | 29.5 | |
| 30.6 | 31.3 | 32.2 | 31.3 | 33 | 30.7 | 29.6 | 30.2 | 31.0 | 34.1 | 31.8 | 31.1 | |
| 32.5 | 32.7 | 33.5 | 32.8 | 33.3 | 31.9 | 31.4 | 32.3 | 32.8 | 34.2 | 33.3 | 32.1 | |
| 33.0 | 33.0 | 33.9 | 33.4 | 33.3 | 32.5 | 31.6 | 32.5 | 33.1 | 33.6 | 33.7 | 32.3 | |
| 32.0 | 31.8 | 32.8 | 32.4 | 32.4 | 31.9 | 29.9 | 31.1 | 31.5 | 32.5 | 32.6 | 31.4 | |
| 29.7 | 29.2 | 30.3 | 30.1 | 30.3 | 29.9 | 26.8 | 28.6 | 28.5 | 30.3 | 30.1 | 29 | |
| 26.2 | 25.4 | 26.7 | 26.4 | 27.4 | 26.7 | 22.7 | 25.0 | 24.4 | 27.4 | 26.4 | 25.3 | |
| 21.1 | 19.8 | 21.0 | 21.2 | 22.3 | 21.7 | 16.8 | 19.6 | 18.5 | 22.9 | 21.5 | 20.4 | |
| 10.9 | 9.7 | 10.8 | 10.3 | 13.5 | 12.0 | 6.1 | 7.5 | 7.5 | 15.3 | 11.9 | 11.6 | |
| 13.5 | 12.7 | 13.8 | 13.2 | 15.8 | 14.4 | 9.1 | 10.7 | 10.7 | 17.5 | 14.4 | 14.1 | |
| 15.5 | 14.6 | 15.9 | 15.3 | 17.8 | 16.5 | 11.2 | 13.2 | 12.8 | 19.6 | 16.5 | 16.7 | |
| 19.2 | 18.5 | 19.8 | 19.5 | 21.5 | 20 | 15.5 | 17.2 | 17.2 | 23 | 20 | 20.3 | |
| 23.2 | 22.9 | 24.1 | 23.4 | 25.3 | 23.7 | 20.3 | 21.1 | 21.9 | 25.8 | 23.7 | 24.1 | |
| 25.7 | 25.5 | 26.6 | 26.1 | 26.8 | 26.3 | 23.4 | 23.9 | 24.9 | 27.2 | 26.4 | 26.4 | |
| 26.2 | 25.8 | 26.8 | 26.3 | 26.8 | 26.6 | 24.0 | 24.4 | 25.3 | 27.1 | 26.5 | 26.8 | |
| 26.1 | 25.2 | 26.4 | 26.0 | 26.3 | 26.4 | 23.3 | 24.1 | 24.6 | 26.5 | 26.2 | 26.3 | |
| 25.1 | 24.4 | 25.5 | 25.1 | 25.6 | 25.6 | 22.0 | 22.8 | 23.4 | 26 | 25.5 | 25.5 | |
| 22.2 | 21.1 | 22.5 | 22.2 | 23.3 | 23.1 | 18.1 | 19.3 | 19.6 | 24.3 | 22.9 | 23.1 | |
| 17.7 | 15.8 | 17.2 | 17.1 | 19.6 | 18.7 | 12.3 | 14.2 | 13.9 | 21.2 | 18.6 | 18.9 | |
| 12.4 | 10.9 | 12.1 | 11.7 | 14.9 | 13.5 | 7.2 | 8.7 | 8.6 | 16.7 | 13.5 | 13.7 | |
| 7.6 | 6.7 | 5.3 | 7.3 | 7.2 | 7.4 | 9.1 | 7.0 | 6.7 | 9.3 | 6.6 | 6.5 | |
| 15.2 | 17.2 | 16.6 | 15.2 | 16.9 | 15.0 | 17.4 | 15.5 | 17.3 | 15.1 | 14.8 | 14.9 | |
| 13.8 | 16.5 | 16.5 | 16.4 | 15.8 | 15.1 | 19.9 | 15.4 | 19.5 | 16 | 15 | 17 | |
| 21.8 | 23.7 | 23.6 | 22.9 | 20.8 | 22.4 | 24.7 | 21.1 | 23.9 | 21.8 | 22.1 | 22.9 | |
| 25.0 | 25.3 | 24.8 | 23.2 | 26.7 | 27.7 | 24.8 | 21.3 | 24.4 | 27.0 | 27.2 | 28 | |
| 27.7 | 26.9 | 26.9 | 27.9 | 26.7 | 29.3 | 27.1 | 27.9 | 26.9 | 27.0 | 28.9 | 27.9 | |
| 29.0 | 28.7 | 28.6 | 28.9 | 30.2 | 30.3 | 28.6 | 26.9 | 28.6 | 29.2 | 30.1 | 29.5 | |
| 30.2 | 28.8 | 28.8 | 29.2 | 30.0 | 30.6 | 27.7 | 27.8 | 28.0 | 28.1 | 30.6 | 30.2 | |
| 24.8 | 21.8 | 22.0 | 22.1 | 26.5 | 28.6 | 19.7 | 20.8 | 20.7 | 27.6 | 26.8 | 26.2 | |
| 16.8 | 11.2 | 9.1 | 7.8 | 15.1 | 15.0 | 9.5 | 12.9 | 9.5 | 18.3 | 15 | 15.7 | |
| 6.3 | 4.2 | 7.0 | 9.2 | 6.9 | 6.8 | 5.6 | 3.4 | 4.4 | 13.0 | 7.5 | 8.3 | |
| 4.1 | 5.1 | 5.1 | 5.9 | 5.7 | 7.5 | 5.5 | 3.4 | 5.2 | 8.4 | 5.7 | 6.1 |
| Site | CZ | GY | GZ | HY | HZ | LF | LZ | MX | SG | XW | YJ | ZS |
|---|---|---|---|---|---|---|---|---|---|---|---|---|
| 12.8 | 10.5 | 11.1 | 12.2 | 11.7 | 13.0 | 9.2 | 12.0 | 9.8 | 12.6 | 13.0 | 11.9 | |
| 11.1 | 9.4 | 9.8 | 10.4 | 10.8 | 11.6 | 8.3 | 10.0 | 8.6 | 12.4 | 11.5 | 10.2 | |
| 12.5 | 11.1 | 11.2 | 11.8 | 13.1 | 13.5 | 9.9 | 11.2 | 9.8 | 15.5 | 13.5 | 11.8 | |
| 14.6 | 13.8 | 13.8 | 14 | 15.7 | 15.4 | 12.2 | 13.3 | 12.4 | 17.9 | 15.3 | 13.9 | |
| 15.5 | 15.4 | 15.6 | 15.3 | 17.4 | 16.9 | 13.8 | 14.6 | 14.1 | 20.8 | 16.8 | 16.4 | |
| 15.9 | 15.7 | 15.7 | 15.6 | 16.9 | 17.8 | 14.1 | 15.2 | 14.3 | 20.4 | 17.7 | 17.0 | |
| 20.2 | 19.7 | 19.8 | 19.5 | 19.2 | 21.9 | 18.6 | 19.9 | 18.9 | 21.7 | 21.9 | 20.3 | |
| 16.6 | 16.7 | 16.9 | 16.6 | 17.0 | 18.1 | 15.9 | 16.5 | 15.9 | 18.8 | 18.0 | 17.2 | |
| 16.1 | 15.8 | 16.2 | 16.4 | 16.5 | 18.1 | 14.8 | 15.7 | 14.9 | 17.6 | 18.0 | 16.9 | |
| 15.3 | 15.3 | 15.7 | 15.6 | 16.1 | 17.0 | 14.1 | 14.9 | 14.6 | 15.8 | 16.8 | 16.0 | |
| 14.5 | 14.8 | 15.0 | 15.0 | 14.7 | 15.3 | 13.8 | 14.2 | 14.2 | 13.9 | 15.2 | 14.4 | |
| 12.7 | 11.9 | 11.9 | 12.4 | 11.8 | 13.0 | 10.5 | 12.4 | 11.2 | 12.7 | 12.9 | 11.7 | |
| 19.2 | 17.6 | 19.0 | 19.1 | 20.5 | 19.7 | 14.1 | 17.5 | 16.0 | 21.8 | 19.8 | 18.4 | |
| 20.2 | 18.7 | 20.0 | 20.2 | 21.4 | 20.7 | 15.4 | 18.8 | 17.3 | 23.8 | 21.0 | 19.3 | |
| 22.5 | 21.5 | 22.7 | 22.9 | 24.1 | 23.1 | 18.5 | 21.6 | 20.2 | 27.2 | 23.7 | 22.3 | |
| 26.0 | 25.5 | 26.6 | 26.7 | 28.1 | 26.2 | 23.1 | 25.5 | 24.5 | 30.6 | 27.1 | 26.0 | |
| 29.5 | 29.9 | 31.0 | 30.6 | 32.3 | 29.6 | 27.9 | 29.1 | 29.2 | 34.3 | 30.7 | 30.1 | |
| 31.4 | 31.9 | 32.9 | 32.1 | 33.9 | 31.4 | 30.3 | 31.0 | 31.7 | 35.3 | 32.5 | 31.9 | |
| 33.5 | 34.0 | 34.8 | 33.9 | 34.7 | 32.9 | 32.7 | 33.3 | 34.1 | 35.2 | 34.4 | 33.2 | |
| 33.3 | 33.4 | 34.3 | 33.7 | 34.2 | 32.9 | 32.0 | 32.8 | 33.4 | 34.4 | 34.0 | 32.7 | |
| 32.5 | 32.0 | 33.0 | 32.8 | 33.1 | 32.5 | 30.1 | 31.5 | 31.7 | 33.3 | 33.1 | 32.1 | |
| 30.1 | 29.5 | 30.7 | 30.5 | 31.0 | 30.4 | 27.1 | 29.0 | 28.9 | 30.8 | 30.5 | 29.4 | |
| 26.5 | 25.7 | 26.9 | 26.7 | 27.7 | 27.0 | 22.9 | 25.2 | 24.7 | 27.5 | 26.7 | 25.6 | |
| 21.4 | 20.2 | 21.5 | 21.4 | 22.9 | 22.0 | 17.2 | 20.0 | 18.9 | 23.4 | 21.9 | 20.9 | |
| 11.1 | 9.8 | 10.9 | 10.5 | 13.7 | 12.2 | 6.1 | 7.7 | 7.6 | 15.5 | 12.2 | 11.9 | |
| 13.7 | 12.4 | 13.5 | 13.2 | 15.9 | 14.6 | 8.8 | 10.9 | 10.4 | 17.6 | 14.6 | 14.2 | |
| 16.1 | 15.3 | 16.5 | 16.0 | 18.6 | 17.1 | 11.9 | 13.9 | 13.5 | 20.1 | 17.1 | 17.1 | |
| 19.5 | 18.9 | 20.1 | 19.7 | 22.2 | 20.2 | 15.9 | 17.6 | 17.6 | 23.4 | 20.2 | 20.7 | |
| 23.7 | 23.0 | 24.2 | 23.9 | 26.0 | 24.1 | 20.4 | 21.7 | 22.0 | 26.2 | 24.2 | 24.5 | |
| 26.1 | 25.8 | 26.9 | 26.4 | 27.7 | 26.6 | 23.7 | 24.3 | 25.2 | 27.7 | 26.6 | 26.9 | |
| 26.5 | 25.8 | 26.9 | 26.5 | 27.7 | 26.8 | 24.0 | 24.6 | 25.3 | 27.3 | 26.6 | 27.2 | |
| 26.8 | 25.9 | 27.0 | 26.7 | 27.3 | 26.9 | 23.9 | 24.8 | 25.3 | 27.1 | 26.8 | 26.9 | |
| 25.5 | 24.7 | 25.9 | 25.5 | 26.1 | 26.0 | 22.3 | 23.2 | 23.7 | 26.3 | 25.8 | 25.8 | |
| 22.4 | 21.1 | 22.5 | 22.2 | 23.7 | 23.2 | 18.1 | 19.4 | 19.6 | 24.7 | 23.0 | 23.3 | |
| 17.6 | 16.0 | 17.4 | 17.1 | 19.9 | 18.7 | 12.5 | 14.0 | 14.1 | 21.2 | 18.5 | 19.0 | |
| 12.7 | 11.3 | 12.5 | 11.9 | 15.4 | 13.8 | 7.6 | 9.0 | 9.0 | 17.1 | 13.8 | 14.0 | |
| 6.4 | 6.6 | 5.6 | 5.4 | 5.9 | 5.2 | 8.4 | 6.1 | 6.8 | 7.2 | 4.3 | 5.2 | |
| 13.1 | 16.0 | 15.8 | 14.1 | 15.3 | 14.4 | 16.6 | 13.7 | 16.4 | 13.5 | 14.3 | 15.0 | |
| 14.7 | 18.1 | 18.1 | 17.3 | 16.0 | 16.1 | 20.2 | 16.8 | 19.9 | 16.2 | 15.3 | 16.8 | |
| 19.1 | 21.8 | 21.4 | 20.4 | 19.6 | 18.0 | 22.9 | 18.1 | 21.9 | 19.9 | 17.7 | 19.1 | |
| 25.5 | 24.5 | 24.3 | 23.3 | 25.7 | 27.5 | 24.3 | 22.1 | 24.0 | 26.9 | 26.8 | 28.1 | |
| 27.6 | 26.7 | 26.7 | 27.7 | 26.6 | 29.2 | 26.8 | 26.8 | 26.6 | 26.6 | 28.5 | 28.7 | |
| 27.9 | 27.1 | 27.0 | 26.6 | 27.6 | 29.8 | 26.9 | 24.0 | 27 | 27.5 | 29.3 | 28.2 | |
| 29.7 | 28.0 | 28.0 | 29.0 | 29.6 | 30.1 | 27.6 | 27.3 | 27.8 | 29.9 | 30.0 | 30.3 | |
| 23.9 | 18.0 | 18 | 20.2 | 24.4 | 25.8 | 15.7 | 19.6 | 16.7 | 27.8 | 23.9 | 24.7 | |
| 14.6 | 9.9 | 9.7 | 8.6 | 13.4 | 13.6 | 9.8 | 8.1 | 8.1 | 16.9 | 14.7 | 15.0 | |
| 6.4 | 4.1 | 5.6 | 6.8 | 5.8 | 7.2 | 5.5 | 3.7 | 4.4 | 10.4 | 7.4 | 7.3 | |
| 5.3 | 5.8 | 4.9 | 6.7 | 7.3 | 8.5 | 5.9 | 5.0 | 5.8 | 8.3 | 6.3 | 6.8 |
References
- Klutse, N.A.B.; Ajayi, V.O.; Gbobaniyi, E.O.; Egbebiyi, T.S.; Kouadio, K.; Nkrumah, F.; Quagraine, K.A.; Olusegun, C.; Diasso, U.; Abiodun, B.J. Potential impact of 1.5 °C and 2 °C global warming on consecutive dry and wet days over west africa. Environ. Res. Lett. 2018, 13, 055013. [Google Scholar] [CrossRef]
- Rogelj, J.; Popp, A.; Calvin, K.V.; Luderer, G.; Emmerling, J.; Gernaat, D.; Fujimori, S.; Strefler, J.; Hasegawa, T.; Marangoni, G. Scenarios towards limiting global mean temperature increase below 1.5 °C. Nat. Clim. Chang. 2018, 8, 325–332. [Google Scholar] [CrossRef]
- Harvey, L.D. Global Warming; Routledge: London, UK, 2018. [Google Scholar]
- Edenhofer, O.; Seyboth, K. Intergovernmental panel on climate change (IPCC). Encycl. Energy Nat. Resour. Environ. Econ. 2013, 26, 48–56. [Google Scholar]
- Vuuren, D.P.V.; Stehfest, E.; Elzen, M.G.J.D.; Kram, T.; Vliet, J.V.; Deetman, S.; Isaac, M.; Goldewijk, K.K.; Hof, A.; Beltran, A.M. Rcp2.6: Exploring the possibility to keep global mean temperature increase below 2 °C. Clim. Chang. 2011, 109, 95–116. [Google Scholar] [CrossRef]
- Zhao, C.; Liu, B.; Piao, S.; Wang, X.; Lobell, D.B.; Huang, Y.; Huang, M.; Yao, Y.; Bassu, S.; Ciais, P. Temperature increase reduces global yields of major crops in four independent estimates. Proc. Natl. Acad. Sci. USA 2017, 114, 9326–9331. [Google Scholar] [CrossRef] [PubMed] [Green Version]
- Viceto, C.; Cardoso Pereira, S.; Rocha, A. Climate change projections of extreme temperatures for the iberian peninsula. Atmosphere 2019, 10, 229. [Google Scholar] [CrossRef]
- Blau, J. The Paris Agreement; Springer: Berlin, Germany, 2017. [Google Scholar]
- Falkner, R. The paris agreement and the new logic of international climate politics. Int. Aff. 2016, 92, 1107–1125. [Google Scholar] [CrossRef]
- Rogelj, J.; Den, E.M.; Höhne, N.; Fransen, T.; Fekete, H.; Winkler, H.; Schaeffer, R.; Sha, F.; Riahi, K.; Meinshausen, M. Paris agreement climate proposals need a boost to keep warming well below 2 °C. Nature 2016, 534, 631–639. [Google Scholar] [CrossRef]
- Roy, J.; Tschakert, P.; Waisman, H.; Halim, S.A.; Antwi-Agyei, P.; Dasgupta, P.; Hayward, B.; Kanninen, M.; Liverman, D.; Okereke, C. Sustainable development, poverty eradication and reducing inequalities. In Global Warming of 1.5 °C; Intergovernmental Panel on Climate Change (IPCC): Geneva, Switzerland, 2018. [Google Scholar]
- Hatfield, J.L.; Boote, K.J.; Kimball, B.A.; Ziska, L.H.; Izaurralde, R.C.; Ort, D.; Thomson, A.M.; Wolfe, D. Climate impacts on agriculture: Implications for crop production. Agron. J. 2011, 103, 351–370. [Google Scholar] [CrossRef]
- Jabloun, M.; Schelde, K.; Tao, F.; Olesen, J.E. Effect of temperature and precipitation on nitrate leaching from organic cereal cropping systems in denmark. Eur. J. Agron. 2015, 62, 55–64. [Google Scholar] [CrossRef]
- Daničić, M.; Zekić, V.; Mirosavljević, M.; Lalić, B.; Putnik-Delić, M.; Maksimović, I.; Dalla Marta, A. The response of spring barley (Hordeum vulgare L.) to climate change in northern serbia. Atmosphere 2019, 10, 14. [Google Scholar] [CrossRef]
- Nie, H.; Qin, T.; Yang, H.; Chen, J.; He, S.; Lv, Z.; Shen, Z. Trend analysis of temperature and precipitation extremes during winter wheat growth period in the major winter wheat planting area of China. Atmosphere 2019, 10, 240. [Google Scholar] [CrossRef]
- Mitchell, D.; Achutarao, K.; Allen, M.; Bethke, I.; Beyerle, U.; Ciavarella, A.; Forster, P.M.; Fuglestvedt, J.; Gillett, N.; Haustein, K. Half a degree additional warming, prognosis and projected impacts (HAPPI): Background and experimental design. Geosci. Model Dev. 2017, 10, 571–583. [Google Scholar] [CrossRef]
- Drobinski, P.; Silva, N.D.; Panthou, G.; Bastin, S.; Muller, C.; Ahrens, B.; Borga, M.; Conte, D.; Fosser, G.; Giorgi, F. Scaling precipitation extremes with temperature in the mediterranean: Past climate assessment and projection in anthropogenic scenarios. Clim. Dyn. 2018, 51, 1237–1257. [Google Scholar] [CrossRef]
- Arora, V.; Scinocca, J.; Boer, G.; Christian, J.; Denman, K.; Flato, G.; Kharin, V.; Lee, W.; Merryfield, W. Carbon emission limits required to satisfy future representative concentration pathways of greenhouse gases. Geophys. Res. Lett. 2011, 38. [Google Scholar] [CrossRef]
- Van Vuuren, D.P.; Edmonds, J.; Kainuma, M.; Riahi, K.; Thomson, A.; Hibbard, K.; Hurtt, G.C.; Kram, T.; Krey, V.; Lamarque, J.-F. The representative concentration pathways: An overview. Clim. Chang. 2011, 109, 5–31. [Google Scholar] [CrossRef]
- Jones, C.; Robertson, E.; Arora, V.; Friedlingstein, P.; Shevliakova, E.; Bopp, L.; Brovkin, V.; Hajima, T.; Kato, E.; Kawamiya, M. Twenty-first-century compatible CO2 emissions and airborne fraction simulated by cmip5 earth system models under four representative concentration pathways. J. Clim. 2013, 26, 4398–4413. [Google Scholar] [CrossRef]
- Amouzou, K.A.; Naab, J.B.; Lamers, J.P.A.; Becker, M. Ceres-maize and ceres-sorghum for modeling growth, nitrogen and phosphorus uptake, and soil moisture dynamics in the dry savanna of West Africa. Field Crops Res. 2017, 217, 134–149. [Google Scholar] [CrossRef]
- Jahan, M.A.H.S.; Sen, R.; Ishtiaque, S.; Choudhury, A.K.; Akhter, S.; Ahmed, F.; Biswas, J.C.; Manirruzaman, M.; Miah, M.M.; Rahman, M.M. Optimizing sowing window for wheat cultivation in bangladesh using ceres-wheat crop simulation model. Agric. Ecosyst. Environ. 2018, 258, 23–29. [Google Scholar] [CrossRef]
- Yin, Y.; Tang, Q.; Liu, X. A multi-model analysis of change in potential yield of major crops in China under climate change. Earth Syst. Dyn. 2015, 6, 45–59. [Google Scholar] [CrossRef] [Green Version]
- Xu, C.-C.; Wu, W.-X.; Ge, Q.-S.; Zhou, Y.; Lin, Y.-M.; Li, Y.-M. Simulating climate change impacts and potential adaptations on rice yields in the sichuan basin, china. Mitig. Adapt. Strateg. Glob. Chang. 2015, 22, 565–594. [Google Scholar] [CrossRef]
- Li, Y.; Wu, W.; Ge, Q.; Zhou, Y.; Xu, C. Simulating climate change impacts and adaptive measures for rice cultivation in Hunan province, China. J. Appl. Meteorol. Climatol. 2016, 55, 1359–1376. [Google Scholar] [CrossRef]
- Chen, Y.; Zhang, Z.; Tao, F. Impacts of climate change and climate extremes on major crops productivity in China at a global warming of 1.5 and 2.0 °C. Earth Syst. Dyn. 2018, 9, 543–562. [Google Scholar] [CrossRef]
- Jacob, D.; Kotova, L.; Teichmann, C.; Sobolowski, S.P.; Vautard, R.; Donnelly, C.; Koutroulis, A.G.; Grillakis, M.G.; Tsanis, I.K.; Damm, A.; et al. Climate impacts in europe under +1.5 °C global warming. Earth’s Future 2018, 6, 264–285. [Google Scholar] [CrossRef]
- Tao, F.; Yokozawa, M.; Liu, J.; Zhang, Z. Climate–crop yield relationships at provincial scales in China and the impacts of recent climate trends. Clim. Res. 2008, 38, 83–94. [Google Scholar] [CrossRef]
- Tao, F.; Yokozawa, M.; Xu, Y.; Hayashi, Y.; Zhang, Z. Climate changes and trends in phenology and yields of field crops in China, 1981–2000. Agric. For. Meteorol. 2006, 138, 82–92. [Google Scholar] [CrossRef]
- Yao, F.; Xu, Y.; Feng, Q.; Lin, E.; Yan, X. Simulation and validation of ceres—Rice model in main rice ecological zones in China. Acta Agron. Sin. 2005, 31, 545–550. [Google Scholar]
- Guo, Y.; Wu, W.; Du, M.; Bryant, C.R.; Li, Y.; Wang, Y.; Huang, H. Assessing potential climate change impacts and adaptive measures on rice yields: The case of zhejiang province in China. Sustainability 2019, 11, 2372. [Google Scholar] [CrossRef]
- Shi, Q.-H.; Liu, J.-G.; Wang, Z.-H.; Tao, T.-T.; Chen, F.; Chu, Q.-Q. Change of rice yield gaps and influential climatic factors in southern China. Acta Agron. Sin. 2013, 38, 896–903. [Google Scholar] [CrossRef]
- Xu, X.Q.; Li, S.M. China’s open door policy and urbanization in the pearl river delta region. Int. J. Urban Reg. Res. 1990, 14, 49–69. [Google Scholar]
- He, G.; Wang, Z.; Wang, M.; Zou, X.; Liu, J.; Wang, S.; Hou, Y. Genetic variations and forensic characteristics of han Chinese population residing in the pearl river delta revealed by 23 autosomal strs. Mol. Biol. Rep. 2018, 45, 1125–1133. [Google Scholar] [CrossRef] [PubMed]
- National Bureau of Statistics. Available online: http://www.stats.gov.cn/ (accessed on 11 July 2019).
- Zhou, G.; Wei, X.; Yan, L.; Zhang, M.; Li, Y.; Qiao, Y.; Liu, H.; Wang, C. Forest recovery and river discharge at the regional scale of Guangdong province, China. Water Resour. Res. 2010, 46, 5109–5115. [Google Scholar] [CrossRef]
- Jones, J.W.; Hoogenboom, G.; Porter, C.H.; Boote, K.J.; Batchelor, W.D.; Hunt, L.; Wilkens, P.W.; Singh, U.; Gijsman, A.J.; Ritchie, J.T. The dssat cropping system model. Eur. J. Agron. 2003, 18, 235–265. [Google Scholar] [CrossRef]
- Jones, J.; Tsuji, G.; Hoogenboom, G.; Hunt, L.; Thornton, P.; Wilkens, P.; Imamura, D.; Bowen, W.; Singh, U. Decision support system for agrotechnology transfer: Dssat v3. In Understanding Options for Agricultural Production; Springer: Berlin, Germany, 1998; pp. 157–177. [Google Scholar]
- Gijsman, A.J.; Hoogenboom, G.; Parton, W.J.; Kerridge, P.C. Modifying dssat crop models for low-input agricultural systems using a soil organic matter–residue module from century. Agron. J. 2002, 94, 462–474. [Google Scholar] [CrossRef]
- Ahmed, M.; Akram, M.N.; Asim, M.; Aslam, M.; Hassan, F.-U.; Higgins, S.; Stöckle, C.O.; Hoogenboom, G. Calibration and validation of apsim-wheat and ceres-wheat for spring wheat under rainfed conditions: Models evaluation and application. Comput. Electron. Agric. 2016, 123, 384–401. [Google Scholar] [CrossRef]
- Amiri, E.; Rezaei, M.; Rezaei, E.E.; Bannayan, M. Evaluation of ceres-rice, aquacrop and oryza 2000 models in simulation of rice yield response to different irrigation and nitrogen management strategies. J. Plant Nutr. 2014, 37, 1749–1769. [Google Scholar] [CrossRef]
- Jones, J.W.; Antle, J.M.; Basso, B.; Boote, K.J.; Conant, R.T.; Foster, I.; Godfray, H.C.J.; Herrero, M.; Howitt, R.E.; Janssen, S.; et al. Toward a new generation of agricultural system data, models, and knowledge products: State of agricultural systems science. Agric. Syst. 2017, 155, 269–288. [Google Scholar] [CrossRef] [PubMed]
- Jones, J.W.; Antle, J.M.; Basso, B.; Boote, K.J.; Conant, R.T.; Foster, I.; Godfray, H.C.J.; Herrero, M.; Howitt, R.E.; Janssen, S.; et al. Brief history of agricultural systems modeling. Agric. Syst. 2017, 155, 240–254. [Google Scholar] [CrossRef] [PubMed]
- Esteves, M.; Román-Paoli, E.; Beaver, J.S.; Muñoz, M.A.; Armstrong, A. Genetic coefficient determination for three maize cultivars and one hybrid. J. Agric. Univ. Puerto Rico 2012, 96, 57–75. [Google Scholar]
- Guo, Y.; Wu, W.; Bryant, C.R. Quantifying spatio-temporal patterns of rice yield gaps in double-cropping systems: A case study in pearl river delta, China. Sustainability 2019, 11, 1394. [Google Scholar] [CrossRef]
- Van Bussel, L.G.J.; Grassini, P.; Van Wart, J.; Wolf, J.; Claessens, L.; Yang, H.; Boogaard, H.; de Groot, H.; Saito, K.; Cassman, K.G.; et al. From field to atlas: Upscaling of location-specific yield gap estimates. Field Crops Res. 2015, 177, 98–108. [Google Scholar] [CrossRef] [Green Version]
- Lychuk, T.E.; Hill, R.L.; Izaurralde, R.C.; Momen, B.; Thomson, A.M. Evaluation of climate change impacts and effectiveness of adaptation options on crop yield in the southeastern United States. Field Crops Res. 2017, 214, 228–238. [Google Scholar] [CrossRef]
- Onoyama, H.; Ryu, C.; Suguri, M.; Iida, M. Nitrogen prediction model of rice plant at panicle initiation stage using ground-based hyperspectral imaging: Growing degree-days integrated model. Precis. Agric. 2015, 16, 558–570. [Google Scholar] [CrossRef]
- Thaler, S.; Brocca, L.; Ciabatta, L.; Eitzinger, J.; Hahn, S.; Wagner, W. Effects of different spatial precipitation input data on crop model outputs under a central European climate. Atmosphere 2018, 9, 290. [Google Scholar] [CrossRef]
- Yan, D.C.; Yan, Z.; Wang, S.H.; Cao, W.X. A quantitative knowledge-based model for designing suitable growth dynamics in rice. Plant Prod. Sci. 2006, 9, 93–105. [Google Scholar] [CrossRef]
- Lewis, S.E.; Rice, A.; Hurst, G.D.D.; Baylis, M. First detection of endosymbiotic bacteria in biting midges culicoides pulicaris and culicoides punctatus, important palaearctic vectors of bluetongue virus. Med. Vet. Entomol. 2015, 28, 453–456. [Google Scholar] [CrossRef] [PubMed]
- Ying, M.; Zhang, W.; Yu, H.; Lu, X.; Feng, J.; Fan, Y.; Zhu, Y.; Chen, D. An overview of the China meteorological administration tropical cyclone database. J. Atmos. Ocean. Technol. 2014, 31, 287–301. [Google Scholar] [CrossRef]
- National Meteorological Information Center. Available online: http://data.cma.cn/ (accessed on 11 July 2019).
- Zhang, S.; Tao, F. Modeling the response of rice phenology to climate change and variability in different climatic zones: Comparisons of five models. Eur. J. Agron. 2013, 45, 165–176. [Google Scholar] [CrossRef]
- Shi, X.Z.; Yu, D.S.; Pan, X.Z.; Sun, W.X.; Gong, Z.G.; Warner, E.D.; Petersen, G.W. A Framework for the 1:1,000,000 Soil Database of China. In Proceedings of the 17th World Congress of Soil Science, Bangkok, Thailand, 14–21 August 2002. [Google Scholar]
- Soil Science Database. Available online: http://vdb3.soil.csdb.cn/ (accessed on 11 July 2019).
- Zhou, Q.; Wang, M.; Zhong, X.; Liu, P.; Xie, X.; Wangxiao, J.; Sun, Y. Dissemination of resistance genes in duck/fish polyculture ponds in Guangdong province: Correlations between cu and zn and antibiotic resistance genes. Environ. Sci. Pollut. Res. 2019, 26, 8182–8193. [Google Scholar] [CrossRef]
- Tao, F.; Zhang, S.; Zhang, Z.; Rötter, R.P. Maize growing duration was prolonged across China in the past three decades under the combined effects of temperature, agronomic management, and cultivar shift. Glob. Chang. Biol. 2014, 20, 3686–3699. [Google Scholar] [CrossRef]
- China Meteorological Administration; China Intercontinental Communication Co., Ltd: Beijing, China, 2014.
- Hoang, L.; Ngoc, T.A.; Maskey, S. A robust parameter approach for estimating ceres-rice model parameters for the vietnam mekong delta. Field Crops Res. 2016, 196, 98–111. [Google Scholar] [CrossRef]
- Cao, X.X.; An, K.Z.; Cai, W.; Su, R.R.; Yao, F.M. Validation and adaptability evaluation of ceres-rice model in the Jianghan plain. Chin. J. Agrometeorol. 2013, 34, 447–454. [Google Scholar]
- Cheyglinted, S.; Ranamukhaarachchi, S.L.; Singh, G. Assessment of the ceres-rice model for rice production in the central plain of Thailand. J. Agric. Sci. 2001, 137, 289–298. [Google Scholar] [CrossRef]
- Jones, J.W.; He, J.; Boote, K.J.; Wilkens, P.; Porter, C.H.; Hu, Z. Estimating dssat cropping system cultivar-specific parameters using bayesian techniques. Methods Introd. Syst. Models Into. Agric. Res. 2011. [Google Scholar] [CrossRef]
- Ahmad, A.; Ali, A.; Khaliq, T.; Wajid, S.A.; Iqbal, Z.; Ibrahim, M.; Javeed, H.M.R.; Hoogenboom, G. Oilcrop-sun model relevance for evaluation of nitrogen management of sunflower hybrids in Sargodha, Punjab. Am. J. Plant Sci. 2013, 4, 1731–1735. [Google Scholar] [CrossRef]
- RCP Datatbase. Version 2.0.5. Available online: http://tntcat.iiasa.ac.at:8787/RcpDb/dsd?Action=htmlpage&page=compare (accessed on 11 July 2019).
- Guo, Y.; Senthilnath, J.; Wu, W.; Zhang, X.; Zeng, Z.; Huang, H. Radiometric calibration for multispectral camera of different imaging conditions mounted on a uav platform. Sustainability 2019, 11, 978. [Google Scholar] [CrossRef]
- Grassini, P.; van Bussel, L.G.J.; Van Wart, J.; Wolf, J.; Claessens, L.; Yang, H.; Boogaard, H.; de Groot, H.; van Ittersum, M.K.; Cassman, K.G. How good is good enough? Data requirements for reliable crop yield simulations and yield-gap analysis. Field Crops Res. 2015, 177, 49–63. [Google Scholar] [CrossRef] [Green Version]
- Zhu, S.; Zhang, H.; Gang, W.; Qian, G. Interpretation of international cooperation on mitigation from IPCC fifth assessment report. Prog. Inquisitiones Mutat. Clim. 2014, 59, 901–913. [Google Scholar]
- Amiri, E.; Rezaei, M.; Bannayan, M.; Soufizadeh, S. Calibration and evaluation of ceres rice model under different nitrogen- and water-management options in semi-mediterranean climate condition. Commun. Soil Sci. Plant Anal. 2013, 44, 1814–1830. [Google Scholar] [CrossRef]
- Feldmeyer, D.; Wilden, D.; Kind, C.; Kaiser, T.; Goldschmidt, R.; Diller, C.; Birkmann, J. Indicators for monitoring urban climate change resilience and adaptation. Sustainability 2019, 11, 2931. [Google Scholar] [CrossRef]
- Beza, E.; Silva, J.V.; Kooistra, L.; Reidsma, P. Review of yield gap explaining factors and opportunities for alternative data collection approaches. Eur. J. Agron. 2017, 82, 206–222. [Google Scholar] [CrossRef]
- Bryant, C.R.; Sarr, M.A.; Delusca, K. Agricultural Adaptation to Climate Change; Springer: Berlin, Germany, 2016. [Google Scholar]
- Jiang, M.; Shi, C.L.; Liu, Y.; Jin, Z.Q. Response of rice production to climate change based on self-adaptation in fujian province. J. Agric. Sci. 2017, 155, 751–765. [Google Scholar] [CrossRef]
- Biber, D. Pearson Correlation Coefficients for All Linguistic Features. In Variation Across Speech and Writing; Cambridge University Press: Cambridge, UK, 1988. [Google Scholar]
- Ahlgren, P.; Bo, J.; Rousseau, R. Requirements for a cocitation similarity measure, with special reference to pearson’s correlation coefficient. J. Assoc. Inf. Sci. Technol. 2014, 54, 550–560. [Google Scholar] [CrossRef]
- Byjesh, K.; Kumar, S.N.; Aggarwal, P.K. Simulating impacts, potential adaptation and vulnerability of maize to climate change in India. Mitig. Adapt. Strateg. Glob. Chang. 2010, 15, 413–431. [Google Scholar] [CrossRef]
- Deryng, D.; Sacks, W.J.; Barford, C.C.; Ramankutty, N. Simulating the effects of climate and agricultural management practices on global crop yield. Glob. Biogeochem. Cycles 2011, 25. [Google Scholar] [CrossRef]
- Srivastava, A.K.; Gaiser, T.; Ewert, F. Climate change impact and potential adaptation strategies under alternate climate scenarios for yam production in the sub-humid savannah zone of West Africa. Mitig. Adapt. Strateg. Glob. Chang. 2016, 21, 955–968. [Google Scholar] [CrossRef]
- Saseendran, S.A.; Singh, K.K.; Rathore, L.S.; Singh, S.V.; Sinha, S.K. Effects of climate change on rice production in the tropical humid climate of Kerala, India. Clim. Chang. 2000, 44, 495–514. [Google Scholar] [CrossRef]
- Lansigan, F.P.; Santos, W.L.D.L.; Coladilla, J.O. Agronomic impacts of climate variability on rice production in the philippines. Agric. Ecosyst. Environ. 2000, 82, 129–137. [Google Scholar] [CrossRef]
- Shi, W.; Tao, F. Vulnerability of african maize yield to climate change and variability during 1961–2010. Food Secur. 2014, 6, 471–481. [Google Scholar] [CrossRef]
- Yang, D.; Xiong, W.; Xu, Y.; Feng, L.; Liu, H. Analysis of reason for recent slowing maize yield increase under climate change in China. Trans. Chin. Soc. Agric. Eng. 2017, 33, 231–238. [Google Scholar]
- Zhai, S.; Song, G.; Qin, Y.; Ye, X.; Lee, J. Modeling the impacts of climate change and technical progress on the wheat yield in inland China: An autoregressive distributed lag approach. PLoS ONE 2017, 12, e0184474. [Google Scholar] [CrossRef]
- Zhang, X.; Xu, M.; Nan, S.; Wei, X.; Huang, S.; Wu, L. Modelling and predicting crop yield, soil carbon and nitrogen stocks under climate change scenarios with fertiliser management in the north China plain. Geoderma 2016, 265, 176–186. [Google Scholar] [CrossRef]


| GCM | Publishing Institute | Horizontal Resolution | Ensemble Members | ||
|---|---|---|---|---|---|
| 2006–2015 | 2106–2115 (+ 1.5 °C) | 2106–2115 (+ 2.0 °C) | |||
| ECHAM6-3-LR | Max Planck Institute for Meteorology, Hamburg, Germany; Deutsche Klimarechenzentrum, Hamburg, Germany | 2.813 × 2.791° | 20 | 20 | 20 |
| NorESM1-HAPPI | NorESM (Norwegian Earth System Model) climate modeling consortium | 1.250 × 0.940° | 20 | 20 | 20 |
| CAM4-2degree | ETH, Zurich, Switzerland | 2.000 × 2.000° | 20 | 20 | 20 |
| MIROC5 | Atmosphere and Ocean Research Institute, University of Tokyo, Chiba, Japan; National Institute for Environmental Studies, Ibaraki, Japan; Japan Agency for Marine-Earth Science and Technology, Kanagawa, Japan | 2.813 × 2.791° | 10 | 10 | 10 |
| Warming Scenario | (°C) | (°C) | (mm) | (h) | CO2 (ppm) |
|---|---|---|---|---|---|
| 1.5 °C | 0.65 | 0.66 | 0.20 | 0.62 | 423.4 |
| 2.0 °C | 1.11 | 0.97 | 0.62 | 0.69 | 486.6 |
| Names | a | b | c | d |
|---|---|---|---|---|
| 1.5 °C_early mature rice | −1647.591 | 10285.218 | −7357.137 | −6962.957 |
| 1.5 °C_late mature rice | −5466.918 | 3389.475 | 2751.96 | −8846.68 |
| 2.0 °C_early mature rice | −1900.734 | 2350.255 | 2070.157 | −700.124 |
| 2.0 °C_late mature rice | −2840.214 | 14750.812 | −12510.515 | −2060.577 |
| Warming Scenario | PCC | RY | SR | TM | TN | P |
|---|---|---|---|---|---|---|
| 1.5 °C_early mature rice | RY | 1 | 0.057 | 0.064 | 0.037 | −0.697 |
| SR | 0.057 | 1 | 0.997 | 0.997 | 0.108 | |
| TM | 0.064 | 0.997 | 1 | 0.998 | 0.116 | |
| TN | 0.037 | 0.997 | 0.998 | 1 | 0.124 | |
| P | −0.697 | 0.108 | 0.116 | 0.124 | 1 | |
| 1.5 °C_late mature rice | RY | 1 | −0.327 | −0.315 | −0.318 | −0.718 |
| SR | −0.327 | 1 | 0.997 | 0.997 | 0.108 | |
| TM | −0.315 | 0.997 | 1 | 0.998 | 0.116 | |
| TN | −0.318 | 0.997 | 0.998 | 1 | 0.124 | |
| P | −0.718 | 0.108 | 0.116 | 0.124 | 1 | |
| 2.0 °C_early mature rice | RY | 1 | 0.099 | 0.19 | 0.261 | −0.054 |
| SR | 0.099 | 1 | 0.865 | 0.399 | −0.225 | |
| TM | 0.19 | 0.865 | 1 | 0.552 | −0.009 | |
| TN | 0.261 | 0.399 | 0.552 | 1 | 0.276 | |
| P | −0.054 | −0.225 | −0.009 | 0.276 | 1 | |
| 2.0 °C_late mature rice | RY | 1 | 0.287 | 0.283 | −0.262 | −0.318 |
| SR | 0.287 | 1 | 0.865 | 0.399 | −0.225 | |
| TM | 0.283 | 0.865 | 1 | 0.552 | −0.009 | |
| TN | −0.262 | 0.399 | 0.552 | 1 | 0.276 | |
| P | −0.318 | −0.225 | −0.09 | 0.276 | 1 |
© 2019 by the authors. Licensee MDPI, Basel, Switzerland. This article is an open access article distributed under the terms and conditions of the Creative Commons Attribution (CC BY) license (http://creativecommons.org/licenses/by/4.0/).
Share and Cite
Guo, Y.; Wu, W.; Du, M.; Liu, X.; Wang, J.; Bryant, C.R. Modeling Climate Change Impacts on Rice Growth and Yield under Global Warming of 1.5 and 2.0 °C in the Pearl River Delta, China. Atmosphere 2019, 10, 567. https://doi.org/10.3390/atmos10100567
Guo Y, Wu W, Du M, Liu X, Wang J, Bryant CR. Modeling Climate Change Impacts on Rice Growth and Yield under Global Warming of 1.5 and 2.0 °C in the Pearl River Delta, China. Atmosphere. 2019; 10(10):567. https://doi.org/10.3390/atmos10100567
Chicago/Turabian StyleGuo, Yahui, Wenxiang Wu, Mingzhu Du, Xiaoxuan Liu, Jingzhe Wang, and Christopher Robin Bryant. 2019. "Modeling Climate Change Impacts on Rice Growth and Yield under Global Warming of 1.5 and 2.0 °C in the Pearl River Delta, China" Atmosphere 10, no. 10: 567. https://doi.org/10.3390/atmos10100567