Article

Aromatic Hydrocarbons in Urban and Suburban Atmospheres in Central China: Spatiotemporal Patterns, Source Implications, and Health Risk Assessment

1
School of Resource and Environmental Sciences, Wuhan University, Wuhan 430072, China
2
Department of Civil and Environmental Engineering, The Hong Kong Polytechnic University, Hong Kong 999077, China
*
Authors to whom correspondence should be addressed.
Atmosphere 2019, 10(10), 565; https://doi.org/10.3390/atmos10100565
Submission received: 31 July 2019 / Revised: 29 August 2019 / Accepted: 8 September 2019 / Published: 20 September 2019
(This article belongs to the Special Issue Atmospheric Volatile Organic Compounds (VOCs))

Abstract

:
Ambient aromatic hydrocarbons (AHs) are hazardous air pollutants and the main precursors of ozone (O3). In this study, the characteristics of ambient AHs were investigated at an urban site (Ziyang, ZY) and a suburban site (Jiangxia, JX) in Wuhan, Central China, in 2017. The positive matrix factorization (PMF) model was used to investigate the sources of AHs, and a health risk assessment was applied to estimate the effects of AHs on human health. The concentrations of total AHs at ZY (2048 ± 1364 pptv) were comparable (p > 0.05) to that (2023 ± 1015 pptv) at JX. Source apportionment results revealed that vehicle exhaust was the dominant source of both, total AHs, and toluene, contributing 51.9 ± 13.1% and 49.3 ± 9.5% at ZY, and 44.7 ± 12.6% and 43.2 ± 10.2% at JX, respectively. Benzene was mainly emitted from vehicle exhaust at ZY (50.2 ± 15.5%), while it was mainly released from biomass and coal burning sources at JX (50.6 ± 16.7%). The health risk assessment results indicated that AHs did not have a significant non-carcinogenic risk, while the carcinogenic risks of benzene exceeded the regulatory limits set by the USEPA for adults (1 × 10⁻⁶) at both sites. Hence, controlling the emissions of vehicular and biomass/coal burning sources will be an effective way to reduce ambient AHs and the health risk of benzene exposure in this region. These findings will enhance our knowledge of ambient AHs in Central China and be helpful for local governments to formulate air pollution control strategies.

1. Introduction

Tropospheric ozone (O3) and fine particulate matter (PM2.5) pollution have become the most prevalent environmental pollution issues around the world [1,2,3,4], especially in developing countries, such as China [5,6,7]. In recent years, the relationships between O3/PM2.5 and their precursors have been investigated, and volatile organic compounds (VOCs) were found to be the key precursors of O3 and secondary organic aerosols (SOA) [8,9,10]. For example, it has been reported that VOCs were the limiting factors for O3 formation in the urban areas of Beijing, Hong Kong and Mexico City [11,12,13]. Moreover, VOCs made considerable contributions to SOA formation in eastern China, Beijing and Paris [14,15,16].
Aromatic hydrocarbons (AHs) are a group of VOCs with one benzene ring in the structure, including benzene, toluene, ethylbenzene, xylenes, styrene, trimethylbenzenes and so on, which are the predominant VOCs in ambient air and have relatively high photochemical reactivities [17,18]. Anthropogenic AHs emissions in China were estimated to be 4.1 Tg in 2005, and 7.4 Tg in 2020, accounting for more than 20% of the national VOC emissions [19,20,21]. Furthermore, AHs have been recognized as the main contributors of O3 and SOA in megacities in China. For instance, AHs contributed 43.6%, 40%, and 79% to O3 production in northern China, Pearl River Delta (PRD) region and Shanghai [22,23,24]. Toluene, styrene and ethylbenzene made the largest contributions to SOA formation in Beijing [25]. It has been well-documented that exposure to AHs has adverse effects on human health [26,27,28]. Therefore, it is essential to reveal the pollution characteristics and dominant sources of AHs to effectively control O3 and PM2.5 pollution.
AHs are mainly released to the atmosphere from many anthropogenic sources, such as combustion of fossil fuels [29,30], biomass burning [31,32], and solvent usage [33,34]. However, the dominant sources of AHs vary among regions [29,35,36,37,38]. For instance, Zhang et al. reported that vehicle exhaust (contribution: 44%) was the dominant AHs source in Guangzhou, and solvent usage made the greatest contribution (51%) to AHs in Wanqingsha [35]. Wang et al. indicated that vehicle exhaust only contributed about 23% to C6–C8 AHs in Shanghai, while non-vehicle sources, such as industrial emissions made a considerable contribution to C6–C8 AHs [38]. Zhang et al. found that the dominant source of AHs in northern China was biomass/biofuel/coal burning, while AHs in southern China mainly came from traffic and industrial emissions [29]. Investigating the source of contributions to AHs could extend our knowledge of ambient AHs and benefit local pollution control strategies. However, previous studies on ambient AHs in China were mainly carried out in developed regions, such as Beijing, Shanghai, and PRD region, while few studies have focused on Central China.
Wuhan is the largest city in Central China, with a population of 10.9 million. Rapid urbanization and industrialization in recent years have led to severe air pollution in this area. In 2017, the air quality during 110 days did not meet China’s National Ambient Air Quality Standards, with the primary air pollutants being O3 and PM2.5 [39]. Previous studies have revealed that AHs have made large contributions to O3 and SOA formation in Wuhan [40,41,42,43], suggesting that the emission control of AHs might be an effective way to reduce the formation of O3 and SOA in this region. However, to date, limited studies have reported on the specific source contributions to AHs, especially in different sites and seasons. Moreover, the health risks of AHs have not been estimated yet in this region. Understanding the sources and health risks of AHs will assist researchers and local governments in formulating control strategies.
In this study, AHs were measured at urban and suburban areas in Wuhan between February and October 2017, in order to determine the spatiotemporal variations of AH species and their abundance, as well as their emission sources. The contributions of each source to total AHs, benzene, and toluene were quantified by the Positive Matrix Factorization Model (PMF) model. Moreover, the non-carcinogenic hazard and carcinogenic risk, arising from exposure to AHs at the two sites, were estimated based on the guidelines of the United States Environmental Protection Agency (USEPA). The findings of this study are expected to improve our understanding of pollution characteristics and health risk of AHs in Central China, and also have implications for other megacities around the world.

2. Materials and Methods

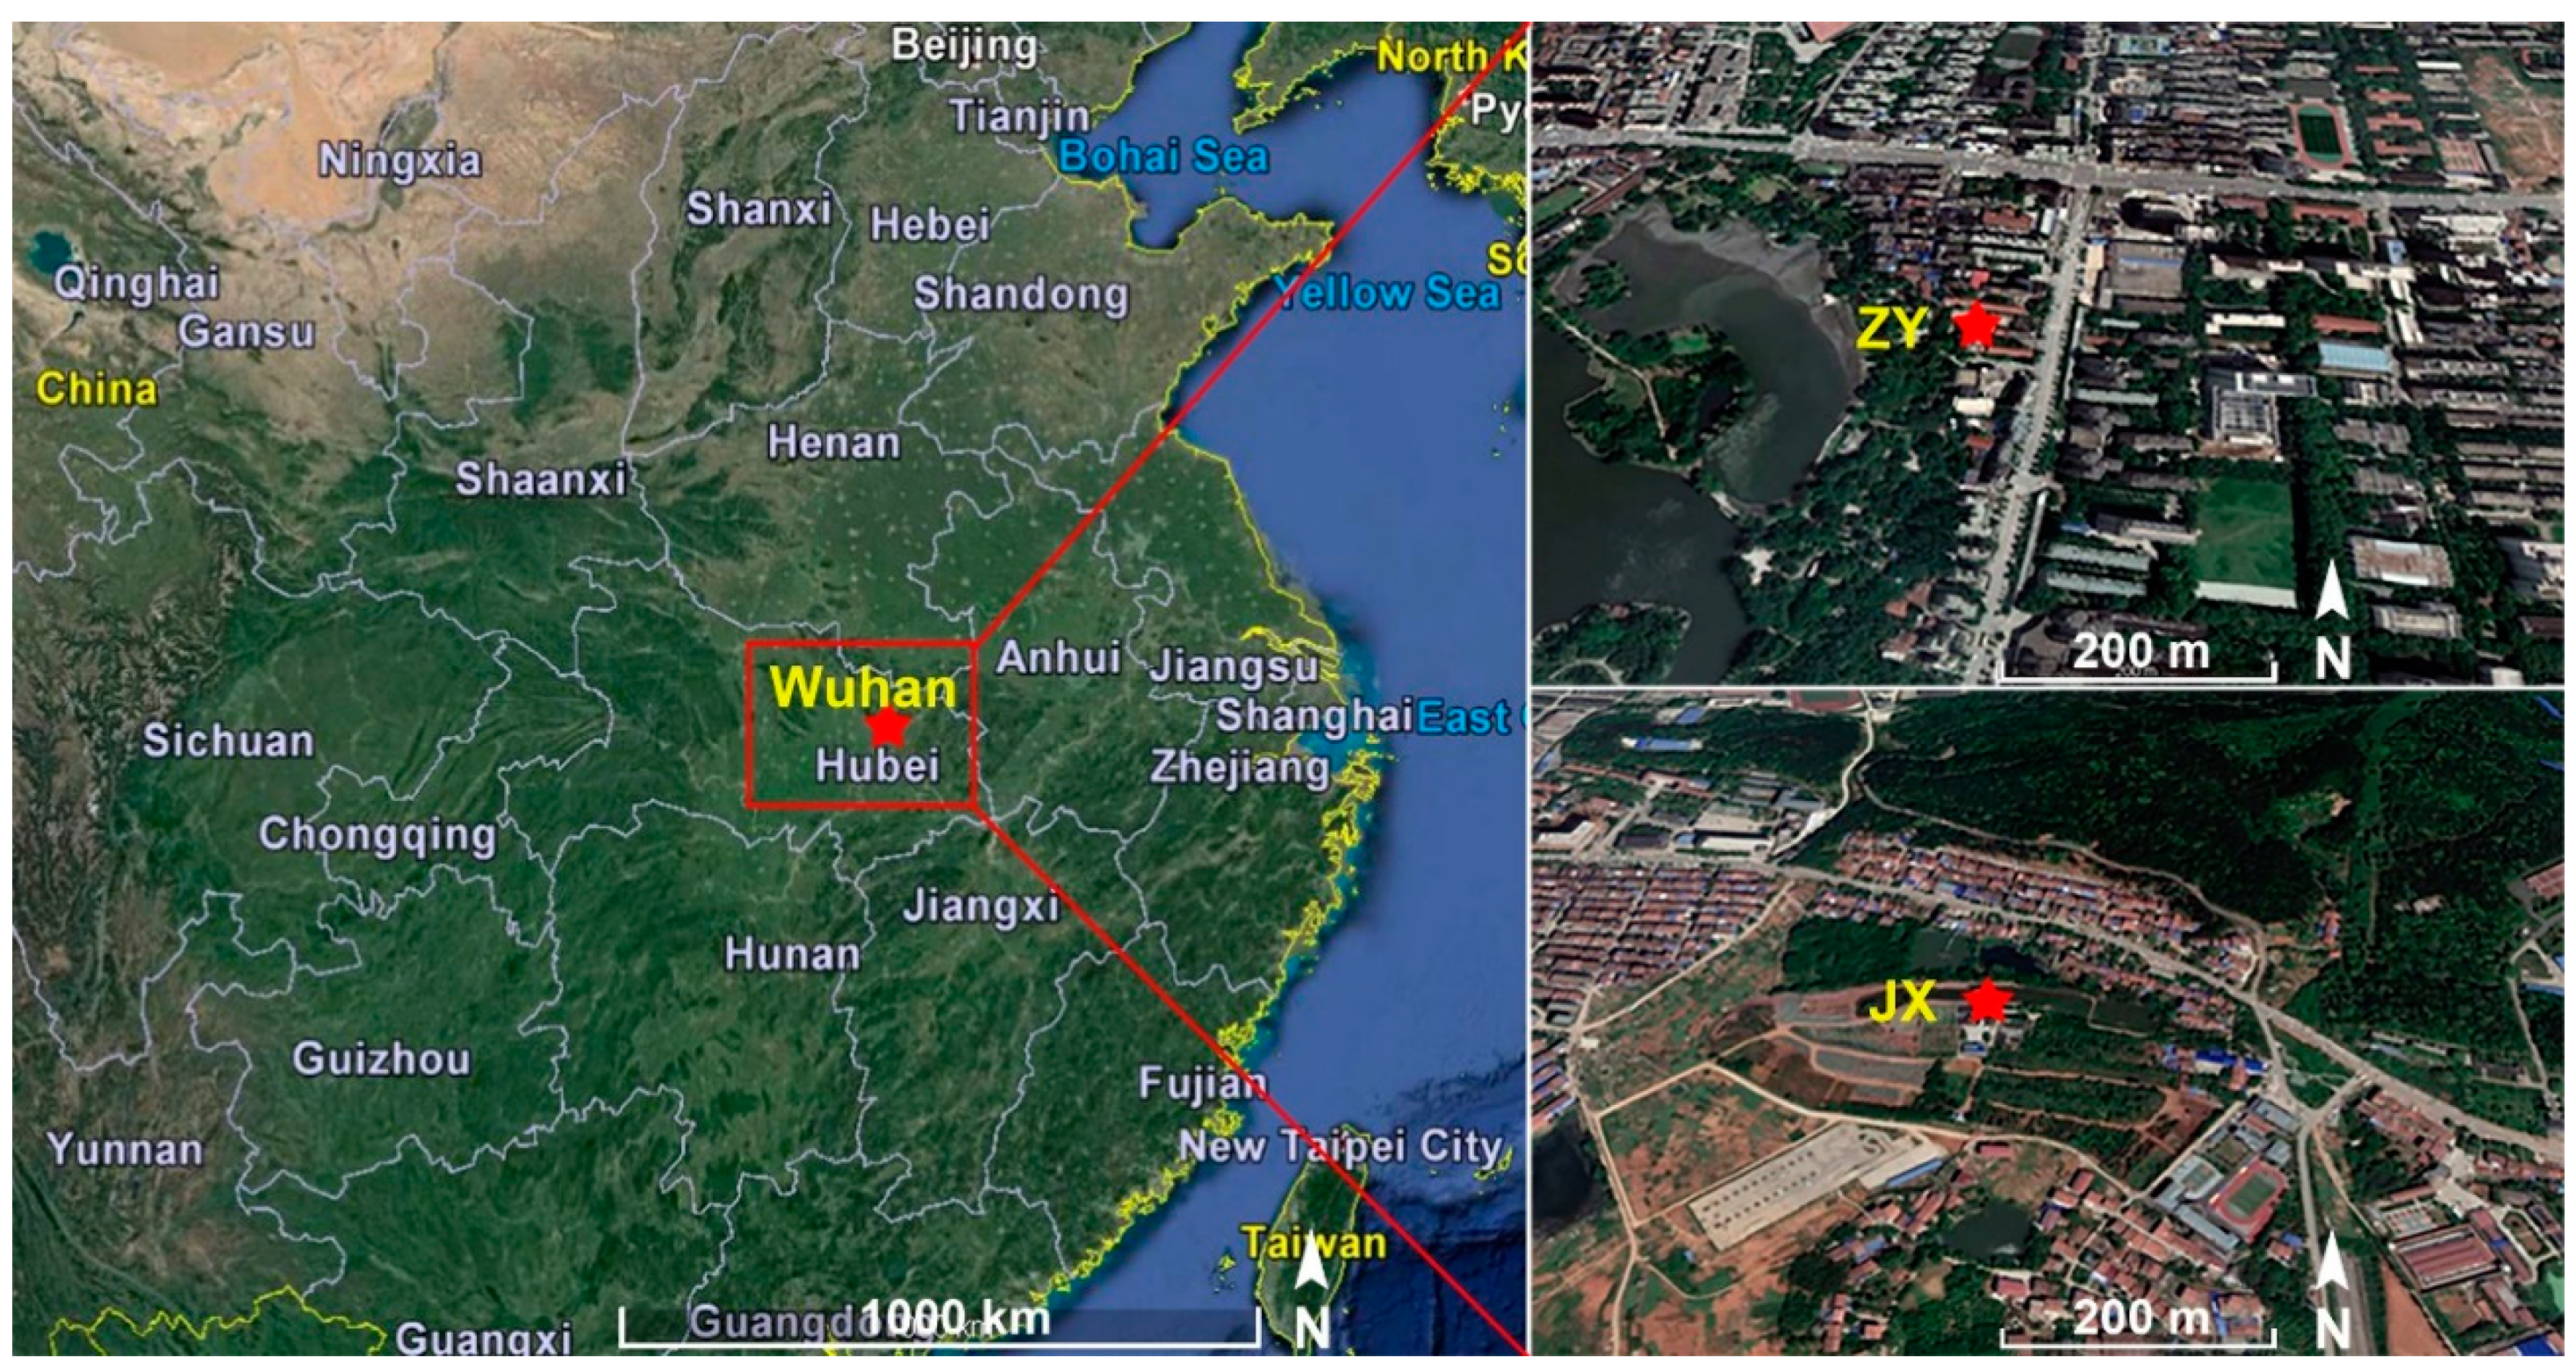
2.1. Site Description and Field Sampling

Ambient VOC samples were collected from Ziyang (ZY) and Jiangxia (JX), Wuhan, between February and November 2017. The geographical locations of the sampling sites are shown in Figure 1. The sampling sites were chosen from the air quality monitoring stations set by the environment protection department to ensure their representativeness. ZY (114.31° E, 30.53° N) is a typical urban site located in the center of Wuhan. It is surrounded by commercial and residential districts with several heavy traffic roads nearby. The sampling campaign was carried out at a national air quality monitoring station, which is on the rooftop of a four-story building (~12 m above the ground level). JX (114.34° E, 30.34° N) is a typical suburban site, located in southern Wuhan, which is about 20 kilometers away from ZY. It is located on a hill at the height of 10 m above ground, and is surrounded by residential areas and farmlands. The sampling was conducted on the rooftop of an air quality monitoring station (~14 m above the ground level), that was operated by the Hubei Provincial Environment Monitoring Centre. Samples that were collected at ZY and JX sites represented the conditions of AHs in urban, and suburban areas, respectively, which could help to investigate the similarities and differences of AHs in these areas.
Each VOC sample was collected for 1 hour using a clean and evacuated 2 L electro-polished stainless-steel canister. The sampling flow rate (~0.33 L min−1) was controlled by a mass flow controller. Five sampling campaigns were conducted during this study period, from 12 to 17 February (winter), 25 to 30 April (spring), 13 to 14 and 26 to 30 July (summer), and 29 October to 4 November (autumn) in 2017. The sampling dates were selected based on the weather forecast, and all samples were collected on sunny days. On each sampling day, three samples were collected at 7:00−8:00 local time (LT), 13:00−14:00 LT, and 18:00−19:00 LT. A total of 143 air samples were collected, including 71 samples from ZY and 72 samples from JX. The missing samples were attributed to the precipitation and the malfunction of the instrument. Moreover, field blanks were collected during the sampling period. Field blank canisters were carried to the sampling sites and connected with the mass flow controllers, but the valves of the canisters were not opened. Then, the blanks were brought back to the laboratory for chemical analysis.
In this study, meteorological parameters (i.e., temperature, relative humidity, wind speed, and sea level pressure) were acquired from the Weather Underground website [44]. The boundary layer heights were obtained from ERA-Interim analysis of the European Centre for Medium-range Weather Forecasts (ECMWF) [45].

2.2. Chemical Analysis

All the samples were analyzed in the air laboratory at Hong Kong Polytechnic University, and 81 VOC species were quantified. VOC samples were analyzed using a Model 7200 pre-concentrator (Entech Instruments Inc., Simi Valley, California, USA) coupled with an Agilent 7890B-5977A gas chromatograph-mass selective detector/flame ionization detector/electron capture detector (GC-MSD/FID/ECD, Agilent Technologies, Santa Clara, California, USA). The details of the analysis procedures are described elsewhere [46]. Briefly, 250 mL samples were initially concentrated through a liquid-nitrogen cryogenic trap at −40 °C. After trapping, the primary trap was heated to 10 °C, and the mixture was transferred by pure helium to the secondary trap at −50 °C with Tenax-TA as adsorbent. The majority of H2O and CO2 were removed during these two steps. The secondary trap was then heated to transfer VOCs to the third trap at −165 °C. After that, the trap was rapidly heated to 80 °C, and the VOCs were transferred to the GC-MSD/FID/ECD system. C2−C3 hydrocarbons, C5−C10 hydrocarbons, and halocarbons were identified by FID, MSD, and ECD detectors, respectively. This research mainly focused on the characteristics of 14 AHs. Other VOC species were used as tracers in the source analysis, similar to previous studies [29,35,47].
During the chemical analyses, the target VOC components were identified according to their retention times and mass spectra, and quantified by external calibration method. The calibration standards were prepared by dilution of Photochemical Assessment Monitoring Stations (PAMS) and TO-14 standard mixture (Linde Gases Inc., Houston, USA) using an Entech 4700 dynamic diluter (Entech Instruments Inc., California, USA). The concentrations of standards were 0.5, 1, 2, 5, and 10 ppbv. The calibration curves were obtained by running the five diluted standards and zero air. The R2 values of the calibration curves were all above 0.995. Blanks were measured daily before sampling analysis to guarantee the absence of contaminants in the analytical system. Calibration was performed every day by using a standard sample to test the performance of the system, and the accepted responses of target species were within ±10% of the calibration curves. The method detection limits (MDL) of VOC species were in the range of 2−57 pptv. The detailed MDL values for each AH species and other VOC species are shown in Table 2, and Table S1, respectively. Field blank canisters were refilled with pure nitrate and analyzed the same way as the ambient air samples. All the target compounds in the field blank samples were below their MDL.

2.3. Data Analysis

2.3.1. Statistical Methods

In this study, SPSS Statistics 20.0 software package was employed for the statistical analyses. Average concentrations of AHs were calculated for the two sampling sites. For each AH species, the average concentrations and standard deviations (SD) in each site or season were calculated using SPSS 20.0. The independent samples t-test was used to compare AH concentrations and source contributions among seasons or sites. As with any measurement process, the determination of AH species was affected by random errors. To obtain reliable values, boxplot was applied to identify outliers which were ubsequently removed from the reference dataset.

2.3.2. Source Identification

The sources of AHs during the sampling period were explored using the USEPA PMF model (version 5.0), which has been described in detail by USEPA [48]. The model can be generally expressed according to Equation (1) [48,49],
x i j = k = 1 p g i k f k j   +   e i j
where xij is the observed concentration of jth species in ith sample, gik is the contribution of kth source to ith sample, fkj indicates the fraction of jth species in kth source, and eij is the residual for jth species in ith sample. The performance of the model and uncertainties in relation to the PMF results were analyzed according to the method reported by Belis et al. [50].
In this study, the input dataset was obtained by pooling the samples obtained at ZY and JX sites together, because the possible sources of AHs might be the same at the two sites (refer to Text S1 and Figure S1 in Supplementary Materials). This method was reported in previous studies and proved to increase the statistical significance of the analysis [51,52]. A total of 34 species were input into the PMF model. Moreover, 20 VOC species, including ethene, ethane, propane, i-butane, 1,3-butadiene, n-butane, trans-2-butene, cis-2-butene, 3-methyl-1-butene, 2-methyl-1-butene, i-pentane, n-pentane, cyclopentane, n-heptane, methylcyclohexane, n-nonane, and n-decane, were selected as tracers to help investigate the sources of AHs. This approach has been widely used in previous studies [35,53]. The minimum number of samples that are needed for the PMF model can be calculated by Equation (2) [54],
N > 30 + V + 3 2
where N is the number of samples and V is the number of species. For V = 34, the minimum acceptable sample size was 49. A total of 129 samples were input into the model for source analysis, which was considered to be an adequate sample size for the model.
The initial uncertainties were set for each species and sample at 10% of the concentration. If the value was below the detection limit, the concentration was set as MDL/2 and uncertainty was (5/6) × MDL [48,55,56]. Three to six factors were tested, and bootstrap as well as displacement analyses were also run to verify the stability of the results (refer to Text S2 and Table S2 in Supplementary Materials for details). The optimum solution of four factors was determined, based on the good fit of the observed data and possible sources in Wuhan.

2.3.3. Health Risk Assessment

AHs compounds are considered as the markers of human exposure to VOCs in urban and suburban atmospheric air, having adverse effects on human health [57,58,59]. In this study, the non-carcinogenic hazard and carcinogenic risk due to exposure to AHs were estimated according to the guidelines provided by the USEPA [60]. The exposure concentration (EC) was calculated using Equation (3),
E C i   =   C A i × E T × E F × E D A T
where ECi (μg m−3) is the exposure concentration of pollutant i; CAi (μg m−3) is the concentration of pollutant i in ambient air; ET (h day−1) is the daily exposure time; EF (day year−1) is the exposure frequency; ED (years) is the exposure duration, and AT (hours) is the average time [60].
The cancer risk was calculated by Equation (4),
R I S K   =   I U R   ×   E C
where RISK is the estimated inhalation cancer risk for the chemical i, and IUR is the inhalation unit risk for chemical i. As other AH species are not classified as human carcinogens under the USEPA Integrated Risk Information System (IRIS), the carcinogenic risk was only calculated for benzene.
The non-carcinogenic hazard of AH species was calculated using Equations (5) and (6),
H Q i   =     E C i R f C i × 1000
H I   =     H Q i
where HQi is the hazard quotient (HQ) for specific AH component i, HI is the hazard index, which is the sum of HQ for components with adverse effects on the same target organ or system, and RfCi is the reference concentration for the inhalation exposure of compound i. The hazard quotients of the AH species were calculated, except for propylbenzene and ethyltoluene because their non-carcinogenic hazards are relatively low and their RfC values are not provided by USEPA IRIS. For the non-carcinogenic risks, benzene and ethylbenzene were found to have adverse effects on the immune system, and developmental system, respectively, while toluene, xylenes, styrene, and trimethylbenzenes were harmful to nervous system. Then, the HI value for nervous system was calculated by adding the HQs of the related species. The parameters of the variables are listed in Table 1.

3. Results and Discussion

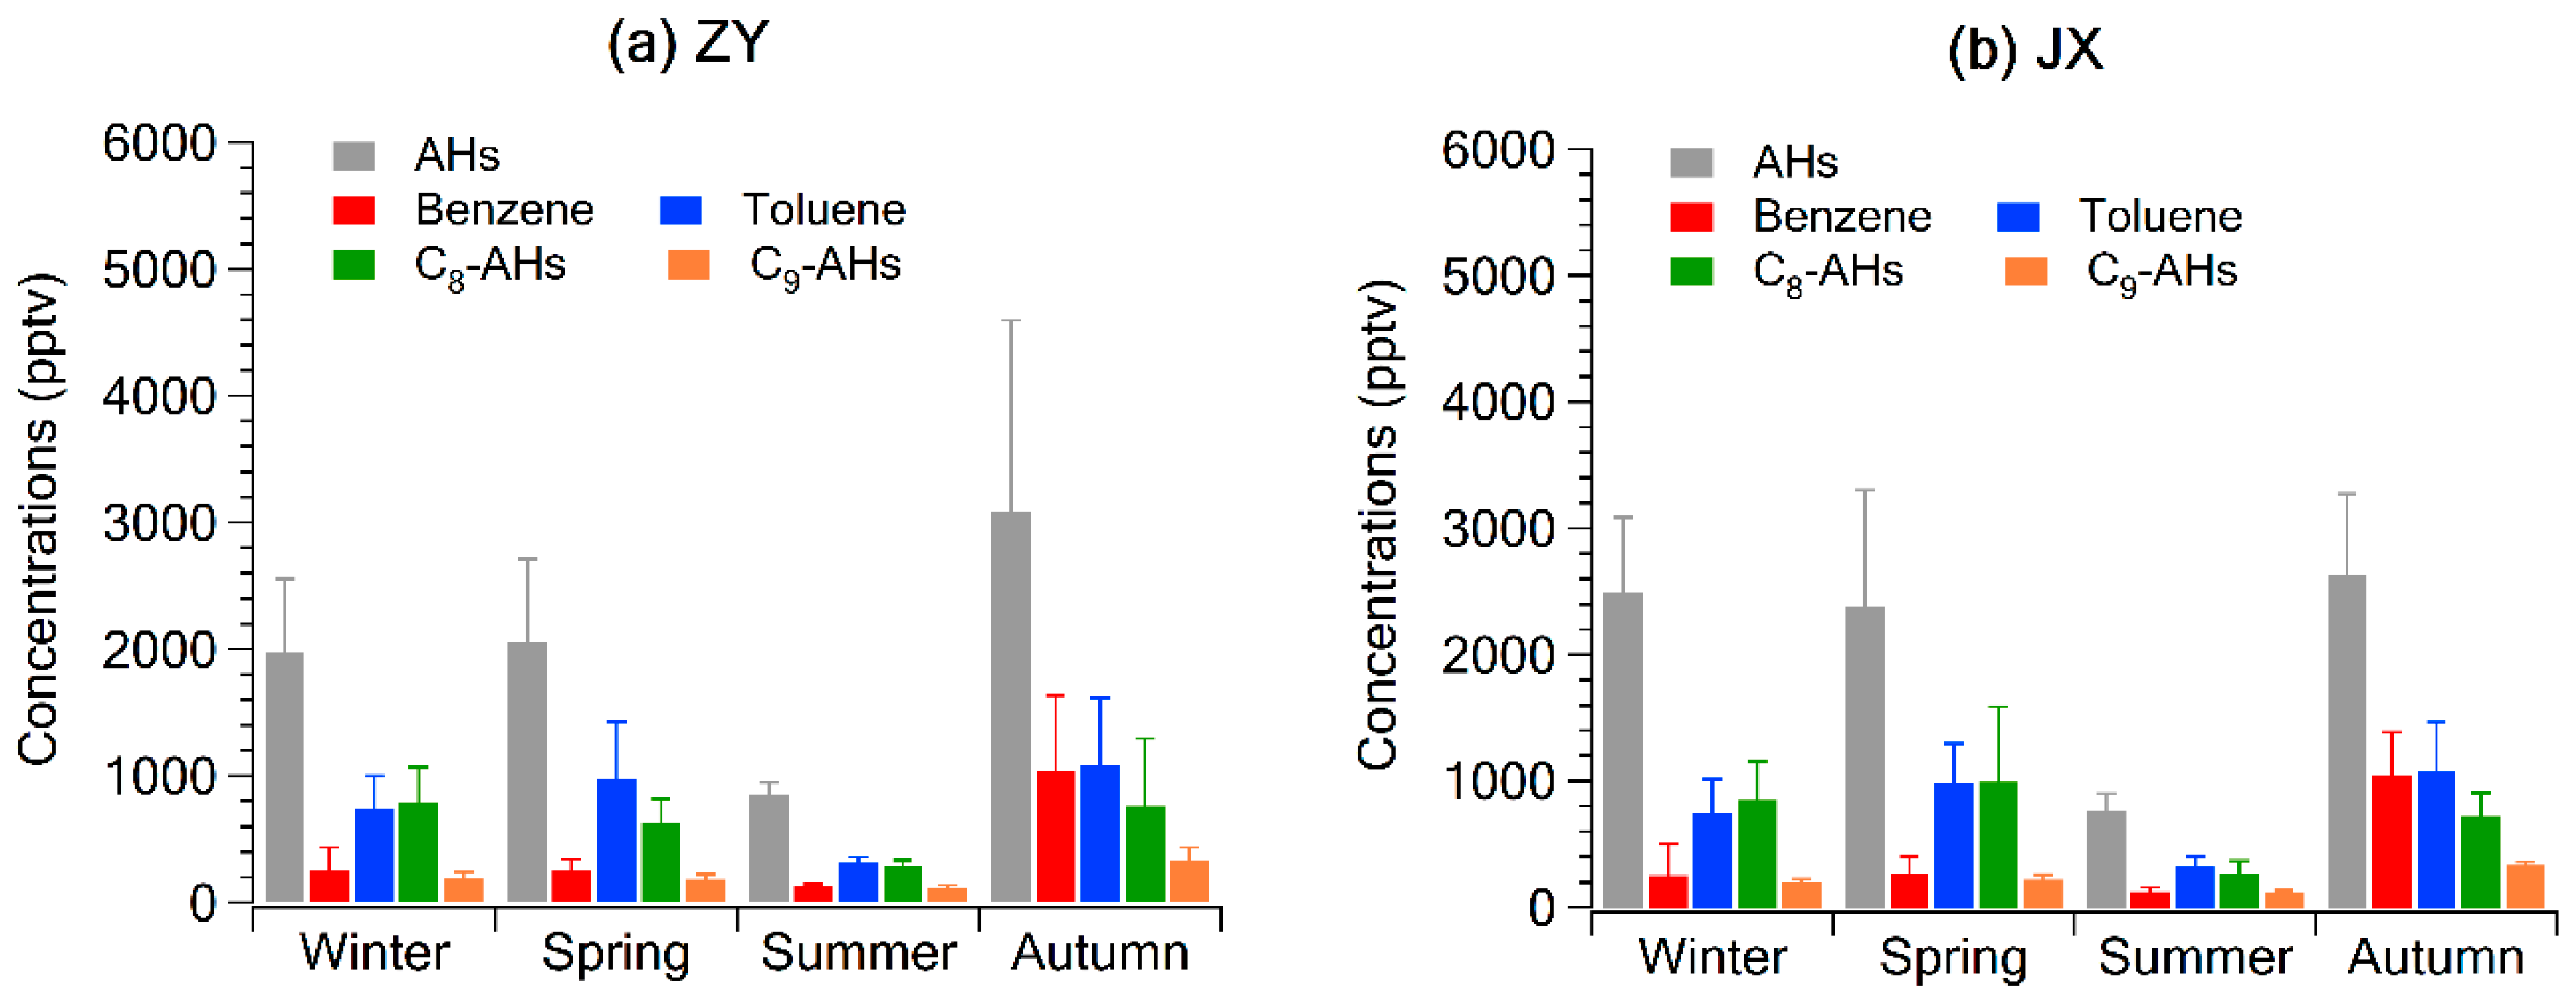
3.1. General Characteristics

The average concentrations of 14 AHs at ZY and JX during the sampling period are listed in Table 2. The concentrations of total AHs at the urban site ZY (2048 ± 1364 pptv) were comparable (p > 0.05) to the suburban site JX (2023 ± 1015 pptv). Benzene, toluene, ethylbenzene, and xylenes (BTEX) made the greatest contributions to AHs at both sites and accounted for 84.0 ± 5.2% and 83.4 ± 5.4% at ZY, and JX, respectively. Furthermore, toluene was the most abundant compound and represented 38.0 ± 7.1% and 34.1 ± 8.6% of the total aromatics at ZY, and JX, respectively. Hence, the levels of BTEX species measured in this study and previous studies were compared (Table 3).
Table 3 shows the concentrations of BTEX, observed in this study, and in previous studies for other cities around the world. Among urban areas, BTEX level in Wuhan was lower than the corresponding levels in Guangzhou, Beijing, Hong Kong, and Ottawa, while it was comparable to that in Paris. Toluene was the most abundant species in BTEX, as it is the most commonly used solvent and reagent compared to other BTEX compounds. Among suburban areas, the observed BTEX concentration in Wuhan was lower than those in Guangzhou, Beijing, and Nanjing, while it was higher than those in Orleans and Erie, Colorado. Toluene was also found to be the predominant species in suburban Wuhan, Guangzhou, Orleans, and Colorado, while benzene was the main species in Nanjing. These data suggest the presence of different emission sources near the sampling site. BTEX compounds have been associated with traffic exhaust, biomass/biofuel burning, industrial processes, and solvent usage [29,31,63]. The levels of the solvent-related species (i.e., toluene and xylenes) were relatively low in Wuhan, especially compared to other cities in China. It indicates that AHs might be less affected by solvent usage in Wuhan. Moreover, the meteorological conditions, sampling sites, and sampling period can also influence the levels of AHs in ambient air.

3.2. Seasonal Variations

Figure 2 shows the average mixing ratios of AHs at ZY and JX in winter (February), spring (April), summer (July) and autumn (October, November). At both sites, the levels of total AHs were the lowest (p < 0.01) in summer (849 ± 98 pptv at ZY and 765 ± 131 pptv at JX), and similar (p > 0.05) in other seasons. Toluene, C8 and C9 AHs were also observed to be the lowest in summer. Ambient AH levels strongly depend on meteorological conditions [70,71,72]. It was found that the wind speed in summer was much higher (p < 0.01) compared to other seasons and the boundary layer height was relatively high in summer (Table S3). The low AH concentrations in summer might be attributed to the larger boundary layer height and faster turbulent mixing processes [29]. Moreover, the average temperature in summer was higher (p < 0.01), compared to other seasons, which accelerates the photochemical reactions and leads to the depletion of AHs, especially the more reactive species (Table S4). For benzene, the highest concentrations (994 ± 275 pptv at ZY and 911 ± 155 at JX) were observed in autumn, which might be due to the emissions from biomass burning (see Section 3.3).

3.3. Source Implication

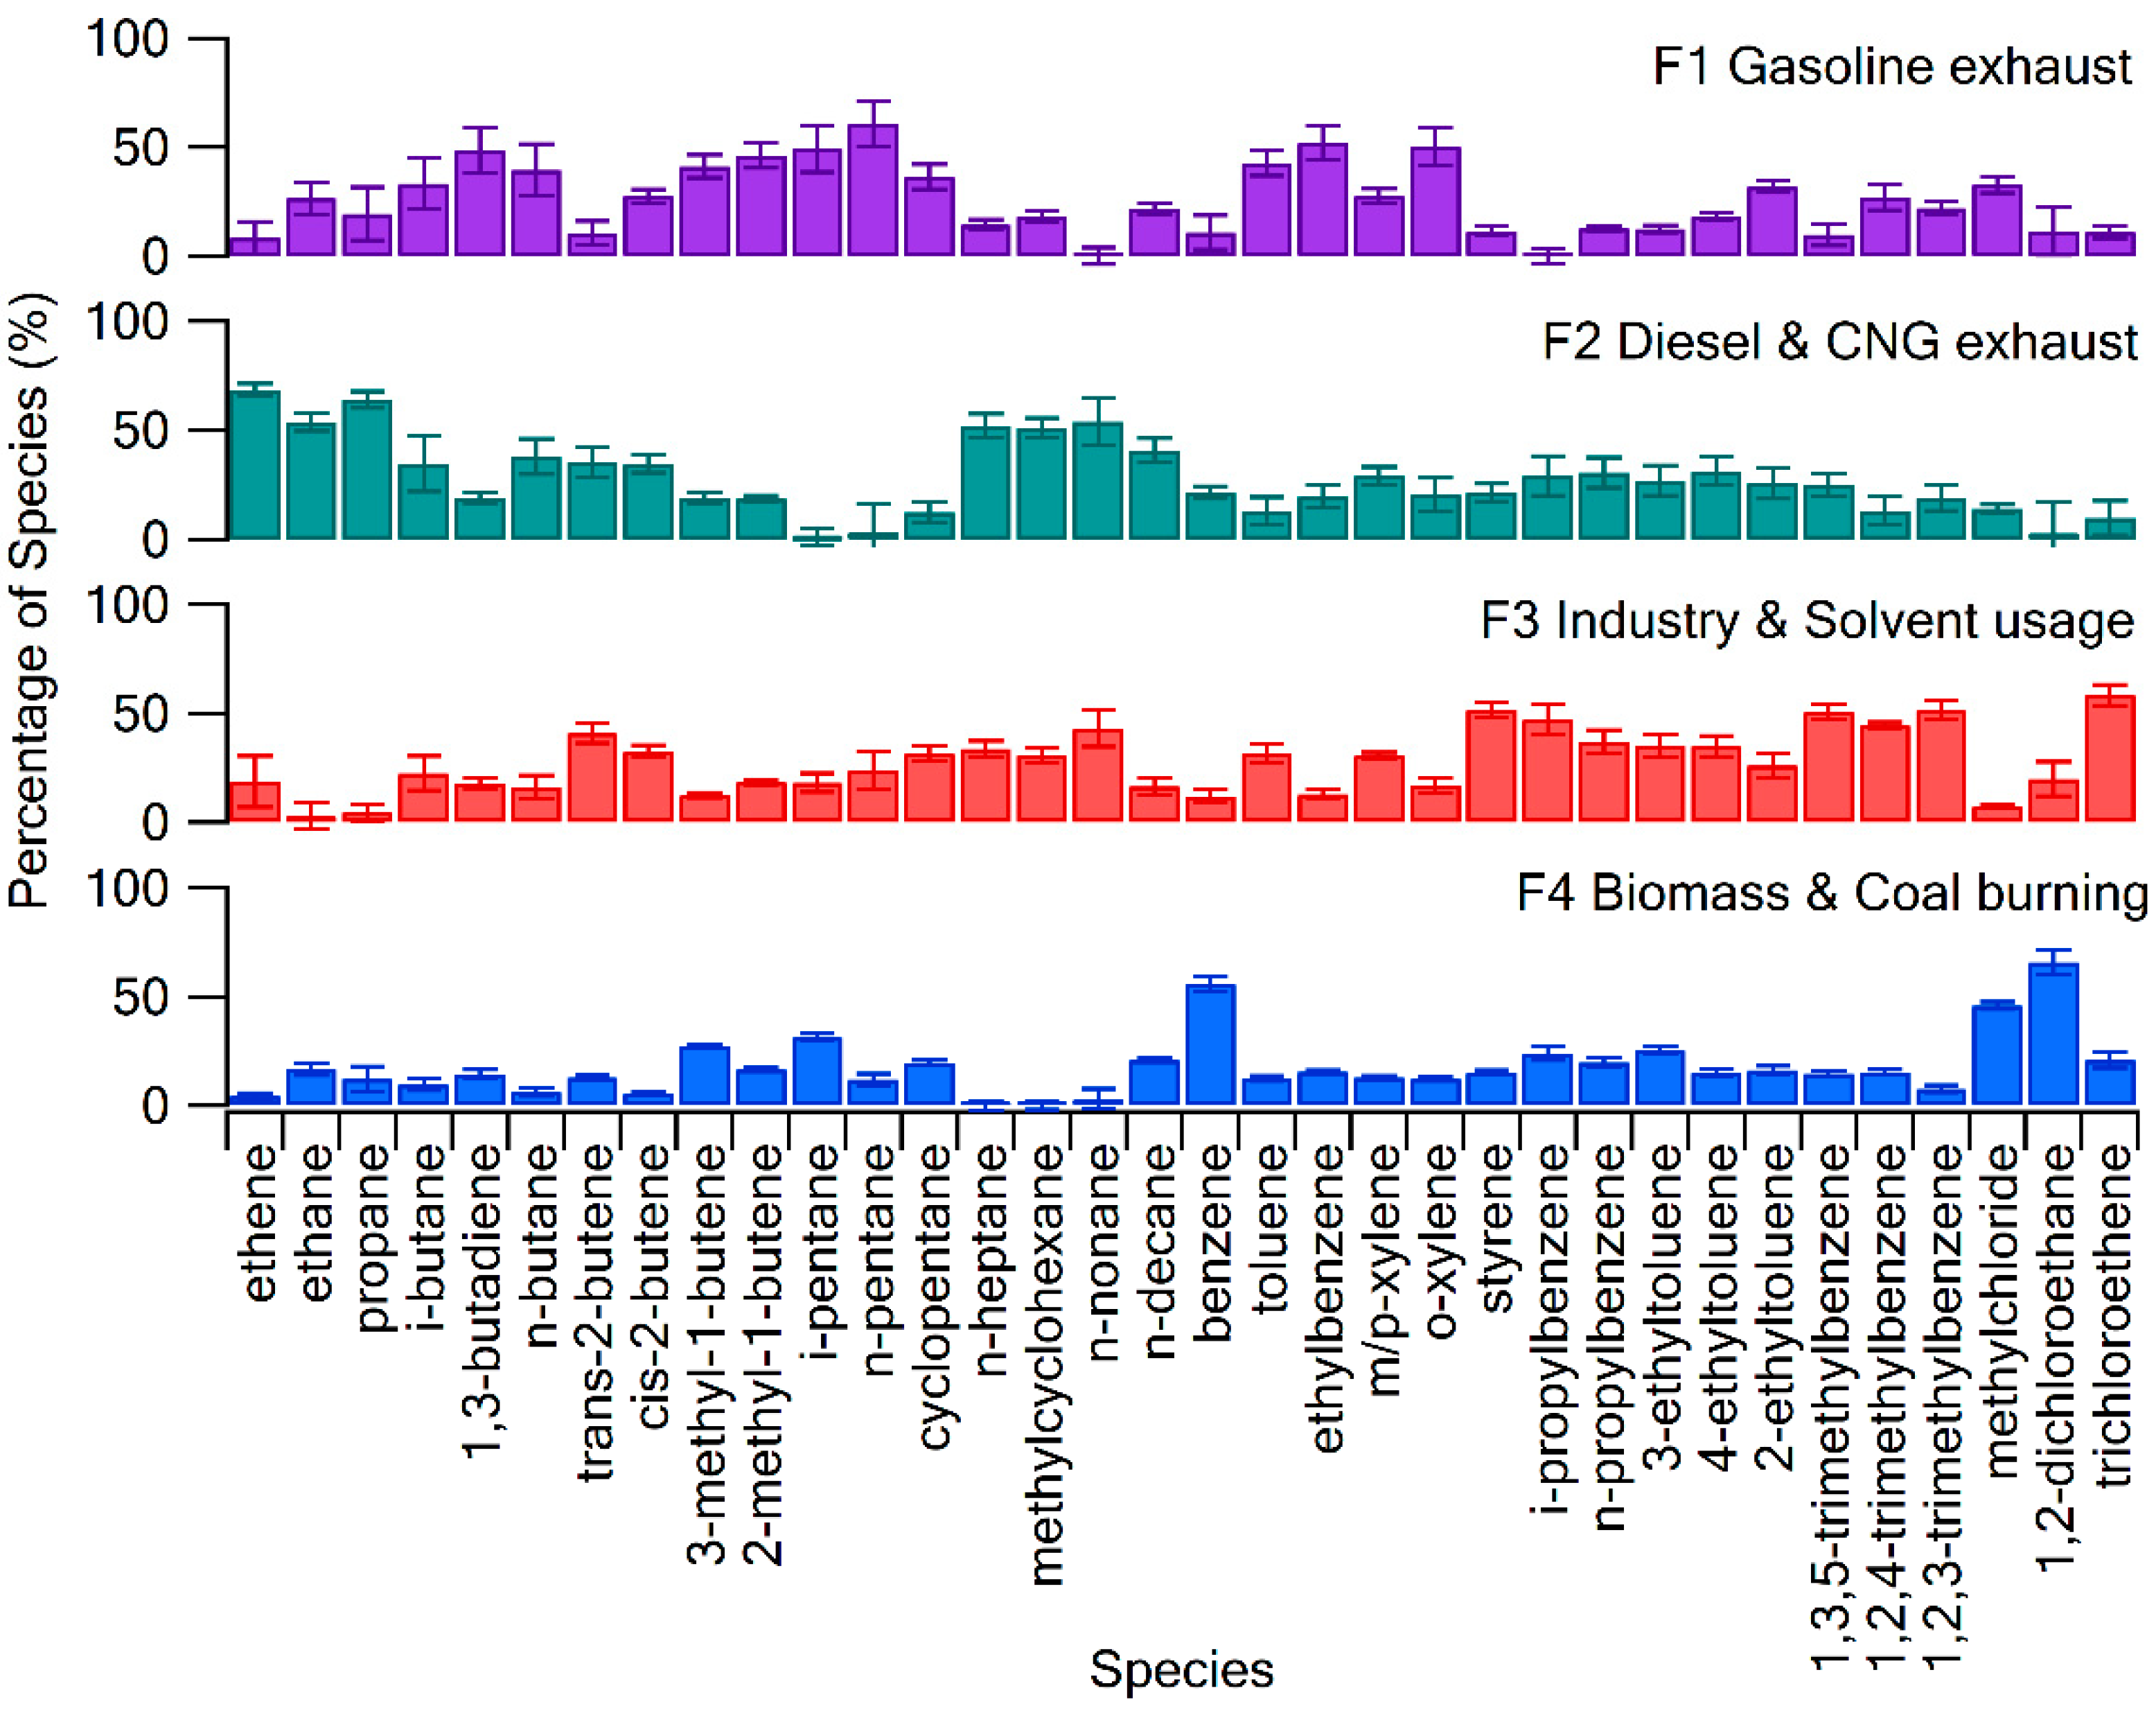
3.3.1. Source Profiles of Ambient AHs

Four factors were identified by the PMF model to best describe the sources of ambient AHs. As shown in Figure 3, the first factor was characterized by high percentages of i-/n-pentanes, 2/3-methyl-1-butene, and cyclopentane, representing gasoline vehicle exhaust [31,73]. The second factor was dominated by C2−C4 hydrocarbons, as well as n-heptane, methylcyclohexane, n-nonane, and n-decane, consistent with the source profile of diesel vehicle exhaust [31]. It should be noted that all of the taxis in Wuhan use compressed natural gas (CNG) as fuel, which is mainly composed of ethane, propane, and butane. Hence, this factor was assigned as diesel and CNG exhaust. The third factor was associated with the chemical industry and solvent usage because of high percentages of toluene, ethylbenzene and xylene (TEX), C8−C9 AHs, and trichloroethene. According to previous studies, TEX and C8−C9 AHs are emitted from solvent usage processes [52,74], while styrene and trichloroethene are the tracers of industrial processes [31,42]. The final factor was distinguished by high levels of methyl chloride and 1,2-dichloroethane, which are associated with biomass burning, and coal combustion, respectively [75,76].

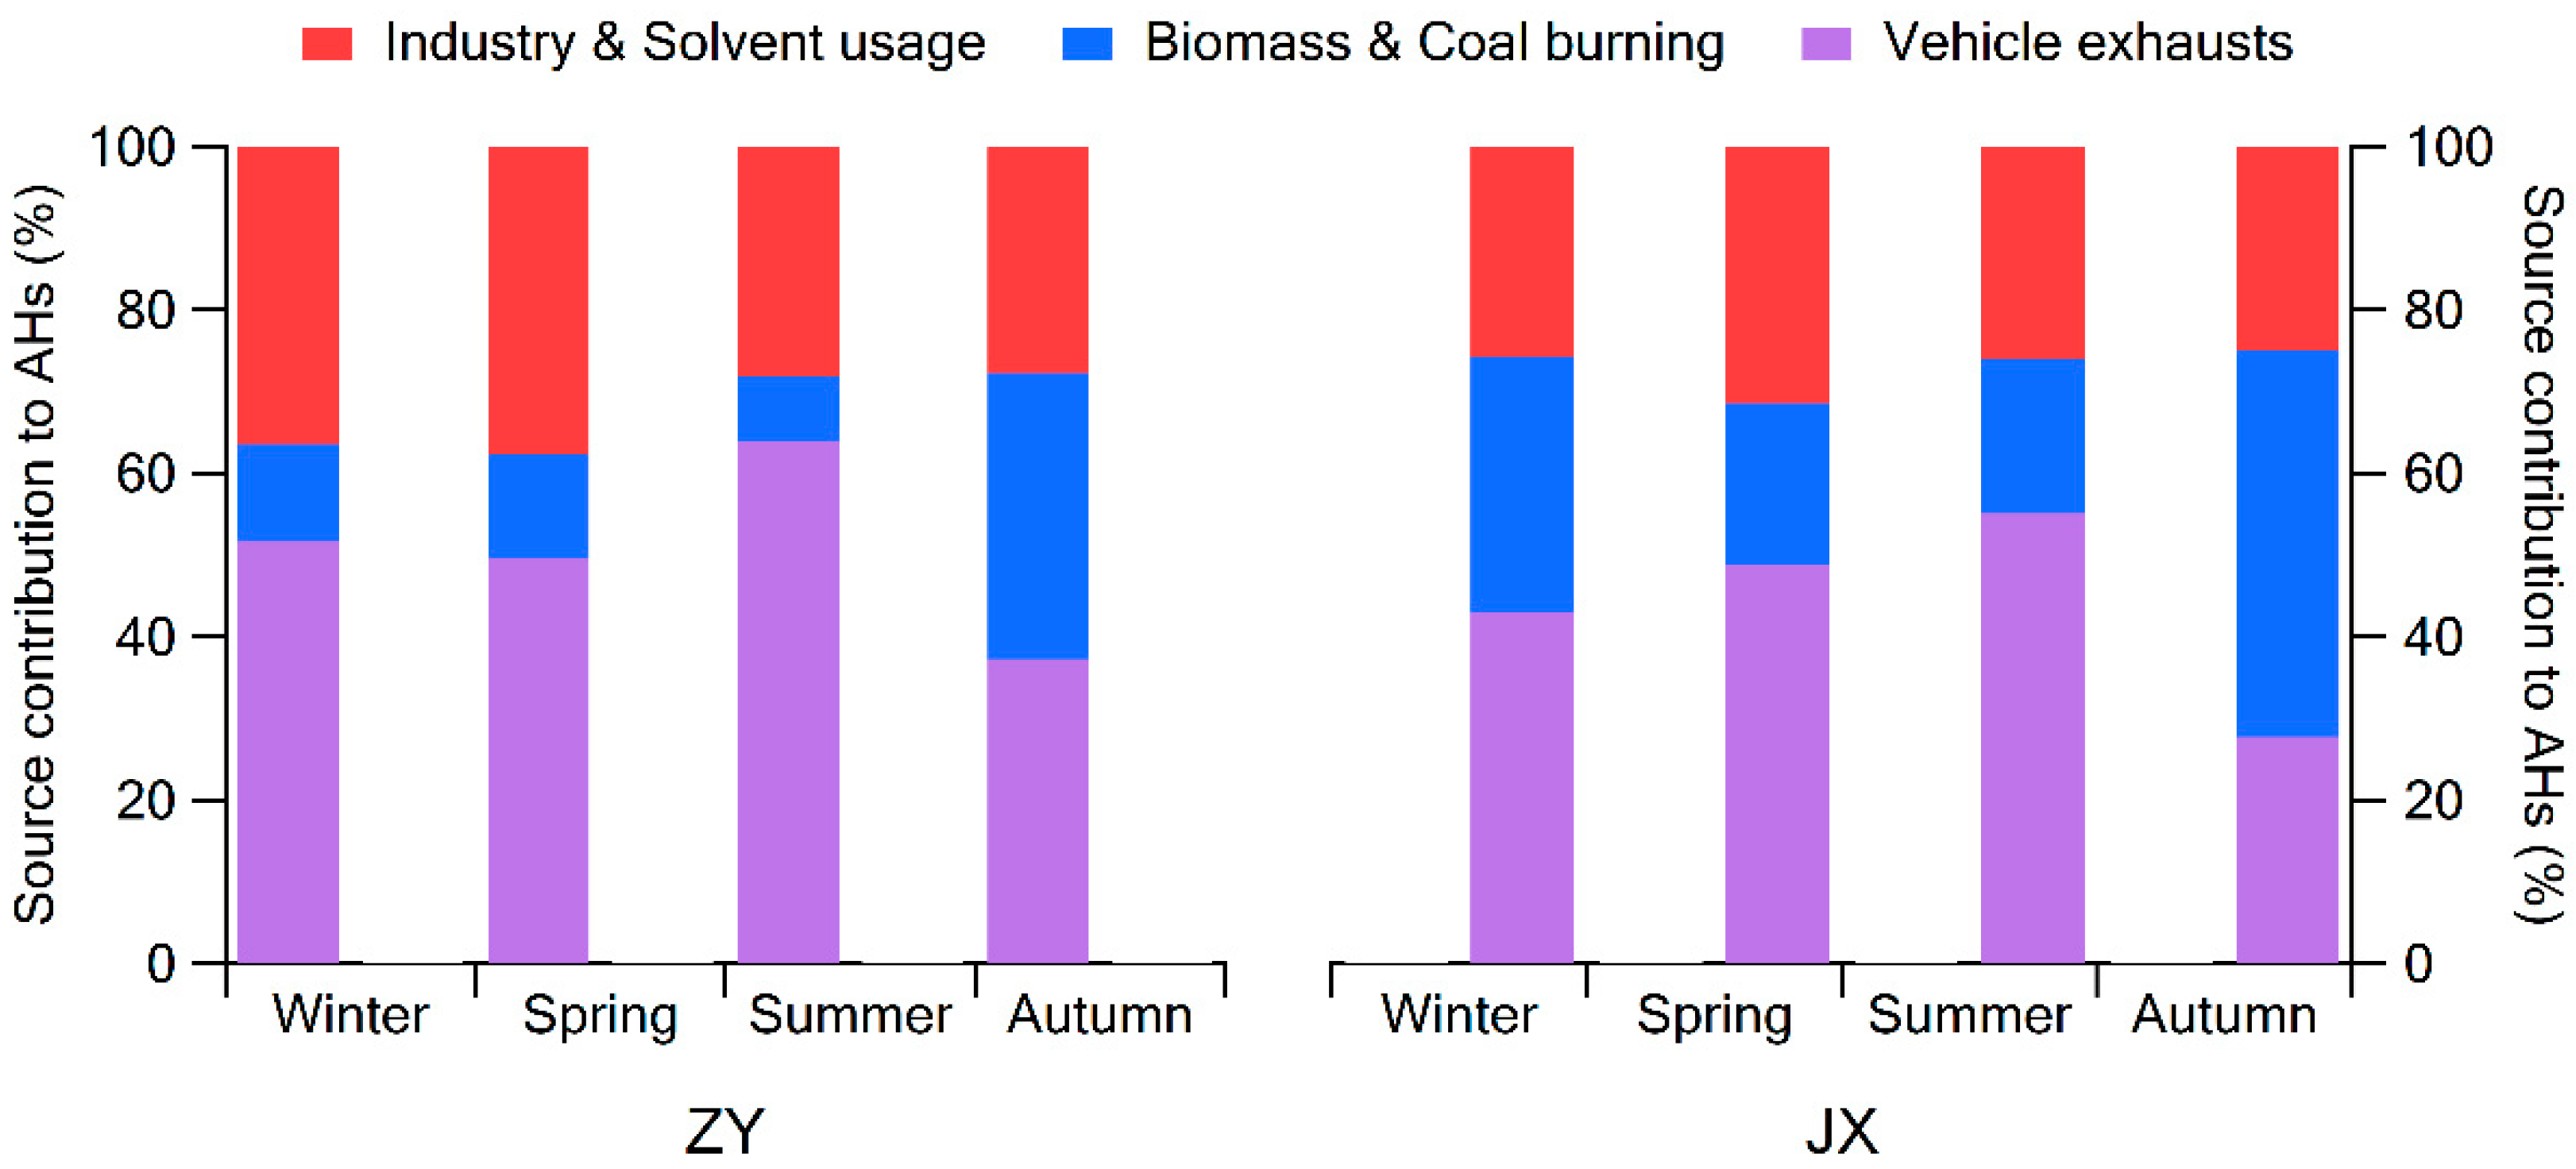
3.3.2. Source Contributions

The average contributions from different sources to the total AHs and the most abundant species, i.e., benzene and toluene, based on PMF model, are listed in Table 4. Notably, vehicle exhaust, including gasoline, diesel, and CNG exhaust, was the dominant source of AHs, with total contributions of 51.9 ± 13.1% and 44.7 ± 12.6% at ZY, and JX, respectively. These results were consistent with the data reported in previous studies for Wuhan [41,42]. The vehicle exhaust was also the dominant source of toluene at both sites, followed by industry and solvent usage, and biomass and coal burning. For benzene, vehicle exhaust made the greatest contribution at ZY (50.2 ± 15.5%), while biomass and coal burning emission dominated at JX (50.6 ± 16.7%). It is known that benzene is banned from use in industrial processes and has been replaced by toluene [35]. Hence, the emission of benzene from industry and solvent usage was much lower (p < 0.01) than that from biomass and coal burning at both sites, while industry and solvent usage made a large contribution to the toluene level (39.1 ± 11.0% at ZY, and 34.5 ± 8.2% at JX). In comparison, the contributions of vehicle exhaust, and industry and solvent usage to total AHs, benzene, and toluene were higher (p < 0.01) at ZY, compared to JX, while biomass and coal burning sources made a greater contribution (p < 0.01) to these compounds at JX. Therefore, reducing vehicle exhaust is of vital importance for the control of AHs in Wuhan, and emission of biomass and coal burning sources in suburban area should be given consideration. Compared with other regions in China, the contribution of vehicular exhaust to AHs in Wuhan was comparable to that in Guangzhou (44%) [35], and higher than that in Shanghai (23%) [38]. However, the industry contributions and solvent usage were much lower in Wuhan than in the PRD region (>35%) [35]. The contributions of biomass and coal burning sources in Wuhan were lower than those in northern China [29], and higher than those reported in Wanqingsha [35,47]. Nevertheless, the source contributions in different regions strongly depend on the local emission sources and the study period.
Seasonal variations of average source contributions to total AHs are shown in Figure 4. Vehicle exhaust made the largest contribution to AHs in winter, spring and summer at both sites, whereas biomass & coal burning dominated in autumn. Previous studies have also reported the prevalence of biomass burning (e.g., agricultural straw burning) in autumn and winter in China [77], specifically in autumn in Wuhan [43,78]. This was further confirmed by the concentrations of methyl chloride (Table S5). Higher concentrations of CH3Cl were observed in autumn at ZY, and in winter and autumn at JX. This is consistent with the results of the PMF model. Moreover, the contributions of industry and solvent usage were higher (p < 0.05) in winter and spring, than those in summer and autumn in ZY. Figure S2 presents the seasonal variations of source contributions to benzene and toluene. As shown in Figure S2a, at ZY site, vehicle exhaust was the dominant source of benzene in winter, spring, and summer, while biomass and coal burning made a greater contribution (p < 0.01) to benzene in autumn. However, at JX site, the contributions of biomass and coal burning were higher (p < 0.01) than the other sources in winter, spring, and autumn. For toluene (Figure S2b), vehicle exhaust was the dominant source in summer at both sites, while both industry and solvent usage, and vehicle exhaust, made similar contributions (p > 0.05) to toluene in winter and spring. The variations of source distributions in different sites and seasons can help local governments develop effective atmospheric pollution control strategies.

3.4. Health Risk Assessment

The exposure concentrations, non-carcinogenic hazards, and carcinogenic risks of AHs, at ZY and JX, were estimated (Table 5), based on the collected data. For the carcinogenic risk, the calculated RISK values of benzene at ZY (1.89 ± 1.41 × 10⁻⁶) and JX (1.97 ± 1.24 × 10⁻⁶) both exceeded the acceptable value for adults (1 × 10⁻⁶) [60]. Therefore, the potential carcinogenic risk, resulting from ambient benzene exposure, is a health concern for Wuhan residents. Vehicle exhaust was found to be the dominant source of benzene in Wuhan. According to the national standard in China, the permissible percentage (by volume) of benzene in gasoline fuel is 1%, while the content of benzene in diesel and CNG fuel has not been limited. Reducing vehicle emissions and improving the quality of fuel might contribute to the reduction of benzene in ambient air. Moreover, the emission control of biomass and coal burning sources should also be considered.
For non-carcinogenic risks, benzene had the highest HQ values (8.06 ± 7.78 × 10⁻³ at ZY and 8.42 ± 7.01 × 10⁻³ at JX), followed by m,p-xylene (1.87 ± 1.29 × 10⁻³ at ZY and 1.46 ± 0.75 × 10⁻³ at JX) and 1.3.5-trimethylbenzene (1.61 ± 0.23 × 10⁻³ at ZY and 1.55 ± 0.80 × 10⁻³ at JX). In addition, due to its relatively low toxicity, toluene had the lowest HQ values (0.09 ± 0.06 × 10⁻³ at ZY and 0.08 ± 0.05 × 10⁻³ at JX) despite its highest exposure concentrations at both sites (0.47 ± 0.32 μg m−3 at ZY and 0.40 ± 0.24 μg m−3 at JX). According to the risk limits of USEPA [60], a pollutant does not pose a significant non-carcinogenic risk if its HQ value is below 1. In this study, at sites ZY and JX, the calculated HQ values of individual AH species and HI values for the nervous system were much lower than the recommended limit. These results indicated that AHs at both sites did not pose a significant non-carcinogenic risk. It should be noted that only the non-carcinogenic risks of AHs were estimated in this study. If other hazardous pollutants in ambient air (such as chloro-hydrocarbons and oxygenated volatile organic compounds) are considered, the cumulative non-carcinogenic risks might be greater. Hence, the adverse effects of pollutants in ambient air on human health should still be considered in this area. Moreover, only one-year AHs concentrations were considered for the health risk assessment in this study. The long-term health effects of AHs in Wuhan still remain to be investigated.

4. Conclusions

In this study, the characteristics of ambient AHs and their effects on human health were investigated at an urban site (ZY) and a suburban (JX) site in Wuhan, Central China. The concentrations of total AHs were comparable at both sites, and reached the lowest levels in summer. Compared with other urban or suburban sites, the levels of AHs in Wuhan were relatively low. Based on the PMF results, vehicle exhaust (i.e., gasoline, diesel and CNG exhaust) made the largest contributions to AHs at both sites (51.9 ± 13.1% at ZY, and 44.7 ± 12.6% at JX), while the biomass and coal burning sources also made significant contributions to AHs at the suburban site. The dominant sources of benzene were vehicle exhaust and biomass and coal burning, while toluene was mainly released from vehicle exhaust, industry, and solvent usage. Biomass and coal burning sources made significant contributions to AHs in autumn at both sites. The health risk assessment found that the cancer risk in Wuhan, due to exposure to ambient benzene, exceeded the acceptable level set by the USEPA (1 × 10⁻⁶), suggesting that the health risk from benzene exposure was potentially high in Wuhan. The results of this study indicate that reducing vehicle exhaust emissions is vitally important for the control of AHs in Wuhan. Controlling biomass and coal burning sources should also be given attention in suburban areas, especially in autumn. Emission control of benzene could help to reduce the health risk for local residents. This study advances our understanding of the characteristics of AHs in Wuhan, Central China, which would be helpful for the study and control of AHs in other megacities.

Supplementary Materials

The following are available online at https://www.mdpi.com/2073-4433/10/10/565/s1, Text S1: Source implication, Text S2: Identification of factor number, Figure S1: Scatter plots of toluene to benzene ratio at ZY and JX, Figure S2: Source contributions to (a) benzene and (b) toluene in various seasons at ZY and JX, Table S1: Method detection limit (MDL), range (minimum-maximum), and average concentration ± SD of VOC species other than AHs at ZY and JX during the sampling period (Units: pptv), Table S2: Summary of error estimation results, Table S3: Seasonal mean values of meteorological parameters in Wuhan during the sampling period (mean ± 95% C.I.), Table S4: Atmospheric lifetime of BTEX with respect to reaction with hydroxyl radical (OH) [79], Table S5: Seasonal mean values of methyl chloride (CH3Cl) at ZY and JX during the sampling period (mean ± 95% C.I.).

Author Contributions

Study design, H.C.; sample collection, P.Z., L.Z. (Lingxi Zhan), Z.Y.; sample analysis, L.Z. (Lewei Zeng); data analysis, P.Z.; writing—original draft preparation, P.Z.; writing—review and editing, H.C., H.G., and X.L.; supervision, Z.W.; project administration, H.C. and Z.W.

Funding

This research was funded by the National Key R and D Program of China (No: 2017YFC0212603, 2016YFC0200905), Wuhan Youth Science and Technology Program (2017050304010310), and the Natural Science Foundation of China (NSFC) (No: 41673102).

Conflicts of Interest

The authors declare no conflict of interest.

References

  1. Lin, M.; Horowitz, L.W.; Payton, R.; Fiore, A.M.; Tonnesen, G. US surface ozone trends and extremes from 1980 to 2014: Quantifying the roles of rising Asian emissions, domestic controls, wildfires, and climate. Atmos. Chem. Phys. 2017, 17, 2943–2970. [Google Scholar] [CrossRef]
  2. Ghude, S.D.; Chate, D.M.; Jena, C.; Beig, G.; Kumar, R.; Barth, M.C.; Pfister, G.G.; Fadnavis, S.; Pithani, P. Premature mortality in India due to PM2.5 and ozone exposure. Geophys. Res. Lett. 2016, 43, 4650–4658. [Google Scholar] [CrossRef]
  3. Lelieveld, J.; Evans, J.S.; Fnais, M.; Giannadaki, D.; Pozzer, A. The contribution of outdoor air pollution sources to premature mortality on a global scale. Nature 2015, 525, 367–371. [Google Scholar] [CrossRef] [PubMed]
  4. Kassomenos, P.A.; Vardoulakis, S.; Chaloulakou, A.; Paschalidou, A.K.; Grivas, G.; Borge, R.; Lumbreras, J. Study of PM10 and PM2.5 levels in three European cities: Analysis of intra and inter urban variations. Atmos. Environ. 2014, 87, 153–163. [Google Scholar] [CrossRef]
  5. Verstraeten, W.W.; Neu, J.L.; Williams, J.E.; Bowman, K.W.; Worden, J.R.; Boersma, K.F. Rapid increases in tropospheric ozone production and export from China. Nat. Geosci. 2015, 8, 690–695. [Google Scholar] [CrossRef]
  6. Zhang, Y.L.; Cao, F. Fine particulate matter (PM2.5) in China at a city level. Sci. Rep. 2015, 5, 14884. [Google Scholar] [CrossRef] [PubMed]
  7. Wang, S.; Hao, J. Air quality management in China: Issues, challenges, and options. J. Environ. Sci. 2012, 24, 2–13. [Google Scholar] [CrossRef]
  8. Guo, H.; Ling, Z.H.; Cheng, H.R.; Simpson, I.; Lyu, X.P.; Wang, X.M.; Shao, M.; Lu, H.X.; Ayoko, G.; Zhang, Y.L.; et al. Tropospheric volatile organic compounds in China. Sci. Total Environ. 2017, 574, 1021–1043. [Google Scholar] [CrossRef]
  9. Li, J.; Wang, X.; Chen, J.; Zhu, C.; Li, W.; Li, C.; Liu, L.; Xu, C.; Wen, L.; Xue, L.; et al. Chemical composition and droplet size distribution of cloud at the summit of Mount Tai, China. Atmos. Chem. Phys. 2017, 17, 9885–9896. [Google Scholar] [CrossRef] [Green Version]
  10. Saukko, E.; Lambe, A.T.; Massoli, P.; Koop, T.; Wright, J.P.; Croasdale, D.R.; Pedernera, D.A.; Onasch, T.B.; Laaksonen, A.; Davidovits, P.; et al. Humidity-dependent phase state of SOA particles from biogenic and anthropogenic precursors. Atmos. Chem. Phys. 2012, 12, 7517–7529. [Google Scholar] [CrossRef] [Green Version]
  11. Garzón, J.P.; Huertas, J.I.; Magaña, M.; Huertas, M.E.; Cárdenas, B.; Watanabe, T.; Maeda, T.; Wakamatsu, S.; Blanco, S. Volatile organic compounds in the atmosphere of Mexico City. Atmos. Environ. 2015, 119, 415–429. [Google Scholar] [CrossRef] [Green Version]
  12. Lyu, X.P.; Liu, M.; Guo, H.; Ling, Z.H.; Wang, Y.; Louie, P.K.K.; Luk, C.W.Y. Spatiotemporal variation of ozone precursors and ozone formation in Hong Kong: Grid field measurement and modelling study. Sci. Total Environ. 2016, 569–570, 1341–1349. [Google Scholar] [CrossRef] [PubMed]
  13. Zhang, Q.; Yuan, B.; Shao, M.; Wang, X.; Lu, S.; Lu, K.; Wang, M.; Chen, L.; Chang, C.C.; Liu, S.C. Variations of ground-level O3 and its precursors in Beijing in summertime between 2005 and 2011. Atmos. Chem. Phys. 2014, 14, 6089–6101. [Google Scholar] [CrossRef]
  14. Ait-Helal, W.; Borbon, A.; Sauvage, S.; de Gouw, J.A.; Colomb, A.; Gros, V.; Freutel, F.; Crippa, M.; Afif, C.; Baltensperger, U.; et al. Volatile and intermediate volatility organic compounds in suburban Paris: variability, origin and importance for SOA formation. Atmos. Chem. Phys. 2014, 14, 10439–10464. [Google Scholar] [CrossRef] [Green Version]
  15. Yuan, B.; Hu, W.W.; Shao, M.; Wang, M.; Chen, W.T.; Lu, S.H.; Zeng, L.M.; Hu, M. VOC emissions, evolutions and contributions to SOA formation at a receptor site in eastern China. Atmos. Chem. Phys. 2013, 13, 8815–8832. [Google Scholar] [CrossRef] [Green Version]
  16. Li, J.; Xie, S.D.; Zeng, L.M.; Li, L.Y.; Li, Y.Q.; Wu, R.R. Characterization of ambient volatile organic compounds and their sources in Beijing, before, during, and after Asia-Pacific Economic Cooperation China 2014. Atmos. Chem. Phys. 2015, 15, 7945–7959. [Google Scholar] [CrossRef] [Green Version]
  17. Tuet, W.Y.; Chen, Y.; Xu, L.; Fok, S.; Gao, D.; Weber, R.J.; Ng, N.L. Chemical oxidative potential of secondary organic aerosol (SOA) generated from the photooxidation of biogenic and anthropogenic volatile organic compounds. Atmos. Chem. Phys. 2017, 17, 839–853. [Google Scholar] [CrossRef] [Green Version]
  18. Monks, P.S. Gas-phase radical chemistry in the troposphere. Chem. Soc. Rev. 2005, 34, 376. [Google Scholar] [CrossRef]
  19. Wei, W.; Wang, S.; Chatani, S.; Klimont, Z.; Cofala, J.; Hao, J. Emission and speciation of non-methane volatile organic compounds from anthropogenic sources in China. Atmos. Environ. 2008, 42, 4976–4988. [Google Scholar] [CrossRef]
  20. Wei, W.; Wang, S.; Hao, J.; Cheng, S. Trends of chemical speciation profiles of anthropogenic volatile organic compounds emissions in China, 2005–2020. Front. Environ. Sci. Eng. 2014, 8, 27–41. [Google Scholar] [CrossRef]
  21. Wei, W.; Wang, S.; Hao, J.; Cheng, S. Projection of anthropogenic volatile organic compounds (VOCs) emissions in China for the period 2010–2020. Atmos. Environ. 2011, 45, 6863–6871. [Google Scholar] [CrossRef]
  22. Zhu, Y.; Yang, L.; Chen, J.; Wang, X.; Xue, L.; Sui, X.; Wen, L.; Xu, C.; Yao, L.; Zhang, J.; et al. Characteristics of ambient volatile organic compounds and the influence of biomass burning at a rural site in Northern China during summer 2013. Atmos. Environ. 2016, 124, 156–165. [Google Scholar] [CrossRef]
  23. Tang, J.H.; Chan, L.Y.; Chan, C.Y.; Li, Y.S.; Chang, C.C.; Liu, S.C.; Wu, D.; Li, Y.D. Characteristics and diurnal variations of NMHCs at urban, suburban, and rural sites in the Pearl River Delta and a remote site in South China. Atmos. Environ. 2007, 41, 8620–8632. [Google Scholar] [CrossRef]
  24. Geng, F.; Zhao, C.; Tang, X.; Lu, G.; Tie, X. Analysis of ozone and VOCs measured in Shanghai: A case study. Atmos. Environ. 2007, 41, 989–1001. [Google Scholar] [CrossRef]
  25. Sun, J.; Wu, F.; Hu, B.; Tang, G.; Zhang, J.; Wang, Y. VOC characteristics, emissions and contributions to SOA formation during hazy episodes. Atmos. Environ. 2016, 141, 560–570. [Google Scholar] [CrossRef]
  26. Curtis, L.; Rea, W.; Smith-Willis, P.; Fenyves, E.; Pan, Y. Adverse health effects of outdoor air pollutants. Environ. Int. 2006, 32, 815–830. [Google Scholar] [CrossRef] [PubMed]
  27. Bolden, A.L.; Kwiatkowski, C.F.; Colborn, T. New look at BTEX: Are ambient levels a problem? Environ. Sci. Technol. 2015, 49, 5697–5703. [Google Scholar]
  28. Du, Z.; Mo, J.; Zhang, Y. Risk assessment of population inhalation exposure to volatile organic compounds and carbonyls in urban China. Environ. Int. 2014, 73, 33–45. [Google Scholar] [CrossRef]
  29. Zhang, Z.; Zhang, Y.; Wang, X.; Lü, S.; Huang, Z.; Huang, X.; Yang, W.; Wang, Y.; Zhang, Q. Spatiotemporal patterns and source implications of aromatic hydrocarbons at six rural sites across China’s developed coastal regions. J. Geophys. Res. Atmos. 2016, 121, 6669–6687. [Google Scholar] [CrossRef]
  30. Abeleira, A.; Pollack, I.B.; Sive, B.; Zhou, Y.; Fischer, E.V.; Farmer, D.K. Source characterization of volatile organic compounds in the Colorado Northern Front Range Metropolitan Area during spring and summer 2015. J. Geophys. Res. Atmos. 2017, 122, 3595–3613. [Google Scholar] [CrossRef]
  31. Liu, Y.; Shao, M.; Fu, L.; Lu, S.; Zeng, L.; Tang, D. Source profiles of volatile organic compounds (VOCs) measured in China: Part I. Atmos. Environ. 2008, 42, 6247–6260. [Google Scholar] [CrossRef]
  32. Kelly, J.M.; Doherty, R.M.; O’Connor, F.M.; Mann, G.W. The impact of biogenic, anthropogenic, and biomass burning volatile organic compound emissions on regional and seasonal variations in secondary organic aerosol. Atmos. Chem. Phys. 2018, 18, 7393–7422. [Google Scholar] [CrossRef] [Green Version]
  33. Leuchner, M.; Rappenglück, B. VOC source-receptor relationships in Houston during TexAQS-II. Atmos. Environ. 2010, 44, 4056–4067. [Google Scholar] [CrossRef]
  34. Liu, B.; Liang, D.; Yang, J.; Dai, Q.; Bi, X.; Feng, Y.; Yuan, J.; Xiao, Z.; Zhang, Y.; Xu, H. Characterization and source apportionment of volatile organic compounds based on 1-year of observational data in Tianjin, China. Environ. Pollut. 2016, 218, 757–769. [Google Scholar] [CrossRef] [PubMed]
  35. Zhang, Y.; Wang, X.; Barletta, B.; Simpson, I.J.; Blake, D.R.; Fu, X.; Zhang, Z.; He, Q.; Liu, T.; Zhao, X.; et al. Source attributions of hazardous aromatic hydrocarbons in urban, suburban and rural areas in the Pearl River Delta (PRD) region. J. Hazard. Mater. 2013, 250–251, 403–411. [Google Scholar] [CrossRef] [PubMed]
  36. Zhang, Y.; Mu, Y.; Liu, J.; Mellouki, A. Levels, sources and health risks of carbonyls and BTEX in the ambient air of Beijing, China. J. Environ. Sci. 2012, 24, 124–130. [Google Scholar] [CrossRef]
  37. Li, L.; Li, H.; Zhang, X.; Wang, L.; Xu, L.; Wang, X.; Yu, Y.; Zhang, Y.; Cao, G. Pollution characteristics and health risk assessment of benzene homologues in ambient air in the northeastern urban area of Beijing, China. J. Environ. Sci. (China) 2014, 26, 214–223. [Google Scholar] [CrossRef]
  38. Wang, H.; Wang, Q.; Chen, J.; Chen, C.; Huang, C.; Qiao, L.; Lou, S.; Lu, J. Do vehicular emissions dominate the source of C6-C8 aromatics in the megacity Shanghai of eastern China? J. Environ. Sci. 2015, 27, 290–297. [Google Scholar] [CrossRef]
  39. 2017 Report on the state of the Environment in Wuhan. Available online: http://hbj.wuhan.gov.cn/hbHjzkgb/29772.jhtml (accessed on 10 September 2019).
  40. Lu, X.; Chen, N.; Wang, Y.; Cao, W.; Zhu, B.; Yao, T.; Fung, J.C.H.; Lau, A.K.H. Radical budget and ozone chemistry during autumn in the atmosphere of an urban site in central China. J. Geophys. Res. 2017, 122, 3672–3685. [Google Scholar] [CrossRef]
  41. Lyu, X.P.; Chen, N.; Guo, H.; Zhang, W.H.; Wang, N.; Wang, Y.; Liu, M. Ambient volatile organic compounds and their effect on ozone production in Wuhan, central China. Sci. Total Environ. 2016, 541, 200–209. [Google Scholar] [CrossRef]
  42. Zeng, P.; Lyu, X.P.; Guo, H.; Cheng, H.R.; Jiang, F.; Pan, W.Z.; Wang, Z.W.; Liang, S.W.; Hu, Y.Q. Causes of ozone pollution in summer in Wuhan, Central China. Environ. Pollut. 2018, 241, 852–861. [Google Scholar] [CrossRef] [PubMed]
  43. Lyu, X.P.; Chen, N.; Guo, H.; Zeng, L.; Zhang, W.; Shen, F.; Quan, J.; Wang, N. Chemical characteristics and causes of airborne particulate pollution in warm seasons in Wuhan, central China. Atmos. Chem. Phys. 2016, 16, 10671–10687. [Google Scholar] [CrossRef] [Green Version]
  44. Weather Underground. Available online: https://www.wunderground.com/ (accessed on 10 September 2019).
  45. European Centre for Medium-Range Weather Forecasts. Available online: https://apps.ecmwf.int/datasets/data/interim-full-daily/levtype=sfc/ (accessed on 10 September 2019).
  46. Zeng, L.W.; Lyu, X.P.; Guo, H.; Zou, S.C.; Ling, Z.H. Photochemical Formation of C1–C5 Alkyl Nitrates in Suburban Hong Kong and over the South China Sea. Environ. Sci. Technol. 2018, 52, 5581–5589. [Google Scholar] [CrossRef] [PubMed]
  47. Zhang, Y.; Wang, X.; Blake, D.R.; Li, L.; Zhang, Z.; Wang, S.; Guo, H.; Lee, F.S.C.; Gao, B.; Chan, L.; et al. Aromatic hydrocarbons as ozone precursors before and after outbreak of the 2008 financial crisis in the Pearl River Delta region, south China. J. Geophys. Res. Atmos. 2012, 117, D15306. [Google Scholar] [CrossRef]
  48. Norris, G.; Duvall, R.; Brown, S.; Bai, S. EPA Positive Matrix Factorization (PMF) 5.0 Fundamentals and User Guide; 2014. [Google Scholar]
  49. Paatero, P. Least squares formulation of robust non-negative factor analysis. Chemom. Intell. Lab. Syst. 1997, 37, 23–35. [Google Scholar] [CrossRef]
  50. Belis, C.A.; Karagulian, F.; Amato, F.; Almeida, M.; Artaxo, P.; Beddows, D.C.S.; Bernardoni, V.; Bove, M.C.; Carbone, S.; Cesari, D.; et al. A new methodology to assess the performance and uncertainty of source apportionment models II: The results of two European intercomparison exercises. Atmos. Environ. 2015, 123, 240–250. [Google Scholar] [CrossRef]
  51. Cesari, D.; Donateo, A.; Conte, M.; Contini, D. Inter-comparison of source apportionment of PM10 using PMF and CMB in three sites nearby an industrial area in central Italy. Atmos. Res. 2016, 182, 282–293. [Google Scholar] [CrossRef]
  52. Mo, Z.; Shao, M.; Lu, S.; Niu, H.; Zhou, M.; Sun, J. Characterization of non-methane hydrocarbons and their sources in an industrialized coastal city, Yangtze River Delta, China. Sci. Total Environ. 2017, 593–594, 641–653. [Google Scholar] [CrossRef] [PubMed]
  53. Zhang, Y.; Wang, X.; Zhang, Z.; Lü, S.; Huang, Z.; Li, L. Sources of C2–C4 alkenes, the most important ozone nonmethane hydrocarbon precursors in the Pearl River Delta region. Sci. Total Environ. 2015, 502, 236–245. [Google Scholar] [CrossRef] [PubMed]
  54. Henry, R.C.; Lewis, C.W.; Hopke, P.K.; Williamson, H.J. Review of receptor model fundamentals. Atmos. Environ. 1984, 18, 1507–1515. [Google Scholar] [CrossRef]
  55. Yang, W.; Zhang, Y.; Wang, X.; Li, S.; Zhu, M.; Yu, Q.; Li, G.; Huang, Z.; Zhang, H.; Wu, Z.; et al. Volatile organic compounds at a rural site in Beijing: influence of temporary emission control and wintertime heating. Atmos. Chem. Phys. 2018, 18, 12663–12682. [Google Scholar] [CrossRef] [Green Version]
  56. Guo, H.; Ding, A.J.; Wang, T.; Simpson, I.J.; Blake, D.R.; Barletta, B.; Meinardi, S.; Rowland, F.S.; Saunders, S.M.; Fu, T.M.; et al. Source origins, modeled profiles, and apportionments of halogenated hydrocarbons in the greater Pearl River Delta region, southern China. J. Geophys. Res. Atmos. 2009, 114, 1–19. [Google Scholar] [CrossRef]
  57. Kampa, M.; Castanas, E. Human health effects of air pollution. Environ. Pollut. 2008, 151, 362–367. [Google Scholar] [CrossRef] [PubMed]
  58. Dai, H.; Jing, S.; Wang, H.; Ma, Y.; Li, L.; Song, W.; Kan, H. VOC characteristics and inhalation health risks in newly renovated residences in Shanghai, China. Sci. Total Environ. 2017, 577, 73–83. [Google Scholar] [CrossRef] [PubMed]
  59. Kanjanasiranont, N.; Prueksasit, T.; Morknoy, D.; Tunsaringkarn, T.; Sematong, S.; Siriwong, W.; Zapaung, K.; Rungsiyothin, A. Determination of ambient air concentrations and personal exposure risk levels of outdoor workers to carbonyl compounds and BTEX in the inner city of Bangkok, Thailand. Atmos. Pollut. Res. 2016, 7, 268–277. [Google Scholar] [CrossRef]
  60. U.S. EPA. Risk Assessment Guidance for Superfund Volume I: Human Health Evaluation Manual; 2009; Volume I, pp. 1–68.
  61. Zhao, X.; Duan, X. Highlights of the Chinese Exposure Factors Handbook (Adults); Chinese Environmental Science Press: Beijing, China, 2014. [Google Scholar]
  62. United States Environmental Protection Agency Integrated Risk Information System. Available online: https://www.epa.gov/iris (accessed on 10 September 2019).
  63. Miri, M.; Rostami Aghdam Shendi, M.; Ghaffari, H.R.; Ebrahimi Aval, H.; Ahmadi, E.; Taban, E.; Gholizadeh, A.; Yazdani Aval, M.; Mohammadi, A.; Azari, A. Investigation of outdoor BTEX: Concentration, variations, sources, spatial distribution, and risk assessment. Chemosphere 2016, 163, 601–609. [Google Scholar] [CrossRef] [PubMed]
  64. Ling, Z.H.; Guo, H.; Lam, S.H.M.; Saunders, S.M.; Wang, T. Atmospheric photochemical reactivity and ozone production at two sites in Hong Kong: Application of a Master Chemical Mechanism-photochemical box model. J. Geophys. Res. Atmos. 2014, 119, 10567–10582. [Google Scholar] [CrossRef]
  65. Baudic, A.; Gros, V.; Sauvage, S.; Locoge, N.; Sanchez, O.; Sarda-Estève, R.; Kalogridis, C.; Petit, J.-E.; Bonnaire, N.; Baisnée, D.; et al. Seasonal variability and source apportionment of volatile organic compounds (VOCs) in the Paris megacity (France). Atmos. Chem. Phys. 2016, 16, 11961–11989. [Google Scholar] [CrossRef] [Green Version]
  66. Seco, R.; Peñuelas, J.; Filella, I.; Llusia, J.; Schallhart, S.; Metzger, A.; Müller, M.; Hansel, A. Volatile organic compounds in the western Mediterranean basin: urban and rural winter measurements during the DAURE campaign. Atmos. Chem. Phys. 2013, 13, 4291–4306. [Google Scholar] [CrossRef] [Green Version]
  67. Wang, G.; Cheng, S.; Wei, W.; Zhou, Y.; Yao, S.; Zhang, H. Characteristics and source apportionment of VOCs in the suburban area of Beijing, China. Atmos. Pollut. Res. 2016, 7, 711–724. [Google Scholar] [CrossRef] [Green Version]
  68. Xia, L.; Cai, C.; Zhu, B.; An, J.; Li, Y.; Li, Y. Source apportionment of VOCs in a suburb of Nanjing, China, in autumn and winter. J. Atmos. Chem. 2014, 71, 175–193. [Google Scholar] [CrossRef]
  69. Jiang, Z.; Grosselin, B.; Daële, V.; Mellouki, A.; Mu, Y. Seasonal and diurnal variations of BTEX compounds in the semi-urban environment of Orleans, France. Sci. Total Environ. 2017, 574, 1659–1664. [Google Scholar] [CrossRef] [PubMed]
  70. Li, Z.; Xue, L.; Yang, X.; Zha, Q.; Jun, Y.; Yan, C.; Louie, P.K.K.; Luk, C.W.Y.; Wang, T.; Wang, W. Oxidizing capacity of the rural atmosphere in Hong Kong, Southern China. Sci. Total Environ. 2018, 612, 1114–1122. [Google Scholar] [CrossRef] [PubMed]
  71. Wang, T.; Xue, L.; Brimblecombe, P.; Lam, Y.F.; Li, L.; Zhang, L. Ozone pollution in China: A review of concentrations, meteorological influences, chemical precursors, and effects. Sci. Total Environ. 2016, 575, 1582–1596. [Google Scholar] [CrossRef] [PubMed]
  72. Zhang, Y.; Mu, Y.; Meng, F.; Li, H.; Wang, X.; Zhang, W.; Mellouki, A.; Gao, J.; Zhang, X.; Wang, S.; et al. The pollution levels of BTEX and carbonyls under haze and non-haze days in Beijing, China. Sci. Total Environ. 2014, 490, 391–396. [Google Scholar] [CrossRef] [PubMed]
  73. Zhang, Y.; Yang, W.; Simpson, I.; Huang, X.; Yu, J.; Huang, Z.; Wang, Z.; Zhang, Z.; Liu, D.; Huang, Z.; et al. Decadal changes in emissions of volatile organic compounds (VOCs) from on-road vehicles with intensified automobile pollution control: Case study in a busy urban tunnel in south China. Environ. Pollut. 2018, 233, 806–819. [Google Scholar] [CrossRef] [PubMed]
  74. Shao, P.; An, J.; Xin, J.; Wu, F.; Wang, J.; Ji, D.; Wang, Y. Source apportionment of VOCs and the contribution to photochemical ozone formation during summer in the typical industrial area in the Yangtze River Delta, China. Atmos. Res. 2016, 176–177, 64–74. [Google Scholar] [CrossRef]
  75. Barletta, B.; Meinardi, S.; Simpson, I.J.; Atlas, E.L.; Beyersdorf, A.J.; Baker, A.K.; Blake, N.J.; Yang, M.; Midyett, J.R.; Novak, B.J.; et al. Characterization of volatile organic compounds (VOCs) in Asian and north American pollution plumes during INTEX-B: identification of specific Chinese air mass tracers. Atmos. Chem. Phys. 2009, 9, 5371–5388. [Google Scholar] [CrossRef] [Green Version]
  76. Suthawaree, J.; Kato, S.; Okuzawa, K.; Kanaya, Y.; Pochanart, P.; Akimoto, H.; Wang, Z.; Kajii, Y. Measurements of volatile organic compounds in the middle of Central East China during Mount Tai Experiment 2006 (MTX2006): observation of regional background and impact of biomass burning. Atmos. Chem. Phys. 2010, 10, 1269–1285. [Google Scholar] [CrossRef] [Green Version]
  77. Chen, J.; Li, C.; Ristovski, Z.; Milic, A.; Gu, Y.; Islam, M.S.; Wang, S.; Hao, J.; Zhang, H.; He, C.; et al. A review of biomass burning: Emissions and impacts on air quality, health and climate in China. Sci. Total Environ. 2017, 579, 1000–1034. [Google Scholar] [CrossRef]
  78. Zhang, F.; Wang, Z.; Cheng, H.; Lyu, X.; Gong, W.; Wang, X.; Zhang, G. Seasonal variations and chemical characteristics of PM2.5 in Wuhan, central China. Sci. Total Environ. 2015, 518–519, 97–105. [Google Scholar] [CrossRef] [PubMed]
  79. Monod, A.; Sive, B.C.; Avino, P.; Chen, T.; Blake, D.R.; Sherwood Rowland, F. Monoaromatic compounds in ambient air of various cities: a focus on correlations between the xylenes and ethylbenzene. Atmos. Environ. 2001, 35, 135–149. [Google Scholar] [CrossRef] [Green Version]
Figure 1. Sampling sites and surrounding environments.
Atmosphere 10 00565 g001
Figure 2. Seasonal variations (average mixing ratios for different seasons) of aromatic hydrocarbons (AHs) at (a) Ziyang (ZY) and (b) Jiangxia (JX) in Wuhan. Error bars represent SD. N = 15, 14, 18, 19 for winter, spring, summer and autumn at ZY, and n = 15, 16, 17, 19 for winter, spring, summer and autumn at JX, N = number of samples.
Atmosphere 10 00565 g002
Figure 3. Positive Matrix Factorization (PMF)-extracted source profiles of volatile organic compounds (VOCs) in Wuhan during the sampling period.
Atmosphere 10 00565 g003
Figure 4. Average source contributions to total AHs in various seasons at ZY and JX.
Atmosphere 10 00565 g004
Table 1. Variable risk factors for health risk assessment.
VariableDescriptionUnitValue
CA *Concentration in airμg m−3
EF *Exposure frequencydays year−1365
ED *Exposure durationyears74.8
ET *Explosion timehours day−13.7
AT *Average timehours74.8 × 365 × 24
RfC **Reference Concentration for Inhalation Exposuremg m−33 × 10−2 for benzene
5 for toluene
1 for ethylbenzene
1 × 10⁻¹ for xylenes
1 for styrene
6 × 10⁻² for 1,2,3-trimethylbenzene
6 × 10⁻² for 1,2,4-trimethylbenzene
1 × 10⁻² for 1,3,5-trimethylbenzene
IUR **Inhalation Unit Risk(μg m−3)−17.8 × 10⁻⁶ for benzene
* The values were obtained from the Exposure factors handbook of Chinese population (adult) [61]. ** The values were obtained from the USEPA Integrated Risk Information System [62].
Table 2. Method detection limit (MDL), range (minimum-maximum), and average concentration ± SD of aromatic hydrocarbons (AHs) at Ziyang (ZY) and Jiangxia (JX) during the sampling period (Units: pptv).
SpeciesMDLZY (N = 66) *JX (N = 67) *
RangeMean ± SDRangeMean ± SD
Benzene14115–2207450 ± 485109–1678515 ± 385
Toluene9127–2880738 ± 508133–1712674 ± 380
Ethylbenzene647–777262 ± 26048–1390276 ± 260
m/p-Xylene9109–1688255 ± 20271–514215 ± 102
o-Xylene429–38096 ± 7219–289110 ± 66
Styrene3038–25280 ± 6032–25178 ± 50
i-Propylbenzene47–3815 ± 86–3014 ± 8
n-Propylbenzene416–4724 ± 916–3925 ± 8
m-Ethyltoluene321–13737 ± 2022–7336 ± 13
p-Ethyltoluene315–4724 ± 817–4125 ± 14
o-Ethyltoluene310–5722 ± 812–4624 ± 8
1,2,3-Trimethylbenzene514–5625 ± 916–5727 ± 9
1,2,4-Trimethylbenzene67–20744 ± 366–12649 ± 30
1,3,5-Trimethylbenzene310–6320 ± 1211–4220 ± 8
Σ AHs 728–63362048 ± 1364522–41122023 ± 1015
* N = number of samples.
Table 3. Comparison of concentrations of benzene, toluene, ethylbenzene, and xylene (BTEX) measured in this study and previous studies (Units: pptv).
SiteSampling PeriodBenzeneTolueneEthylbenzeneM/P-XyleneO-XyleneBTEX
Urban Sites
Ziyang *Feb.–Nov. 2017450 ± 485738 ± 508262 ± 260255 ± 20296 ± 721801 ± 1373
Guangzhou, China [35]Nov.–Dec. 2009264246447865182268816
Beijing, China [16]Nov. 2014162324167877335076066
Hong Kong [64]Sept.–Nov. 201073921875855952044310
Paris, France [65]Jan.–Nov. 2010301800582 **1683
Ottawa, Canada [66]Oct. 200840717582124 **8576
Suburban Sites
Jiangxia *Feb.– Nov. 2017515 ± 385674 ± 380276 ± 260215 ± 102110 ± 671790 ± 1210
Guangzhou, China [35]Nov.–Dec. 2009191929655724021736031
Beijing, China [67]Sept. 20148609233662741902649
Nanjing, China [68]Sep. 2011–Feb. 20122680167010108002506410
Orleans, France [69]Oct. 2010–Jul. 2011256263316923642
Colorado, U.S. [30]Mar. 20152003003030560
* mean ± SD; ** sum of xylene and ethylbenzene.
Table 4. Average source contributions to total AHs, benzene and toluene at Ziyang (ZY) and Jiangxia (JX). (mean ± SD)
SourceAHs (%)Benzene (%)Toluene (%)
ZYJXZYJXZYJX
Gasoline exhaust35.4 ± 12.531.0 ± 12.518.5 ± 11.215.1 ± 1.533.6 ± 7.128.9 ± 8.0
Diesel & CNG exhaust16.5 ± 11.113.7 ± 6.331.7 ± 11.325.0 ± 1.815.7 ± 8.914.4 ± 8.3
(Vehicle exhaust)51.9 ± 13.144.7 ± 12.650.2 ± 15.540.1 ± 12.949.3 ± 8.943.2 ± 10.2
Industry & Solvent usage32.0 ± 8.726.5 ± 8.512.4 ± 6.59.3 ± 7.939.1 ± 11.034.5 ± 8.2
Biomass & Coal burning16.1 ± 13.228.9 ± 12.937.4 ± 16.350.6 ± 16.711.6 ± 8.222.3 ± 10.4
Table 5. Exposure concentration, non-carcinogenic risk and carcinogenic risk of BTEX at ZY (N = 66) and JX (N = 67), N = number of samples.
SiteSpeciesRfC
(mg m−3)
Exposure Concentration
(μg m−3)
Hazard Quotient (HQ) (×10−3)Cancer Risk (RISK) (×10−6)
Mean ± SDMean ± SDMean ± SD
ZYBenzene3 × 10−20.24 ± 0.208.06 ± 7.781.89 ± 1.41
Toluene50.47 ± 0.320.09 ± 0.06
Ethylbenzene10.19 ± 0.140.19 ± 0.15
m/p-Xylene1 × 10−10.19 ± 0.161.87 ± 1.29
o-Xylene1 × 10−10.07 ± 0.050.71 ± 0.49
Styrene 10.06 ± 0.040.06 ± 0.04
1,2,3-Trimethylbenzene 6 × 10−20.02 ± 0.010.35 ± 0.12
1,2,4-Trimethylbenzene 6 × 10−20.04 ± 0.030.60 ± 0.50
1,3,5-Trimethylbenzene 1 × 10−20.02 ± 0.011.61 ± 0.23
Hazard index (HI) (for Nervous) 5.20 ± 3.43
JXBenzene3 × 10−20.25 ± 0.218.42 ± 7.011.97 ± 1.24
Toluene50.40 ± 0.240.08 ± 0.05
Ethylbenzene10.18 ± 0.180.18 ± 0.16
m/p-Xylene1 × 10−10.15 ± 0.071.46 ± 0.75
o-Xylene1 × 10−10.07 ± 0.050.71 ± 0.48
Styrene10.05 ± 0.040.05 ± 0.03
1,2,3-Trimethylbenzene6 × 10−20.02 ± 0.010.35 ± 0.11
1,2,4-Trimethylbenzene6 × 10−20.04 ± 0.030.60 ± 0.44
1,3,5-Trimethylbenzene1 × 10−20.02 ± 0.011.55 ± 0.80
Hazard index (HI) (for Nervous) 4.68 ± 2.38

