Article

Comprehensive Characteristics of Summer Deep Convection over Tibetan Plateau and Its South Slope from the Global Precipitation Measurement Core Observatory

School of Atmospheric Sciences, Chengdu University of Information Technology and Plateau Atmosphere and Environment Key Laboratory of Sichuan Province, Chengdu 610225, China
*
Author to whom correspondence should be addressed.
Atmosphere 2019, 10(1), 9; https://doi.org/10.3390/atmos10010009
Submission received: 4 September 2018 / Revised: 10 December 2018 / Accepted: 27 December 2018 / Published: 2 January 2019
(This article belongs to the Section Meteorology)

Abstract

:
Observational data from the Global Precipitation Measurement (GPM) Core Observatory during four summers (2014–2017) has been used to investigate deep convection systems (DCSs) over the Tibetan Plateau (TP) and its south slope (SS). The frequency, geographical distribution diurnal variation, and vertical structure of DCSs over the TP and SS are compared among these two regions. The frequency of DCSs over the SS (0.98%) was far higher than over the TP (0.15%), suggesting that stronger DCSs occur to the east and south of the TP. The maximum number of DCS occurred in July and August. A clear diurnal variation in DCS was found over the whole region, DCSs over the TP and SS both have a greatest amplitude in the afternoon. The probability of DCSs from 1200 to 1800 local time (LT) was 76.3% and 44.1% over TP and SS respectively, whereas the probability of DCSs being generated from 2200 (LT) to 0600 on the next day LT was 0.03% and 33.1% over the TP and SS respectively. There was a very low frequency of DCSs over the TP during the night. Five special echo top heights were used to investigate the vertical structure of DCSs. DCSs over the TP were both weaker and smaller than those over the SS.

1. Introduction

Deep convection systems (DCSs) have an important influence on the global hydrological cycle and energy exchange [1,2], and play a key part in stratosphere-troposphere exchange (STE) [3,4]. The Tibetan Plateau (TP) and the southern foothills of the Himalayas, are important areas for the generation of DCSs during the boreal summer, and make a significant contribution to global climate change [5,6,7,8,9,10].
The Tibetan Plateau, with a mean elevation of >4000 m, is referred to as “the world’s water tower” and has a significant influence on global water sustainability [11,12,13]. The Tibetan Plateau acts as an elevated heat source or sink for the general circulation of the atmosphere and causes both mechanical and thermodynamic forcing [14,15,16,17,18,19,20]. The unique topographic features of TP, together with South Asian monsoon, lead to the frequent generation of DCSs in this region. Fu et al. [21] suggested that water vapor and CO are transported into the global stratospheric circulation through the rapid uplift of DCSs and large-scale anticyclonic circulation over the Tibetan Plateau and its southern slope. An abnormally high value of water vapor, CO, CH4, HCN has been reported in the upper troposphere and lower stratosphere above the TP [22,23,24,25,26]. This transport of materials from the troposphere causes large changes in the composition of the stratosphere, and produces a different kind of forcing of the global climate [17,26]. This contribution to stratosphere water vapor shows an increasing trend over the TP, which may increase the global greenhouse effect and decrease the amount of ozone over the Arctic region [27,28,29].
The characteristics and frequency of deep convection are still not well understood, although their importance in stratosphere-troposphere exchange is acknowledged. The frequency and cloud-top height of DCSs in a region determine their influence on the atmospheric composition of the upper troposphere and lower stratosphere. It is beneficial to further estimate the contribution of deep convection to increased stratosphere water vapor and aerosols in climate models [23,30]. However, DCSs with cloud-top heights > 14 km and with a maximum echo value > 39 dBZ are rare and generally only last for a few hours from generation to dissipation [31,32]. These features mean that DCSs are difficult to detect, especially over the TP and SS.
Currently, satellite datasets are generally used to investigate the features of DCSs. Previous studies [7,8,9,10,33,34,35,36,37] have used the Tropical Rainfall Measuring Mission (TRMM) precipitation radar (PR) datasets to analyze the distribution of DCSs over tropical oceans, the South Asian monsoon region, and the part of the Tibetan Plateau. However, the TRMM PR datasets have a restricted range, and not all of the TP is monitored. Luo et al. [38] used the CloudSat-CALIPSO datasets to show that the DCSs over the TP have a lower frequency, shallower structure and smaller horizontal scale than DCSs over the SS and the South Asian monsoon region. However, the CloudSat-CALIPSO datasets only provide two observations each day (at about 1330 and 0130 local time), and there is no integral diurnal cycle for DCSs [39,40,41,42,43]. Based on the success of TRMM, the Global Precipitation Measurement (GPM) Core Observatory was launched by Nation Aeronautics and Space Administration (USA) and Japan Aerospace Exploration Agency (Japan) at the end of February 2014. The GPM Core Observatory has the advantages of TRMM PR and enhances the accuracy estimating precipitation [44]. It also provides a larger range of observations (68° N/S compared with the TRMM coverage of 37° N/S). These features will be helpful for research of deep convection at global scales [45].
This paper analyzed the deep convection generated over TP and its southern slope (located at 25°–40° N, 73°–105° E; Figure 1). As a result of the large differences in topography, thermodynamics, and dynamics between TP and its southern slope, the DCSs may be different in these two regions. The TP and SS are an important area for the generation of the DCSs, but the frequency of DCSs in each region is unclear. This paper is organized as follows: The dataset and methods are introduced in Section 2. Section 3 presents a quantitative method of determining the frequency DCSs over the TP and SS, and discusses the spatiotemporal distribution, diurnal variation and vertical structure of DCSs. Further discussions and our conclusions are presented in Section 4.

2. Data and Methods

2.1. Data

This paper used data from four summers (2014–2017), excluding June 2014, from the GPM Combined Level-2 product (Level-2 DPR (Dual-Frequency Precipitation Radar) and GMI (GPM Microwave Imager) Combined, available at https://storm.pps.eosdis.nasa.gov/storm/). Over the TP and surrounding areas, convective storms mainly occur during summer months, summer precipitation accounts for 60–90% of the total annual precipitation [46,47,48]. The data from June 2014 haven’t been adopted because a number of modifications were made to the dual-frequency precipitation radar (DPR) equipment during the early GPM mission (prior to June 2014), which affected the quality of the data (more details of datasets in https://storm.pps.eosdis.nasa.gov/storm/).
The GPM Core Observatory DPR system covers both the Ku and Ka bands, operated at 13 and 35 GHz, respectively. However, there is currently no mature method based on the Ka band, so we used only the Ku band in this work. The Ku band is also carried by the TRMM, and has been used previously to analyze deep convection over tropical oceans, the South Asian monsoon region, and the Tibetan Plateau [7,8,9,10,33,34,36,37]. The Ku band of the GPM DPR has also been used to study the global distribution of deep convection [45]. The Ku band data has a lowest detectable reflectivity of 13 dBZ, a horizontal resolution of about 5 km and a vertical resolution of 250 m.

2.2. Methods

The method defining the DCSs was similar with previous research [7,8,9,33,34] and involves the following steps.
  • For every pixel with the precipitation echo, the maximum corrected reflective factor (MaxCRF) in the radar beam must exceed the threshold of 39 dBZ. The threshold value of 39 dBZ means that the intensity of precipitation is sufficient to distinguish the non-convection precipitation pixels [49].
  • The maximum height of the 20 dBZ radar echo (Maxht20) of the convection precipitation pixel must exceed 14 km. 14 km is usually regarded as the base of the tropopause layer [50]. If the convective cloud top exceeds this height, then the convection will affect the upper troposphere and the lower stratosphere. The convection pixel satisfying the above criteria is defined as a deep convection pixel.
  • Adjacent deep convection pixels in the same track are regarded as a DCS. The maximum value of Maxht20 among these pixels is used to represent the intensity and location of the DCS.
GPM datasets divide precipitation pixels into three types: convection, stratiform, and “other” type (i.e., only clouds or possibly noise is represented when the radar echo is examined along the radar beam). The statistical results for the GPM datasets (Table 1), show that the percentage of convection pixels is low (8.41%) over the TP, whereas the percentage of stratiform pixels is unusually high (82.11%). The ratio of convective precipitation is equal to the number of convection pixels divided by the total number of pixels, the same method is used to calculate the ratio of stratiform precipitation. By contrast, the results of Yeh [51] and the Tibetan Plateau Meteorological Experiment (TIPEX) [52] both showed that cumulus clouds were the most common cloud type over the central, eastern and southern regions of TP during the summer.
Figure 2 shows the contoured frequency by altitude diagrams (CFADs) for the convection and stratiform precipitating echoes of the GPM datasets. CFADs are used to analyze the height variation in radar reflectivity data, which can be used to determine the structure and microphysical processes of precipitation cloud systems [53]. The CFADs indicate that the frequency that the cloud top reaches 11 km is same for stratiform and convection systems, and the frequency of precipitation echoes bottom height is same too. This suggests that the echoes of stratiform precipitation are likely to mix with the echoes of convective precipitation and stratiform pixels. GPM datasets over the TP may be misidentified.
Fu and Liu [54] showed levels of misidentification in an earlier study using TRMM PR data over the Tibetan Plateau, with nearly 70% of the rain pixels over the central Tibetan Plateau in summer classified as stratiform in the TRMM PR 2A25 dataset. Fu and Liu [54] suggested that this misidentification may be because the freezing level is close to the surface of the plateau, and therefore ground echoes may be mistakenly identified as the melting level in the TRMM PR rain classification algorithm. The recognition of precipitation type by the dual-frequency algorithm of the GPM DPR, is also dependent on the detection of the melting layer, or the appearance of a bright band [49]. This means that the same misidentification error could occur in the GPM datasets. We therefore used the methods of Fu and Liu [54] and Fu et al. [55] to correct for the convective precipitation.
The re-identified standard is as follows: for a precipitation pixel, if the rain top height, which means the max height of the precipitation radar echo value, is higher than 7.5 km above sea level, then this pixel will be considered as convection pixel. Previous researches suggested that 7.5 km is a special height of atmosphere stratification over TP, air is mixed up to 8 km above sea level due to strong surface heating over the TP, the lapse rate of the dew point remains around 2 °C under 7.5 km above sea level, and the slope of the precipitation profile will change near the 7.5 km height above sea level [56,57]. Therefore, the 7.5 km is used as the divided standard of convection pixels over TP.
Figure 3 shows the CFADs of the re-identified convective and stratiform echoes. The CFADs of the corrected echoes show a clear difference in the echoes of convective and stratiform precipitation. The frequency of echoes bottom of stratiform precipitation is clearly lower and the central frequency of the stratiform echoes is concentrated at 6–7 km. The frequency of the corrected convection echoes tilts toward the right with altitude. This result is consistent with Fu et al. [55].

3. Results

3.1. Frequency of DCSs

The ratio of convective precipitation over the TP changed from 8.41% to 65.43% after applying the method to re-identify the precipitation type (Table 2). This paper transformed the location of the pixels into grid points with a resolution of 0.5° × 0.5° to show the distribution of convective precipitation over the TP and SS. Figure 4 shows the distribution of percent of convective precipitation before and after re-identification. The highest value of percent of convective precipitation in the uncorrected data is <20%, and most region is <10% (Figure 4a). Figure 4b shows the percent of convection precipitation is almost >50% in the corrected data. This value in the central region is >70%. These corrected results are in agreement with the results of previous studies [55,58,59].
The GPM Core Observatory captured >700,000 precipitation pixels. The frequency of deep convection pixels (equal to the number of deep convection pixels divided by the number of corrected convection pixels) over the TP and SS is 0.4% (Table 2). Although the ratio and total number of convection pixels over the TP (65.43%) are higher than over the SS (24.32%), the ratio of deep convection pixels over the TP (0.15%) is much lower than the ratio of 0.98% over the SS. This result shows that the south of the Himalaya is easier to produce deep convection. Liu and Zipser [7] reported that the frequency of deep convection above 14 km was highest (0.6–0.8% of pixels) in west Africa and the west Pacific Ocean based on TRMM satellite data. Previous results have shown that the frequency of convective precipitation over the TP is high, the majority of the convection is both shallow and weak. The mean intensity of convective precipitation over the TP is only 1.13 mm h−1, whereas it reached 4.19 mm h−1 over the SS. The mean intensity of deep convection precipitation is similar over the TP (21.21 mm h−1) and SS (22.05 mm h−1) (Table 2).
The total number of DCSs during summer months from 2014 to 2017 was 216, with 136 DCSs over the SS and 80 DCSs over the TP. This number is lower than the actual number of DCSs generated over the TP and SS. The GPM Core Observatory satellite is unable to scan all the DCSs in this region due to its narrow orbit and low temporal resolution. Figure 5 shows the frequency of DCSs varied with the value of Maxht20. In general, the number of DCSs over the SS is higher than the number over the TP, and the frequency of DCSs > 15 km over the SS is higher than that over the TP. That suggests that the mean intensity of DCSs over the SS is stronger.
The higher frequency and intensity of DCSs over the SS may be related to the differences in atmospheric conditions. Luo et al. [38] reported that the TP has a significantly lower level of neutral buoyancy, smaller convective available potential energy, and a much drier atmosphere than the SS. The warm, wet flow from the Bay of Bengal is blocked by the barrier effect of the Himalaya and the TP, and flows around this region, providing a convergence field that favors the generation of DCSs.

3.2. Spatial Distribution of DCSs

Figure 6a shows the spatial distribution of the DCSs recorded by the GPM Core Observatory. Each dot represents a DCS event and the color of the dot represents the height of Maxht20. The darker colors show a stronger development of deep convection. The DCSs are broadly distributed in the central eastern region of TP and the south of the Himalayas. The DCSs over the SS are clearly more intense than those over the TP. Figure 6a is divided into four pictures (Figure 6b–e) according to the value of Maxht20. That’s in order to show the details of DCSs of different strength. The distribution of DCSs below 17 km is similar, but the DCSs above 17 km only exist to the east and south of the TP. The pathway of the STE over the TP and SS is of two types: (1) the large-scale anticyclonic circulation of the South Asian High, which slowly transports into the stratosphere [30,60]; and (2) deep convection, which rapidly injects air into the stratosphere [23,61,62]. Based on the distribution of DCSs above 16 and 17 km, the direct injection effect of DCSs is concentrated in the central and eastern areas of the TP and SS.
Figure 7 shows the intra-seasonal distribution during the summer months. In June, the DCSs are only located in the east of the TP and SS and have a lower frequency. The majority of DCSs occur in July-August. This change is closely related to the onset and decline of the South Asian summer monsoon, which usually starts in June and strengthens during July and August.

3.3. Diurnal Variation in DCSs

Figure 8 shows that the DCSs over the TP and SS have a clear diurnal variation, which is significantly different from that over the oceans [63]. Most of the DCSs are generated in the afternoon (local time, UTC +06:00) and have a peak at 1500 and 1600 h. Figure 8a shows that DCSs rarely occur over the TP during the night, that’s consistent with previous reports [64,65]. The percent of DCSs over TP in the afternoon is also higher than that over the SS (Figure 8b). The intensity of DCSs precipitation over the SS in the afternoon is lower than that over the TP (Figure 8c). Figure 9 combines the temporal and spatial distribution of the DCSs and shows that the DCSs over the TP are concentrated in the afternoon and in the east of the plateau. The DCSs over the SS are dispersed and are concentrated on the west of the SS.
The DCSs are more concentrated in the afternoon period over both regions, which is related to the destabilization of the afternoon boundary layer as a result of daytime insolation. The differential radiative heating of the underlying surface produces a daily variation in the horizontal convergence field, which triggers the convection [63,66,67,68]. Houze et al. [33] indicated that the nocturnal low-level jet of moist air of the south of Himalayas favors the formation and maintenance of nocturnal convection. The TP experiences intense longwave cooling due to its high elevation, which leads to a strong divergence wind at the surface of plateau. The nocturnal downslope wind from the TP converges with the low-level moist monsoon flow from the Bay of Bengal, triggering nighttime convection over the SS [33,38,69,70].

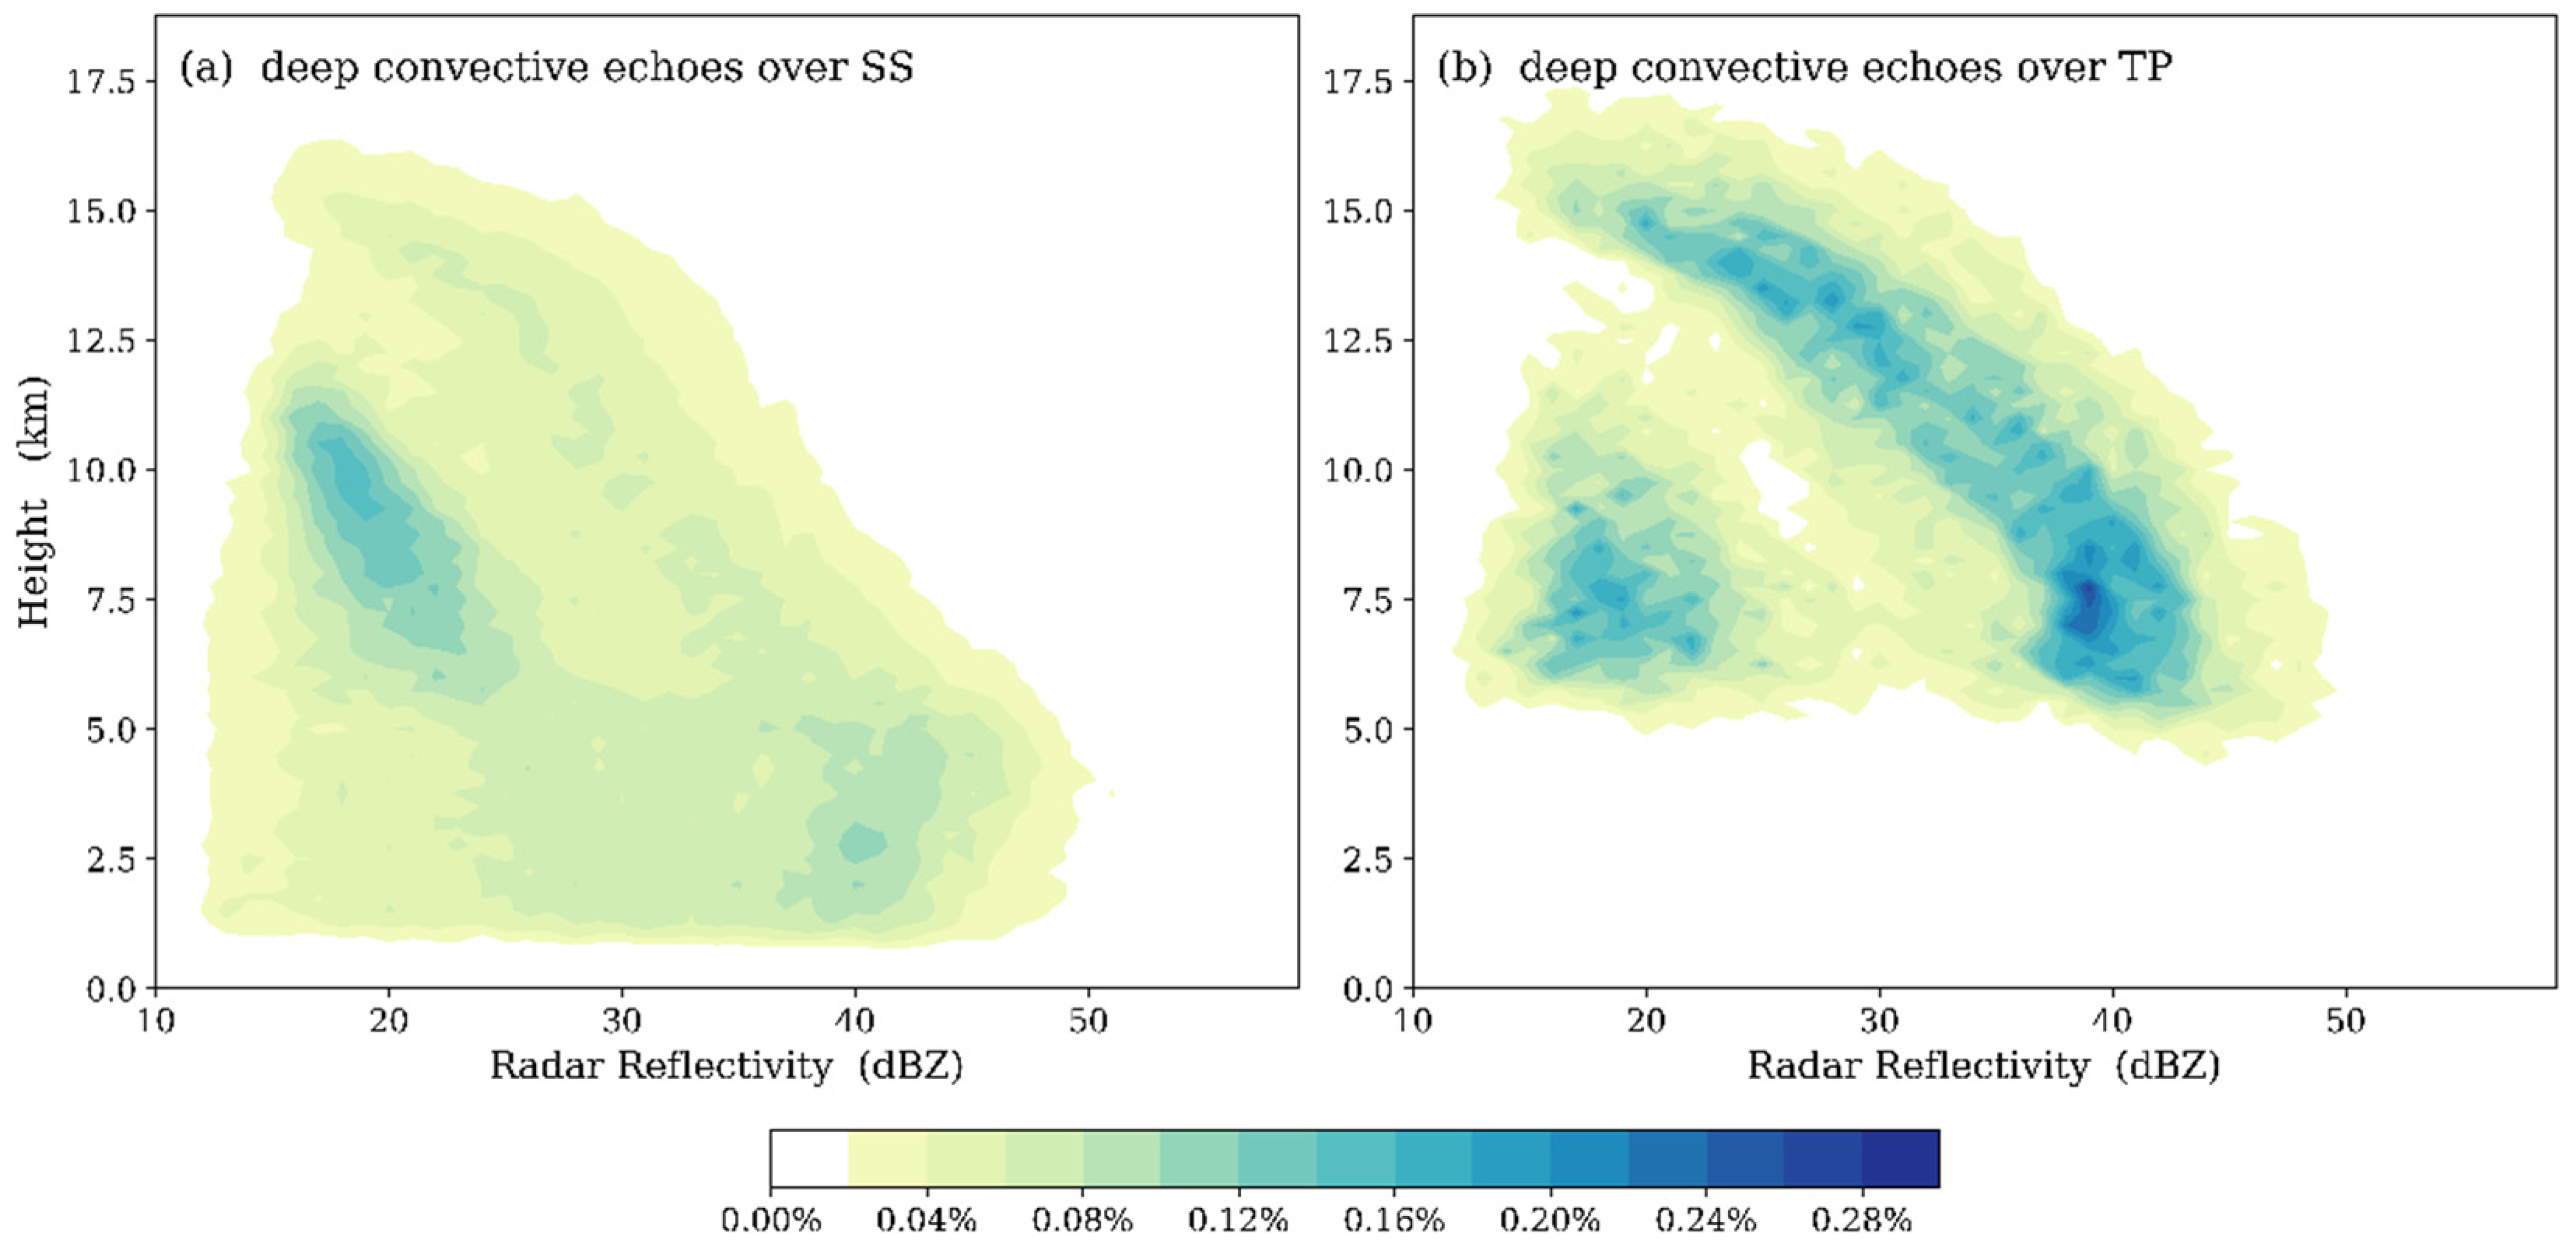
3.4. Vertical Structure of DCSs

Figure 10 shows the CFADs of deep convection echoes. The echoes over the TP and SS are centralized on two parts. One part is centralized on 20 dBZ and 10 km over SS, but 20 dBZ and 7.5 km over TP. Another part is on 40 dBZ at the bottom and lilted with height over the TP and SS.
Five specific radar echo values were used to determine the convective structure over the TP and SS. The corrected reflection factor (CRF) of radar echo in 2BCMB is determined by the backscattering cross section of the precipitation particle. If the diameter and number concentration of precipitation particles increases, then the CRF generally has a greater value. The five parameters are as follows: MaxCRF (the height of the maximum CRF within the DCS), Maxht40 (the maximum height of the 40 dBZ CRF), Maxht30 (the maximum height of the 30 dBZ CRF), Maxht20 (the maximum height of the 20 dBZ CRF), and TopCRF (the maximum height of storm top within the DCS).
An abstract model is proposed to describe the structural difference in deep convection core over the TP and SS. If the anvil and the entrainment and detrainment process during the development of DCSs are temporarily neglected, then the deep convection core can be described as an “egg” and the part with the largest precipitation particle corresponds to the “egg yolk”. This conceptual model is shown in Figure 11, which uses the mean data of the height and radar echoes. The mean rain top height of DCSs over the TP is slightly lower than that over the SS, although the TP has a very high topographic altitude. The mean MaxCRF of 44.2 dBZ over the TP is lower than that over the SS (50.2 dBZ). This shows that the DCSs over the TP are both weaker and smaller than that over the SS.

4. Discussion and Conclusions

Data from the GPM Core Observatory for the summer months of 2014–2017 were used to analyze the characteristics of DCSs in terms of their frequency, geographical distribution, diurnal variation and vertical structure and to compare the differences in DCSs between the TP and SS. The type of convective precipitation was misidentified in the GPM datasets for the Tibetan Plateau, we obtained a quantified frequency of DCSs using corrected data. The main conclusions are as follows:
  • There was a higher frequency of DCSs over the SS (0.98%) than that over the TP (0.15%). Convective precipitation accounted for 65.43% of the summer precipitation over the TP, but was generally is shallow and weak. The ratio of strong and deep convection over the TP is less than that over SS.
  • The DCSs over the TP and SS mainly occurred in July–August. The DCSs concentrat in the eastern TP and SS in June. Whereas in July and August, more DCSs were generated in the central to eastern region of TP and in the west of SS.
  • There was a clear diurnal variation in DCSs over both the TP and SS. The two sub-regions both showed the highest number of DCSs in the afternoon, but the greatest difference was seen during the night, when DCSs were rarely generated over the TP. The mean intensity of DCSs precipitation over the SS was lower than that over the TP.
  • Five different radar echo heights were used to compare the structure of the deep convective core over the TP and SS. The mean cloud-top heights of DCSs over the TP and SS were 15.9 and 16.1 km, respectively. The mean maximum echo values of DCSs over the TP and SS were 44.2 and 50.2 dBZ, respectively. The area of deep convection over the TP was shorter and weaker than that over the SS.
The data from the GPM Core Observatory are useful for investigating DCSs over mid-latitude continents, but there are still many uncertainties and challenges. This study only used the Ku band to analyze the characteristics and frequency of deep convection over TP and SS, and the data in the Ka band still need to be explored. Battaglia et al. [71] suggested that the slope of the Ka reflectivity profile is anomalous relative to that of the Ku channel. The frequency of the 35 GHz Ka band is higher than that of the 13 GHz Ku band. In theory, a higher frequency radar system gives improved observations of small precipitation and ice phase particles. However, Battaglia et al. [71] found a strong attenuation of ice phase particles in the cloud top of deep convection and weak reflectivity at the cloud base. This attenuation makes it difficult to identify deep convection pixels. In spite of this disadvantage, the Ka band is useful in the analysis of microphysical processes of ice phase particles in DCSs. Further exploration and verification are required before the Ka band can be used successfully in research on DCSs. Authors also found that the type of convective precipitation is misidentified by the GPM datasets over the TP, and we used the methods of Fu and coworkers [54,55] to re-identify the type of precipitation. We were unable to validate the corrected result due to the limited of in-situ observational data over the TP, and this still requires further investigation.

Author Contributions

G.G. wrote the article, analyzed the data and drew the pictures; Q.C. conceived the article; H.C., Y.L. and Z.W. helped analyzed the data and pictures.

Funding

This research and the APC were funded by [National Natural Science Foundation of China] grant number [41875108, 41475037, 41405031 and 91537214].

Acknowledgments

This study was supported by the National Natural Science Foundation of China (Projects 41875108, 41475037, 41405031 and 91537214), and benefited from the GPM datasets provided online at https://storm.pps.eosdis.nasa.gov/storm/.

Conflicts of Interest

The authors declare no conflicts of interest.

References

  1. Grossman, R.L.; Garcia, O. The distribution of deep convection over ocean and land during the Asian summer monsoon. J. Clim. 1990, 3, 1032–1044. [Google Scholar] [CrossRef]
  2. Ramanathan, V.; Cess, R.; Harrison, E.; Minnis, P.; Barkstrom, B.; Ahmad, E.; Hartmann, D. Cloud-radiative forcing and climate-Results from the Earth Radiation Budget Experiment. Science 1989, 243, 57–63. [Google Scholar] [CrossRef] [PubMed]
  3. Holton, J.R.; Haynes, P.H.; McIntyre, M.E.; Douglass, A.R.; Rood, R.B.; Pfister, L. Stratosphere-troposphere exchange. Rev. Geophys. 1995, 33, 403–439. [Google Scholar] [CrossRef]
  4. Sherwood, S.C.; Dessler, A.E. On the control of stratospheric humidity. Geophys. Res. Lett. 2000, 27, 2513–2516. [Google Scholar] [CrossRef] [Green Version]
  5. Bhatt, B.C.; Koh, T.-Y.; Yamamoto, M.; Nakamura, K. The diurnal cycle of convective activity over South Asia as diagnosed from METEOSAT-5 and TRMM data. Terr. Atmos. Ocean. Sci. 2010, 21, 841–854. [Google Scholar] [CrossRef]
  6. Christian, H.J.; Blakeslee, R.J.; Boccippio, D.J.; Boeck, W.L.; Buechler, D.E.; Driscoll, K.T.; Goodman, S.J.; Hall, J.M.; Koshak, W.J.; Mach, D.M. Global frequency and distribution of lightning as observed from space by the Optical Transient Detector. J. Geophys. Res. Atmos. 2003, 108, ACL 4-1–ACL 4-15. [Google Scholar] [CrossRef]
  7. Liu, C.; Zipser, E.J. Global distribution of convection penetrating the tropical tropopause. J. Geophys. Res. Atmos. 2005, 110. [Google Scholar] [CrossRef] [Green Version]
  8. Liu, C.; Zipser, E.J.; Nesbitt, S.W. Global distribution of tropical deep convection: Different perspectives from TRMM infrared and radar data. J. Clim. 2007, 20, 489–503. [Google Scholar] [CrossRef]
  9. Qie, X.; Wu, X.; Yuan, T.; Bian, J.; Lu, D. Comprehensive pattern of deep convective systems over the Tibetan Plateau–South Asian monsoon region based on TRMM data. J. Clim. 2014, 27, 6612–6626. [Google Scholar] [CrossRef]
  10. Zipser, E.J.; Cecil, D.J.; Liu, C.; Nesbitt, S.W.; Yorty, D.P. Where are the most intense thunderstorms on Earth? Bull. Am. Meteorol. Soc. 2006, 87, 1057–1071. [Google Scholar] [CrossRef]
  11. Ding, Y.; Wang, Z.; Sun, Y. Inter-decadal variation of the summer precipitation in East China and its association with decreasing Asian summer monsoon. Part I: Observed evidences. Int. J. Clim. 2008, 28, 1139–1161. [Google Scholar] [CrossRef]
  12. Xu, X.; Lu, C.; Shi, X.; Gao, S. World water tower: An atmospheric perspective. Geophys. Res. Lett. 2008, 35. [Google Scholar] [CrossRef] [Green Version]
  13. Xu, X.; Shi, X.; Wang, Y.; Peng, S.; Shi, X. Data analysis and numerical simulation of moisture source and transport associated with summer precipitation in the Yangtze River Valley over China. Meteorol. Atmos. Phys. 2008, 100, 217–231. [Google Scholar] [CrossRef]
  14. Duan, A.; Wu, G. Role of the Tibetan Plateau thermal forcing in the summer climate patterns over subtropical Asia. Clim. Dyn. 2005, 24, 793–807. [Google Scholar] [CrossRef]
  15. Flohn, H. Large-scale aspects of the “summer monsoon” in South and East Asia. J. Meteorol. Soc. Jpn. Ser. II 1957, 35, 180–186. [Google Scholar] [CrossRef]
  16. Hoskins, B.J.; Karoly, D.J. The steady linear response of a spherical atmosphere to thermal and orographic forcing. J. Atmos. Sci. 1981, 38, 1179–1196. [Google Scholar] [CrossRef]
  17. Solomon, S.; Rosenlof, K.H.; Portmann, R.W.; Daniel, J.S.; Davis, S.M.; Sanford, T.J.; Plattner, G.-K. Contributions of stratospheric water vapor to decadal changes in the rate of global warming. Science 2010, 327, 1219–1223. [Google Scholar] [CrossRef]
  18. Tian, W.; Chipperfield, M.; Huang, Q. Effects of the Tibetan Plateau on total column ozone distribution. Tellus B 2008, 60, 622–635. [Google Scholar] [CrossRef] [Green Version]
  19. Wu, G.; Zhang, Y. Tibetan Plateau forcing and the timing of the monsoon onset over South Asia and the South China Sea. Mon. Weather Rev. 1998, 126, 913–927. [Google Scholar] [CrossRef]
  20. Yeh, T. The circulation of the high troposphere over China in the winter of 1945–46. Tellus 1950, 2, 173–183. [Google Scholar] [CrossRef]
  21. Fu, R.; Hu, Y.; Wright, J.S.; Jiang, J.H.; Dickinson, R.E.; Chen, M.; Filipiak, M.; Read, W.G.; Waters, J.W.; Wu, D.L. Short circuit of water vapor and polluted air to the global stratosphere by convective transport over the Tibetan Plateau. Proc. Natl. Acad. Sci. USA 2006, 103, 5664–5669. [Google Scholar] [CrossRef] [Green Version]
  22. Li, Q.; Jiang, J.H.; Wu, D.L.; Read, W.G.; Livesey, N.J.; Waters, J.W.; Zhang, Y.; Wang, B.; Filipiak, M.J.; Davis, C.P. Trapping of Asian pollution by the Tibetan anticyclone: A global CTM simulation compared with EOS MLS observations. Geophys. Res. Lett. 2005, 32, L14826. [Google Scholar] [CrossRef]
  23. Park, M.; Randel, W.J.; Gettelman, A.; Massie, S.T.; Jiang, J.H. Transport above the Asian summer monsoon anticyclone inferred from Aura Microwave Limb Sounder tracers. J. Geophys. Res. Atmos. 2007, 112. [Google Scholar] [CrossRef] [Green Version]
  24. Randel, W.J.; Park, M.; Emmons, L.; Kinnison, D.; Bernath, P.; Walker, K.A.; Boone, C.; Pumphrey, H. Asian monsoon transport of pollution to the stratosphere. Science 2010, 328, 611–613. [Google Scholar] [CrossRef] [PubMed]
  25. Sun, Y.; Chen, Q.; Gui, K.; Dong, F.; Feng, X.; Long, Q. Characteristics of Water Vapor in the UTLS over the Tibetan Plateau Based on AURA/MLS Observations. Adv. Meteorol. 2017, 2017, 3504254. [Google Scholar] [CrossRef]
  26. Solomon, S.; Daniel, J.S.; Neely, R.R.; Vernier, J.-P.; Dutton, E.G.; Thomason, L.W. The persistently variable “background” stratospheric aerosol layer and global climate change. Science 2011, 333, 866–870. [Google Scholar] [CrossRef] [PubMed]
  27. Kirk-Davidoff, D.B.; Hintsa, E.J.; Anderson, J.G.; Keith, D.W. The effect of climate change on ozone depletion through changes in stratospheric water vapour. Nature 1999, 402, 399–401. [Google Scholar] [CrossRef]
  28. Oltmans, S.; Hofmann, D. Increase in lower-stratospheric water vapour at a mid-latitude Northern Hemisphere site from 1981 to 1994. Nature 1995, 374, 146–149. [Google Scholar] [CrossRef]
  29. Smith, C.A.; Toumi, R.; Haigh, J.D. Seasonal trends in stratospheric water vapour. Geophys. Res. Lett. 2000, 27, 1687–1690. [Google Scholar] [CrossRef] [Green Version]
  30. Randel, W.J.; Park, M. Deep convective influence on the Asian summer monsoon anticyclone and associated tracer variability observed with Atmospheric Infrared Sounder (AIRS). J. Geophys. Res. Atmos. 2006, 111. [Google Scholar] [CrossRef] [Green Version]
  31. Highwood, E.; Hoskins, B. The tropical tropopause. Q. J. R. Meteorol. Soc. 1998, 124, 1579–1604. [Google Scholar] [CrossRef]
  32. Folkins, I.; Loewenstein, M.; Podolske, J.; Oltmans, S.J.; Proffitt, M. A barrier to vertical mixing at 14 km in the tropics: Evidence from ozonesondes and aircraft measurements. J. Geophys. Res. Atmos. 1999, 104, 22095–22102. [Google Scholar] [CrossRef] [Green Version]
  33. Houze, R.A.; Wilton, D.C.; Smull, B.F. Monsoon convection in the Himalayan region as seen by the TRMM Precipitation Radar. Q. J. R. Meteorol. Soc. 2007, 133, 1389–1411. [Google Scholar] [CrossRef]
  34. Xu, W. Precipitation and convective characteristics of summer deep convection over East Asia observed by TRMM. Mon. Weather Rev. 2013, 141, 1577–1592. [Google Scholar] [CrossRef]
  35. Long, Q.; Chen, Q.; Gui, K.; Zhang, Y. A Case Study of a Heavy Rain over the Southeastern Tibetan Plateau. Atmosphere 2016, 7, 118. [Google Scholar] [CrossRef]
  36. Romatschke, U.; Houze, R.A., Jr. Characteristics of precipitating convective systems in the South Asian monsoon. J. Hydrometeorol. 2011, 12, 3–26. [Google Scholar] [CrossRef]
  37. Romatschke, U.; Medina, S.; Houze, R.A., Jr. Regional, seasonal, and diurnal variations of extreme convection in the South Asian region. J. Clim. 2010, 23, 419–439. [Google Scholar] [CrossRef]
  38. Luo, Y.; Zhang, R.; Qian, W.; Luo, Z.; Hu, X. Intercomparison of deep convection over the Tibetan Plateau–Asian monsoon region and subtropical North America in boreal summer using CloudSat/CALIPSO data. J. Clim. 2011, 24, 2164–2177. [Google Scholar] [CrossRef]
  39. Iwasaki, S.; Shibata, T.; Nakamoto, J.; Okamoto, H.; Ishimoto, H.; Kubota, H. Characteristics of deep convection measured by using the A-train constellation. J. Geophys. Res. Atmos. 2010, 115. [Google Scholar] [CrossRef] [Green Version]
  40. Iwasaki, S.; Shibata, T.; Okamoto, H.; Ishimoto, H.; Kubota, H. Mixtures of stratospheric and overshooting air measured using A-Train sensors. J. Geophys. Res. Atmos. 2012, 117. [Google Scholar] [CrossRef] [Green Version]
  41. Sassen, K.; Wang, Z.; Liu, D. Cirrus clouds and deep convection in the tropics: Insights from CALIPSO and CloudSat. J. Geophys. Res. Atmos. 2009, 114. [Google Scholar] [CrossRef] [Green Version]
  42. Takahashi, H.; Luo, Z.J. Characterizing tropical overshooting deep convection from joint analysis of CloudSat and geostationary satellite observations. J. Geophys. Res. Atmos. 2014, 119, 112–121. [Google Scholar] [CrossRef] [Green Version]
  43. Stephens, G.L.; Vane, D.G.; Boain, R.J.; Mace, G.G.; Sassen, K.; Wang, Z.; Illingworth, A.J.; O’connor, E.J.; Rossow, W.B.; Durden, S.L. The CloudSat mission and the A-Train: A new dimension of space-based observations of clouds and precipitation. Bull. Am. Meteorol. Soc. 2002, 83, 1771–1790. [Google Scholar] [CrossRef]
  44. Hou, A.Y.; Kakar, R.K.; Neeck, S.; Azarbarzin, A.A.; Kummerow, C.D.; Kojima, M.; Oki, R.; Nakamura, K.; Iguchi, T. The global precipitation measurement mission. Bull. Am. Meteorol. Soc. 2014, 95, 701–722. [Google Scholar] [CrossRef]
  45. Liu, N.; Liu, C. Global distribution of deep convection reaching tropopause in 1 year GPM observations. J. Geophys. Res. Atmos. 2016, 121, 3824–3842. [Google Scholar] [CrossRef]
  46. Maussion, F.; Scherer, D.; Mölg, T.; Collier, E.; Curio, J.; Finkelnburg, R. Precipitation seasonality and variability over the Tibetan Plateau as resolved by the High Asia Reanalysis. J. Clim. 2014, 27, 1910–1927. [Google Scholar] [CrossRef]
  47. Singh, D.; Tsiang, M.; Rajaratnam, B.; Diffenbaugh, N.S. Observed changes in extreme wet and dry spells during the South Asian summer monsoon season. Nat. Clim. Chang. 2014, 4, 456–461. [Google Scholar] [CrossRef]
  48. Turner, A.G.; Annamalai, H. Climate change and the South Asian summer monsoon. Nat. Clim. Chang. 2012, 2, 587–595. [Google Scholar] [CrossRef]
  49. Le, M.; Chandrasekar, V. Precipitation type and profile classification for GPM-DPR. In Proceedings of the 2011 IEEE International Geoscience and Remote Sensing Symposium (IGARSS), Vancouver, BC, Canada, 24–29 July 2011; pp. 1275–1278. [Google Scholar]
  50. Fueglistaler, S.; Dessler, A.; Dunkerton, T.; Folkins, I.; Fu, Q.; Mote, P.W. Tropical tropopause layer. Rev. Geophys. 2009, 47. [Google Scholar] [CrossRef] [Green Version]
  51. Yeh, T. The thermal structure, convective activity over Qinghai-Tibetan Plateau in summer and their interactions with large-scale circulation. Chin. J. Atmos. Sci. 1988, 12, 1–12. (In Chinese) [Google Scholar]
  52. Xu, X.-D.; Chen, L.-S. Advances of the study on Tibetan Plateau experiment of atmospheric sciences. J. Appl. Meteorol. Sci. 2006, 17, 756–772. [Google Scholar]
  53. Cetrone, J.; Houze, R.A. Anvil clouds of tropical mesoscale convective systems in monsoon regions. Q. J. R. Meteorol. Soc. 2009, 135, 305–317. [Google Scholar] [CrossRef] [Green Version]
  54. Fu, Y.; Liu, G. Possible misidentification of rain type by TRMM PR over Tibetan Plateau. J. Appl. Meteorol. Clim. 2007, 46, 667–672. [Google Scholar] [CrossRef]
  55. Fu, Y.F.; Pan, X.; Liu, G.; Li, R.; Zhong, L. Characteristics of precipitation based on cloud brightness temperatures and storm tops in summer over the Tibetan Plateau. Chin. J. Atmos. Sci. 2016, 40, 102–120. [Google Scholar]
  56. Fu, Y.; Liu, Q.; Zi, Y.; Feng, S.; Li, Y.; Liu, G. Summer precipitation and latent heating over the Tibetan Plateau based on TRMM measurements. Plateau Mt. Meteorol. Res. 2008, 1, 001. [Google Scholar]
  57. Yang, K.; Koike, T.; Fujii, H.; Tamura, T.; Xu, X.; Bian, L.; Zhou, M. The daytime evolution of the atmospheric boundary layer and convection over the Tibetan Plateau: Observations and simulations. J. Meteorol. Soc. Jpn. Ser. II 2004, 82, 1777–1792. [Google Scholar] [CrossRef]
  58. Uyeda, H.; Yamada, H.; Horikomi, J.; Shirooka, R.; Shimizu, S.; Liping, L.; Ueno, K.I.; Fujii, H.; Koike, T. Characteristics of convective clouds observed by a Doppler radar at Naqu on Tibetan Plateau during the GAME-Tibet IOP. J. Meteorol. Soc. Jpn. Ser. II 2001, 79, 463–474. [Google Scholar] [CrossRef]
  59. Jiang, J.; Fan, M. Convective Clouds and Mesoscale Convective Systems over the Tibetan Plateau in Summer. Chin. J. Atmos. Sci. 2002, 2, 011. [Google Scholar]
  60. Chen, B.; Xu, X.; Yang, S.; Zhao, T. Climatological perspectives of air transport from atmospheric boundary layer to tropopause layer over Asian monsoon regions during boreal summer inferred from Lagrangian approach. Atmos. Chem. Phys. 2012, 12, 5827–5839. [Google Scholar] [CrossRef] [Green Version]
  61. McCarthy, M.; Boering, K.; Rahn, T.; Eiler, J.; Rice, A.; Tyler, S.; Schauffler, S.; Atlas, E.; Johnson, D. The hydrogen isotopic composition of water vapor entering the stratosphere inferred from high-precision measurements of δD-CH4 and δD-H2. J. Geophys. Res. Atmos. 2004, 109. [Google Scholar] [CrossRef]
  62. Khaykin, S.; Pommereau, J.-P.; Korshunov, L.; Yushkov, V.; Nielsen, J.; Larsen, N.; Christensen, T.; Garnier, A.; Lukyanov, A.; Williams, E. Hydration of the lower stratosphere by ice crystal geysers over land convective systems. Atmos. Chem. Phys. 2009, 9, 2275–2287. [Google Scholar] [CrossRef] [Green Version]
  63. Gray, W.M.; Jacobson, R.W. Diurnal variation of deep cumulus convection. Mon. Weather Rev. 1977, 105, 1171–1188. [Google Scholar] [CrossRef]
  64. Chen, L.; Song, Y.; Liu, J.; Wang, W. On the Diurnal Variation of Convection over Qinghai-Xizang Plateau During Summer as Revealed from Meteorological Satellite Data. Acta Meteorol. Sin. 1999, 5, 004. [Google Scholar]
  65. Fujinami, H.; Nomura, S.; Yasunari, T. Characteristics of diurnal variations in convection and precipitation over the southern Tibetan Plateau during summer. Sola 2005, 1, 49–52. [Google Scholar] [CrossRef]
  66. Dai, A. Global precipitation and thunderstorm frequencies. Part II: Diurnal variations. J. Clim. 2001, 14, 1112–1128. [Google Scholar] [CrossRef]
  67. Carbone, R.E.; Tuttle, J.D.; Ahijevych, D.A.; Trier, S.B. Inferences of Predictability Associated with Warm Season Precipitation Episodes. J. Atmos. Sci. 2002, 59, 2033–2056. [Google Scholar] [CrossRef]
  68. He, H.; Zhang, F. Diurnal Variations of Warm-Season Precipitation over Northern China. Mon. Weather Rev. 2010, 138, 1017–1025. [Google Scholar] [CrossRef]
  69. Barros, A.P.; Lang, T.J. Monitoring the monsoon in the Himalayas: Observations in central Nepal, June 2001. Mon. Weather Rev. 2003, 131, 1408–1427. [Google Scholar] [CrossRef]
  70. Bhatt, B.C.; Nakamura, K. Characteristics of monsoon rainfall around the Himalayas revealed by TRMM precipitation radar. Mon. Weather Rev. 2005, 133, 149–165. [Google Scholar] [CrossRef]
  71. Battaglia, A.; Tanelli, S.; Mroz, K.; Tridon, F. Multiple scattering in observations of the GPM dual-frequency precipitation radar: Evidence and impact on retrievals. J. Geophys. Res. Atmos. 2015, 120, 4090–4101. [Google Scholar] [CrossRef] [Green Version]
Figure 1. (a) Topography of the study area, with the red rectangle showing the location of the study region (25–40° N, 73–105° E). (b) The two sub-regions of the Tibetan Plateau and its southern slope. The black line represents the 3000 m elevation contour.
Atmosphere 10 00009 g001
Figure 2. Contoured frequency by altitude diagrams showing the frequency distribution of (a) convective and (b) stratiform echoes from the GPM datasets over the Tibetan Plateau.
Atmosphere 10 00009 g002
Figure 3. As per Figure 2, but for reidentified (a) convective and (b) stratiform echoes over the Tibetan Plateau.
Atmosphere 10 00009 g003
Figure 4. Percent of convective precipitation during summer (the black line is the 3000 m elevation contour) using (a) uncorrected data from the GPM original dataset, and (b) the corrected data using the re-identification method. The resolution of 0.5° × 0.5° was obtained by gridding the radar data.
Atmosphere 10 00009 g004
Figure 5. (a) The frequency and (b) the probability density function of DCSs varied with height of Maxht20. Warm and cold color describe the TP and SS region.
Atmosphere 10 00009 g005
Figure 6. Spatial distribution of DCSs. Each dot is represented a DCS, the color varies with the value of Maxht20, and the darker colors represent stronger DCSs. (a) Distribution of all the DCSs. The Maxht20 height is (b) >14, (c) >15, (d) >16, and (e) >17 km.
Atmosphere 10 00009 g006
Figure 7. Same as Figure 6, but for (a) June, (b) July, and (c) August.
Atmosphere 10 00009 g007
Figure 8. Diurnal variation in DCSs. (a) Number of DCSs per hour, (b) percent of total DCSs observed across the diurnal cycle, and (c) mean precipitation intensity.
Atmosphere 10 00009 g008
Figure 9. Spatiotemporal distribution of DCSs over (a) the TP, and (b) the SS. Each dot represents a DCS. The size of dots varies with Maxht20 of the DCSs.
Atmosphere 10 00009 g009
Figure 10. As Figure 2, but for deep convective echoes over the (a) south slope and (b) Tibetan Plateau.
Atmosphere 10 00009 g010
Figure 11. Conceptual model of the convective structure of the deep convective core in two different sub-regions. The curved black line shows the profile of the terrain height along the line 85° E from south to north.
Atmosphere 10 00009 g011
Table 1. Number, percentage, and mean intensity of precipitation in pixels for different types of precipitation.
TypeTotalConvectionStratiformOther
Total numbers (%) of pixels729,622124,364
(17.04)
529,901
(72.63)
75,357
(10.33)
Mean intensity of precipitation (mm/h)1.4210973.9877791.0164970.030321
Total number (%) of pixels over the TP333,854
(45.76)
28,093
(8.41)
274,158
(82.11)
31,603
(9.47)
Mean intensity of precipitation over the TP (mm/h)0.9636093.2769230.83390.032456
Total number (%) pixels over the SS395,768
(54.24)
96,271
(24.33)
255,743
(64.62)
43,754
(11.06)
Mean intensity of precipitation over the SS (mm/h)1.8070164.1952151.2122420.028779
Table 2. Number, percentage and mean intensity of convective precipitation in pixels for different types of precipitation before and after correction.
TypeTotalConvection UncorrectedConvection CorrectedDeep Convection
Total number (%) of pixels729,622124,364
(17.04)
314,707
(43.13)
1.265
(0.40)
Mean intensity of precipitation (mm/h)1.4210973.9877792.07249821.83921
Total number (%) of pixels over the TP333,854
(45.76)
28,093
(8.41)
218,436
(65.43)
322
(0.15)
Mean intensity of precipitation over the TP (mm/h)0.9636093.2769231.13695621.21894
Total number (%) of pixels over the SS395,768
(54.24)
96,271
(24.33)
96,271
(24.32)
943
(0.98)
Mean intensity of precipitation over the SS (mm/h)1.8070164.1952154.19521522.05101

