Article

Oceanic Dimethyl Sulfide Emission and New Particle Formation around the Coast of Antarctica: A Modeling Study of Seasonal Variations and Comparison with Measurements

Atmospheric Sciences Research Center, State University of New York, Albany, New York, NY 12203, USA
*
Author to whom correspondence should be addressed.
Atmosphere 2010, 1(1), 34-50; https://doi.org/10.3390/atmos1010034
Submission received: 27 August 2010 / Revised: 12 November 2010 / Accepted: 2 December 2010 / Published: 6 December 2010
(This article belongs to the Special Issue Feature Papers)

Abstract

:
A clear understanding of new particle formation processes in remote oceans is critical for properly assessing the role of oceanic dimethyl sulfide (DMS) emission on the Earth’s climate and associated climate feedback processes. Almost free from anthropogenic pollutants and leafed plants, the Antarctic continent and surrounding oceans are unique regions for studying the lifecycle of natural sulfate aerosols. Here we investigate the well-recognized seasonal variations of new particle formation around Antarctic coastal areas with a recently developed global size-resolved aerosol model. Our simulations indicate that enhanced DMS emission and photochemistry during the austral summer season lead to significant new particle formation via ion-mediated nucleation (IMN) and much higher particle number concentrations over Antarctica and surrounding oceans. By comparing predicted condensation nuclei larger than 10 nm (CN10) during a three-year period (2005–2007) with the long-period continuous CN10 measurements at the German Antarctic station Neumayer, we show that the model captures the absolute values of monthly mean CN10 (within a factor 2–3) as well as their seasonal variations. Our simulations confirm that the observed Antarctic CN10 and cloud condensation nuclei (CCN) seasonal variations are due to the formation of secondary particles during the austral summer. From the austral winter to summer, the zonally averaged CN10 and CCN in the lower troposphere over Antarctica increase by a factor of ~4–6 and ~2–4, respectively. This study appears to show that the H2SO4-H2O IMN mechanism is able to account for the new particle formation frequently observed in the Antarctica region during the austral summer.

Graphical Abstract

1. Introduction

Aerosol precursor gases emitted from oceans have been well recognized to play an important role in the Earth’s radiation budget and climate feedback processes. Oceanic dimethyl sulfide (DMS) is an important contributor to the global sulfur cycle and its oxidation accounts for ~20% of the global SO2 sources [1]. Charlson et al. [2] proposed a negative feedback mechanism on the Earth’s climate involving the oceanic DMS emission, sulfate aerosol production, and cloud properties (i.e., “CLAW” hypothesis). According to this hypothesis, a warmer climate would increase DMS emission and atmospheric DMS concentrations which in turn would lead to higher formation rates of sulfate aerosols and cloud condensation nuclei (CCN) abundance. The resulting increase in cloud albedo should reflect more sunlight back to space and thus cool the Earth. Despite numerous studies undertaken since 1987 to verify the “CLAW” hypothesis and understand its relevance to today's climate issues, the magnitude and even the sign of the “CLAW” feedback mechanism remains unclear [3,4,5,6]. A lack of quantitative understanding of new particle formation processes is one of many significant gaps in the “CLAW” hypothesis that remain to be resolved [6].
Almost free from anthropogenic pollution and leafed plants releasing organic aerosol precursors, the Antarctic continent and surrounding oceans are unique regions for studying natural atmospheric sulfate aerosols. The total number concentrations of particles in Antarctica have a strong seasonal variation, from as low as a few tens per cm3 in the austral winter (JJA: June, July, August) to several thousands per cm3 in the austral summer (DJF: December, January, February) [7,8,9]. Particle size distribution measurements indicate that the high DJF particle number concentrations are associated with the presence of nucleation mode particles [10,11,12,13,14,15,16]. Koponen et al. [14] reported particle size distributions (3–800 nm in diameter) measured in continental Antarctica during the austral summers 2000 and 2001 and showed that a nucleation mode (with diameter < 20 nm) was present in more than a half of the measured spectra. It has been generally accepted that formation and growth of secondary particles in Antarctica is mainly through the oxidation product of DMS emitted from the Southern Oceans [17]. Particle chemical composition analyses suggest that accumulation mode particles in Antarctic air masses are mostly acidic and consist primarily of sulfuric acid [18,19].
While the presence of nucleation mode particles in Antarctic air during the austral summers has been well recognized, a comprehensive modeling study of the formation mechanisms of these particles is lacking. Ito et al. [11] discussed possible processes leading to new particle formation (binary, ternary, and ion nucleation) but no quantitative calculations were given. Park et al. [16] found that the H2SO4 concentrations ([H2SO4]) measured at the South Pole during ISCAT 2000 are substantially below the values required for H2SO4-H2O binary homogeneous nucleation (BHN) and suggested that either other species participated in particle formation and/or that the observed nucleation mode particles were transported from elsewhere. Koponen et al. [13,14] found that new particle formation does take place in the Antarctic boundary layer and has apparently something to do with the coastal areas. Measurements onboard a ship indicated that a nucleation mode was frequently observed as the ship approached the Antarctic coast [13]. Based on particle size distributions (diameter 3–800 nm) measured at the Finnish Antarctica research station Aboa (73°03’S, 13°25’W, ~130 km from the coastline) during the austral summers 2000 and 2001, Koponen et al. [14] showed that evidence of recent new particle formation could be seen in marine/coastal air masses only. More recently, Virkkula et al. [19] and Asmi et al. [20] reported the observed size distributions of ion clusters and charged particles at Aboa during 12/14/2004–1/30/2005 and 12/29/2006–1/29/2007, and showed that clear nucleation events occurred on ~21–23% of the days at the site, a fraction similar to that observed at a boreal forest site.
A number of modeling studies investigating new particle formation at a global scale have been reported in the last couple of years [17,21,22,23,24,25,26,27,28], although none of these studies specifically focused on new particle formation around the Antarctic coastal regions. Korhonen et al. [17] showed no nucleation in the boundary layer (BL) based on a BHN scheme and concluded that the main pathway of DMS influence on CCN number is the nucleation of DMS-derived H2SO4 in the free troposphere and subsequent downward entrainment. With the BL nucleation calculated by an empirical formula which expresses nucleation rate J as J = A [H2SO4] (where A is an empirically derived constant), the studies of Merikanto et al. [26] and Wang and Penner [24] indicated significant contribution of BL nucleation to global particle number concentration and CCN abundance. Yu et al. [28] showed that the empirical formula significantly over-predict (by a factor of up to 10) the particle number concentrations in the BL over remote oceans. The extensive comparisons of simulated global particle number concentrations with land-, ship-, and aircraft- based measurements by Yu et al. [28] indicate that, among six widely used nucleation schemes involving H2SO4 vapor, only the ion-mediated nucleation (IMN) scheme can reasonably account for both absolute values (within a factor of ~2) and spatial distributions of particle number concentrations in the whole troposphere.
One major uncertainty in current global aerosol simulations remains to be the mechanism of new particle formation. As mentioned earlier, the Antarctic continent and surrounding oceans are unique regions for studying the formation of natural atmospheric sulfate aerosols. The purpose of this study is to investigate the seasonal variations of new particle formation around the Antarctic coastal areas associated with DMS emissions, using a recently developed global size-resolved aerosol model [27] and focusing on IMN mechanism. Multiple-year continuous measurements of CN10 at the coastal Antarctic station Neumayer are used, for the first time, to evaluate the ability of the model in capturing the season variations of CN10. The contributions of secondary and primary particles to CCN abundance in the region and their seasonal variations are also analyzed. This study is important in view of a possible large reduction in the DMS sea surface concentrations in the Southern Oceans (up to ~40%) in the year 2100 predicted by a global modeling study [5], and the unresolved physical processes governing the observed seasonal variations of cloud properties over the Southern Ocean [29,30,31].

2. Global Size-resolved Aerosol Model

Yu and Luo [27] incorporated an advanced particle microphysics (APM) model into GEOS-Chem, which is a global 3-D model of atmospheric composition driven by assimilated meteorological data from the NASA Goddard Earth Observing System 5 (GEOS-5). The GEOS-Chem model has been developed and used by many research groups and contains many state-of-the-art modules treating various chemical and aerosol processes [32,33,34,35,36,37] with up-to-date key emission inventories [38,39]. In GEOS-Chem, DMS emission by phytoplankton is calculated using a global distribution of DMS seawater concentrations from Kettle et al. [40] and a standard sea-air exchange parameterization driven by the local wind [41]. The global total DMS flux for 2006 based on GEOS-Chem is 20.0 Tg S yr−1, which is close to the values derived from most of the models discussed in Woodhouse et al. [42]. A detailed description of the GEOS-Chem (including various emission sources, chemistry and aerosol schemes) can be found on the model webpage [43].
In the present version of the APM module, size-resolved microphysics for secondary particles (i.e., those formed from gaseous species) and sea salt have been treated with 40 sectional bins to represent sulfate (or secondary) particles and 20 sectional bins to represent sea salt particles. The bin structure is chosen to have relatively high resolution for the size ranges important to the growth of nucleated particles (a few nanometers) to CCN (30 bins in the dry diameter range of 1.2 nm–120 nm). The dust particles are represented by four bins. Both black carbon and primary organic carbon particles are represented with two log-normal modes. The growth of nucleated particles through the condensation of sulfuric acid vapor and equilibrium uptake of nitrate, ammonium, and secondary organic aerosol (SOA) is explicitly simulated, along with the coagulation scavenging of secondary particles by primary particles (dust, black carbon, organic carbon, and sea salt). The model also keeps track of the amount of secondary species coated on each type of primary particles, as a result of coagulation, condensation, and equilibrium uptake. More details of the aerosol model can be found in Yu and Luo [27].
In this work, we extend the studies presented in Yu and Luo [27] by carrying out simulations with a horizontal resolution of 2° × 2.5° and 47 vertical layers up to 0.01 hpa (GEOS-5 meteorological fields). Our previous publications focus on the discussions of annual mean global aerosol number abundance simulated with GEOS-Chem + APM at 4° × 5° horizontal resolution. This study focuses on seasonal variations of new particle formation over Antarctica and surrounding ocean simulated with GEOS-Chem + APM at 2° × 2.5° horizontal resolution. The GEOS-Chem v8-01-03 used in Yu and Luo [27] has been updated to v8-02-02 for the present simulation. New particle formation is calculated based on an ion-mediated nucleation mechanism [44] which has been shown to reasonably account for total number concentrations of particles larger than ~4 nm and ~10 nm observed in different parts of the troposphere [27,28]. The oceanic isoprene and α-pinene emission indicated by ship measurements is not considered in the present study due to the large unresolved difference between the total fluxes derived from “top-down” and “bottom-up” approaches [45]. We have conducted simulations for three years (2005–2007), with 2 months of spin-up running. The seasonally mean results presented below are for year 2006 only. Sensitivity studies to examine the impact of DMS emission change and role of BHN have also been carried out for year 2006.

3. Simulations and Results

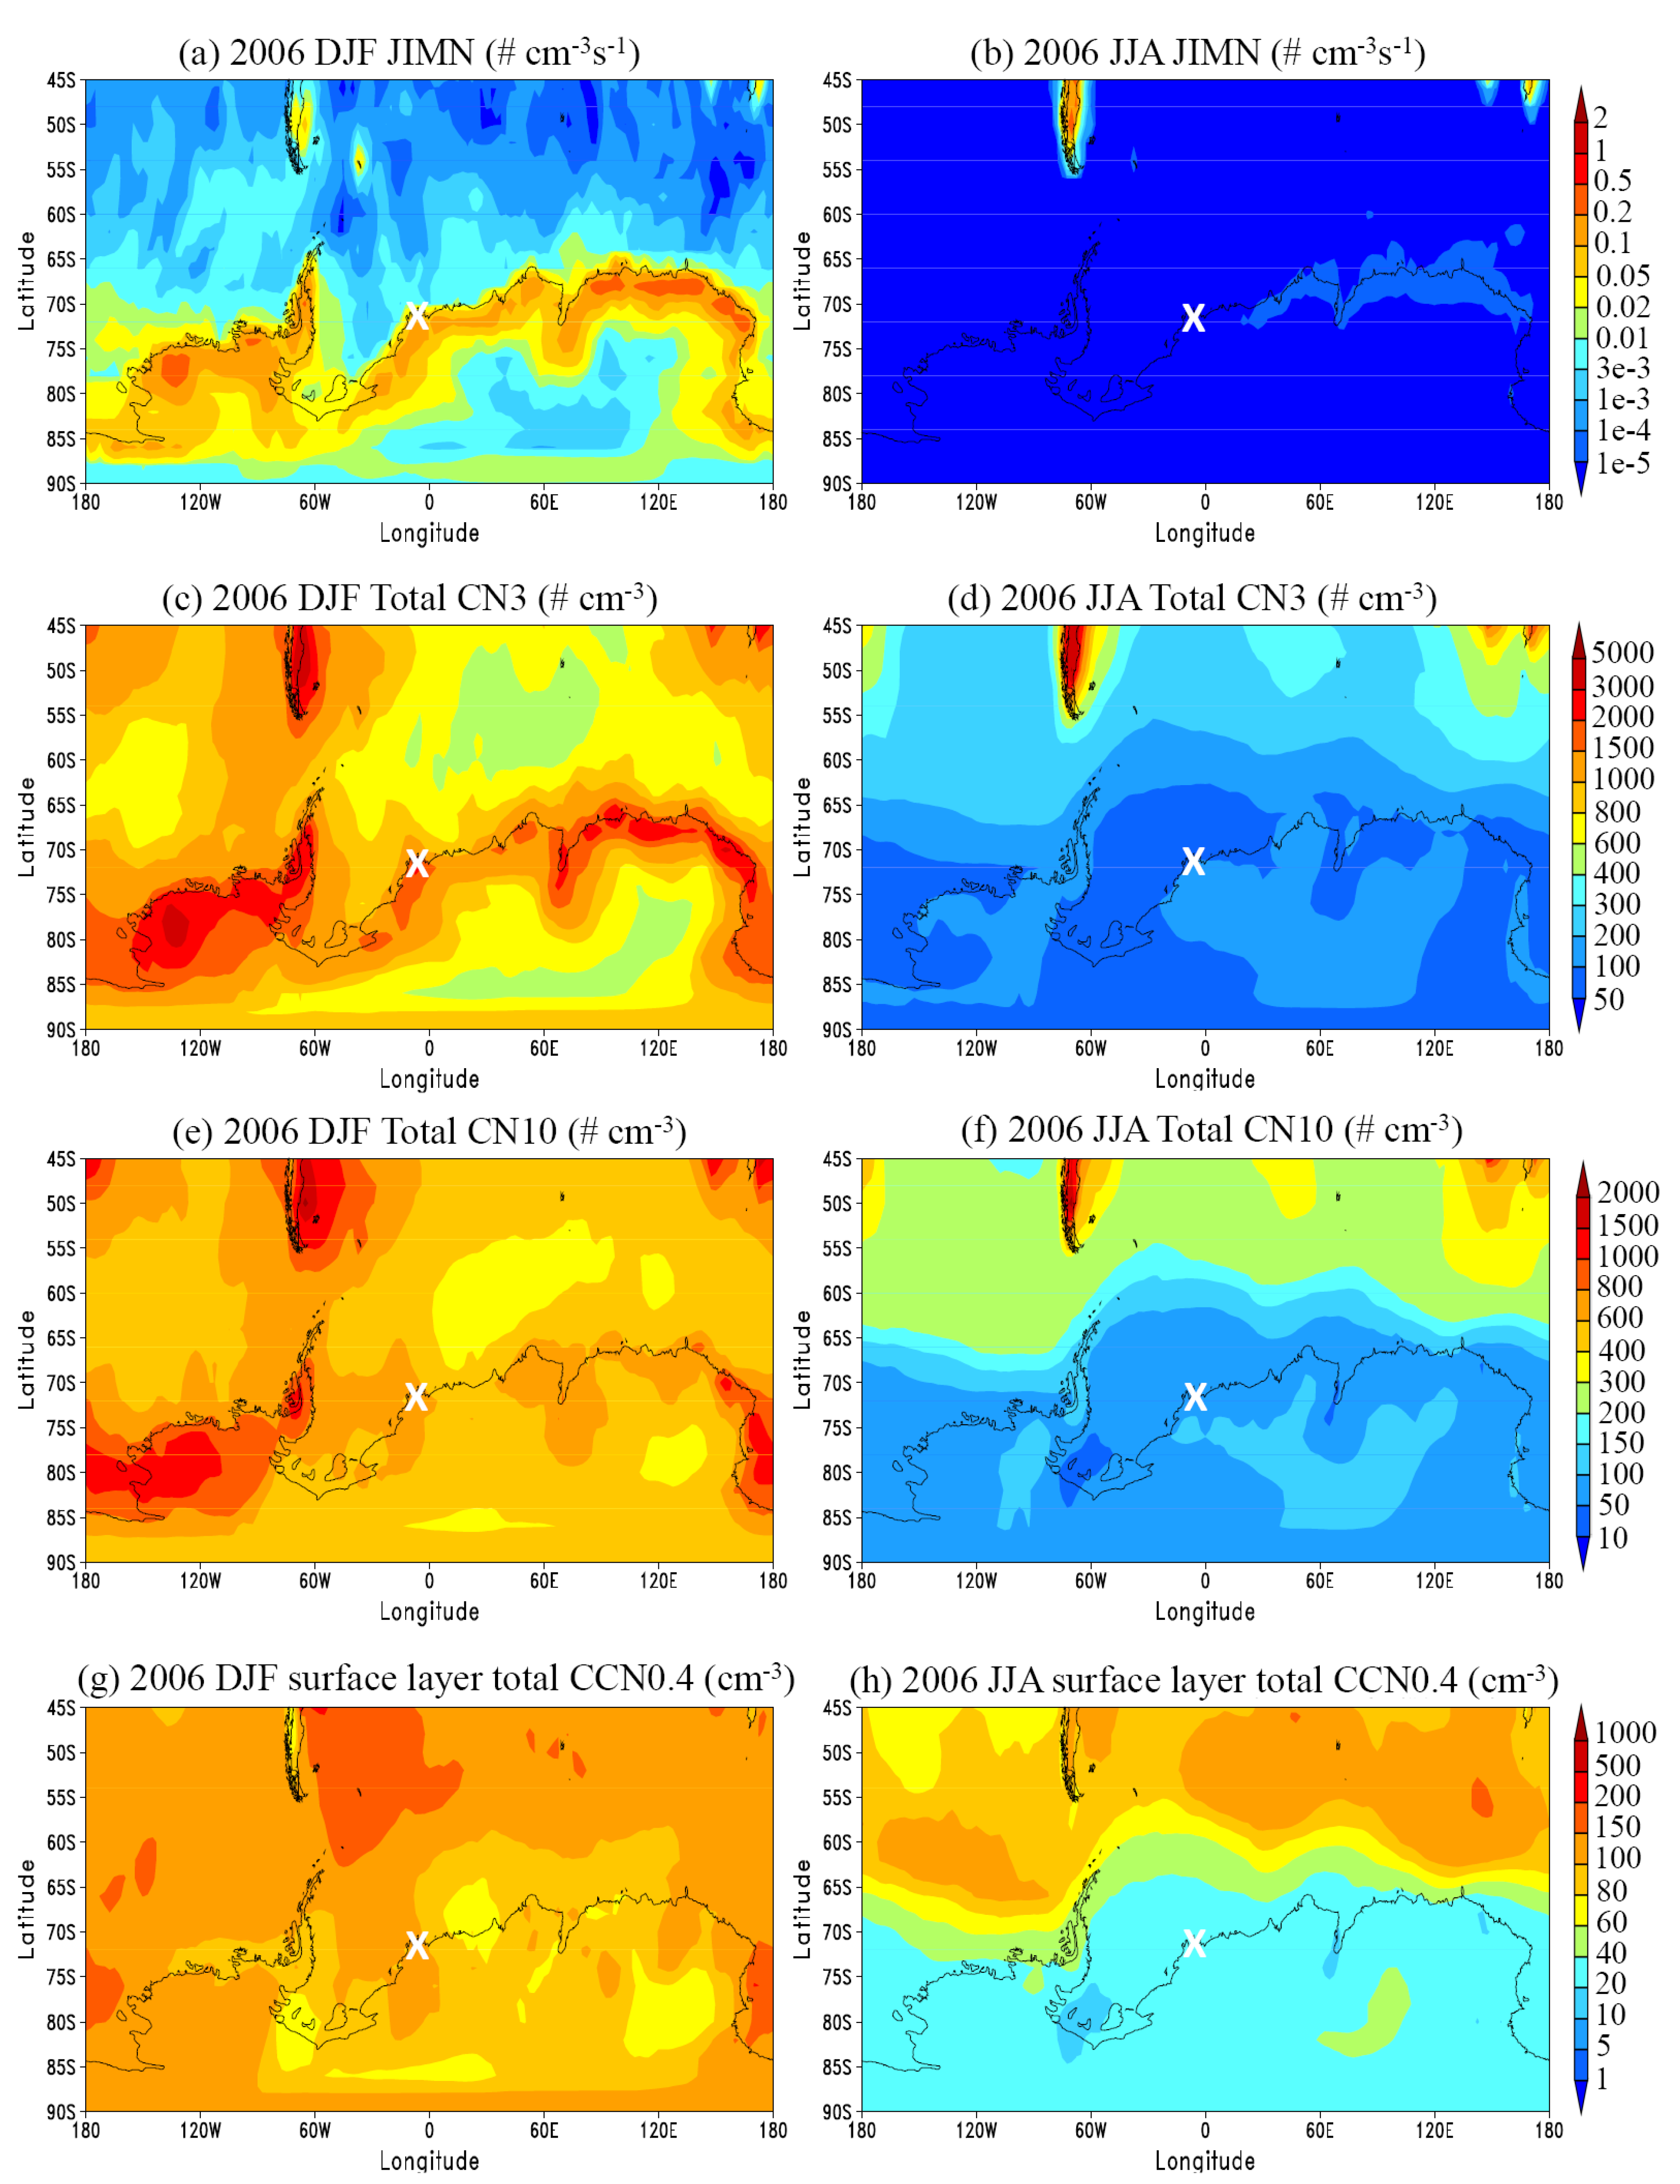
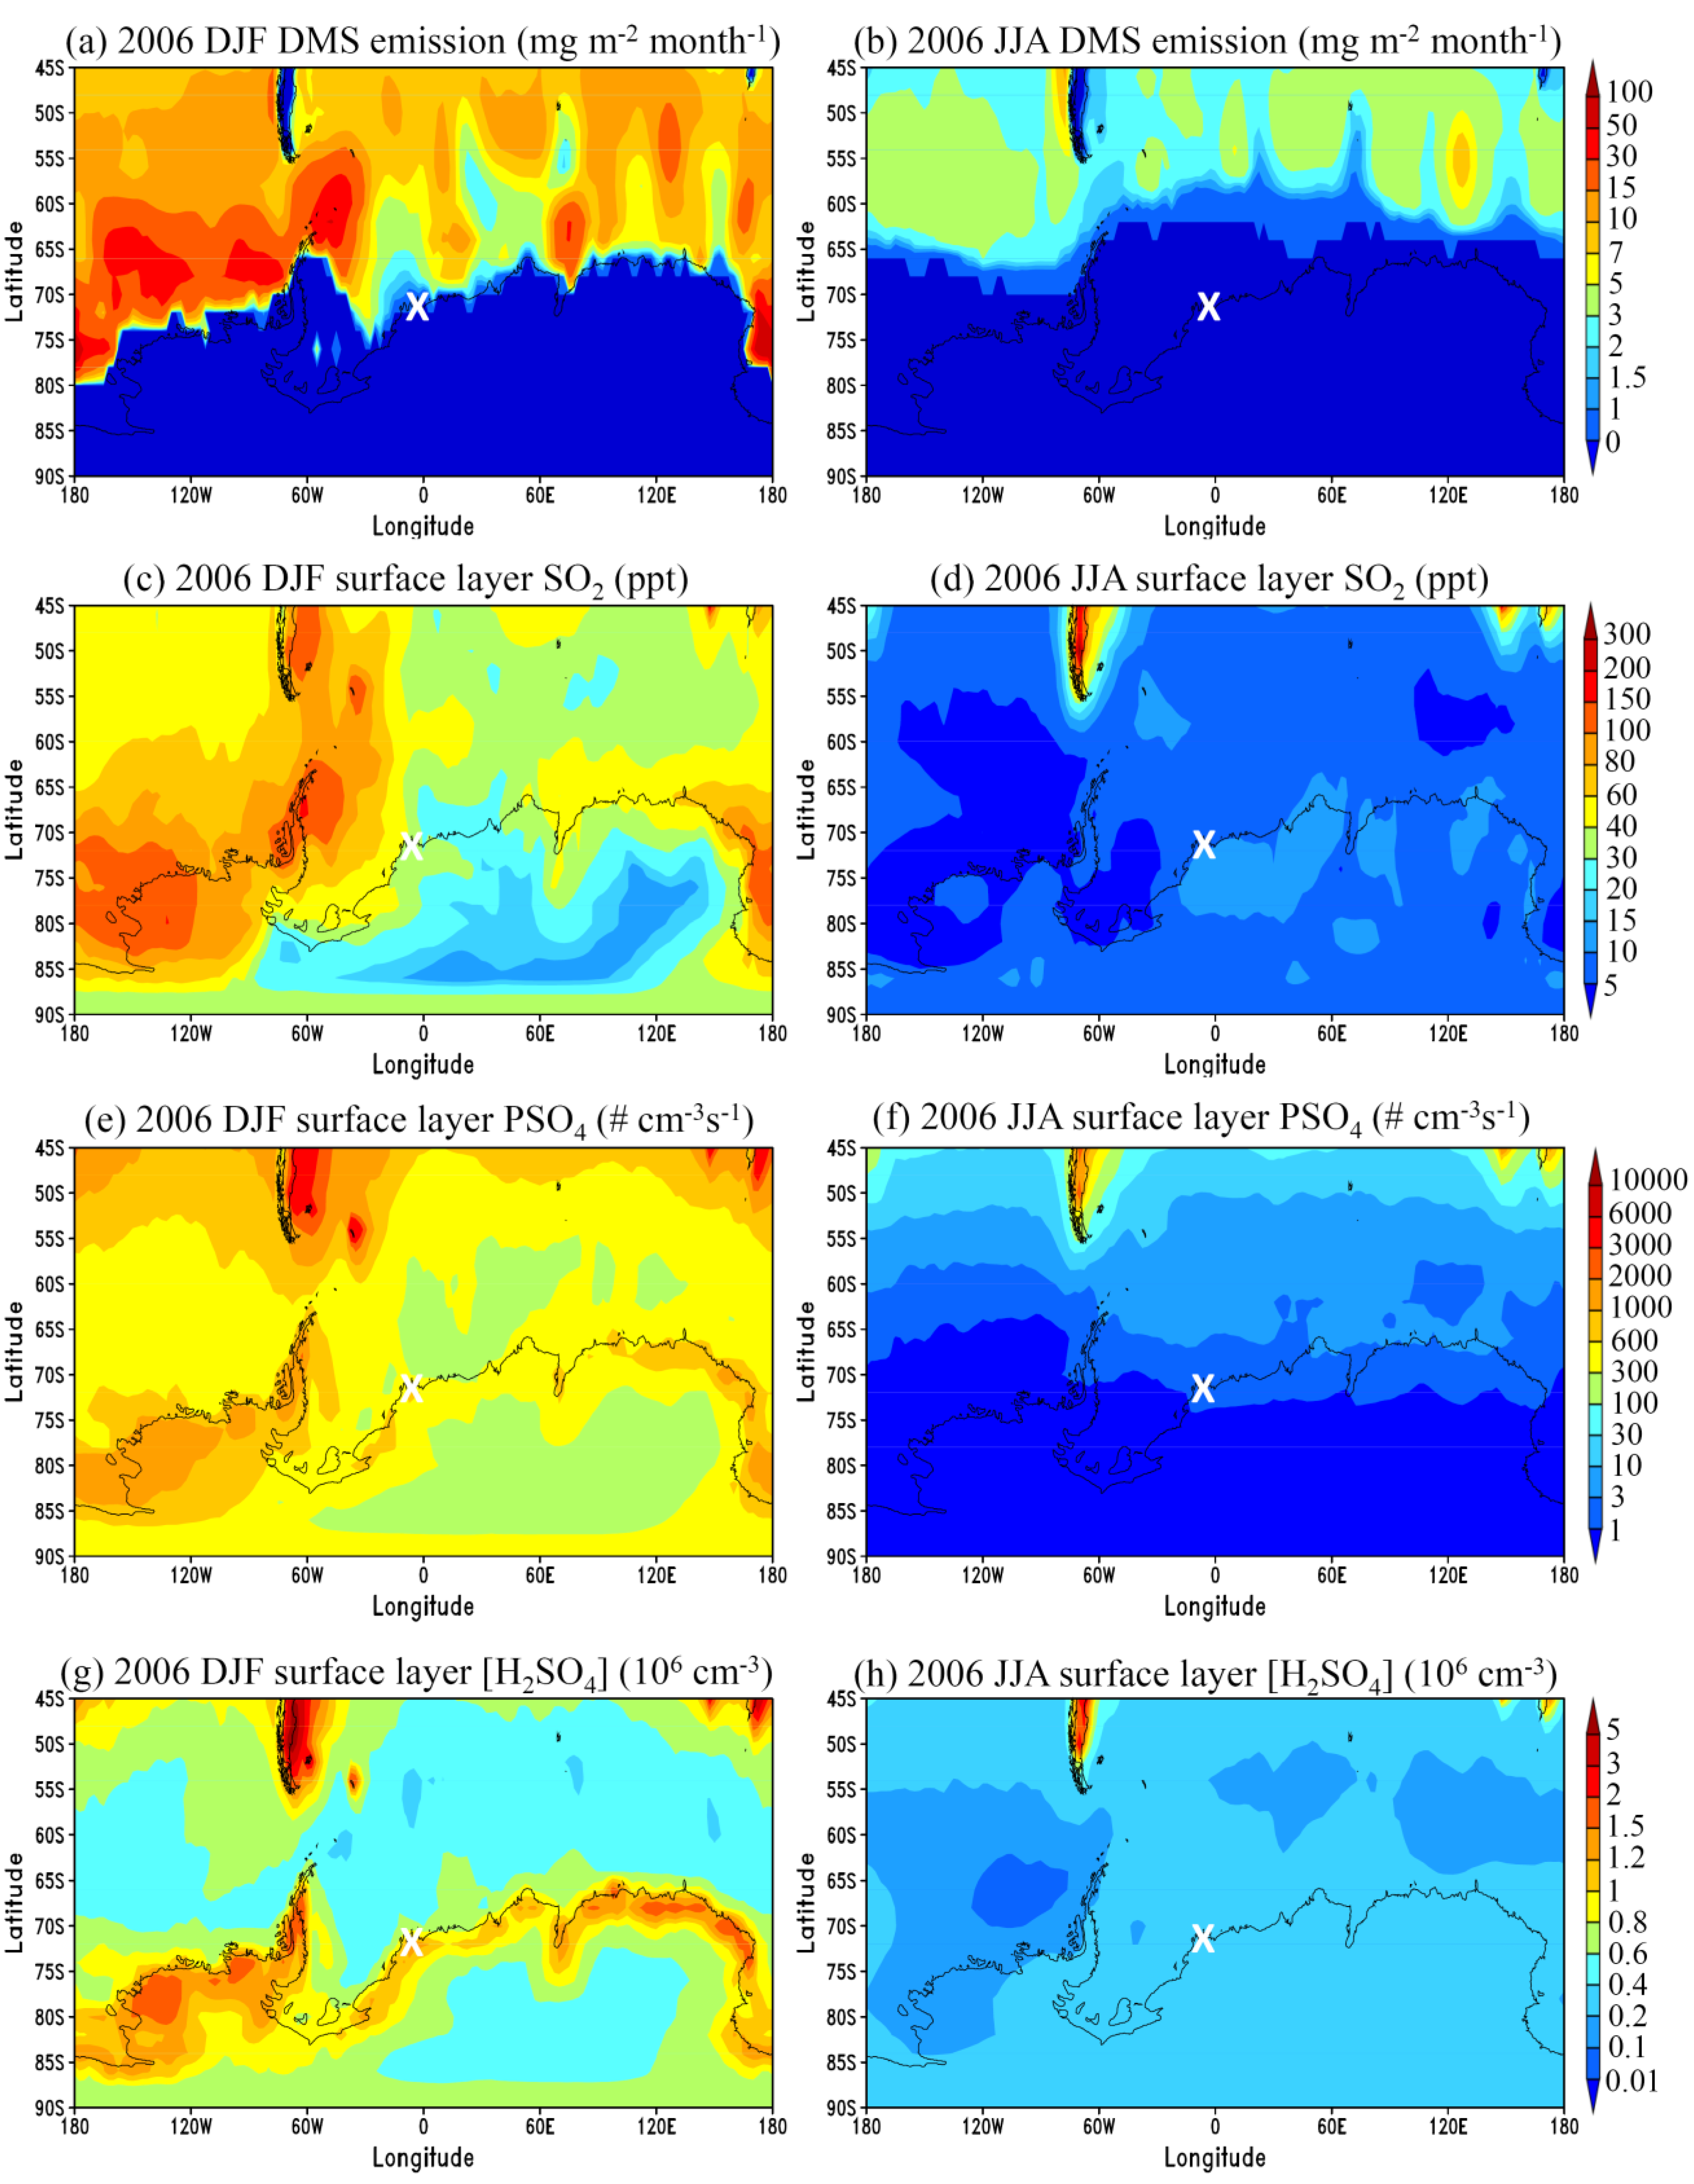
3.1. General Features

Figure 1 shows the simulated seasonally-averaged DMS emission rate, SO2 concentration ([SO2]), H2SO4 gas photochemical production rate (PH2SO4), and [H2SO4] for the austral summer (DJF) and winter (JJA) seasons in the surface layer over Antarctica and the surrounding ocean. Due to the sea ice formation, DMS emission near the coastal regions (~65°S and South) is essentially zero in the winter (JJA). The melting of ice during DJF leads to significant DMS emission, with a rate exceeding 30 mg m−2 month−1 near the western Antarctic coastal regions. In most parts of the Southern Ocean, DMS emission rates during the austral summer are a factor of 3–10 higher than those during the austral winter. As a result of higher DMS emission and stronger photochemistry associated with the increased sunlight, [SO2], PH2SO4, and [H2SO4] concentrations are enhanced significantly in the austral summer season. Seasonal mean [SO2] during DJF can reach over 100 ppt, PH2SO4 over 1000 # cm−3 s−1, and [H2SO4] over 1.2 × 106 cm−3 around the western Antarctica coastal regions. In contrast, seasonal mean [SO2] during JJA is below 15 ppt, PH2SO4 below 10 cm−3 s−1, and [H2SO4] below 4 × 105 cm−3 in the surface layer over Antarctica and the Southern Ocean.
The enhanced DMS emission, photochemistry, and [H2SO4] lead to significant new particle formation and much higher total particle number concentrations in the surface layer over Antarctica and the surrounding ocean during the Austral summer season, which can be clearly seen in Figure 2. It is interesting to note that the predicted highest nucleation rates are confined around the coastline (Figure 2a, which is consistent with measurements [13,14]. Our model reveals that the association of nucleation with coastal areas is a result of high PH2SO4 (Figure 1e), relatively lower condensation sink (CS) (not shown), and high [H2SO4] (Figure 1g) in these regions. In the surface layer over most parts of the Southern Ocean, nucleation rates are small because of relatively lower [H2SO4] caused by high surface areas associated with increased sea salt particles. The seasonal mean concentration of the condensation nuclei larger than 3 nm (CN3) reaches above ~2000 cm−3 in the surface layer around the coastal areas during the austral summer season, with large horizontal gradients around the coastline. This is in dramatic contrast with those of the winter season where CN3 is generally in the range of 50–200 cm−3 and increases with decreasing latitude. There also exist significant seasonal variations of the number concentration of condensation nuclei larger than 10 nm (CN10) and CCN at water supersaturation of 0.4% (CCN0.4, corresponding to dry diameter of ~60 nm). The seasonal mean CN10 and CCN0.4 in the surface layer over the Antarctic and coastal regions are respectively in the range of 300–1500 cm−3 and 60–200 cm−3 during the austral summer, and are respectively in the range of 50–150 cm−3 and 20–60 cm−3 during the austral winter. Compared to CN10, the relatively higher CCN0.4 seen over the Southern Ocean for both seasons (especially the winter season) are due to the high sea salt particle emissions.
Figure 1. Simulated seasonal averages of (for year 2006) DMS emission rate, SO2 concentration ([SO2]), H2SO4 gas photochemical production rate (PH2SO4), and H2SO4 gas concentration ([H2SO4]) during the austral summer (DJF) and winter (JJA) seasons in the surface layer over Antarctica and surrounding oceans. The location of the German Neumayer station (70°40’S, 008°16’W) is marked with “X” in each panel.
Atmosphere 01 00034 g001
Figure 2. Simulated IMN rate (JIMN), total concentrations of the condensation nuclei larger than 3 nm (CN3) and 10 nm (CN10), and total concentrations of CCN at water supersaturation of 0.4% (CCN0.4) during the austral summer (DJF) and winter (JJA) seasons (seasonally-averaged for year 2006) in the surface layer over Antarctica and surrounding oceans. The location of the German Neumayer station (70°40’S, 008°16’W) is marked with “X” in each panel.
Atmosphere 01 00034 g002

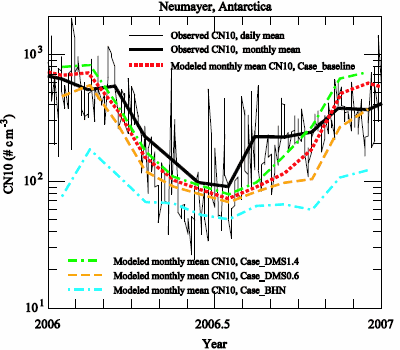
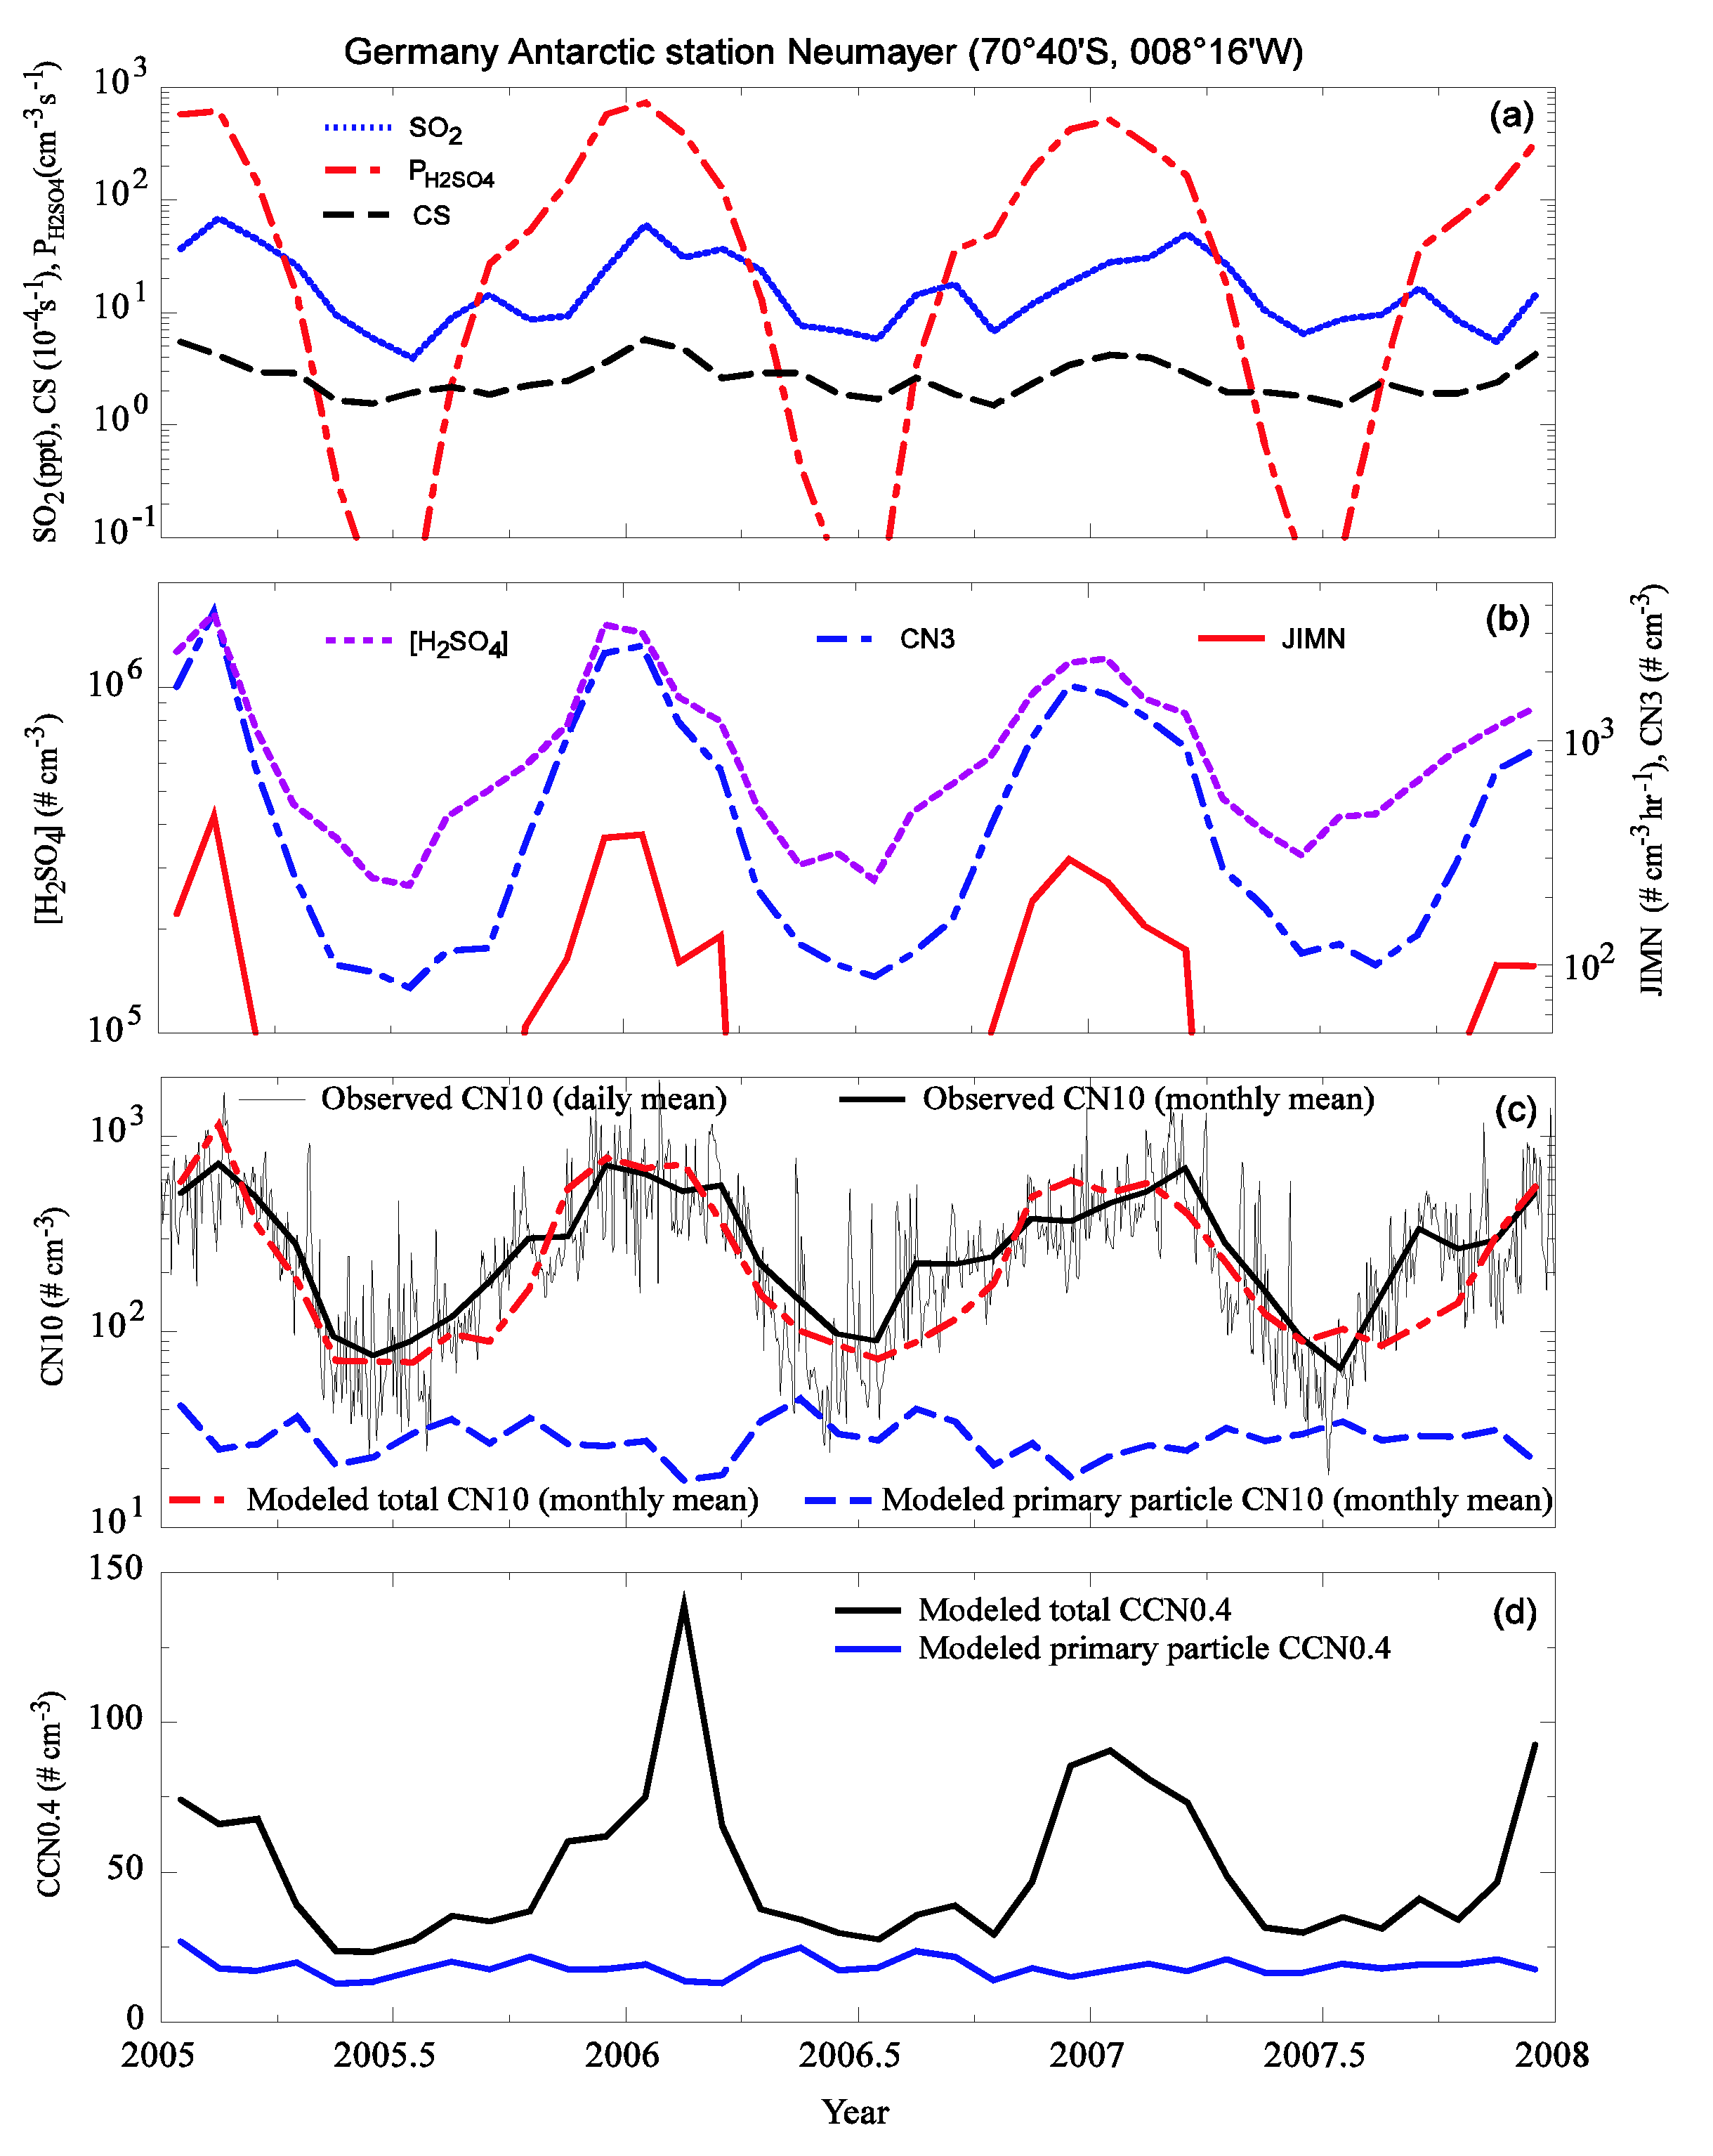
3.2. Comparison to Long-term Measurements

As mentioned in the Introduction, significant seasonal variations of new particle formation and particle number concentration have been observed in Antarctica. CN10 has been continuously measured at the German Antarctic station Neumayer (70°40’S, 008°16’W) [46] since 1993. The coastal Antarctic station Neumayer is 42 m above sea level and situated on the Ekstrom Ice Shelf and about 5 km from the southeast part of Atka Bay. More detailed information about the station and CN10 measurements can be found in König-Langlo et al. [47] and Weller and Lampert [48]. The long-term continuous CN10 measurements can be used to assess the ability of the model in capturing the main processes controlling particle formation and concentrations in the region. Figure 3 presents the simulated monthly mean [SO2], CS, PH2SO4, [H2SO4], JIMN, CN3, CN10, and CCN0.4 during a 3-year period (2005/01–2007/12) at the Neumayer station. The daily and monthly mean CN10 data from the Neumayer station are plotted in Figure 3c for comparison. In addition to total CN10 and CCN0.4 the contributions of primary particles (including sea salt, BC, POC, and dust) to CN10 and CCN0.4 are also shown in Figure 3c, d.
It is clear from Figure 3c that the model captures the absolute values of monthly mean CN10 (within a factor of 2–3) as well as their seasonal variations, with a Pearson correlation coefficient of 0.87 and normalized mean bias of −0.037. We can see that both model and observations indicate around a factor of 7 increase in monthly mean CN10 from July (3-year average of 82 cm−3 and 82 cm−3 for observation and model, respectively) to January (3-year average of 537 cm−3 and 595 cm−3 for observation and model, respectively). Our model simulations clearly indicate that the observed CN10 seasonal variations are due to the formation of secondary particles (via IMN) during the austral summer associated with enhanced H2SO4 production and [H2SO4] (Figure 3a, b). Primary particles (dominated by sea salt particles in the region) contribute ~30 cm−3 to total particle number concentrations and there are no obvious seasonal variations (Figure 3c, d). The peak monthly mean [H2SO4], JIMN, and total concentration of particles larger than 3 nm (CN3) at the station reach ~1–1.5 × 106 cm−3, ~100–300 cm-3hr−1, and ~1000–3000 cm−3, respectively. The rate of H2SO4-H2O IMN around Antarctica, which is lower than those in the regions under the influence of anthropogenic SO2 emission, is significant enough to cause clear seasonal variations in particle number concentrations. The good agreement of predicted seasonal variations of CN10 based on the IMN mechanism with measurements during three simulated years at the remote site free from anthropogenic pollution and leafed plants is in support of the IMN mechanism. Based on the observed evolution of the ion mobility spectrum at the Finnish Antarctica research station Aboa [19,20], ions (especially negative ions) were clearly involved in the nucleation. Asmi et al. [20] estimated that IMN contributes up to 30% of observed nucleation rates. However, as pointed out in Yu [44], the real contribution of IMN to nucleation is likely larger because the growth of neutral clusters < 2 nm resulting from ion-ion recombination (an important channel of IMN [49]) is treated as neutral nucleation in Asmi et al. [20]’s estimation. This study appears to show that the present IMN mechanism, which is based on state-of-the-art thermodynamic and laboratory data [44], can reasonably account for the new particle formation frequently observed in the Antarctica region during the austral summer.
As a result of secondary particle formation and growth, the monthly mean CS (Figure 3a) and CCN0.4 (Figure 3d) at the Neumayer station increases from ~2 × 10⁻⁴ s−1 and ~25–30 cm−3 in the austral winter to ~4 × 10⁻⁴ s−1 and 75–130 cm−3 in the austral summer. In the surface layer at the Neumayer station, secondary particles appear to contribute ~40% to total CCN0.4 in the winter and >70% in the summer. Only a very small fraction of secondary particles (<5%) can serve as CCN0.4 in the summer because of their small sizes. It should be noted that the current study doesn’t consider the oceanic VOC emissions because of large uncertainty in the estimated emission rates [45]. Depending on the strength of the oceanic VOC emission, the oxidation product of VOC may substantially enhance the growth rate of nucleated particles and hence CCN0.4 in the Antarctic and the Southern Ocean regions during the austral summer months. Further research is needed to quantify the oceanic VOC emission and its impact on the concentration of climate effective aerosols. We also noticed from Figure 3c that the model under-predicts the CN10 in August and September (by ~30–60%) for all three years. The reasons for the under-prediction remain unclear but could be caused by the uncertainty in the emission, meteorology, microphysics, and transport.
Figure 3. Simulated monthly mean [SO2], CS, PH2SO4, [H2SO4], JIMN, CN3, CN10, and CCN0.4 during a 3-year period (2005/01–2007/12) at the Neumayer station (70°40’S, 008°16’W). The daily and monthly mean CN10 data from the German Antarctic station Neumayer are plotted in Figure 3c for comparisons. In addition to total CN10 and CCN0.4, the contributions of primary particles (including sea salt, BC, POC, and dust) to CN10 and CCN0.4 are also shown in Figure 3c, d.
Atmosphere 01 00034 g003

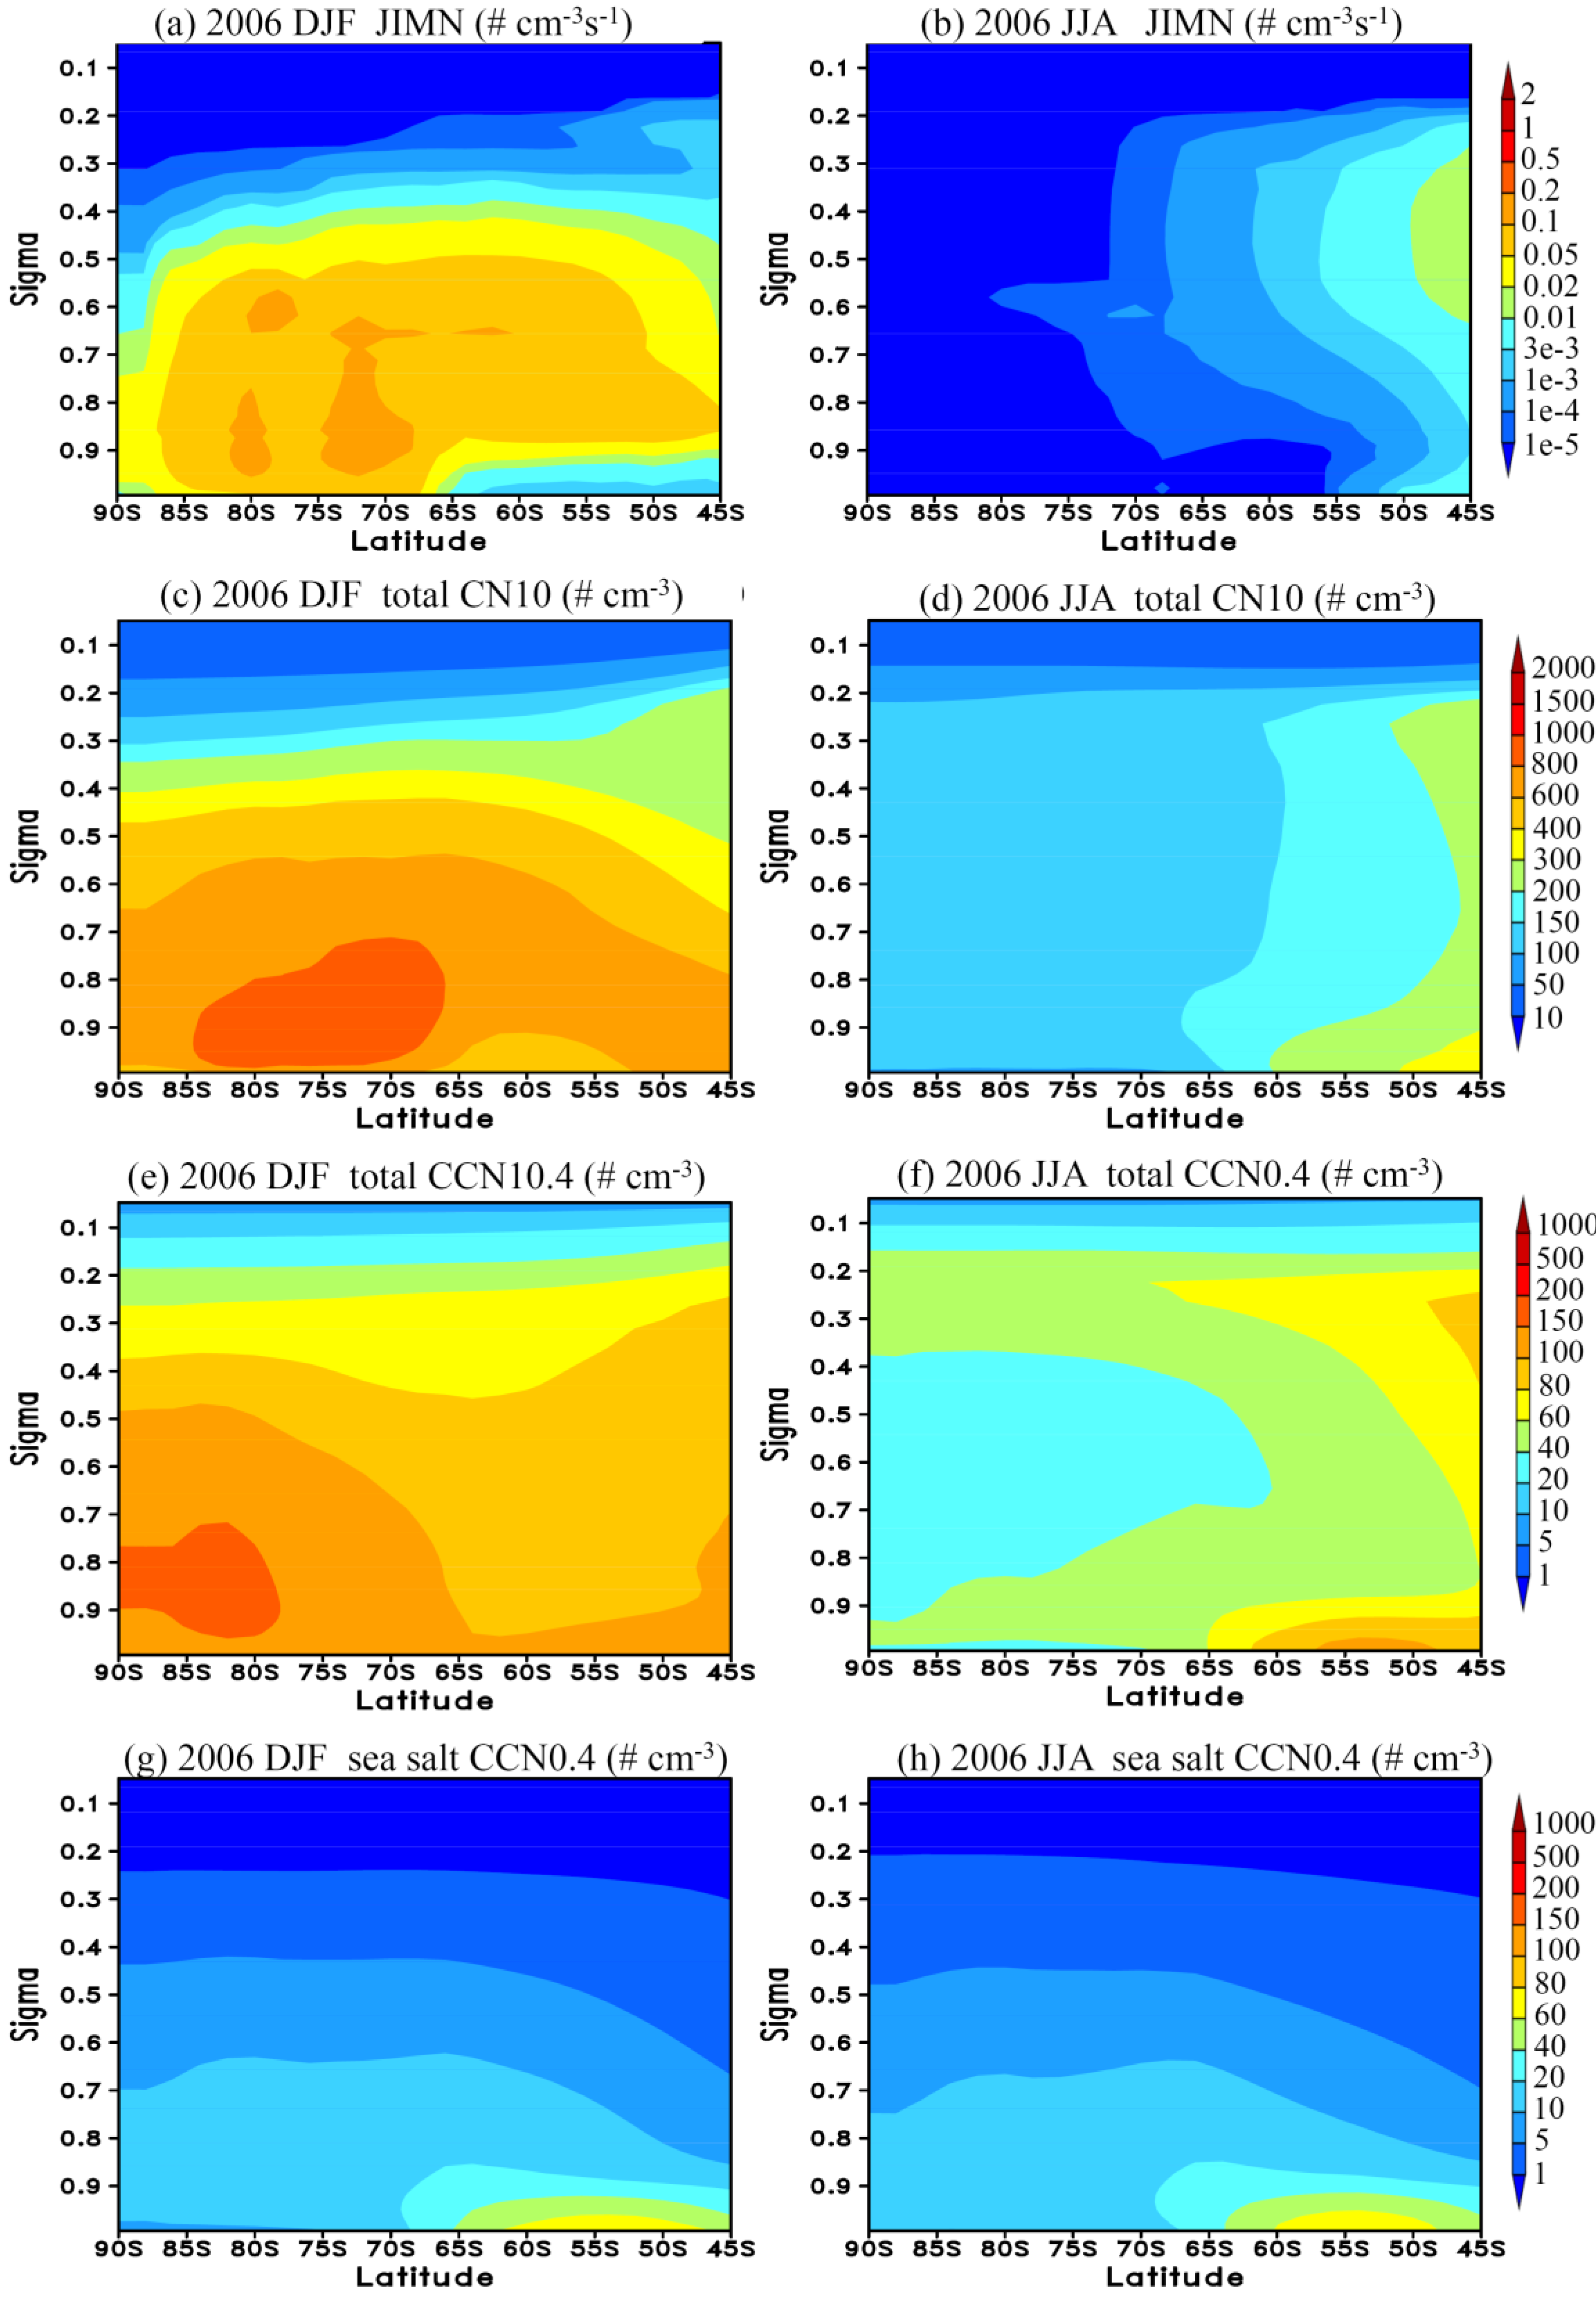
3.3. Vertical Profiles

So far our discussions have been limited to the surface layer. To look into how the formation of secondary particles during the austral summer may affect the CN and CCN abundance at higher altitude, we plot the zonally averaged vertical distributions of relevant key parameters resolved in our model. Figure 4 show the seasonal mean vertical structures of JIMN, total CN10, CCN0.4 total and CCN0.4 associated with sea-salt particles over the Antarctica and the Southern Ocean region (45 S and south) for DJF and JJA. It is clear from Figure 4 that significant new particle formation in the austral summer extends from boundary layer to ~500 mb. High concentrations of sea salt particles over the Southern Ocean are generally confined to the marine boundary layer (MBL) and there is no obvious seasonal variation in sea salt particle concentration at different altitudes (Figure 4g, h). Although nucleation is inhibited in the MBL over the Southern Ocean due to the high concentration of sea salt particles (Figure 4g), significant nucleation occurs above the MBL (Figure 4a). JIMN, CN10, and total CCN0.4 at all altitudes in the region have lowest values over the Antarctica during the austral summer season. The peak DJF-averaged JIMN, CN10, and total CCN0.4 values exceed 0.1 cm−3 s−1, 800 cm−3, and 150 cm−3, respectively. As a result of the secondary particle formation during the austral summer (DJF), the zonally averaged CN10 and CCN0.4 over Antarctica increase by a factor of ~4–6 and ~2–4 (compared to those in JJA), respectively.

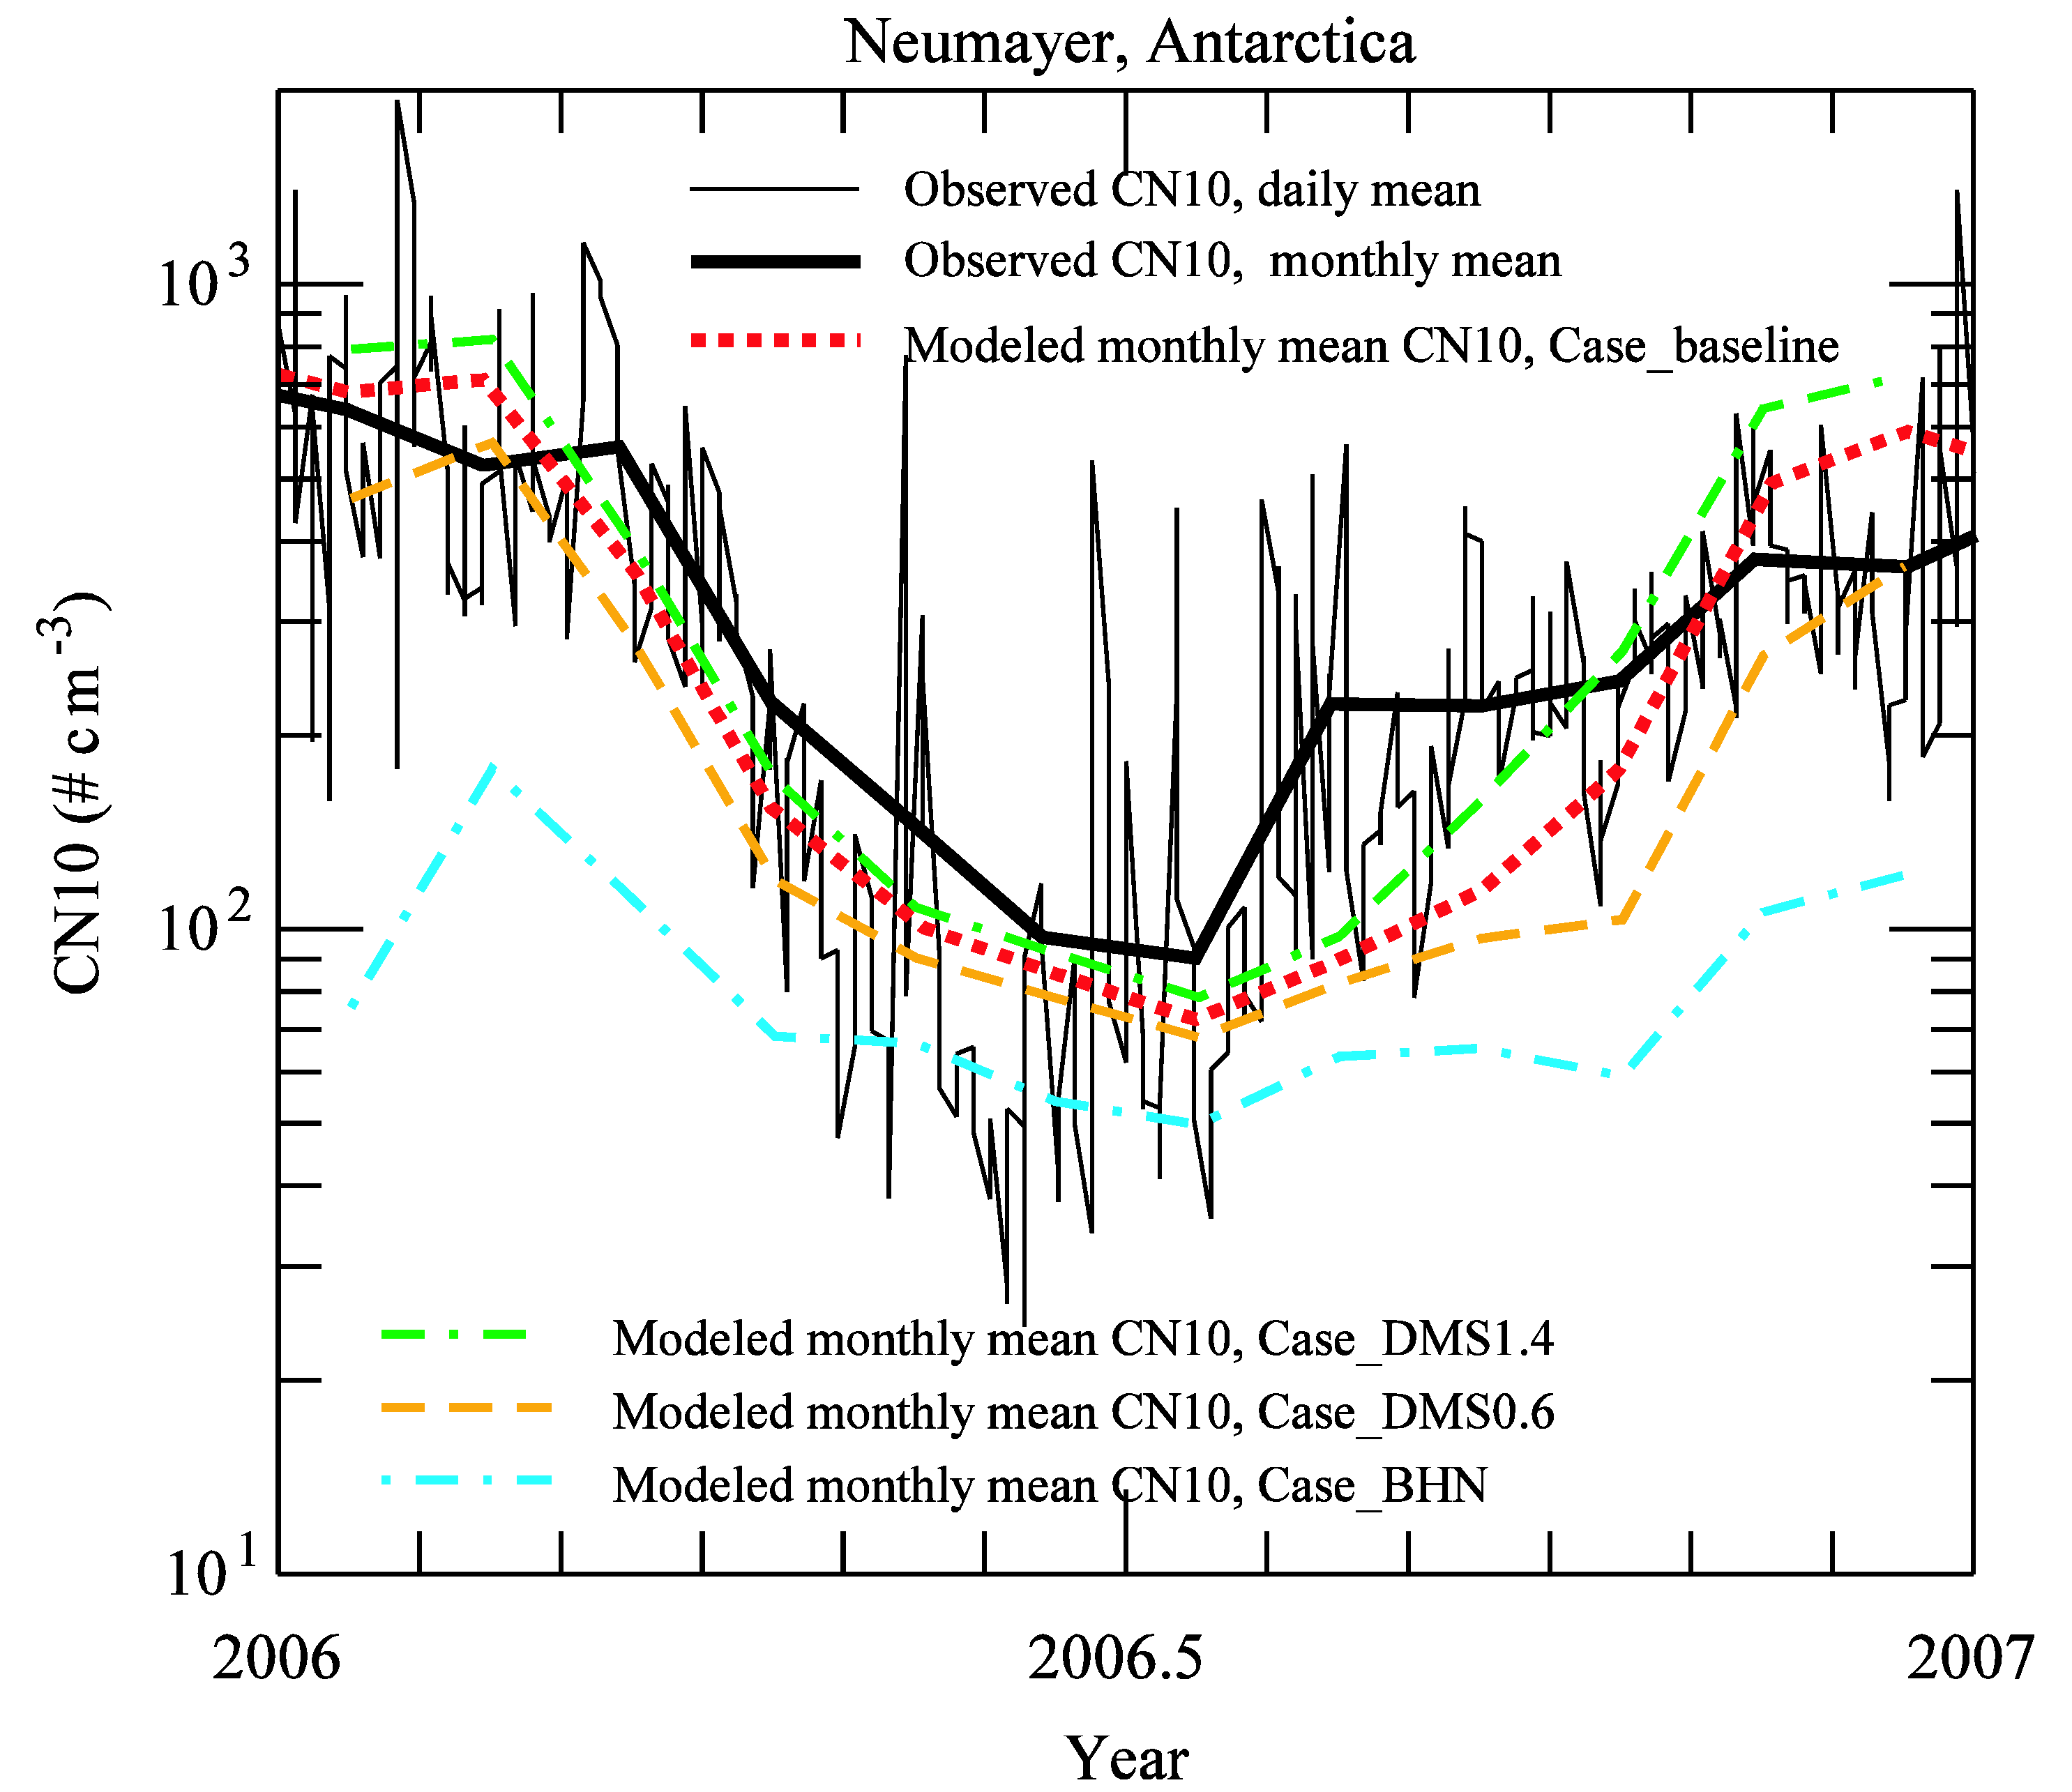
3.4. Sensitivity Study: Impact of DMS Emission Variation and Contribution of BHN

DMS emission rates and nucleation mechanisms are two of major uncertainties in current studies of new particle formation around the Antarctica. DMS emission rates have large spatial and temporal variations [42] and future climate change may significantly affect DMS emission in the Southern Oceans [5]. BHN has been widely employed to calculate new particle formation rate in previous global studies [17,24,26]. Here we carry out sensitivity study to examine the impact of DMS emission variation on Antarctic CN10 and the contribution of BHN. The empirical activation nucleation formula (J = A [H2SO4]), while has also been used in previous modeling studies to predict particle formation in the BL [24,26], is not examined here because of its known significant over-prediction of marine BL particle number concentration (by up to one order of magnitude) and large range (up to 4 orders of magnitude) in the value of pre-factor A derived from different field measurements [28].
In addition to the baseline case (Case_baseline) presented in Figure 1, Figure 2, Figure 3 and Figure 4, simulations of three sensitivity study cases have been carried for year 2006 (after two months of spin-up): (1) baseline DMS emission is scaled by 1.4 (Case_DMS1.4); (2) baseline DMS emission is scaled by 0.6 (Case_DMS0.6), (3) BHN scheme of Yu [50] (instead of IMN scheme) is used (Case_BHN). Table 1 and Figure 5 compare CN10 values observed and predicted in different cases for different months of 2006 at the Neumayer station. Pearson correlation coefficient (r) and normalized mean bias (NMB) for four different modeling cases are also given in Table 1.
Figure 4. Seasonal means of zonally averaged vertical (sigma = pressure/surface pressure) structures of JIMN, total CN10, CCN0.4 total and CCN0.4 associated with sea salt particles over the Antarctica and the Southern Ocean regions (45° S and south) for DJF and JJA.
Atmosphere 01 00034 g004
Table 1. A comparison of observed and simulated monthly mean CN10 values for different months of 2006 at the Neumayer station. Pearson correlation coefficient (r) and normalized mean bias (NMB) for four different modeling cases are also given.
monthobservationCase_Case_Case_Case_
baselineDMS1.4DMS0.6BHN
164368579846876
2527716826571178
3564358398283112
422615517212069
51491011099167
69885927954
79173796850
822589988364
92241161599766
1024417827110460
11377495646267107
12368594725367122
Average31130436421785
r0.870.850.880.67
NMB−0.020.17−0.30−0.73
Figure 5. Observed and simulated CN10 values in different months of 2006 at the Neumayer station. See text for details.
Atmosphere 01 00034 g005
It is clear from Table 1 and Figure 5 that the baseline case gives the best overall agreement with observations (r = 0.87, NMB = −0.02). Increase/decrease of DMS emission by 40% only changes the r value slightly (from 0.87 to 0.85/0.88) but influences the NMB value substantially (from −0.02 to 0.17/(−0.30)). Annual mean CN10 at the Neumayer station increases by 20% if global oceanic DMS emission increases by 40% (from 20.0 Tg S yr−1 to 28.0 Tg S yr−1) and decreases by 29% if global oceanic DMS emission decrease by 40% (from 20.0 Tg S yr−1 to 12.0 Tg S yr−1). Although the DMS climatology of Kettle et al. [40] used in GEOS-Chem is based in part on observations, the real DMS emission in different months may deviate substantially from this DMS climatology. As a result, at least some of the differences between observed and modeled CN10 values in different months (see Figure 3 and Figure 5) could be attributed to the uncertainty in the DMS emission predicted in GEOS-Chem.
The DJF monthly mean BHN rate at the Neumayer station is ~10−4 # cm−3 hr−1 (not shown) which is more than 6 orders of magnitude smaller than the corresponding IMN rate (see Figure 3b) and is completely negligible. Our predicted lack of BHN in the BL is consistent with previous analysis and modeling study [16,17]. The significant under-prediction of CN10 at the Neumayer station in Case_BHN indicates that the downward entrainment of new particles formed in the free troposphere is not bale to account for the CN10 values observed in the Antarctic BL, supporting our baseline case conclusion about the importance of IMN in the Antarctic BL.

4. Summary

The main objective of this study is to investigate the well-recognized seasonal variations of new particle formation around Antarctic coastal areas associated with DMS emissions by using a recently developed global size-resolved aerosol model and an ion-mediated nucleation (IMN) mechanism. Our simulations indicate that enhanced DMS emission, photochemistry, and [H2SO4] during the austral summer season lead to significant new particle formation and much higher particle number concentrations. The predicted highest nucleation rates are confined around the coastline, which is consistent with measurements of ultrafine particle number concentrations. The seasonal mean concentration of the condensation nuclei larger than 3 nm (CN3) increases from ~50–200 cm−3 in the austral winter (JJA) to above ~2,000 cm−3 in the austral summer (DJF) in the surface layer around the Antarctic coastal areas. There also exist significant seasonal variations of the number concentrations of condensation nuclei larger than 10 nm (CN10) and cloud condensation nuclei at water supersaturation of 0.4% (CCN0.4). The analysis of vertical structures indicates that significant new particle formation over Antarctica in the austral summer extends from the boundary layer to ~500 mb. While nucleation is generally inhibited in the marine boundary layer over the Southern Ocean due to the high concentration of sea salt particles, significant nucleation occurs above the MBL. From the austral winter to summer, the zonally averaged CN10 and CCN0.4 concentrations in the lower and middle troposphere over Antarctica increase by a factor of ~4–6 and ~2–4, respectively.
A comparison of the predicted CN10 during a three-year period (2005–2007) with the long-term continuous CN10 measurements at the German Antarctic station Neumayer shows that the model captures the absolute values of monthly mean CN10 (within a factor of 2–3) as well as their seasonal variations. Both model and observations indicate around a factor of 7 increase in seasonal mean CN10 from July to Janunary at the Neumayer station. Our model simulations clearly indicate that the observed CN10 seasonal variations are due to the formation of secondary particles during the austral summer associated with enhanced DMS emission and [H2SO4]. There are no obvious seasonal variations in the concentration of primary particles. Since the Neumayer station is almost free from anthropogenic pollutants and leafed plants and particle chemical composition analyses indicate that particles in Antarctic air mass are most acidic and consist primarily of sulfuric acid [18,19], it is reasonable to conclude that sulfuric acid dominates the particle formation and growth around the Antarctic regions. Our study appears to show that the IMN mechanism, which is based on state-of-the-art thermodynamic and laboratory data [44], can account for the new particle formation frequently observed in the Antarctic region during the austral summer. The nice agreement of predicted seasonal variations of CN10 based on IMN mechanism with measurements during all the three simulated years provides a reasonable support for the IMN mechanism. Our sensitivity studies show strong impacts of DMS emissions on CN10 values around the Antarctica and downward transport of particles formed via binary homogeneous nucleation in the free troposphere has very small contribution to the CN abundance at the Neumayer station.

Acknowledgements

This study is supported by the NASA under grant NNX08AK48G and NSF under grant AGS-0942106. The GEOS-Chem model is managed by the Atmospheric Chemistry Modeling Group at Harvard University with support from the NASA Atmospheric Chemistry Modeling and Analysis Program.

References and Notes

  1. Faloona, I. Sulfur processing in the marine atmospheric boundary layer: A review and critical assessment of modeling uncertainties. Atmos. Environ. 2009, 43, 2841–2854. [Google Scholar] [CrossRef]
  2. Charlson, R.J.; Lovelock, J.E.; Andreae, M.O.; Warren, S.G. Oceanic phytoplankton, atmospheric sulfur, cloud albedo and climate. Nature 1987, 326, 655–661. [Google Scholar] [CrossRef]
  3. Bopp, L.; Boucher, O.; Aumont, O.; Belviso, S.; Dufresne, J.L.; Pham, M.; Monfray, P. Will marine dimethylsulfide emissions amplify or alleviate global warming? A model study. Can. J. Fish. Aquat. Sci. 2004, 61, 826–835. [Google Scholar] [CrossRef]
  4. Gunson, J.R.; Spall, S.A.; Anderson, T.R.; Jones, A.; Totterdell, I.J.; Woodage, M.J. Climate sensitivity to ocean dimethylsulphide emissions. Geophys. Res. Lett. 2006, 33, L07701. [Google Scholar]
  5. Kloster, S.; Six, K.D.; Feichter, J.; Maier-Reimer, E.; Roeckner, E.; Wetzel, P.; Stier, P.; Esch, M. Response of dimethylsulfide (DMS) in the ocean and atmosphere to global warming. J. Geophys. Res. 2007, 112, G03005. [Google Scholar]
  6. Ayers, G.P.; Cainey, J.M. The CLAW hypothesis: a review of the major developments. Environ. Chem. 2007, 4, 366–374. [Google Scholar] [CrossRef]
  7. Hogan, A.W. Antarctic aerosols. J. App. Met. 1975, 14, 550–559. [Google Scholar] [CrossRef]
  8. Bigg, E.K.; Gras, J.L.; Evans, C. Origins of Aitken particles in remote regions of the southern hemisphere. J. Atmos. Chem. 1984, 1, 203–214. [Google Scholar] [CrossRef]
  9. Shaw, G.E. Antarctic aerosols: A review. Rev. Geophys. 1988, 26, 89–112. [Google Scholar] [CrossRef]
  10. Jaenicke, R.; Dreiling, V.; Lehmann, E.; Koutsenoguii, P.K.; Stingl, J. Condensation nuclei at the German Antarctic station “Georg von Neumayer”. Tellus. Ser. B 1992, 44, 311–317. [Google Scholar]
  11. Ito, T. Size distribution of Antarctic submicron aerosols. Tellus. Ser. B 1993, 45, 145–159. [Google Scholar]
  12. Gras, J.L. Condensation nucleus size distribution at Mawson, Antarctica: Microphysics and chemistry. Atmos. Environ., Part A 1993, 27, 1417–1425. [Google Scholar] [CrossRef]
  13. Koponen, I.K.; Virkkula, A.; Hillamo, R.; Kerminen, V.-M.; Kulmala, M. Number size distributions and concentrations of marine aerosols: Observations during a cruise between the English Channel and the coast of Antarctica. J. Geophys. Res. 2002, 107, 4753. [Google Scholar] [CrossRef]
  14. Koponen, I.K.; Virkkula, A.; Hillamo, R.; Kerminen, V.-M.; Kulmala, M. Number size distributions and concentrations of the continental summer aerosols in Queen Maud Land, Antarctica. J. Geophys. Res. 2003, 108, 4587. [Google Scholar] [CrossRef]
  15. Deshpande, C.G.; Kamra, A.K. Physical properties of aerosols at Maitri, Antarctica. Proc. Indian Acad. Sci. (Earth Planet Sci.) 2004, 113, 1–25. [Google Scholar]
  16. Park, J.; Sakurai, H.; Vollmers, K.; McMurry, P.H. Aerosol size distributions measured at the South Pole during previous termISCATnext term 2000. Atmos. Environ. 2004, 38, 5493–5500. [Google Scholar] [CrossRef]
  17. Korhonen, H.; Carslaw, K.S.; Spracklen, D.V.; Mann, G.W.; Woodhouse, M.T. Influence of oceanic dimethyl sulfide emissions on cloud condensation nuclei concentrations and seasonality over the remote Southern Hemisphere oceans: A global model study. J. Geophys. Res. 2008, 113, D15204. [Google Scholar] [CrossRef]
  18. O’Dowd, C.D.; Lowe, J.A.; Smith, M.H.; Davison, B.; Hewitt, C.N.; Harrison, R.M. Biogenic sulphur emissions and inferred non-sea-salt-sulphate cloud condensation nuclei in and around Antarctica. J. Geophys. Res. 1997, 102, 12839–12854. [Google Scholar] [CrossRef]
  19. Virkkula, A.; Teinilä, K.; Hillamo, R.; Kerminen, V.-M.; Saarikoski, S.; Aurela, M.; Koponen, I. K.; Kulmala, M. Chemical size distributions of boundary layer aerosol over the Atlantic Ocean and at an Antarctic site. J. Geophys. Res. 2006, 111, D05306. [Google Scholar]
  20. Asmi, E.; Frey, A.; Virkkula, A.; Ehn, M.; Manninen, H.E.; Timonen, H.; Tolonen-Kivimäki, O.; Aurela, M.; Hillamo, R.; Kulmala, M. Hygroscopicity and chemical composition of Antarctic sub-micrometre aerosol particles and observations of new particle formation. Atmos. Chem. Phys. 2010, 10, 4253–4271. [Google Scholar] [CrossRef]
  21. Spracklen, D.V.; Carslaw, K. S.; Kulmala, M.; Kerminen, V. M.; Sihto, S. L.; Riipinen, I.; Merikanto, J.; Mann, G. W.; Chipperfield, M. P.; Wiedensohler, A.; Birmili, W.; Lihavainen, H. Contribution of particle formation to global cloud condensation nuclei concentrations. Geophys. Res. Lett. 2008, 35, L06808. [Google Scholar]
  22. Yu, F.; Wang, Z.; Luo, G.; Turco, R.P. Ion-mediated nucleation as an important source of tropospheric aerosols. Atmos. Chem. Phys. 2008, 8, 2537–2554. [Google Scholar] [CrossRef]
  23. Makkonen, R.; Asmi, A.; Korhonen, H.; Kokkola, H.; Järvenoja, S.; Räisänen, P.; Lehtinen, K. E. J.; Laaksonen, A.; Kerminen, V.-M.; Järvinen, H.; Lohmann, U.; Bennartz, R.; Feichter, J.; Kulmala, M. Sensitivity of aerosol concentrations and cloud properties to nucleation and secondary organic distribution in ECHAM5-HAM global circulation model. Atmos. Chem. Phys. 2009, 9, 1747–1766. [Google Scholar] [CrossRef]
  24. Wang, M.; Penner, J.E. Aerosol indirect forcing in a global model with particle nucleation. Atmos. Chem. Phys. 2009, 9, 239–260. [Google Scholar] [CrossRef]
  25. Pierce, J.R.; Adams, P.J. Uncertainty in global CCN concentrations from uncertain aerosol nucleation and primary emission rates. Atmos. Chem. Phys. 2009, 9, 1339–1356. [Google Scholar] [CrossRef]
  26. Merikanto, J.; Spracklen, D.V.; Mann, G.W.; Pickering, S.J.; Carslaw, K.S. Impact of nucleation on global CCN. Atmos. Chem. Phys. 2009, 9, 8601–8616. [Google Scholar] [CrossRef]
  27. Yu, F.; Luo, G. Simulation of particle size distribution with a global aerosol model: Contribution of nucleation to aerosol and CCN number concentrations. Atmos. Chem. Phys. 2009, 9, 7691–7710. [Google Scholar] [CrossRef]
  28. Yu, F.; Luo, G.; Bates, T.; Anderson, B.; Clarke, A.; Kapustin, V.; Yantosca, R.; Wang, Y.; Wu, S. Spatial distributions of particle number concentrations in the global troposphere: Simulations, observations, and implications for nucleation mechanisms. J. Geophys. Res. 2010, 115, D17205. [Google Scholar] [CrossRef]
  29. Vallina, S.M.; Simó, R.; Gassó, S. What controls CCN seasonality in the Southern Ocean? A statistical analysis based on satellite-derived chlorophyll and CCN and model-estimated OH radical and rainfall. Global Biogeochem. Cycles 2006, 20, GB1014. [Google Scholar]
  30. Meskhidze, N.; Nenes, A. Phytoplankton and cloudiness in the Southern Ocean. Science 2006, 314, 1419–1423. [Google Scholar] [CrossRef]
  31. Miller, M.A.; Yuter, S.E. Lack of correlation between chlorophyll a and cloud droplet effective radius in shallow marine clouds. Geophys. Res. Lett. 2008, 35, L13807. [Google Scholar] [CrossRef]
  32. Bey, I.; D. Jacob, J.; Yantosca, R.M; Logan, J. A.; Field, B.; Fiore, A. M.; Li, Q.; Liu, H.; Mickley, L. J.; Schultz, M. Global modeling of tropospheric chemistry with assimilated meteorology: Model description and evaluation. J. Geophys. Res. 2001, 106, 23073–23096. [Google Scholar] [CrossRef]
  33. Martin, R.V.; Jacob, D.J.; Yantosca, R.M.; Chin, M.; Ginoux, P. Global and regional decreases in tropospheric oxidants from photochemical effects of aerosols. J. Geophys. Res. 2003, 108, 4097. [Google Scholar] [CrossRef]
  34. Park, R. J.; Jacob, D. J.; Field, B. D.; Yantosca, R. M.; Chin, M. Natural and transboundary pollution influences on sulfate-nitrate-ammonium aerosols in the United States: Implications for policy. J. Geophys. Res. 2004, 109, D15204. [Google Scholar] [CrossRef]
  35. Evans, M.J.; Jacob, D.J. Impact of new laboratory studies of N2O5 hydrolysis on global model budgets of tropospheric nitrogen oxides, ozone, and OH. Geophys. Res. Lett. 2005, 32, L09813. [Google Scholar]
  36. Nenes, A.; Seinfeld, J.H. Parameterization of cloud droplet formation in global climate models. J. Geoph. Res. 2003, 108, 4415. [Google Scholar] [CrossRef]
  37. Liao, H.; Henze, D.K.; Seinfeld, J.H.; Wu, S.; Mickley, L.J. Biogenic secondary organic aerosol over the United States: Comparison of climatological simulations with observations. J. Geophys. Res. 2007, 112, D06201. [Google Scholar]
  38. Bond, T.C.; Bhardwaj, E.; Dong, R.; Jogani, R.; Jung, S.; Roden, C.; Streets, D. G.; Trautmann, N. M. Historical emissions of black and organic carbon aerosol from energyrelated combustion, 1850–2000. Global Biogeochem. Cycles 2007, 21, GB2018. [Google Scholar]
  39. Zhang, Q.; Streets, D.G.; Carmichael, G.R.; He, K.B.; Huo, H.; Kannari, A.; Klimont, Z.; Park, I. S.; Reddy, S.; Fu, J. S.; Chen, D.; Duan, L.; Lei, Y.; Wang, L. T.; Yao, Z. L. Asian emissions in 2006 for the NASA INTEX-B mission. Atmos. Chem. Phys. 2009, 9, 5131–5153. [Google Scholar] [CrossRef]
  40. Kettle, A.J.; Andreae, M. O.; Amouroux, D.; Andreae, T. W.; Bates, T. S.; Berresheim, H.; Bingemer, H.; Boniforti, R.; Curran, M. A. J.; DiTullio, G. R.; Helas, G.; Jones, G. B.; Keller, M. D.; Kiene, R. P.; Leck, C.; Levasseur, M.; Malin, G.; Maspero, M.; Matrai, P.; McTaggart, A. R.; Mihalopoulos, N.; Nguyen, B. C.; Novo, A.; Putaud, J. P.; Rapsomanikis, S.; Roberts, G.; Schebeske, G.; Sharma, S.; Simo, R.; Staubes, R.; Turner, S.; Uher, G. A global database of sea surface dimethylsulfide (DMS) measurements and a procedure to predict sea surface DMS as a function of latitude, longitude, and month. Glob. Biogeochem. Cycles 1999, 13, 399–444. [Google Scholar] [CrossRef]
  41. Nightingale, P.D.; Malin, G.; Law, C.S.; Watson, A.J.; Liss, P.S.; Liddicoat, M.I.; Boutin, J.; Upstill-Goddard, R.C. In situ evaluation of air-sea exchange parameterizations using novel conservative and volatile tracers. Global Biogeochem. Cycles 2000, 14, 373–387. [Google Scholar]
  42. Woodhouse, M.T.; Carslaw, K.S.; Mann, G.W.; Vallina, S.M.; Vogt, M.; Halloran, P.R.; Boucher, O. Low sensitivity of cloud condensation nuclei to changes in the sea-air flux of dimethyl-sulphide. Atmos. Chem. Phys. 2010, 10, 7545–7559. [Google Scholar] [CrossRef] [Green Version]
  43. GEOS-Chem model webpage. Available online: http://acmg.seas.harvard.edu/geos (accessed on 2 July 2010).
  44. Yu, F. Ion-mediated nucleation in the atmosphere: Key controlling parameters, implications, and look-up table. J. Geophy. Res. 2010, 115, D03206. [Google Scholar]
  45. Luo, G.; Yu, F. A numerical evaluation of global oceanic emissions of alpha-pinene and isoprene. Atmos. Chem. Phys. 2010, 10, 20721–20738. [Google Scholar]
  46. German Antarctic station Neumayer webpage. Available online: http://www.awi.de/en/infrastructure/stations/neumayer_stations/ (accessed on 12 October 2010).
  47. König-Langlo, G.; King, J.C.; Pettré, P. Climatology of the three coastal Antarctic stations Dumont d’Urville, Neumayer, and Halley. J. Geophys. Res. 1998, 103, 10935–10946. [Google Scholar] [CrossRef]
  48. Weller, R.; Lampert, A. Optical properties and sulfate scattering efficiency of boundary layer aerosol at coastal Neumayer Station, Antarctica. J. Geophys. Res. 2008, 113, D16208. [Google Scholar] [CrossRef]
  49. Yu, F.; Turco, R.P. Case studies of particle formation events observed in boreal forests: Implications for nucleation mechanisms. Atmos. Chem. Phys. 2008, 8, 6085–6102. [Google Scholar] [CrossRef]
  50. Yu, F. Updated H2SO4-H2O binary homogeneous nucleation rate look-up tables. J. Geophy. Res. 2008, 113, D24201. [Google Scholar] [CrossRef]

