The Combination of IFN β and TNF Induces an Antiviral and Immunoregulatory Program via Non-Canonical Pathways Involving STAT2 and IRF9

 , , , and
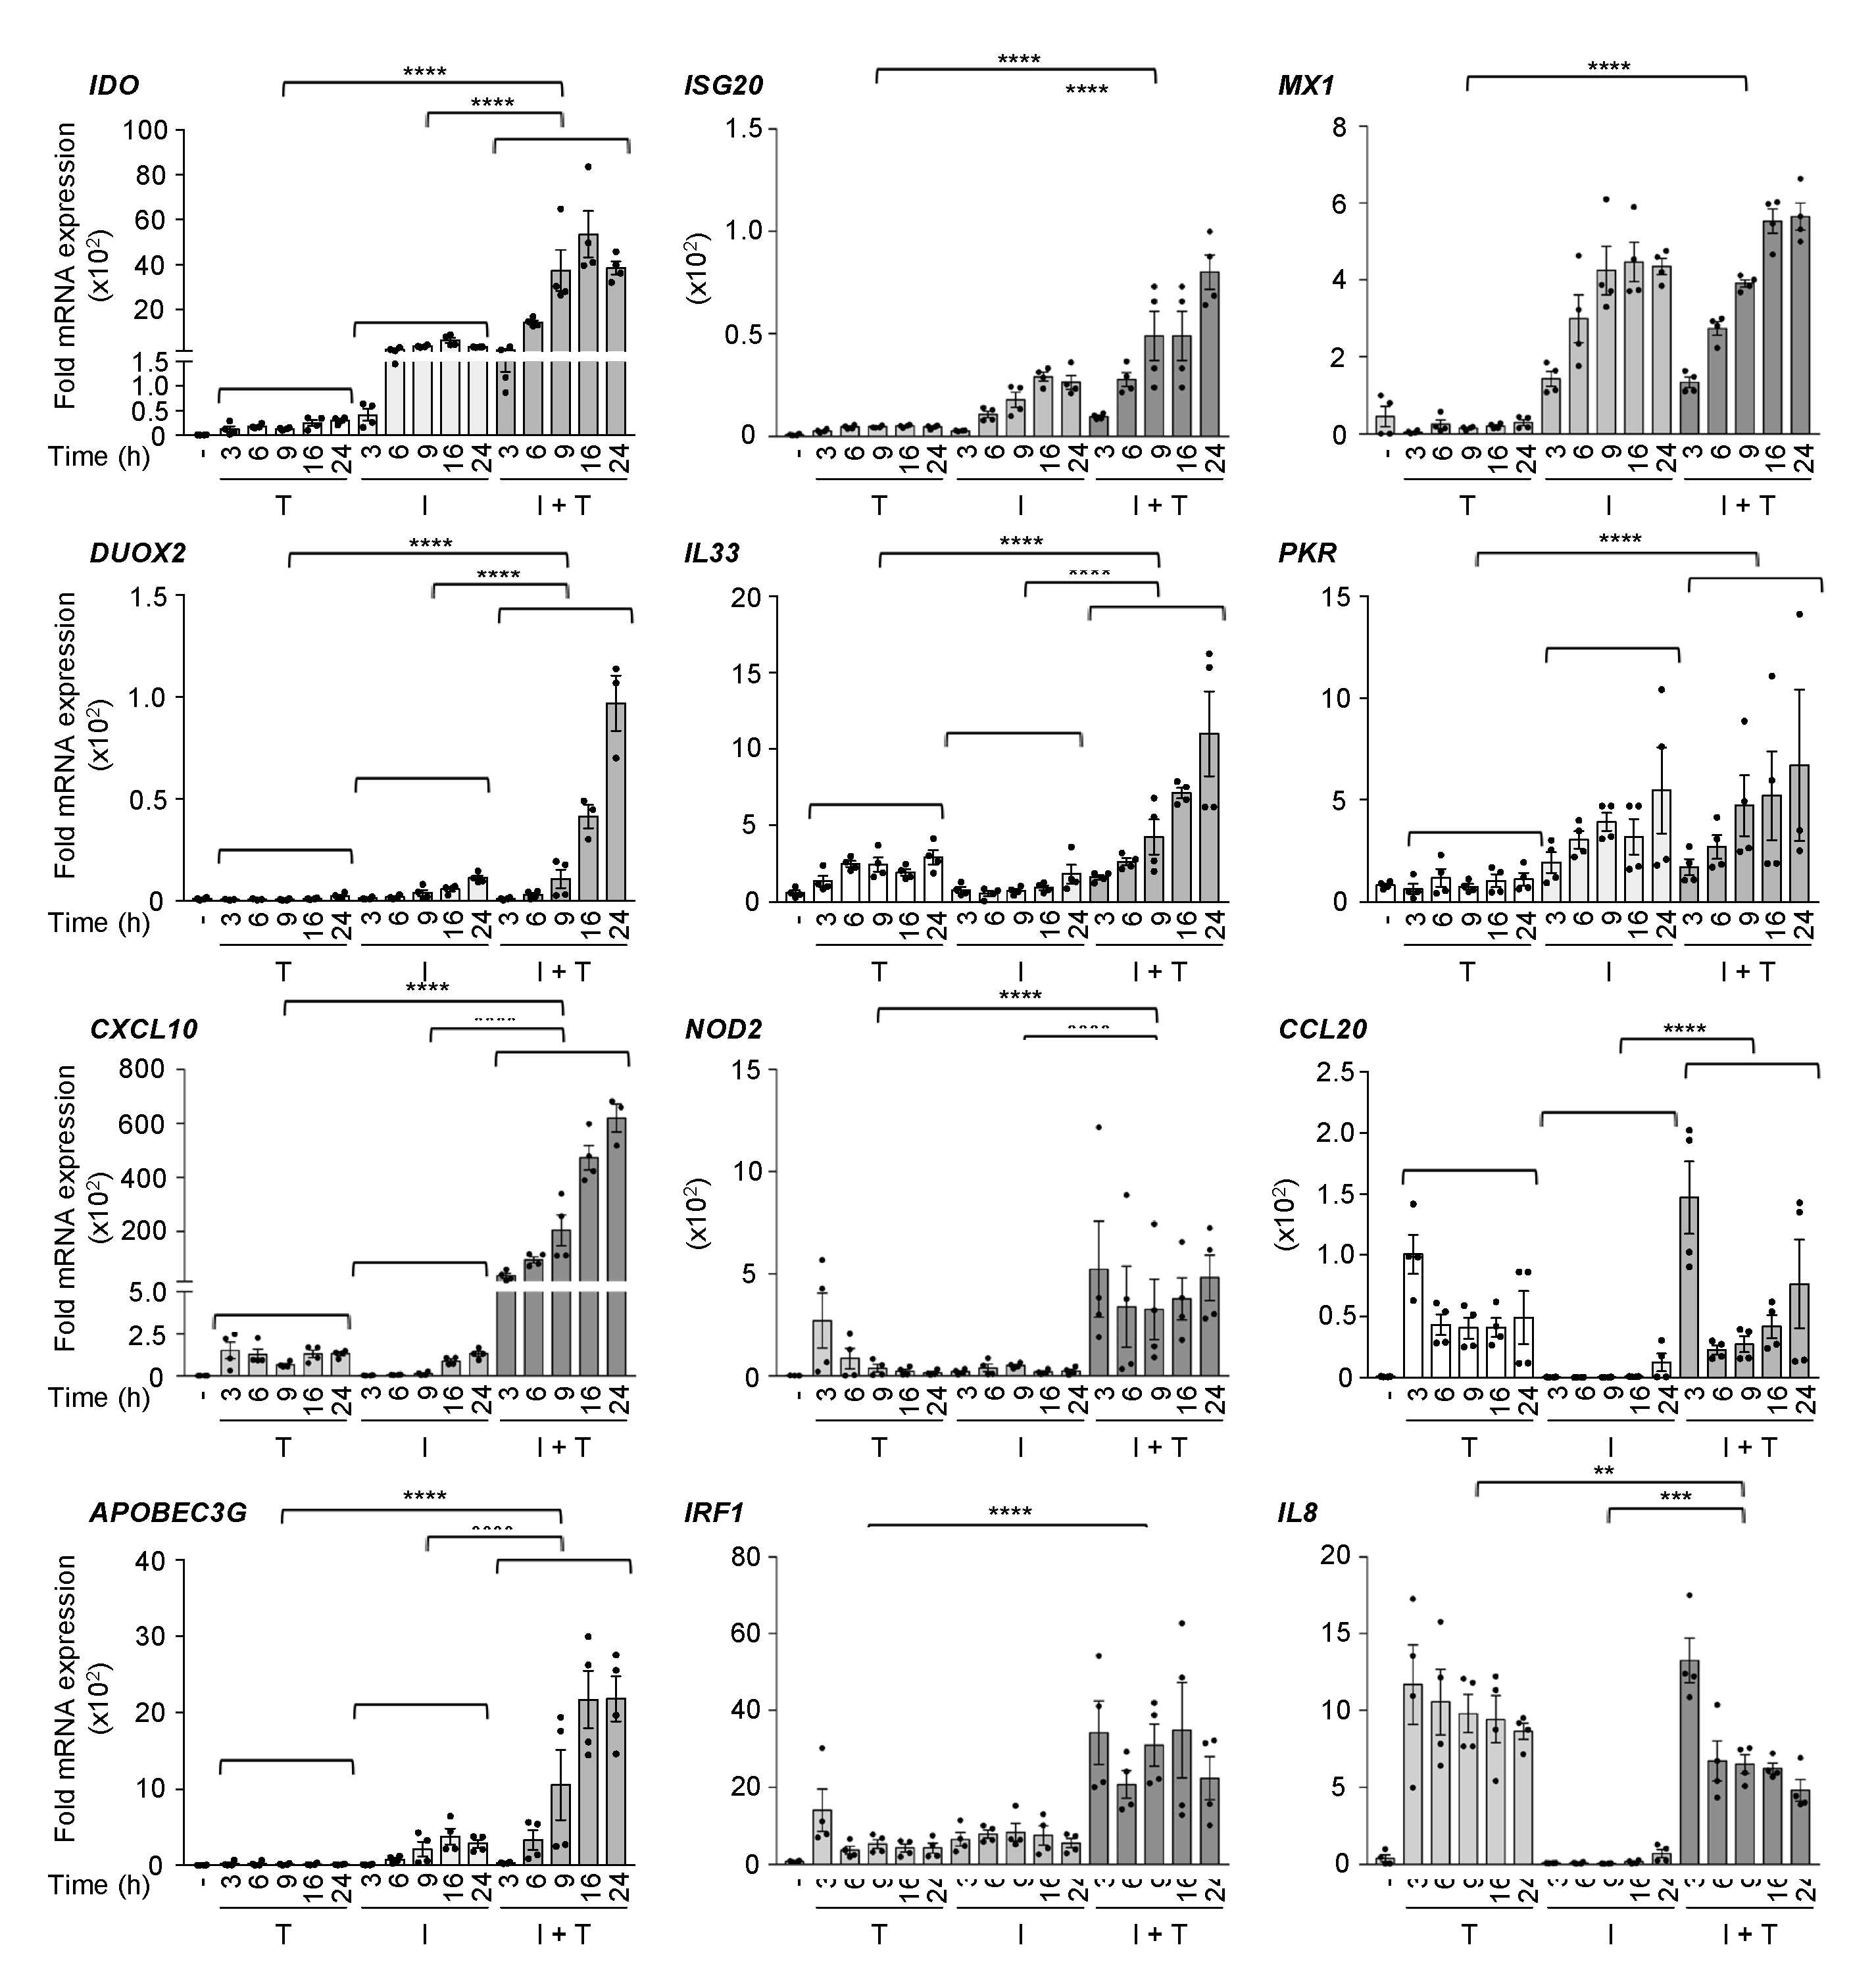
Abstract
:1. Introduction
2. Materials and Methods
2.1. Cell Culture and Stimulation
2.2. siRNA Transfection
2.3. Immunoblot Analysis
2.4. RNA Isolation and qRT-PCR Analyses
2.5. RNA-Sequencing (RNASeq)
2.6. Bioinformatics Analysis
2.7. Virus Titration by Plaque Assay
2.8. Luciferase Gene Reporter Assay
2.9. Statistical Analyses
2.10. Data and Software Availability
3. Results
3.1. Distinct Induction Profiles of Antiviral and Immunoregulatory Genes in Response to IFNβ, TNF and IFNβ + TNF
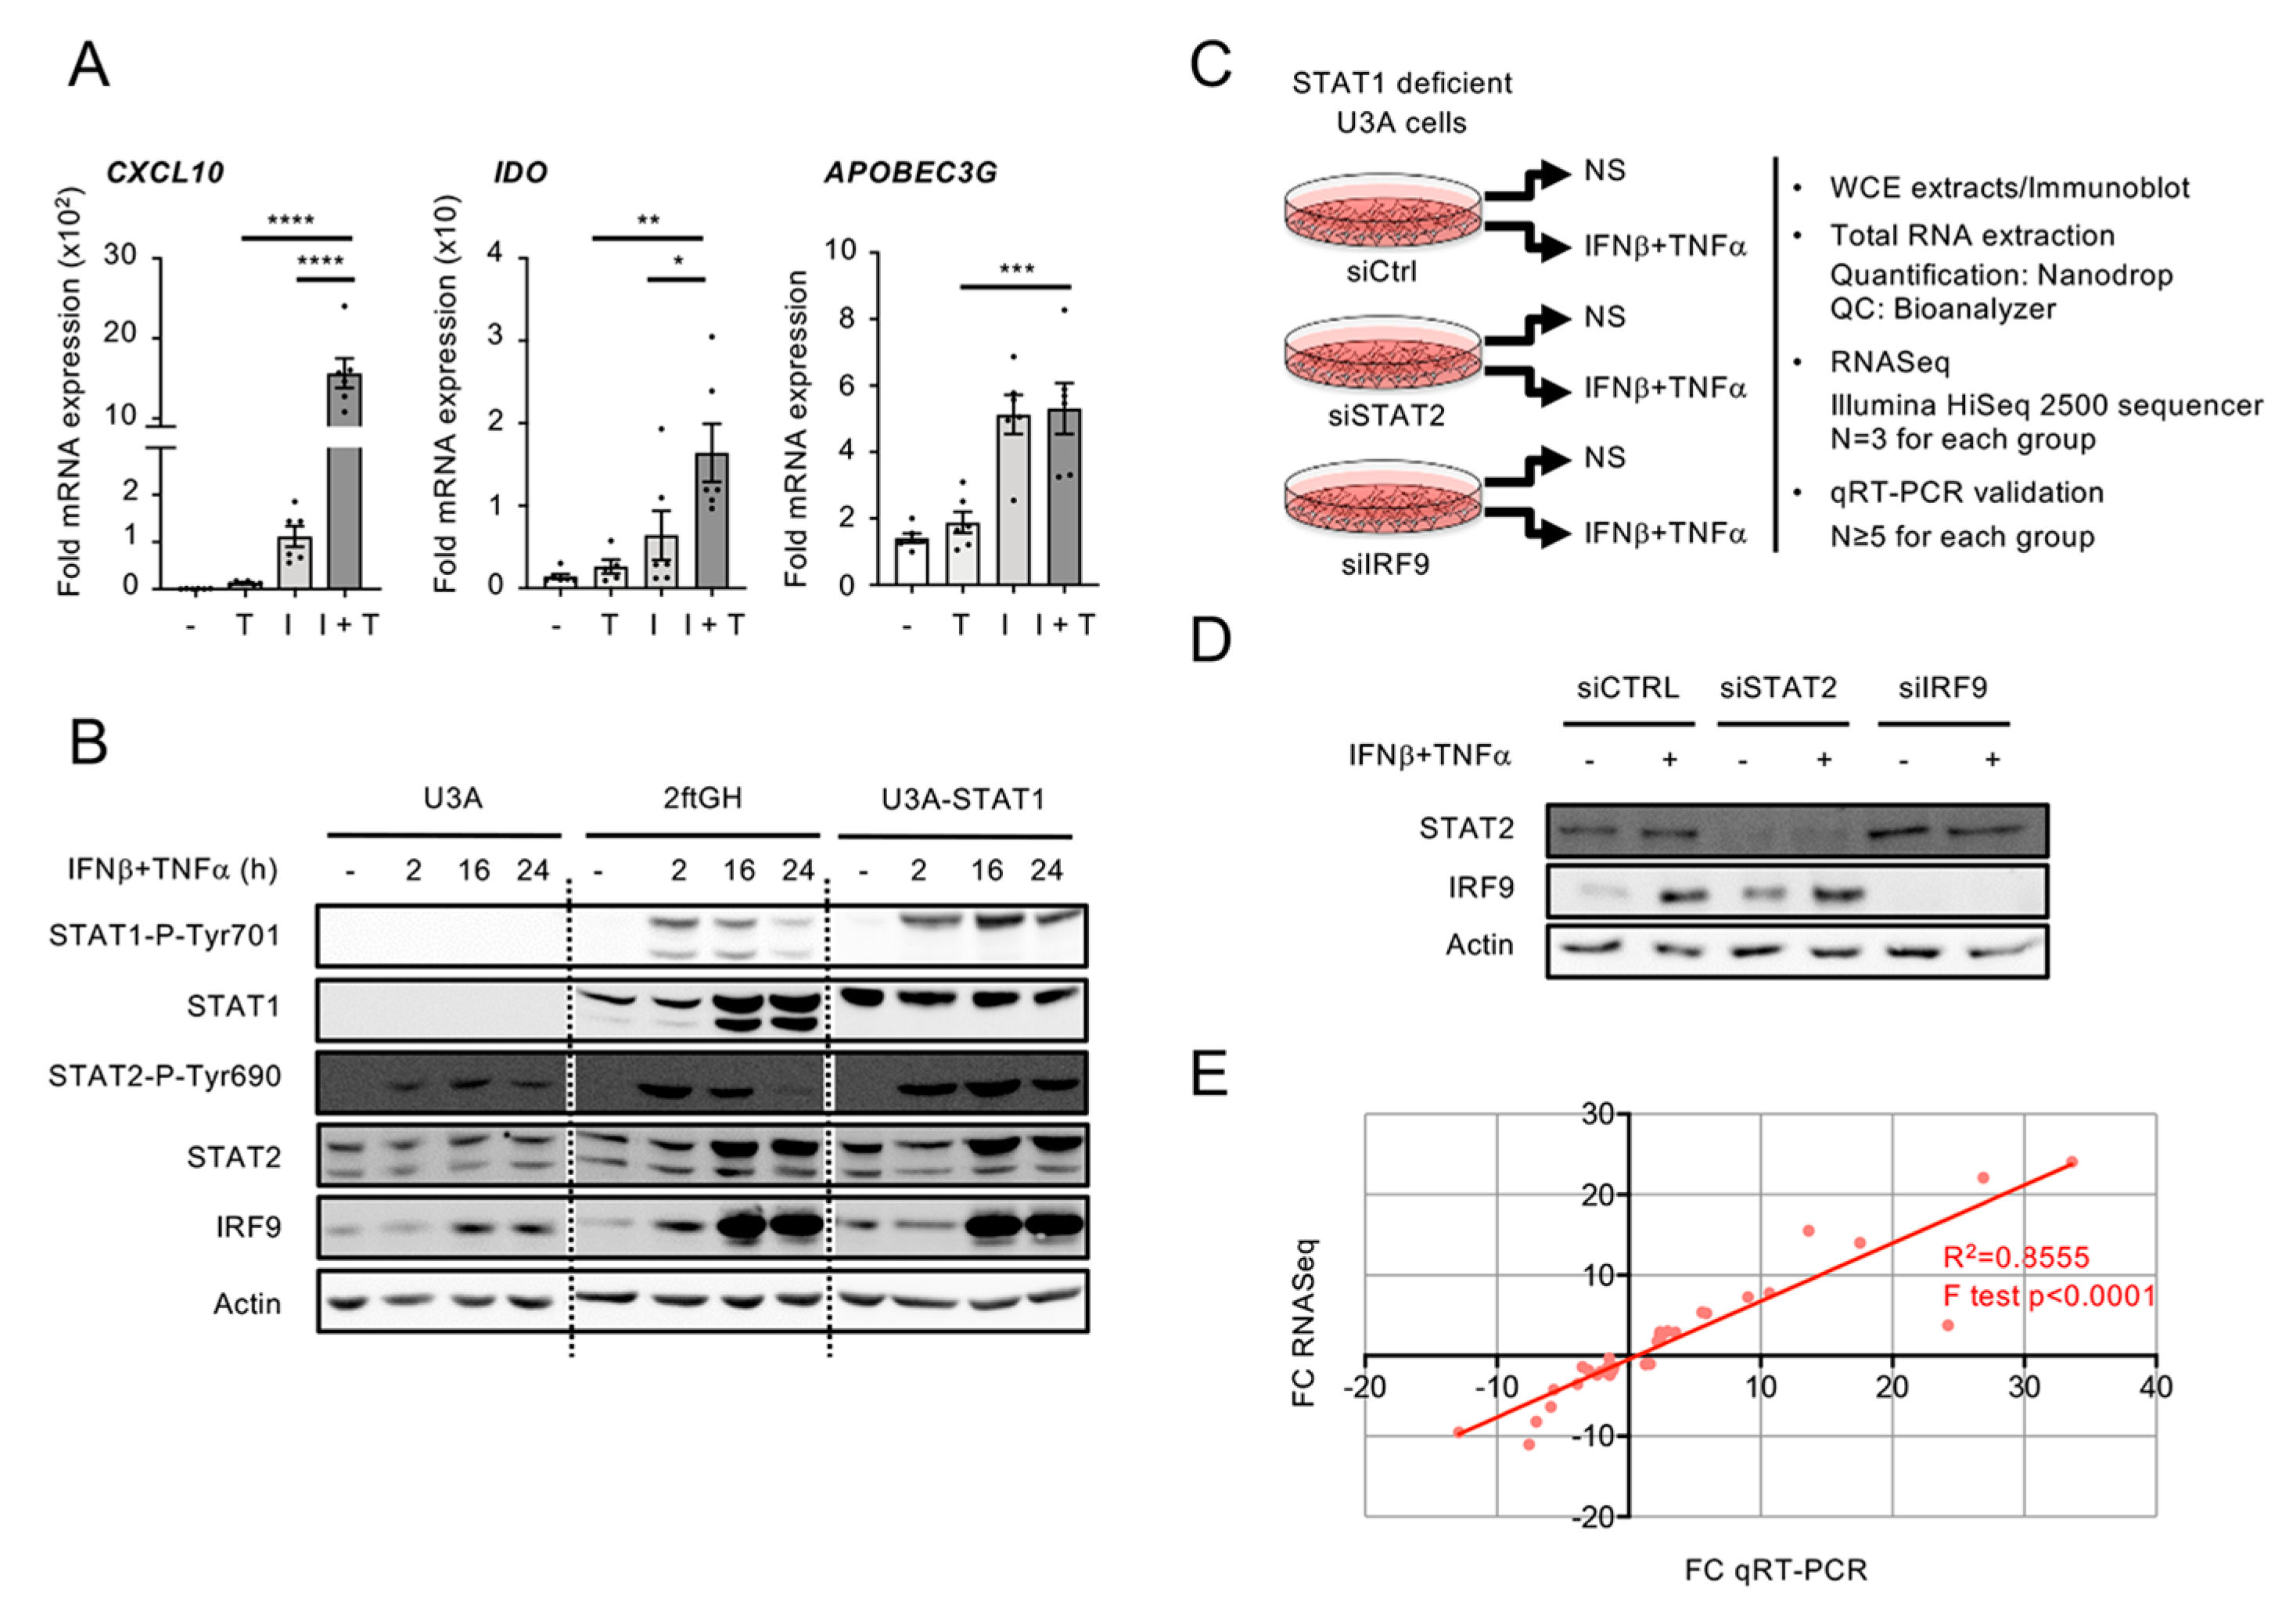
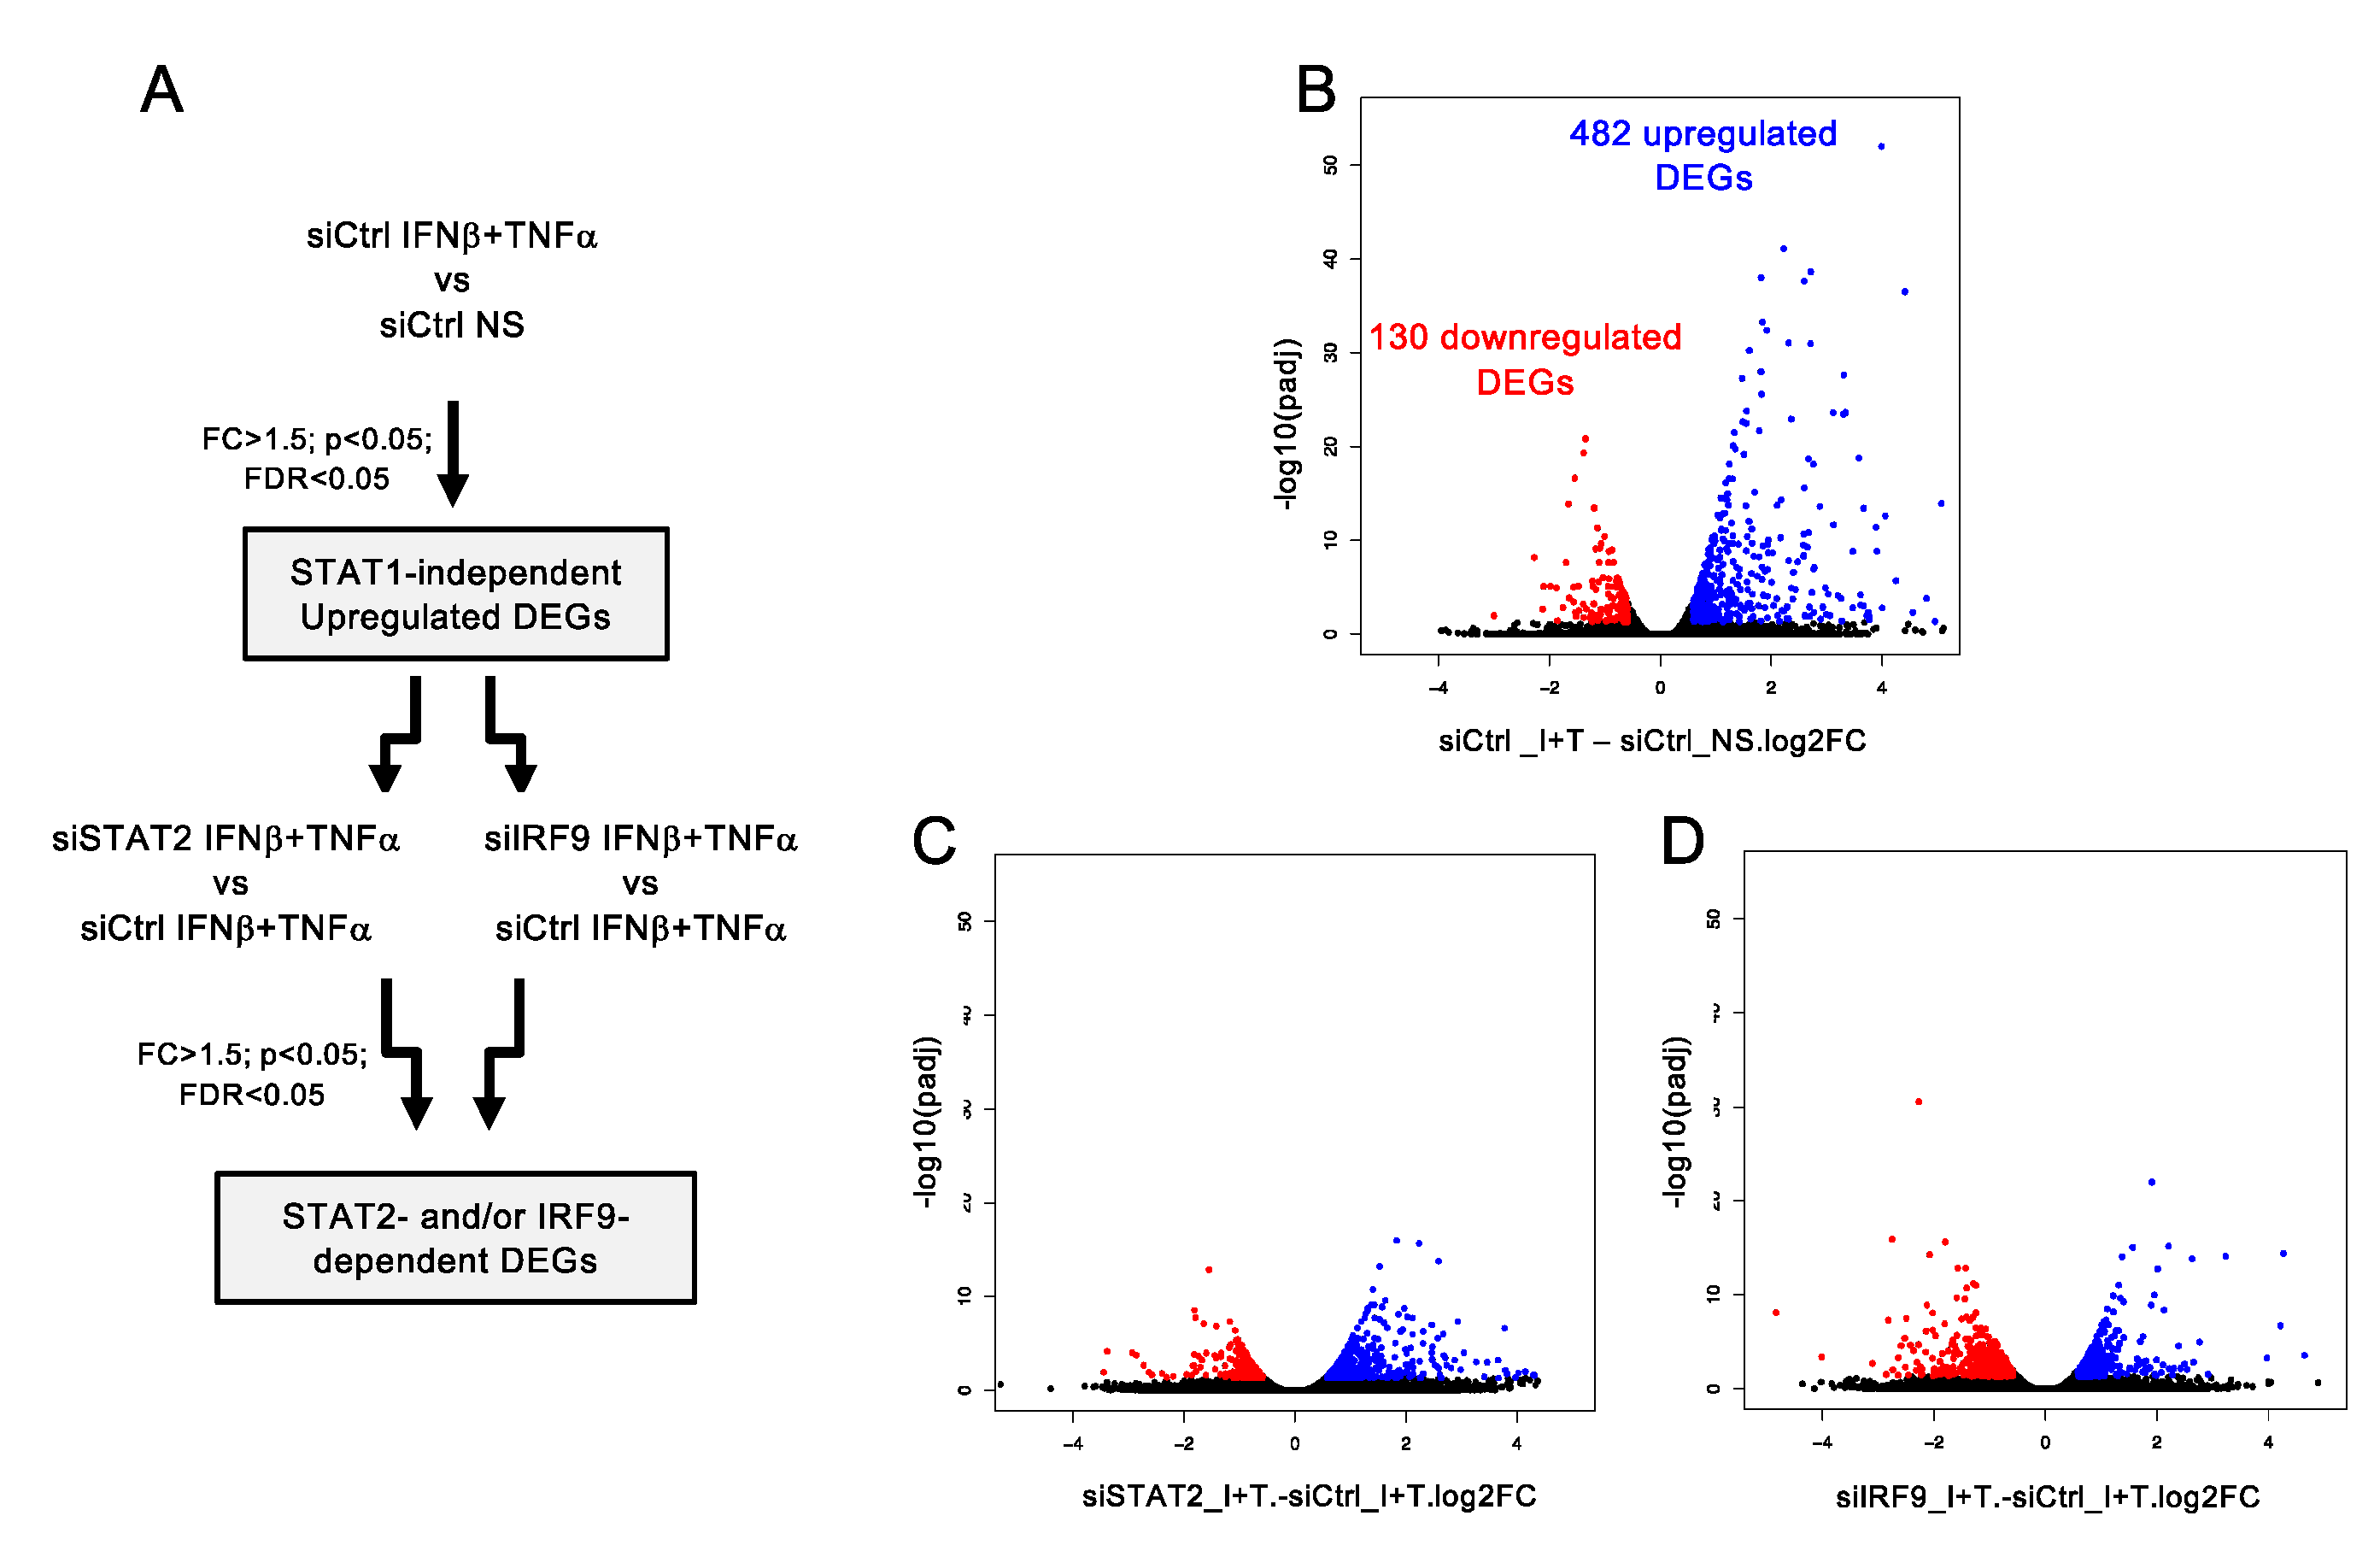
3.2. Workflow for Genome-Wide Characterization of the Delayed Transcriptional Program Induced by IFNβ+TNF in the Absence of STAT1
3.3. A Broad Antiviral and Immunoregulatory Transcriptional Signature is Induced by IFNβ + TNF in the Absence of STAT1
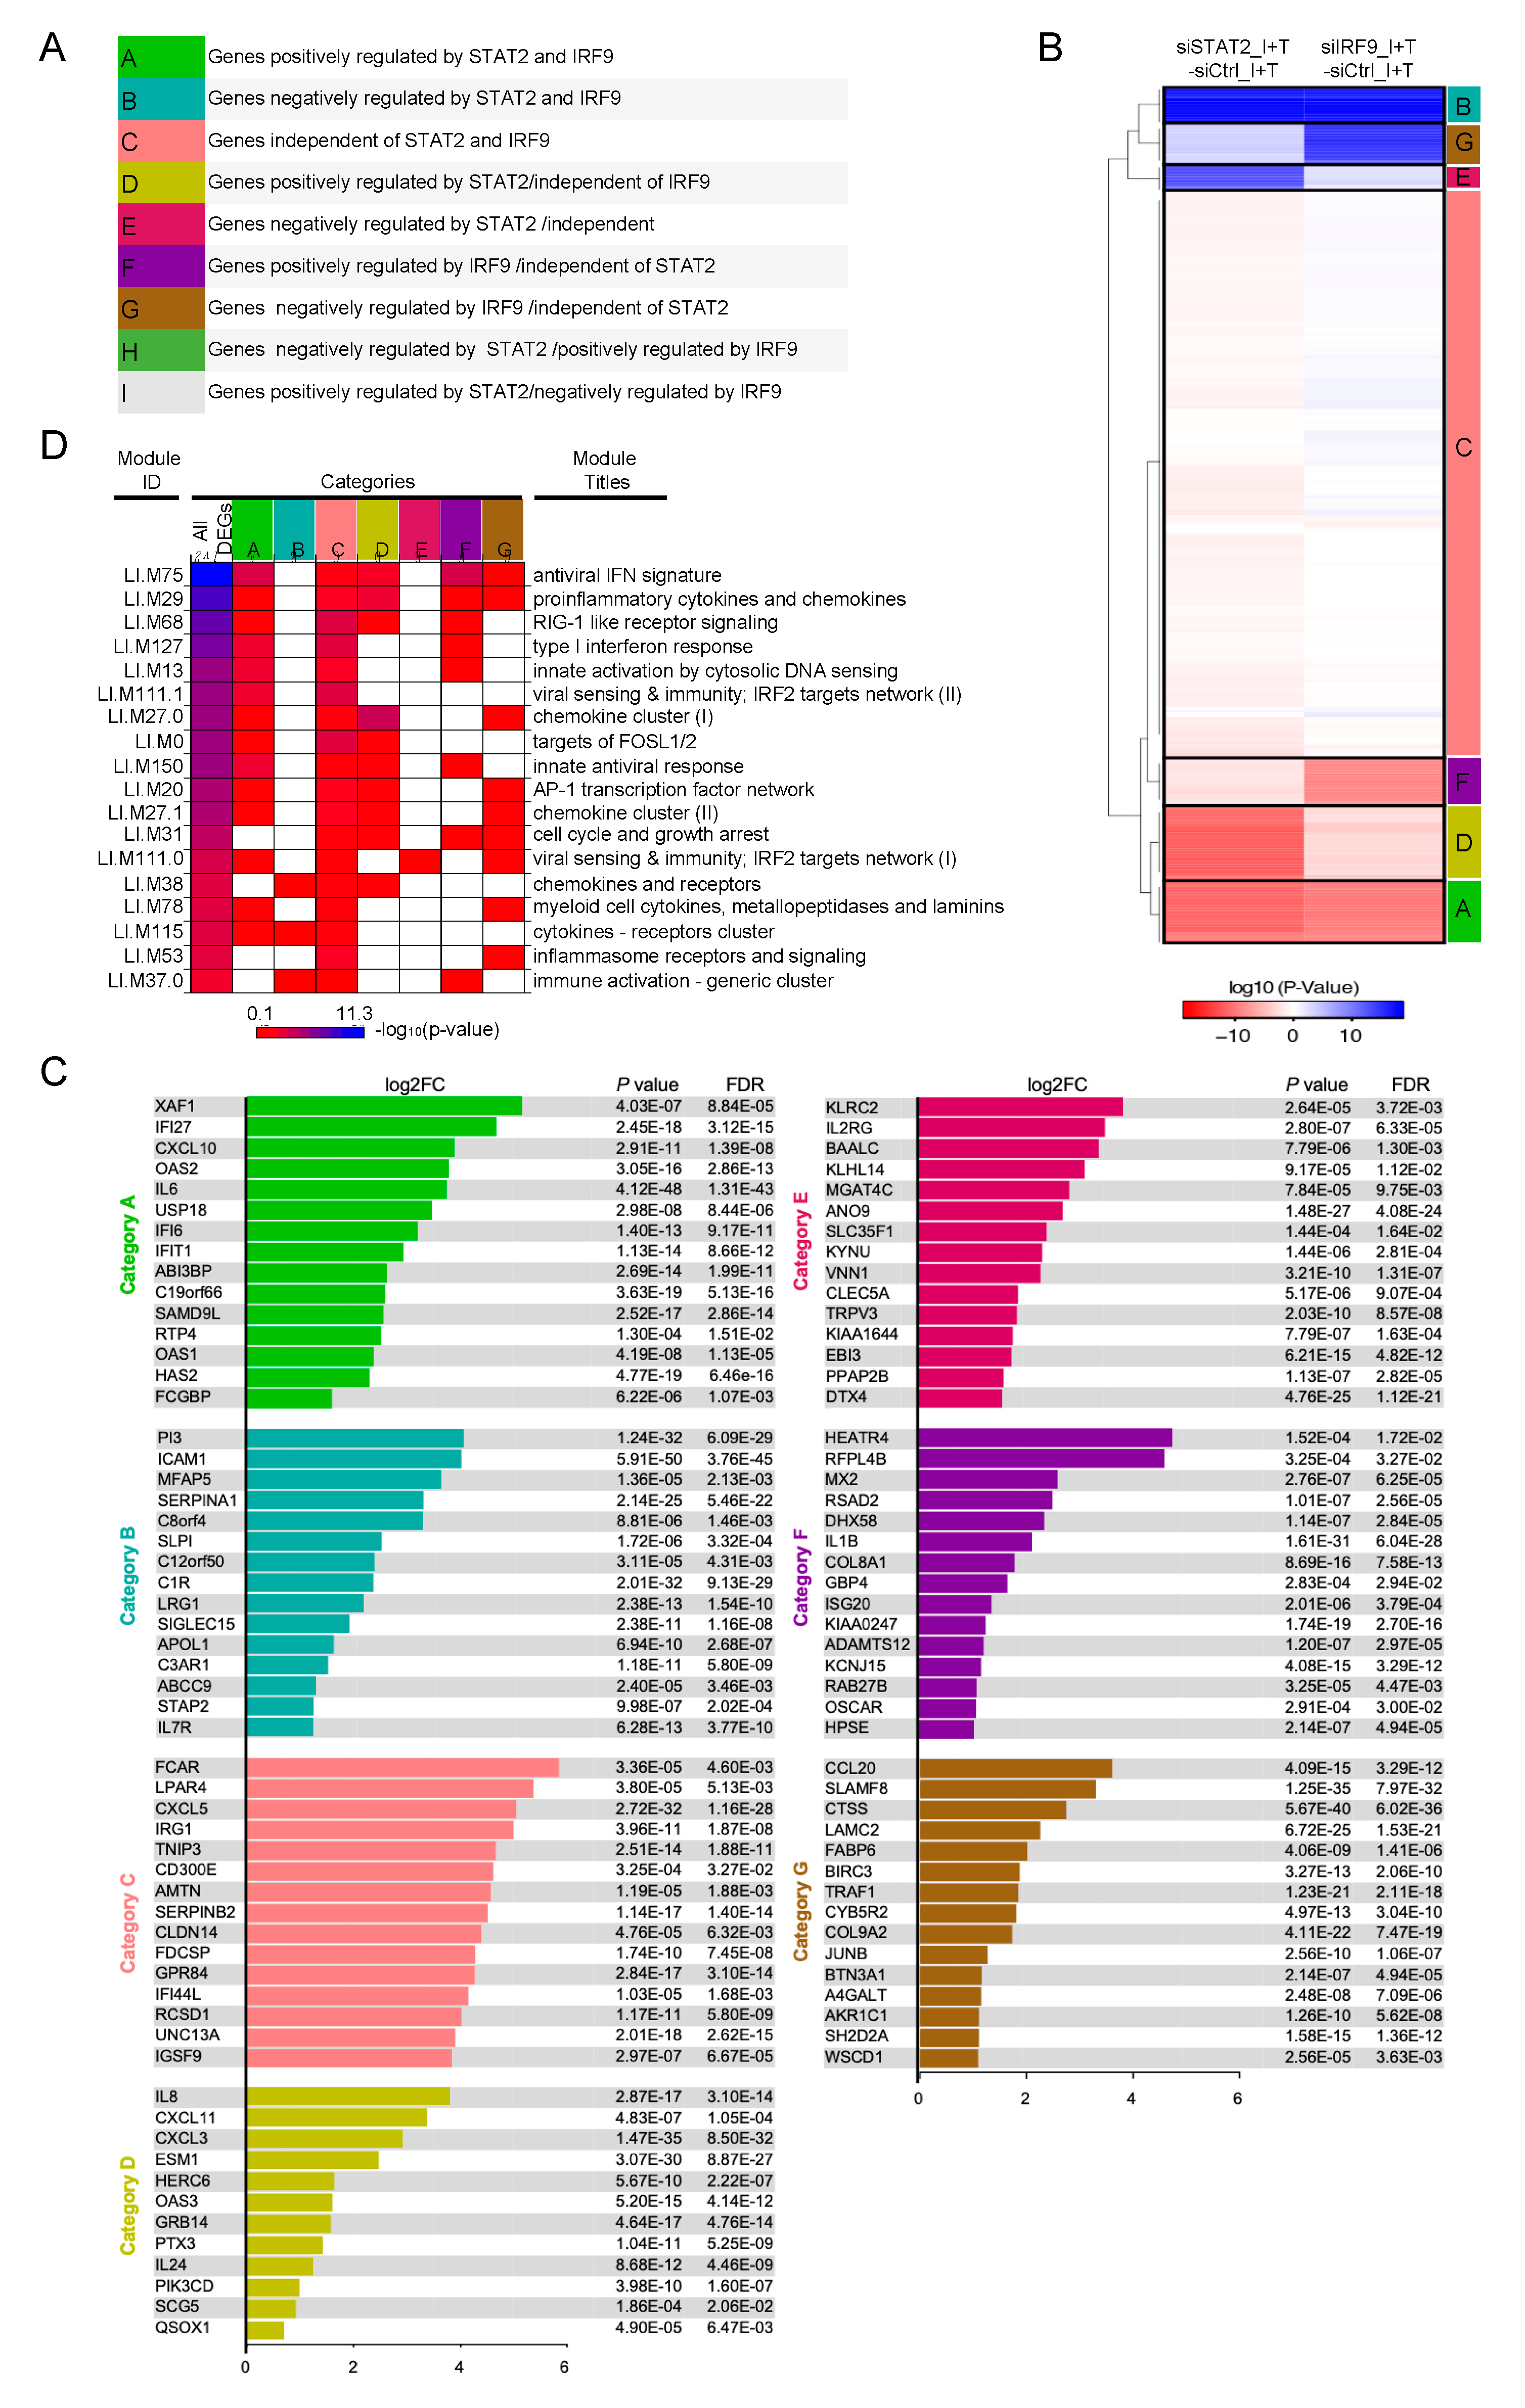
3.4. Clustering of STAT1-Independent IFNβ + TNF Induced DEGs According to their Regulation by STAT2 and IRF9
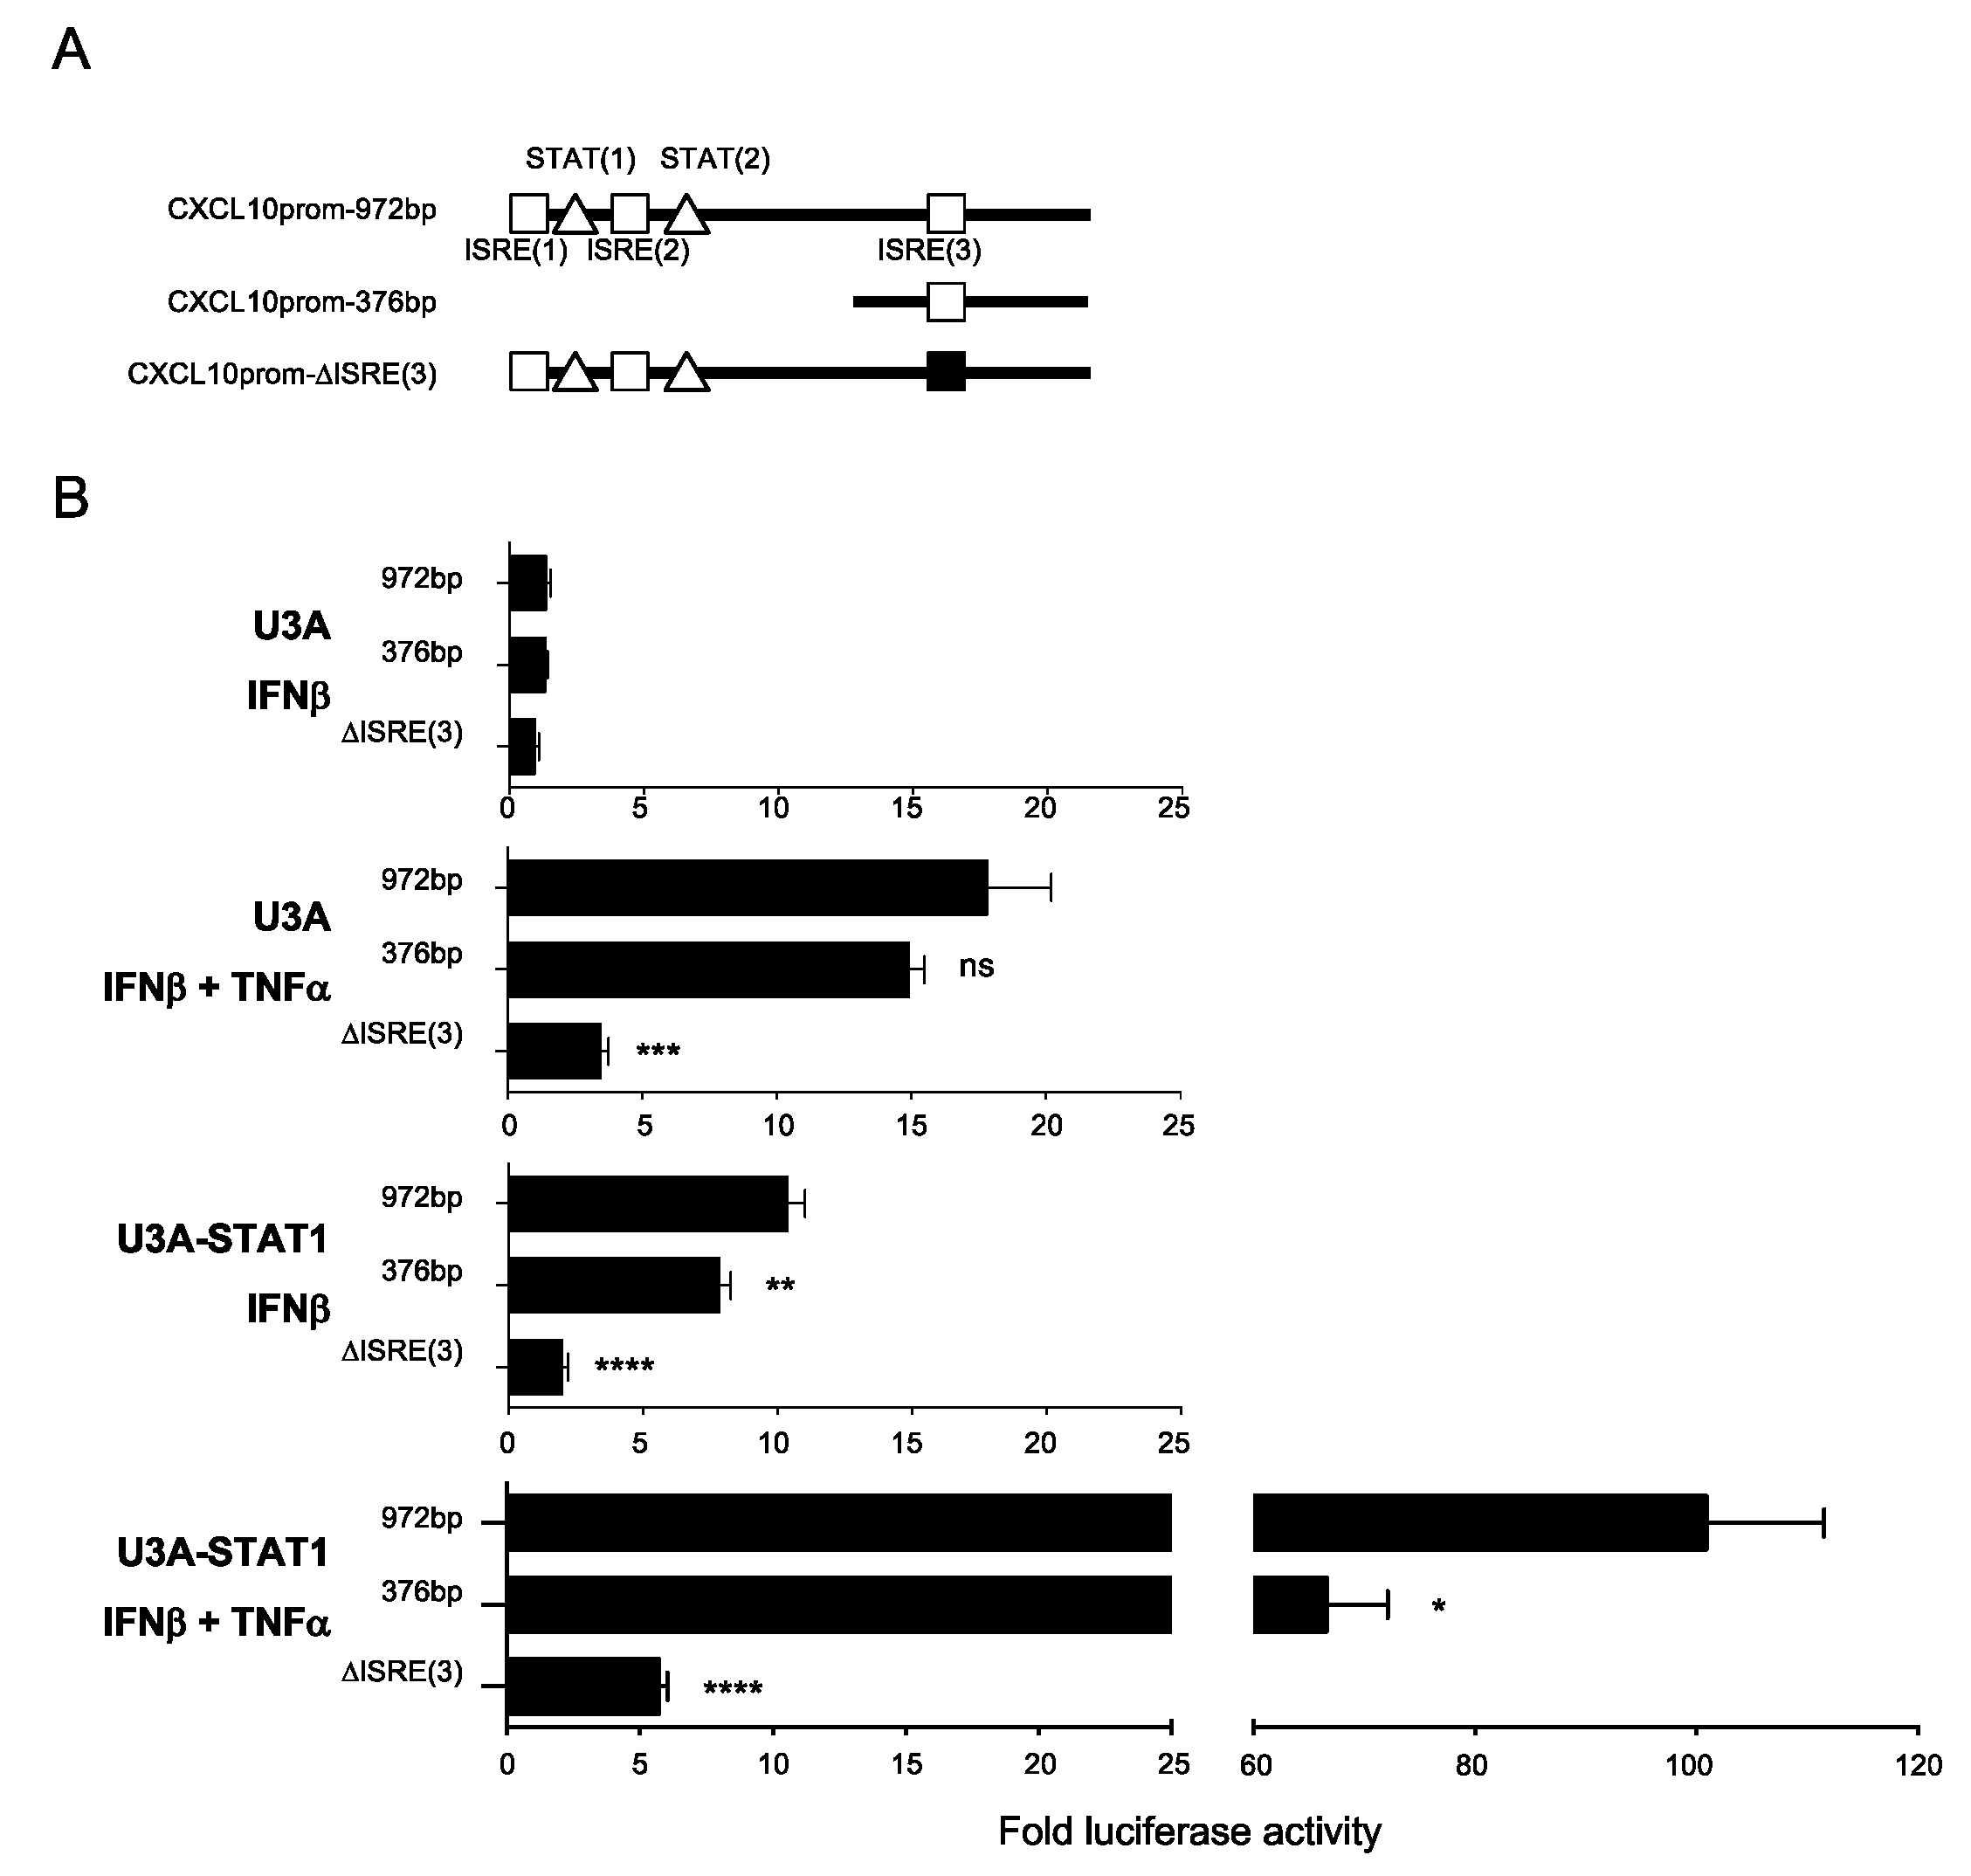
3.5. Differential Regulation of CXCL10 in Response to IFNβ and IFNβ+TNF
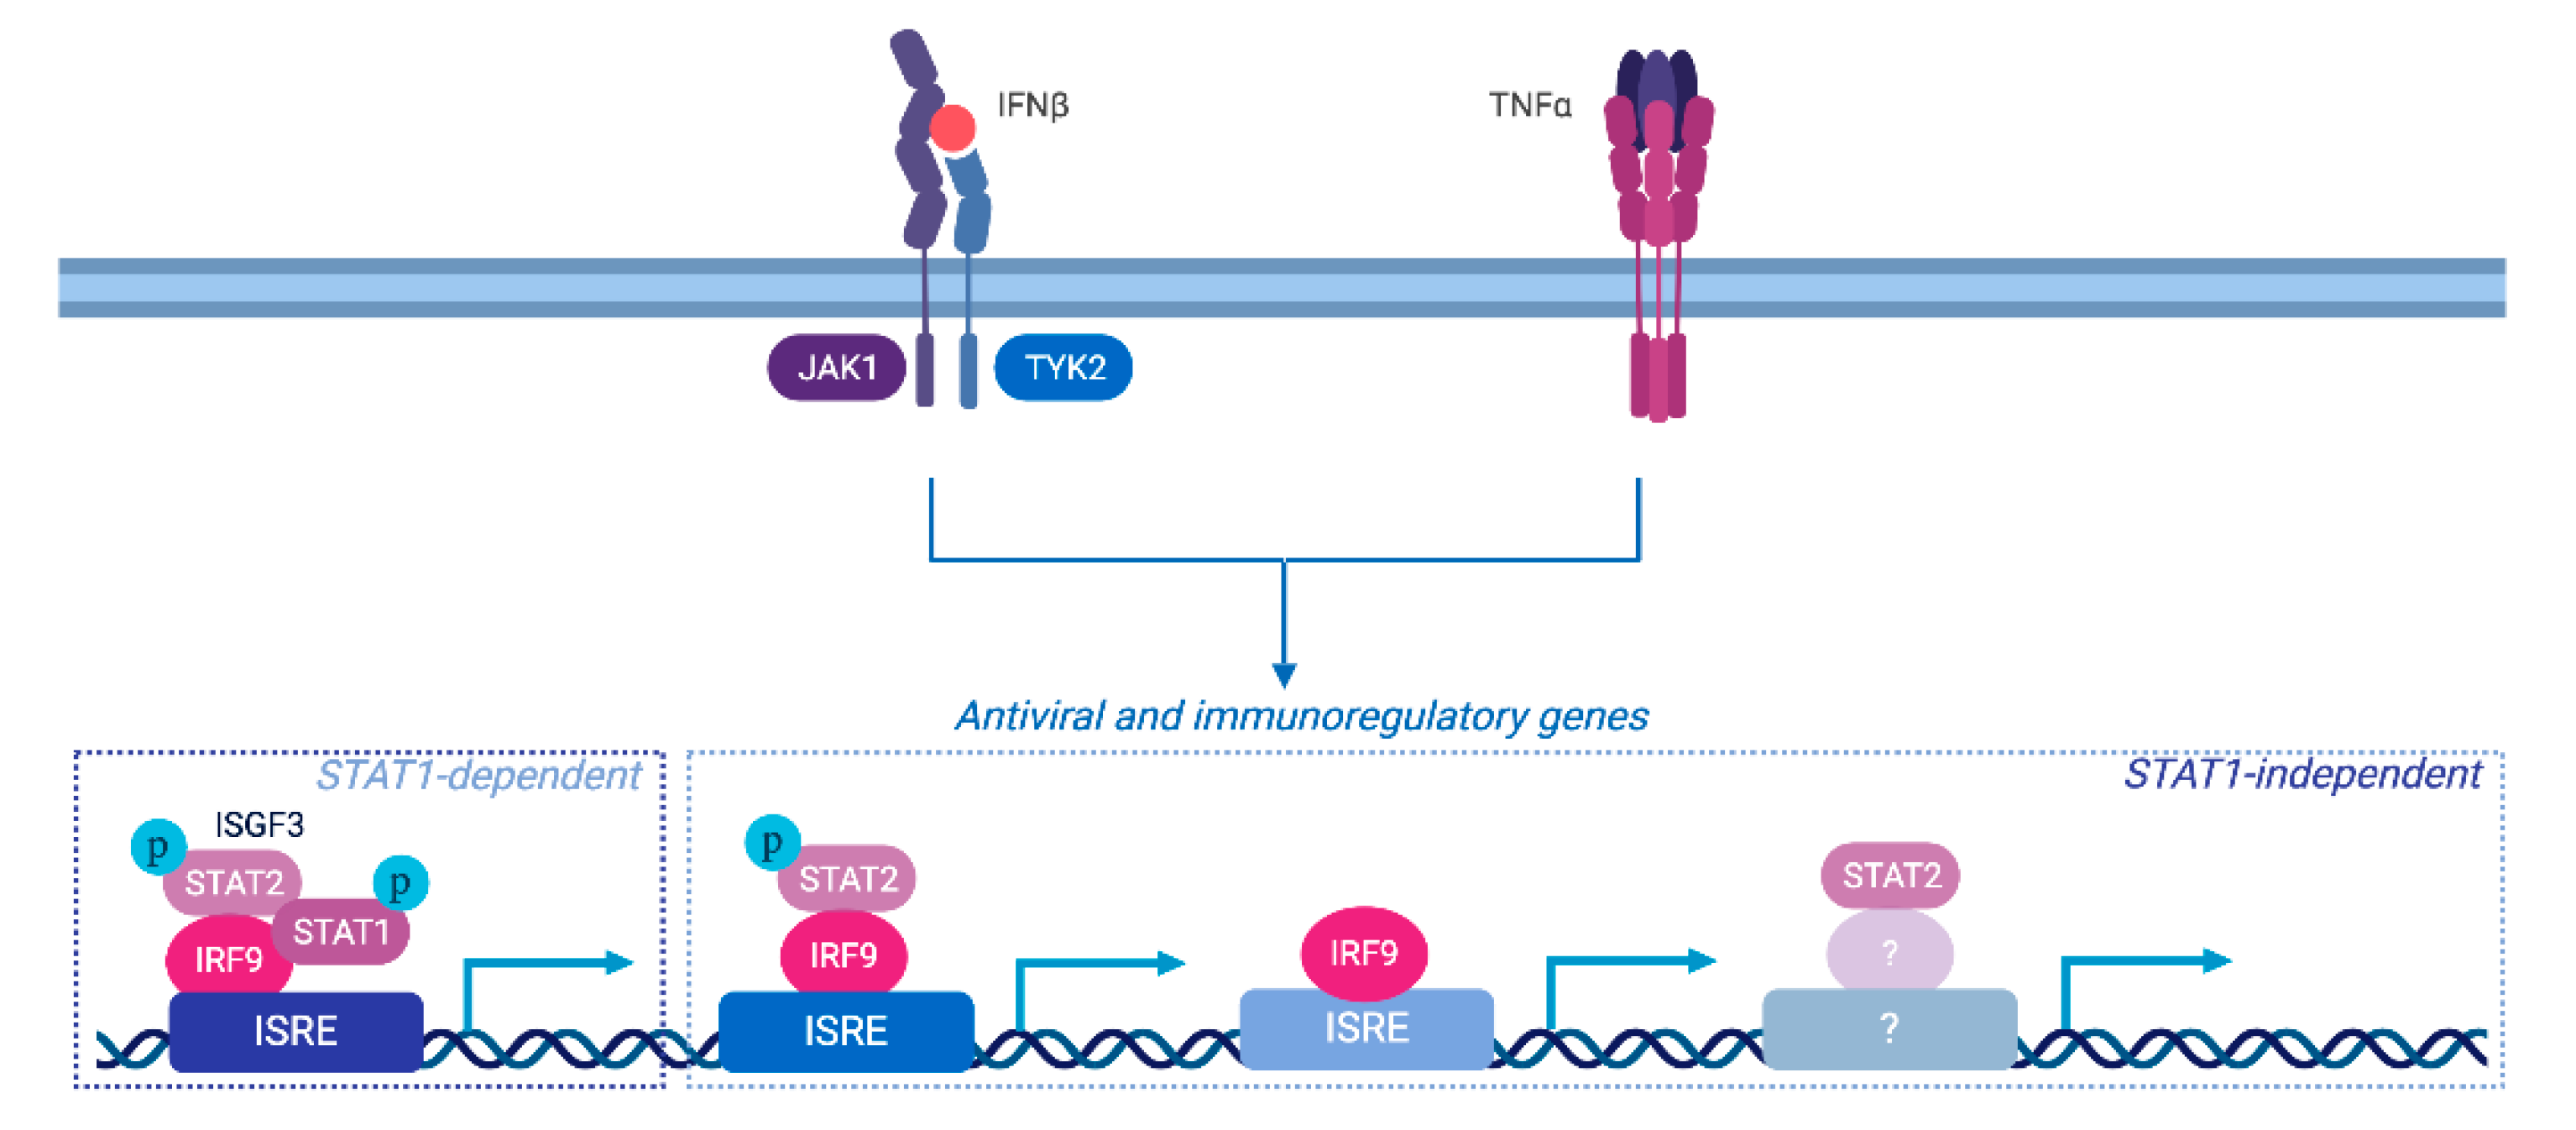
4. Discussion
Supplementary Materials
Author Contributions
Funding
Acknowledgments
Conflicts of Interest
References
- McNab, F.; Mayer-Barber, K.; Sher, A.; Wack, A.; O’Garra, A. Type I interferons in infectious disease. Nat. Rev. Immunol. 2015, 15, 87–103. [Google Scholar] [CrossRef] [PubMed]
- Tomasello, E.; Pollet, E.; Vu Manh, T.P.; Uze, G.; Dalod, M. Harnessing Mechanistic Knowledge on Beneficial Versus Deleterious IFN-I Effects to Design Innovative Immunotherapies Targeting Cytokine Activity to Specific Cell Types. Front. Immunol. 2014, 5, 526. [Google Scholar] [CrossRef] [PubMed]
- Lee-Kirsch, M.A. The Type I Interferonopathies. Annu. Rev. Med. 2017, 68, 297–315. [Google Scholar] [CrossRef] [PubMed]
- Yarilina, A.; Park-Min, K.H.; Antoniv, T.; Hu, X.; Ivashkiv, L.B. TNF activates an IRF1-dependent autocrine loop leading to sustained expression of chemokines and STAT1-dependent type I interferon-response genes. Nat. Immunol. 2008, 9, 378–387. [Google Scholar] [CrossRef] [PubMed]
- Palucka, A.K.; Blanck, J.P.; Bennett, L.; Pascual, V.; Banchereau, J. Cross-regulation of TNF and IFN-alpha in autoimmune diseases. Proc. Natl. Acad. Sci. USA 2005, 102, 3372–3377. [Google Scholar] [CrossRef] [PubMed]
- Tliba, O.; Tliba, S.; Da Huang, C.; Hoffman, R.K.; DeLong, P.; Panettieri, R.A., Jr.; Amrani, Y. Tumor necrosis factor alpha modulates airway smooth muscle function via the autocrine action of interferon beta. J. Biol. Chem. 2003, 278, 50615–50623. [Google Scholar] [CrossRef] [PubMed]
- Au-Yeung, N.; Mandhana, R.; Horvath, C.M. Transcriptional regulation by STAT1 and STAT2 in the interferon JAK-STAT pathway. JAKSTAT 2013, 2, e23931. [Google Scholar] [CrossRef] [Green Version]
- Fink, K.; Grandvaux, N. STAT2 and IRF9: Beyond ISGF3. JAKSTAT 2013, 2, e27521. [Google Scholar] [CrossRef]
- Schneider, W.M.; Chevillotte, M.D.; Rice, C.M. Interferon-stimulated genes: A complex web of host defenses. Annu. Rev. Immunol. 2014, 32, 513–545. [Google Scholar] [CrossRef]
- Levy, D.E.; Marie, I.J.; Durbin, J.E. Induction and function of type I and III interferon in response to viral infection. Curr. Opin. Virol. 2011, 1, 476–486. [Google Scholar] [CrossRef] [Green Version]
- Majoros, A.; Platanitis, E.; Kernbauer-Holzl, E.; Rosebrock, F.; Muller, M.; Decker, T. Canonical and Non-Canonical Aspects of JAK-STAT Signaling: Lessons from Interferons for Cytokine Responses. Front. Immunol. 2017, 8, 29. [Google Scholar] [CrossRef] [PubMed]
- Mestan, J.; Brockhaus, M.; Kirchner, H.; Jacobsen, H. Antiviral activity of tumour necrosis factor. Synergism with interferons and induction of oligo-2′, 5′-adenylate synthetase. J. Gen. Virol. 1988, 69, 3113–3120. [Google Scholar] [CrossRef] [PubMed]
- Bartee, E.; Mohamed, M.R.; Lopez, M.C.; Baker, H.V.; McFadden, G. The addition of tumor necrosis factor plus beta interferon induces a novel synergistic antiviral state against poxviruses in primary human fibroblasts. J. Virol. 2009, 83, 498–511. [Google Scholar] [CrossRef] [PubMed]
- Fink, K.; Martin, L.; Mukawera, E.; Chartier, S.; De Deken, X.; Brochiero, E.; Miot, F.; Grandvaux, N. IFNbeta/TNFalpha synergism induces a non-canonical STAT2/IRF9-dependent pathway triggering a novel DUOX2 NADPH oxidase-mediated airway antiviral response. Cell Res. 2013, 23, 673–690. [Google Scholar] [CrossRef] [PubMed]
- McKendry, R.; John, J.; Flavell, D.; Muller, M.; Kerr, I.M.; Stark, G.R. High-frequency mutagenesis of human cells and characterization of a mutant unresponsive to both alpha and gamma interferons. Proc. Natl. Acad. Sci. USA 1991, 88, 11455–11459. [Google Scholar] [CrossRef] [PubMed]
- Horvath, C.M.; Wen, Z.; Darnell, J.E., Jr. A STAT protein domain that determines DNA sequence recognition suggests a novel DNA-binding domain. Genes Dev. 1995, 9, 984–994. [Google Scholar] [CrossRef]
- Schindler, C.; Fu, X.Y.; Improta, T.; Aebersold, R.; Darnell, J.E., Jr. Proteins of transcription factor ISGF-3: One gene encodes the 91-and 84-kDa ISGF-3 proteins that are activated by interferon alpha. Proc. Natl. Acad. Sci. USA 1992, 89, 7836–7839. [Google Scholar] [CrossRef]
- Robitaille, A.C.; Mariani, M.K.; Fortin, A.; Grandvaux, N. A High Resolution Method to Monitor Phosphorylation-dependent Activation of IRF3. J. Vis. Exp. 2016, 107, e53723. [Google Scholar] [CrossRef]
- Dussault, A.A.; Pouliot, M. Rapid and simple comparison of messenger RNA levels using real-time PCR. Biol. Proced. Online 2006, 8, 1–10. [Google Scholar] [CrossRef]
- Bolger, A.M.; Lohse, M.; Usadel, B. Trimmomatic: A flexible trimmer for Illumina sequence data. Bioinformatics 2014, 30, 2114–2120. [Google Scholar] [CrossRef]
- Dobin, A.; Davis, C.A.; Schlesinger, F.; Drenkow, J.; Zaleski, C.; Jha, S.; Batut, P.; Chaisson, M.; Gingeras, T.R. STAR: Ultrafast universal RNA-seq aligner. Bioinformatics 2013, 29, 15–21. [Google Scholar] [CrossRef]
- Roberts, A.; Pimentel, H.; Trapnell, C.; Pachter, L. Identification of novel transcripts in annotated genomes using RNA-Seq. Bioinformatics 2011, 27, 2325–2329. [Google Scholar] [CrossRef]
- Trapnell, C.; Hendrickson, D.G.; Sauvageau, M.; Goff, L.; Rinn, J.L.; Pachter, L. Differential analysis of gene regulation at transcript resolution with RNA-seq. Nat. Biotechnol. 2013, 31, 46–53. [Google Scholar] [CrossRef]
- Anders, S.; Huber, W. Differential expression analysis for sequence count data. Genome Biol. 2010, 11, R106. [Google Scholar] [CrossRef]
- Robinson, M.D.; McCarthy, D.J.; Smyth, G.K. edgeR: A Bioconductor package for differential expression analysis of digital gene expression data. Bioinformatics 2010, 26, 139–140. [Google Scholar] [CrossRef]
- Young, M.D.; Wakefield, M.J.; Smyth, G.K.; Oshlack, A. Gene ontology analysis for RNA-seq: Accounting for selection bias. Genome Biol. 2010, 11, R14. [Google Scholar] [CrossRef]
- Weiner, J.; Domaszewska, T. tmod: An R package for general and multivariate enrichment analysis. PeerJ Prepr. 2016, 4, e2420v1. [Google Scholar] [CrossRef]
- Bar-Joseph, Z.; Gerber, G.K.; Lee, T.I.; Rinaldi, N.J.; Yoo, J.Y.; Robert, F.; Gordon, D.B.; Fraenkel, E.; Jaakkola, T.S.; Young, R.A.; et al. Computational discovery of gene modules and regulatory networks. Nat. Biotechnol. 2003, 21, 1337–1342. [Google Scholar] [CrossRef]
- Chaussabel, D.; Baldwin, N. Democratizing systems immunology with modular transcriptional repertoire analyses. Nat. Rev. Immunol. 2014, 14, 271–280. [Google Scholar] [CrossRef]
- Chaussabel, D.; Quinn, C.; Shen, J.; Patel, P.; Glaser, C.; Baldwin, N.; Stichweh, D.; Blankenship, D.; Li, L.; Munagala, I.; et al. A modular analysis framework for blood genomics studies: Application to systemic lupus erythematosus. Immunity 2008, 29, 150–164. [Google Scholar] [CrossRef]
- Li, S.; Rouphael, N.; Duraisingham, S.; Romero-Steiner, S.; Presnell, S.; Davis, C.; Schmidt, D.S.; Johnson, S.E.; Milton, A.; Rajam, G.; et al. Molecular signatures of antibody responses derived from a systems biology study of five human vaccines. Nat. Immunol. 2014, 15, 195–204. [Google Scholar] [CrossRef]
- Benjamini, Y.; Hochberg, Y. Controlling the False Discovery Rate: A Practical and Powerful Approach to Multiple Testing. J. R. Stat. Soc. Ser. B (Methodol.) 1995, 57, 289–300. [Google Scholar] [CrossRef]
- Ross, I.; Gentleman, R. R: A language for data analysis and graphics. J. Comput. Graph. Stat. 1996, 5, 299–314. [Google Scholar]
- Zaheer, R.S.; Koetzler, R.; Holden, N.S.; Wiehler, S.; Proud, D. Selective transcriptional down-regulation of human rhinovirus-induced production of CXCL10 from airway epithelial cells via the MEK1 pathway. J. Immunol. 2009, 182, 4854–4864. [Google Scholar] [CrossRef]
- Davis, A.M.; Hagan, K.A.; Matthews, L.A.; Bajwa, G.; Gill, M.A.; Gale, M., Jr.; Farrar, J.D. Blockade of virus infection by human CD4+ T cells via a cytokine relay network. J. Immunol. 2008, 180, 6923–6932. [Google Scholar] [CrossRef]
- Bartee, E.; McFadden, G. Human cancer cells have specifically lost the ability to induce the synergistic state caused by tumor necrosis factor plus interferon-beta. Cytokine 2009, 47, 199–205. [Google Scholar] [CrossRef]
- Bluyssen, H.A.; Levy, D.E. Stat2 is a transcriptional activator that requires sequence-specific contacts provided by stat1 and p48 for stable interaction with DNA. J. Biol. Chem. 1997, 272, 4600–4605. [Google Scholar] [CrossRef]
- Martinez-Moczygemba, M.; Gutch, M.J.; French, D.L.; Reich, N.C. Distinct STAT structure promotes interaction of STAT2 with the p48 subunit of the interferon-alpha-stimulated transcription factor ISGF3. J. Biol. Chem. 1997, 272, 20070–20076. [Google Scholar] [CrossRef]
- Gupta, S.; Jiang, M.; Pernis, A.B. IFN-alpha activates Stat6 and leads to the formation of Stat2:Stat6 complexes in B cells. J. Immunol. 1999, 163, 3834–3841. [Google Scholar]
- Lou, Y.J.; Pan, X.R.; Jia, P.M.; Li, D.; Xiao, S.; Zhang, Z.L.; Chen, S.J.; Chen, Z.; Tong, J.H. IRF-9/STAT2 [corrected] functional interaction drives retinoic acid-induced gene G expression independently of STAT1. Cancer Res. 2009, 69, 3673–3680. [Google Scholar] [CrossRef]
- Abdul-Sater, A.A.; Majoros, A.; Plumlee, C.R.; Perry, S.; Gu, A.D.; Lee, C.; Shresta, S.; Decker, T.; Schindler, C. Different STAT Transcription Complexes Drive Early and Delayed Responses to Type I IFNs. J. Immunol. 2015, 195, 210–216. [Google Scholar] [CrossRef] [PubMed]
- Rengachari, S.; Groiss, S.; Devos, J.; Caron, E.; Grandvaux, N.; Panne, D. Structural basis of STAT2 recognition by IRF9 reveals molecular insights into ISGF3 function. Proc. Natl. Acad. Sci. USA 2018, 115, E601–E609. [Google Scholar] [CrossRef] [PubMed] [Green Version]
- Platanitis, E.; Demiroz, D.; Schneller, A.; Fischer, K.; Capelle, C.; Hartl, M.; Gossenreiter, T.; Muller, M.; Novatchkova, M.; Decker, T. A molecular switch from STAT2-IRF9 to ISGF3 underlies interferon-induced gene transcription. Nat. Commun. 2019, 10, 2921. [Google Scholar] [CrossRef] [PubMed]
- Ghislain, J.J.; Fish, E.N. Application of genomic DNA affinity chromatography identifies multiple interferon-alpha-regulated Stat2 complexes. J. Biol. Chem. 1996, 271, 12408–12413. [Google Scholar] [CrossRef] [PubMed]
- Brierley, M.M.; Marchington, K.L.; Jurisica, I.; Fish, E.N. Identification of GAS-dependent interferon-sensitive target genes whose transcription is STAT2-dependent but ISGF3-independent. FEBS J. 2006, 273, 1569–1581. [Google Scholar] [CrossRef]
- Wan, L.; Lin, C.W.; Lin, Y.J.; Sheu, J.J.; Chen, B.H.; Liao, C.C.; Tsai, Y.; Lin, W.Y.; Lai, C.H.; Tsai, F.J. Type I IFN induced IL1-Ra expression in hepatocytes is mediated by activating STAT6 through the formation of STAT2: STAT6 heterodimer. J. Cell Mol. Med. 2008, 12, 876–888. [Google Scholar] [CrossRef] [Green Version]
- Perry, S.T.; Buck, M.D.; Lada, S.M.; Schindler, C.; Shresta, S. STAT2 mediates innate immunity to Dengue virus in the absence of STAT1 via the type I interferon receptor. PLoS Pathog. 2011, 7, e1001297. [Google Scholar] [CrossRef]
- Suprunenko, T.; Hofer, M.J. The emerging role of interferon regulatory factor 9 in the antiviral host response and beyond. Cytokine Growth Factor Rev. 2016, 29, 35–43. [Google Scholar] [CrossRef]
- Li, W.; Hofer, M.J.; Songkhunawej, P.; Jung, S.R.; Hancock, D.; Denyer, G.; Campbell, I.L. Type I interferon-regulated gene expression and signaling in murine mixed glial cells lacking signal transducers and activators of transcription 1 or 2 or interferon regulatory factor 9. J. Biol. Chem. 2017, 292, 5845–5859. [Google Scholar] [CrossRef] [Green Version]
- Zhao, X.; Chu, Q.; Cui, J.; Huo, R.; Xu, T. IRF9 as a negative regulator involved in TRIF-mediated NF-kappaB pathway in a teleost fish, Miichthys miiuy. Mol. Immunol. 2017, 85, 123–129. [Google Scholar] [CrossRef]
- Tian, W.L.; Guo, R.; Wang, F.; Jiang, Z.X.; Tang, P.; Huang, Y.M.; Sun, L. IRF9 inhibits human acute myeloid leukemia through the SIRT1-p53 signaling pathway. FEBS Lett. 2017, 591, 2951. [Google Scholar] [CrossRef]
- Park, S.H.; Kang, K.; Giannopoulou, E.; Qiao, Y.; Kang, K.; Kim, G.; Park-Min, K.H.; Ivashkiv, L.B. Type I interferons and the cytokine TNF cooperatively reprogram the macrophage epigenome to promote inflammatory activation. Nat. Immunol. 2017, 18, 1104–1116. [Google Scholar] [CrossRef] [Green Version]

© 2019 by the authors. Licensee MDPI, Basel, Switzerland. This article is an open access article distributed under the terms and conditions of the Creative Commons Attribution (CC BY) license (http://creativecommons.org/licenses/by/4.0/).
Share and Cite
Mariani, M.K.; Dasmeh, P.; Fortin, A.; Caron, E.; Kalamujic, M.; Harrison, A.N.; Hotea, D.I.; Kasumba, D.M.; Cervantes-Ortiz, S.L.; Mukawera, E.; et al. The Combination of IFN β and TNF Induces an Antiviral and Immunoregulatory Program via Non-Canonical Pathways Involving STAT2 and IRF9. Cells 2019, 8, 919. https://doi.org/10.3390/cells8080919
Mariani MK, Dasmeh P, Fortin A, Caron E, Kalamujic M, Harrison AN, Hotea DI, Kasumba DM, Cervantes-Ortiz SL, Mukawera E, et al. The Combination of IFN β and TNF Induces an Antiviral and Immunoregulatory Program via Non-Canonical Pathways Involving STAT2 and IRF9. Cells. 2019; 8(8):919. https://doi.org/10.3390/cells8080919
Chicago/Turabian StyleMariani, Mélissa K., Pouria Dasmeh, Audray Fortin, Elise Caron, Mario Kalamujic, Alexander N. Harrison, Diana I. Hotea, Dacquin M. Kasumba, Sandra L. Cervantes-Ortiz, Espérance Mukawera, and et al. 2019. "The Combination of IFN β and TNF Induces an Antiviral and Immunoregulatory Program via Non-Canonical Pathways Involving STAT2 and IRF9" Cells 8, no. 8: 919. https://doi.org/10.3390/cells8080919
APA StyleMariani, M. K., Dasmeh, P., Fortin, A., Caron, E., Kalamujic, M., Harrison, A. N., Hotea, D. I., Kasumba, D. M., Cervantes-Ortiz, S. L., Mukawera, E., Serohijos, A. W. R., & Grandvaux, N. (2019). The Combination of IFN β and TNF Induces an Antiviral and Immunoregulatory Program via Non-Canonical Pathways Involving STAT2 and IRF9. Cells, 8(8), 919. https://doi.org/10.3390/cells8080919