Increased Levels of cAMP by the Calcium-Dependent Activation of Soluble Adenylyl Cyclase in Parkin-Mutant Fibroblasts

 ,
,  and
and 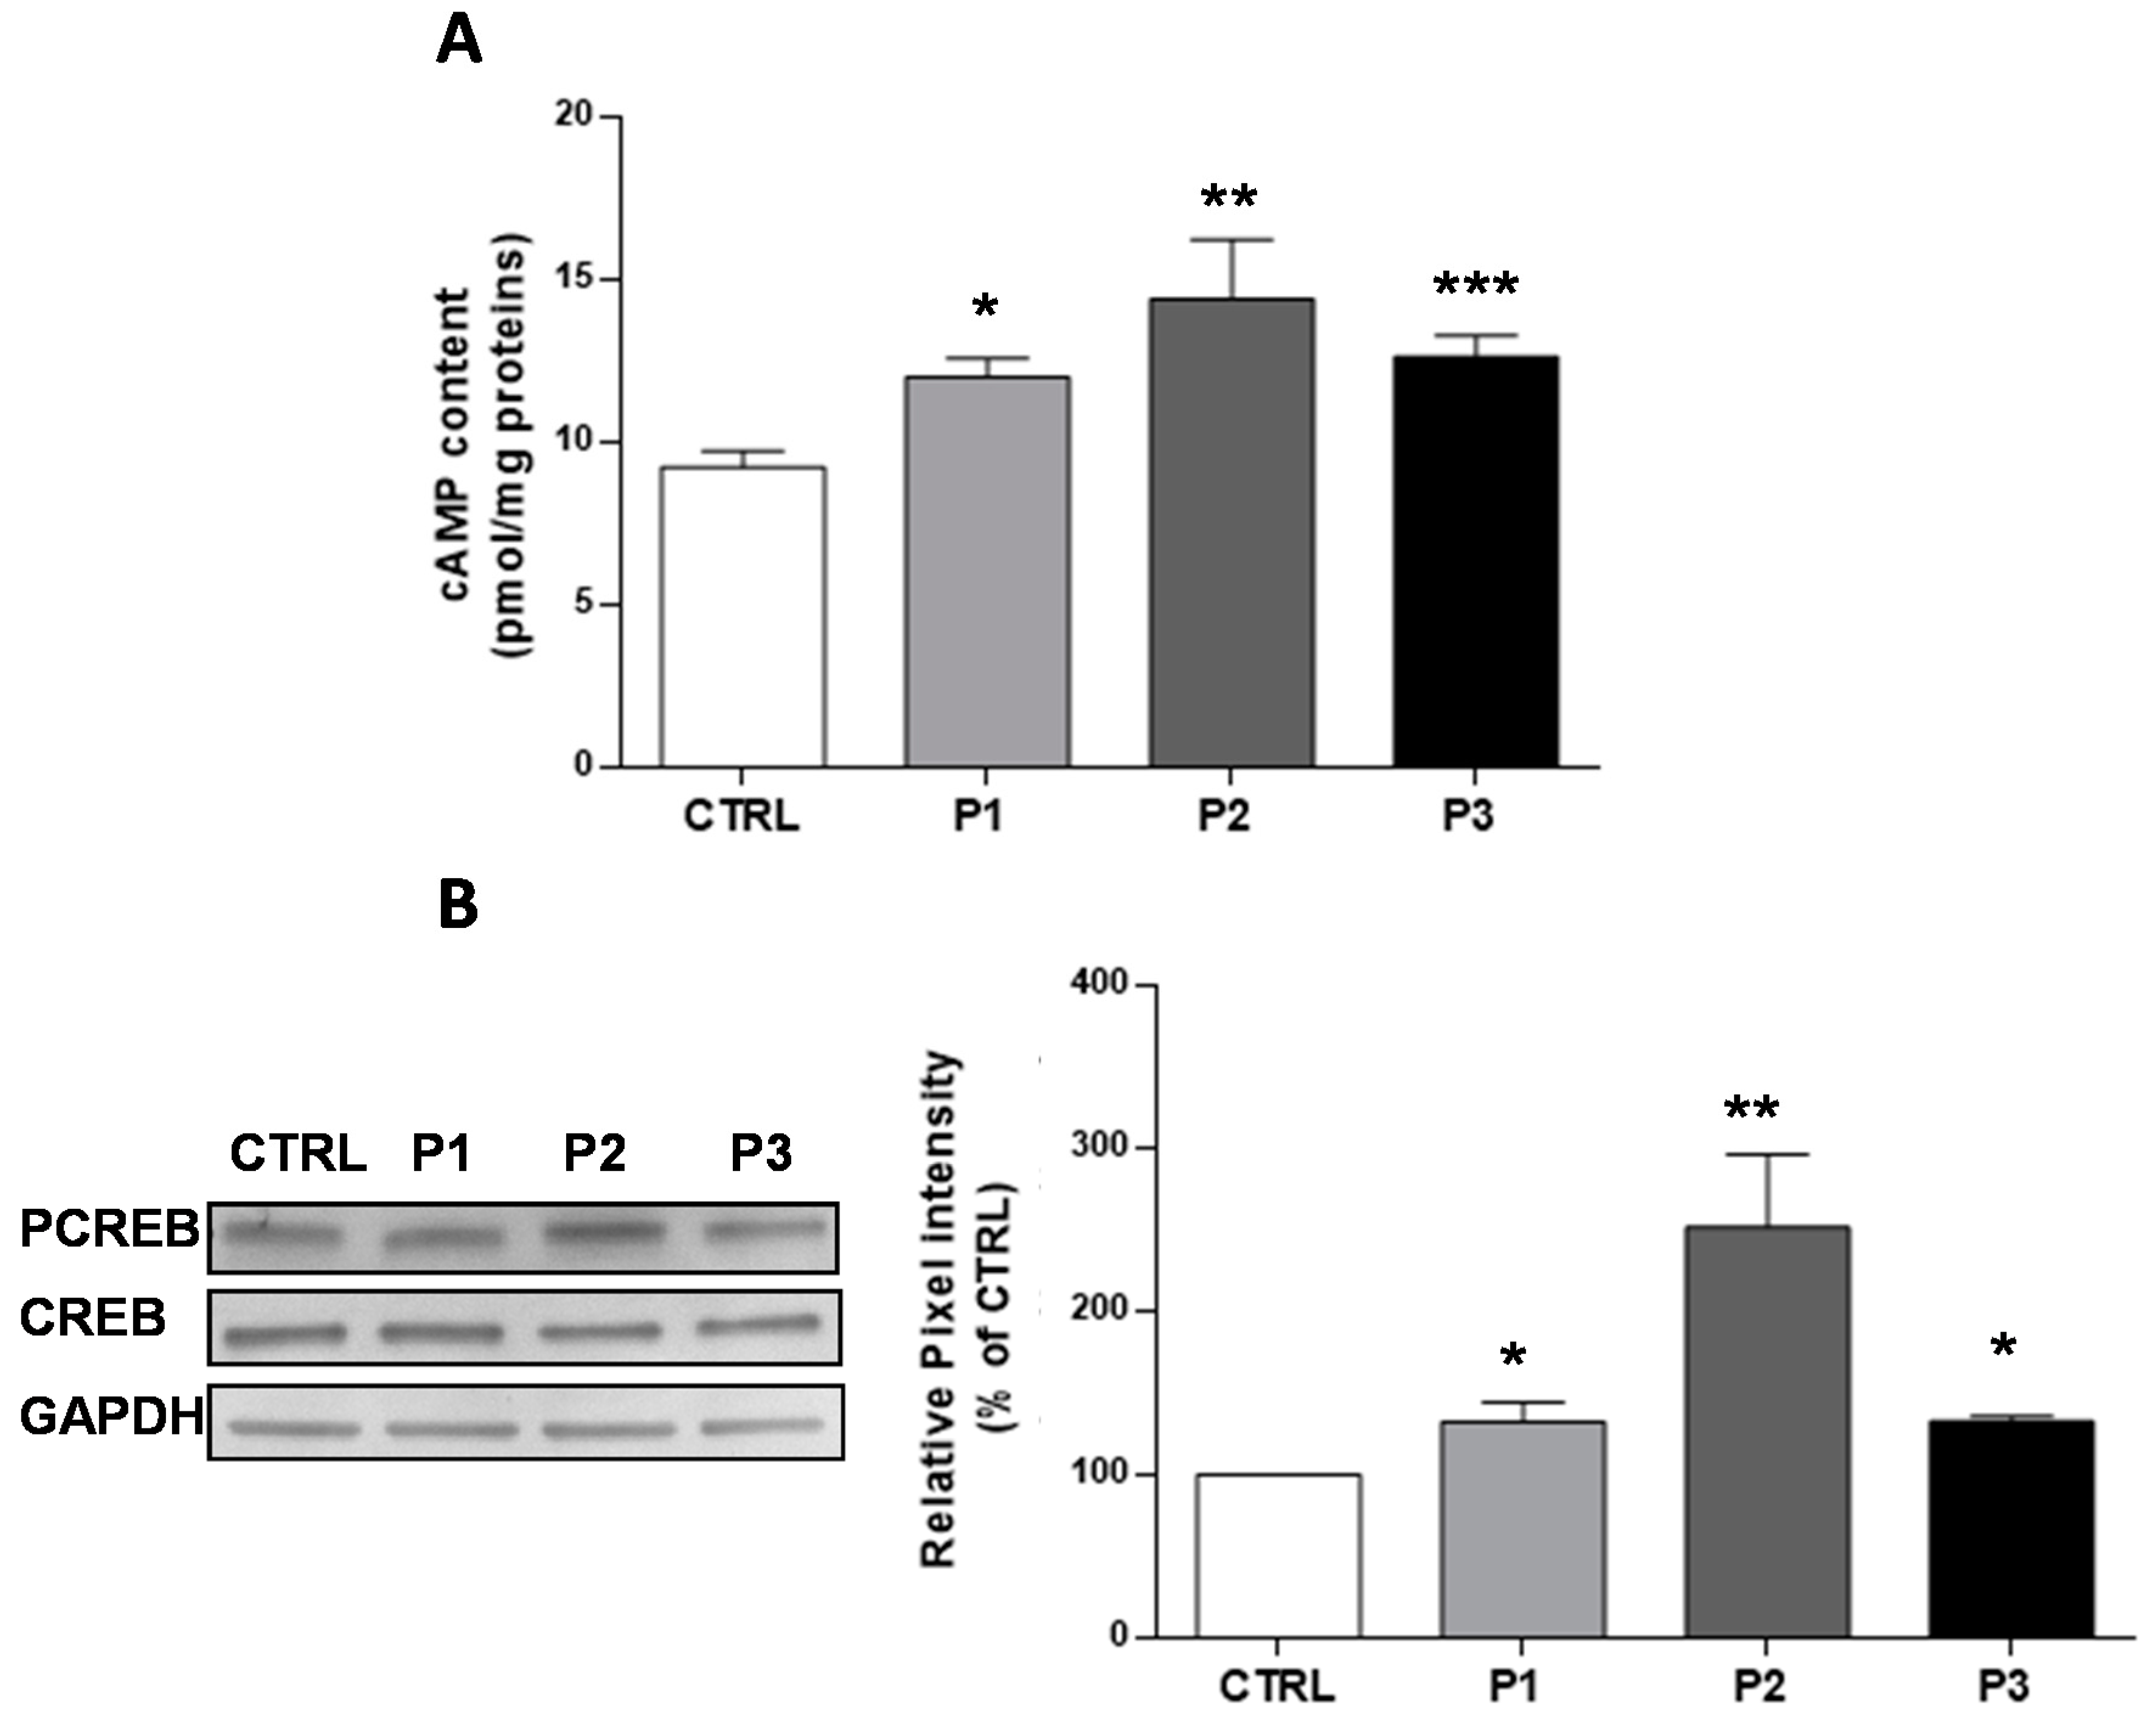
Abstract
:1. Introduction
2. Materials and Methods
2.1. Skin Fibroblast and Culture Conditions
2.2. Cyclic Adenosine Monophosphate Assay
2.3. Laser Scanning Confocal Microscopy (LSCM) Imaging of Cytosolic and Mitochondrial Ca2+
2.4. Quantitative Fluorimetric Measurement of Cytosolic and Mitochondrial Ca2+ Levels
2.5. Real-Time PCR
2.6. Western Blot Analysis
2.7. Protein Measurement
2.8. Statistical Analysis
3. Results
3.1. The Basal cAMP Content in Parkin-Mutant Fibroblasts Is Higher than in Control Fibroblasts
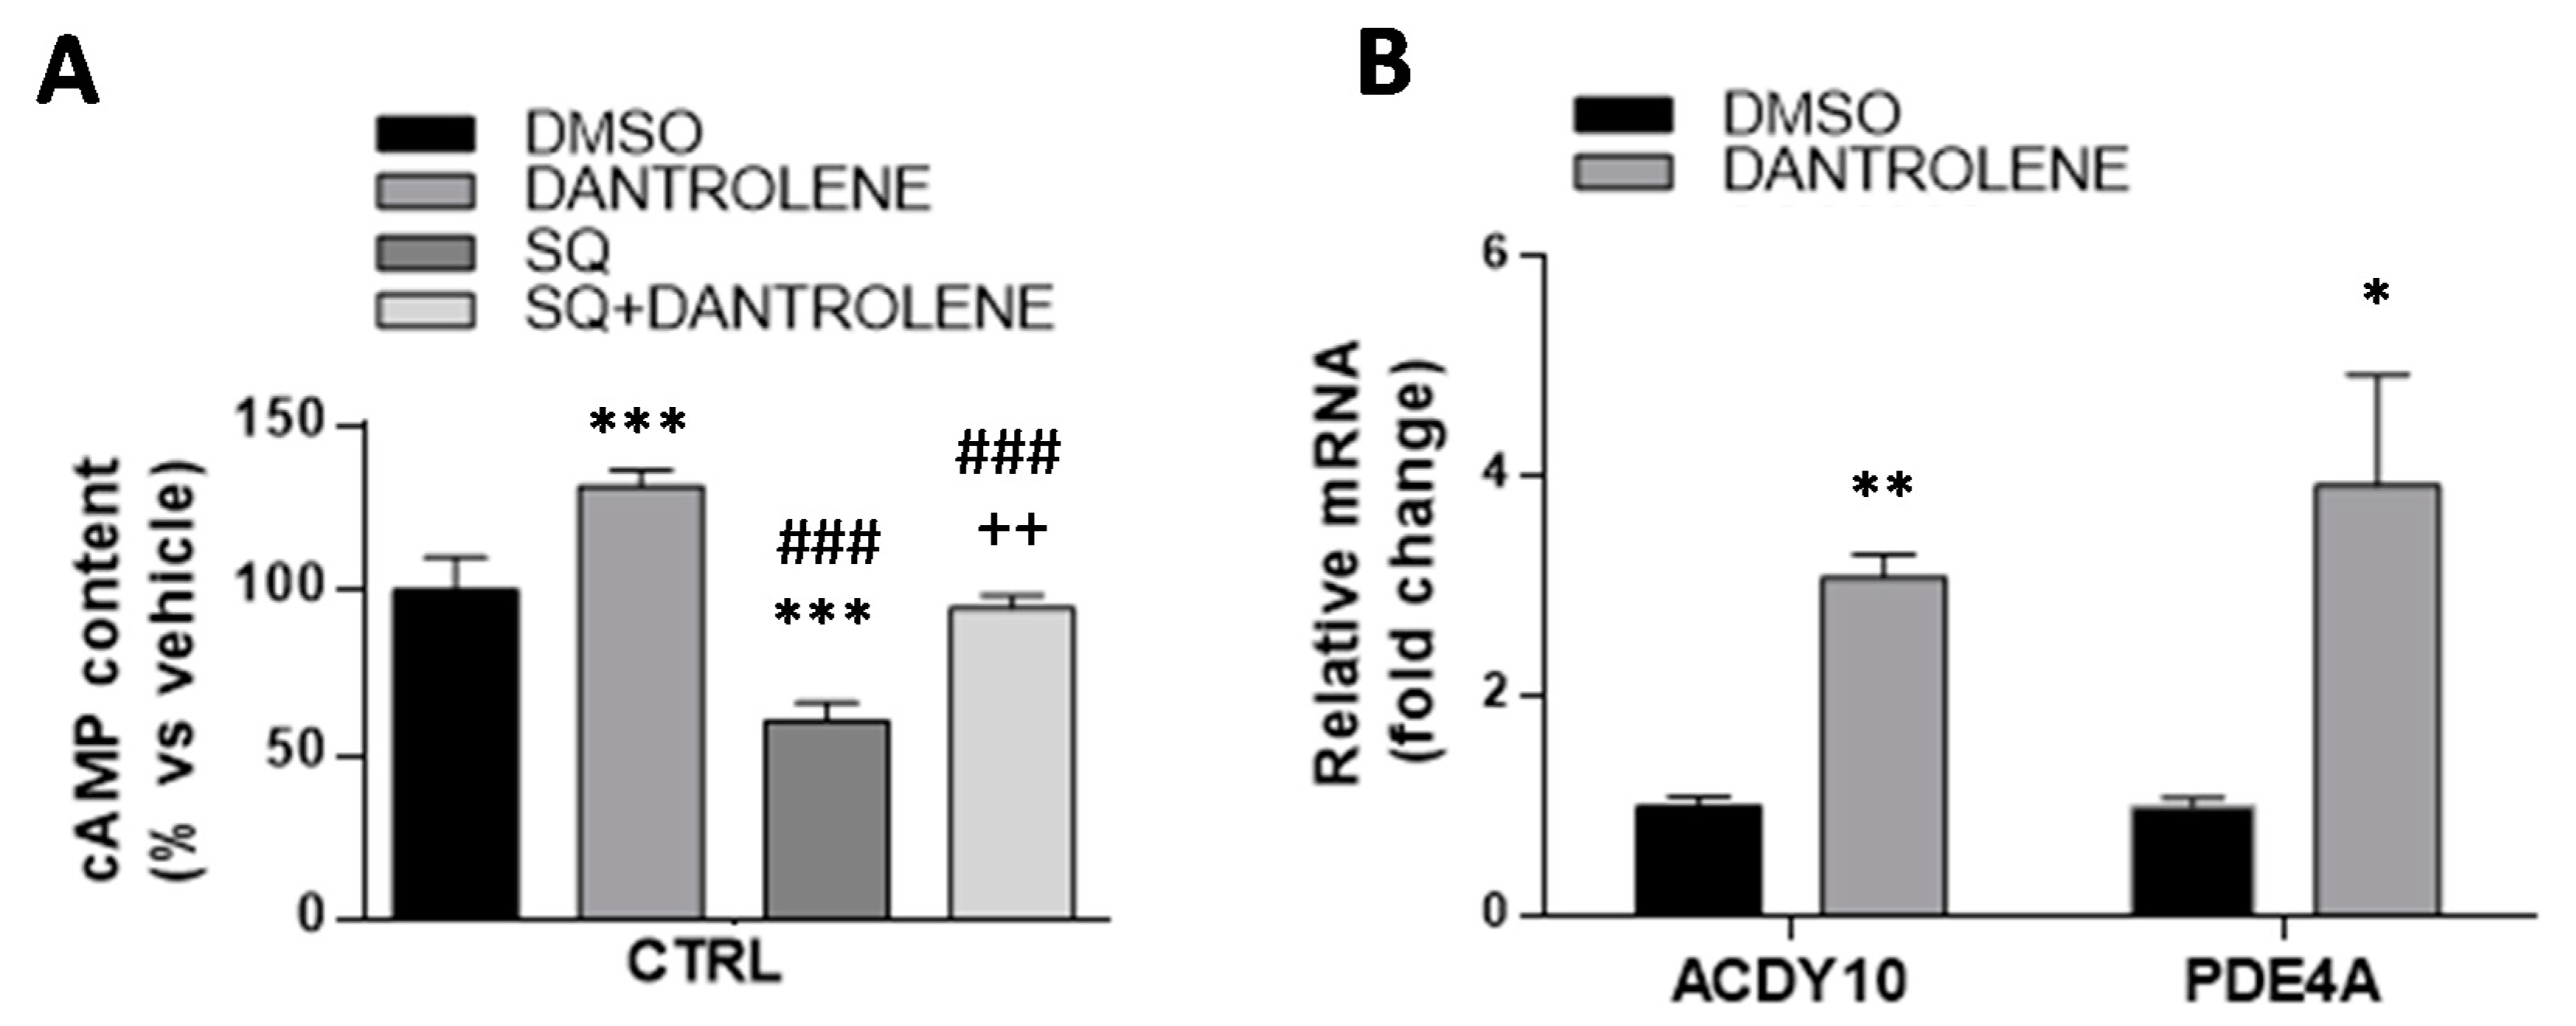
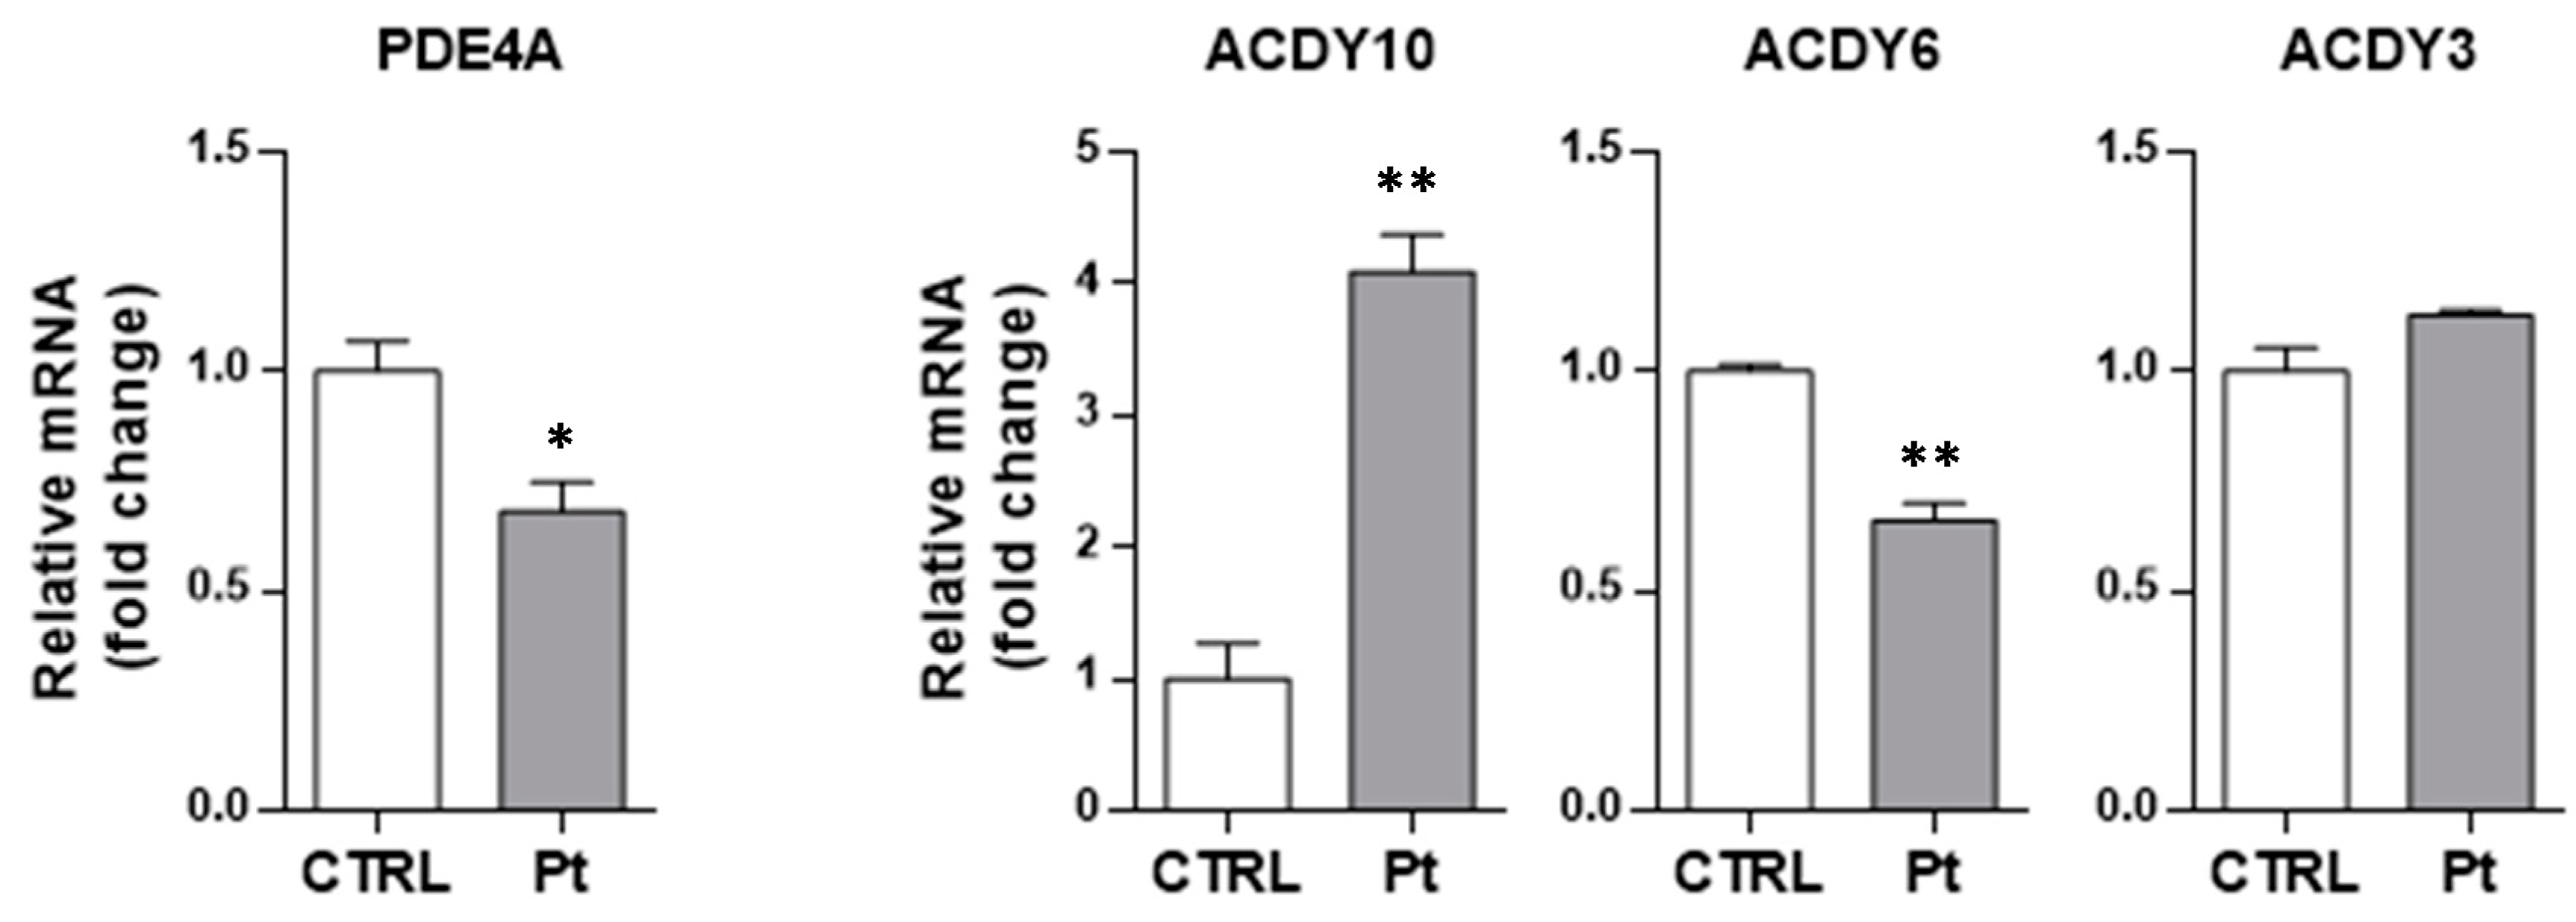
3.2. The Enhanced Content of cAMP in Parkin-Mutant Fibroblasts is Linked to the Deregulated Expression of PDE4A and sAC
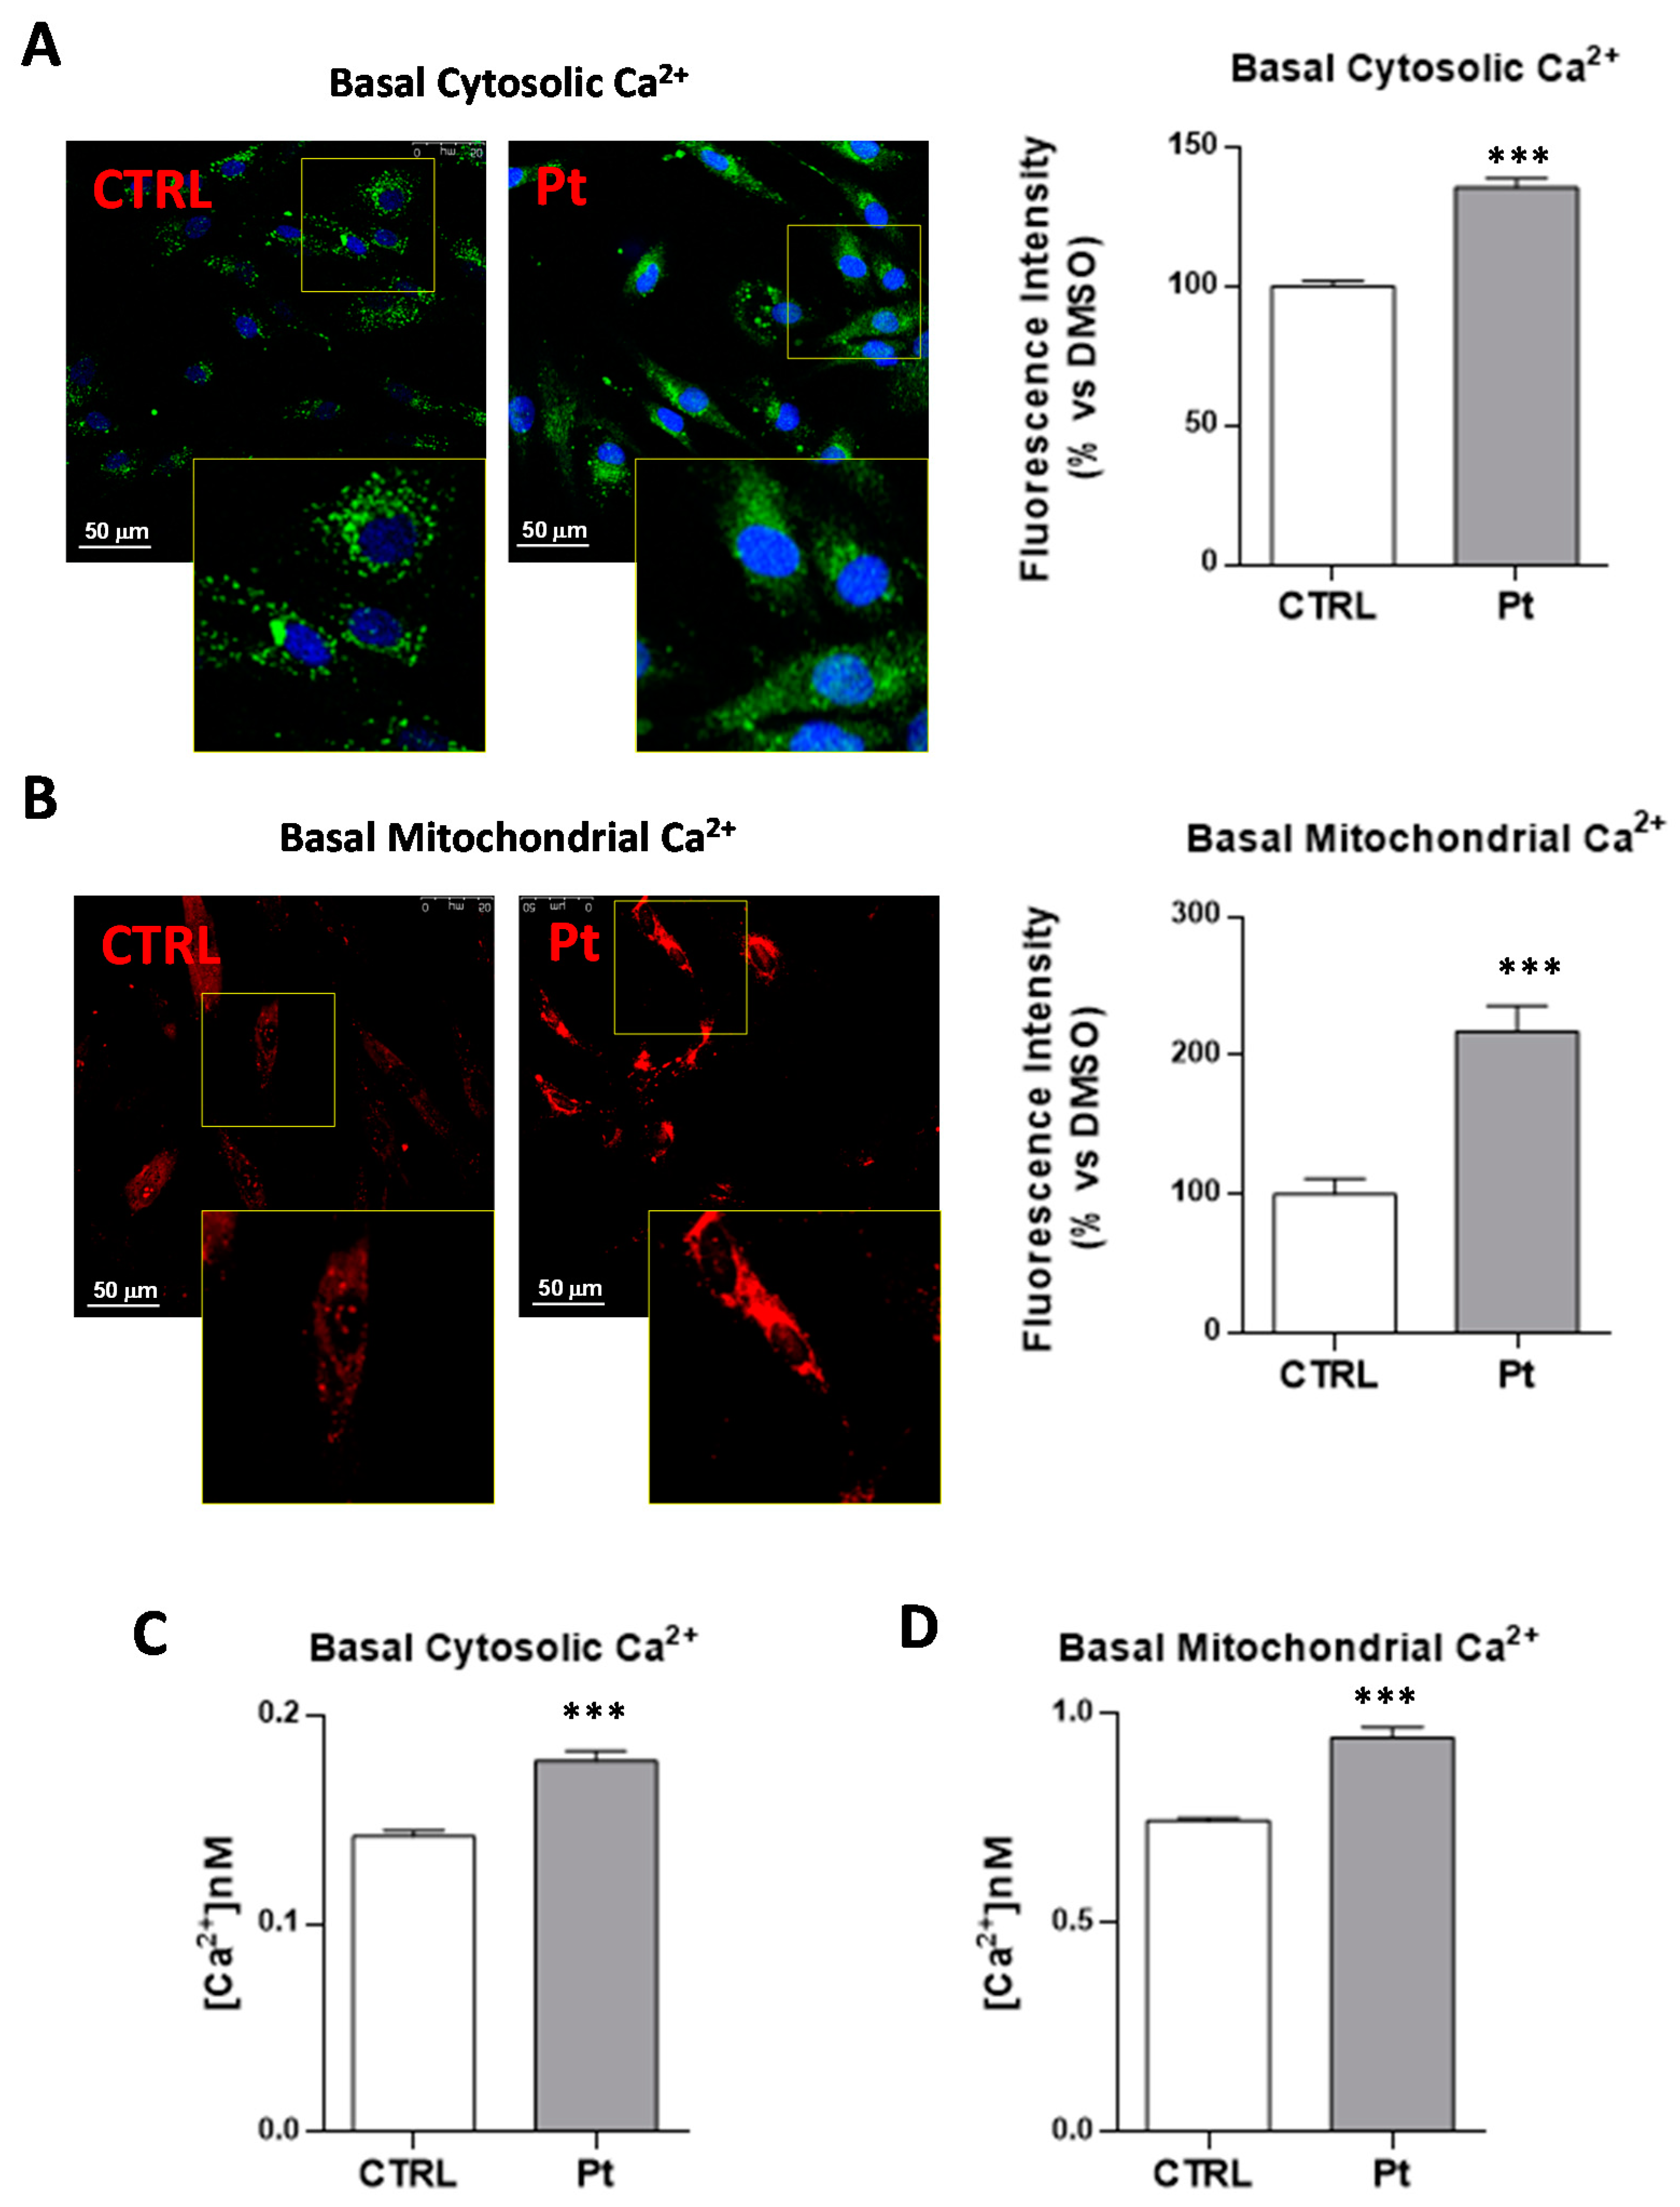
3.3. Cytoplasmic and Mitochondrial Ca2+ Contents are Higher in Parkin-Mutant Fibroblasts as Compared with Control Fibroblasts
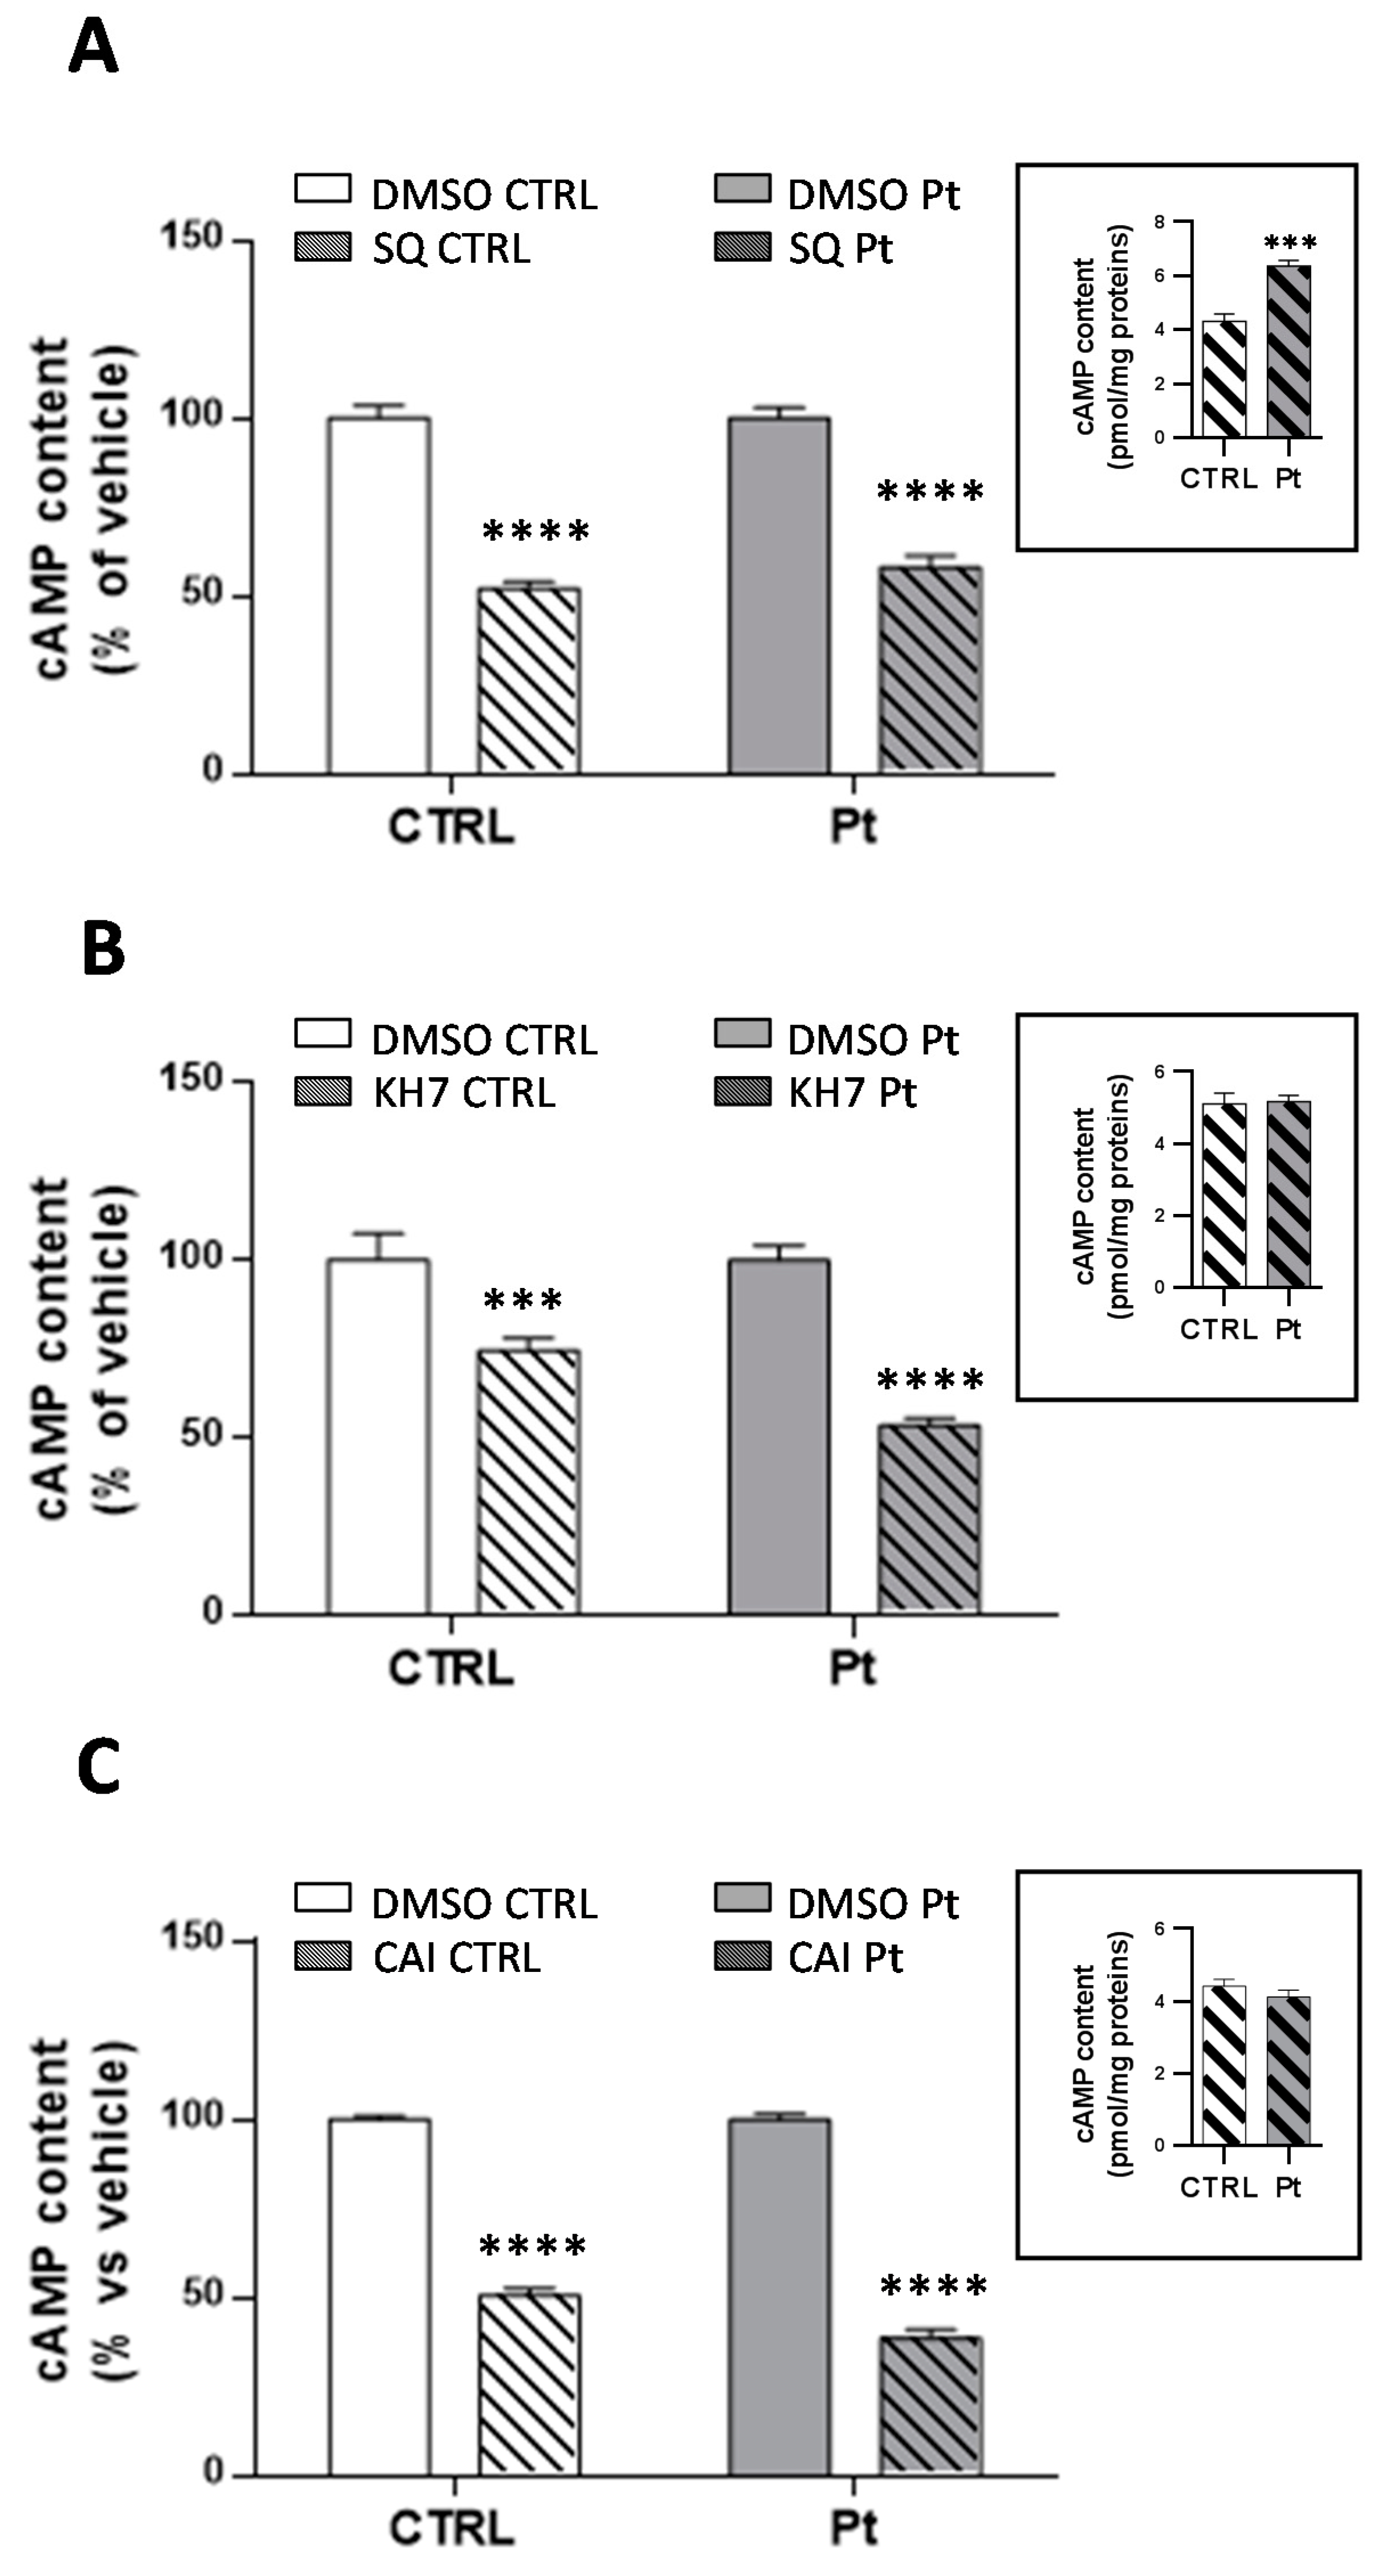
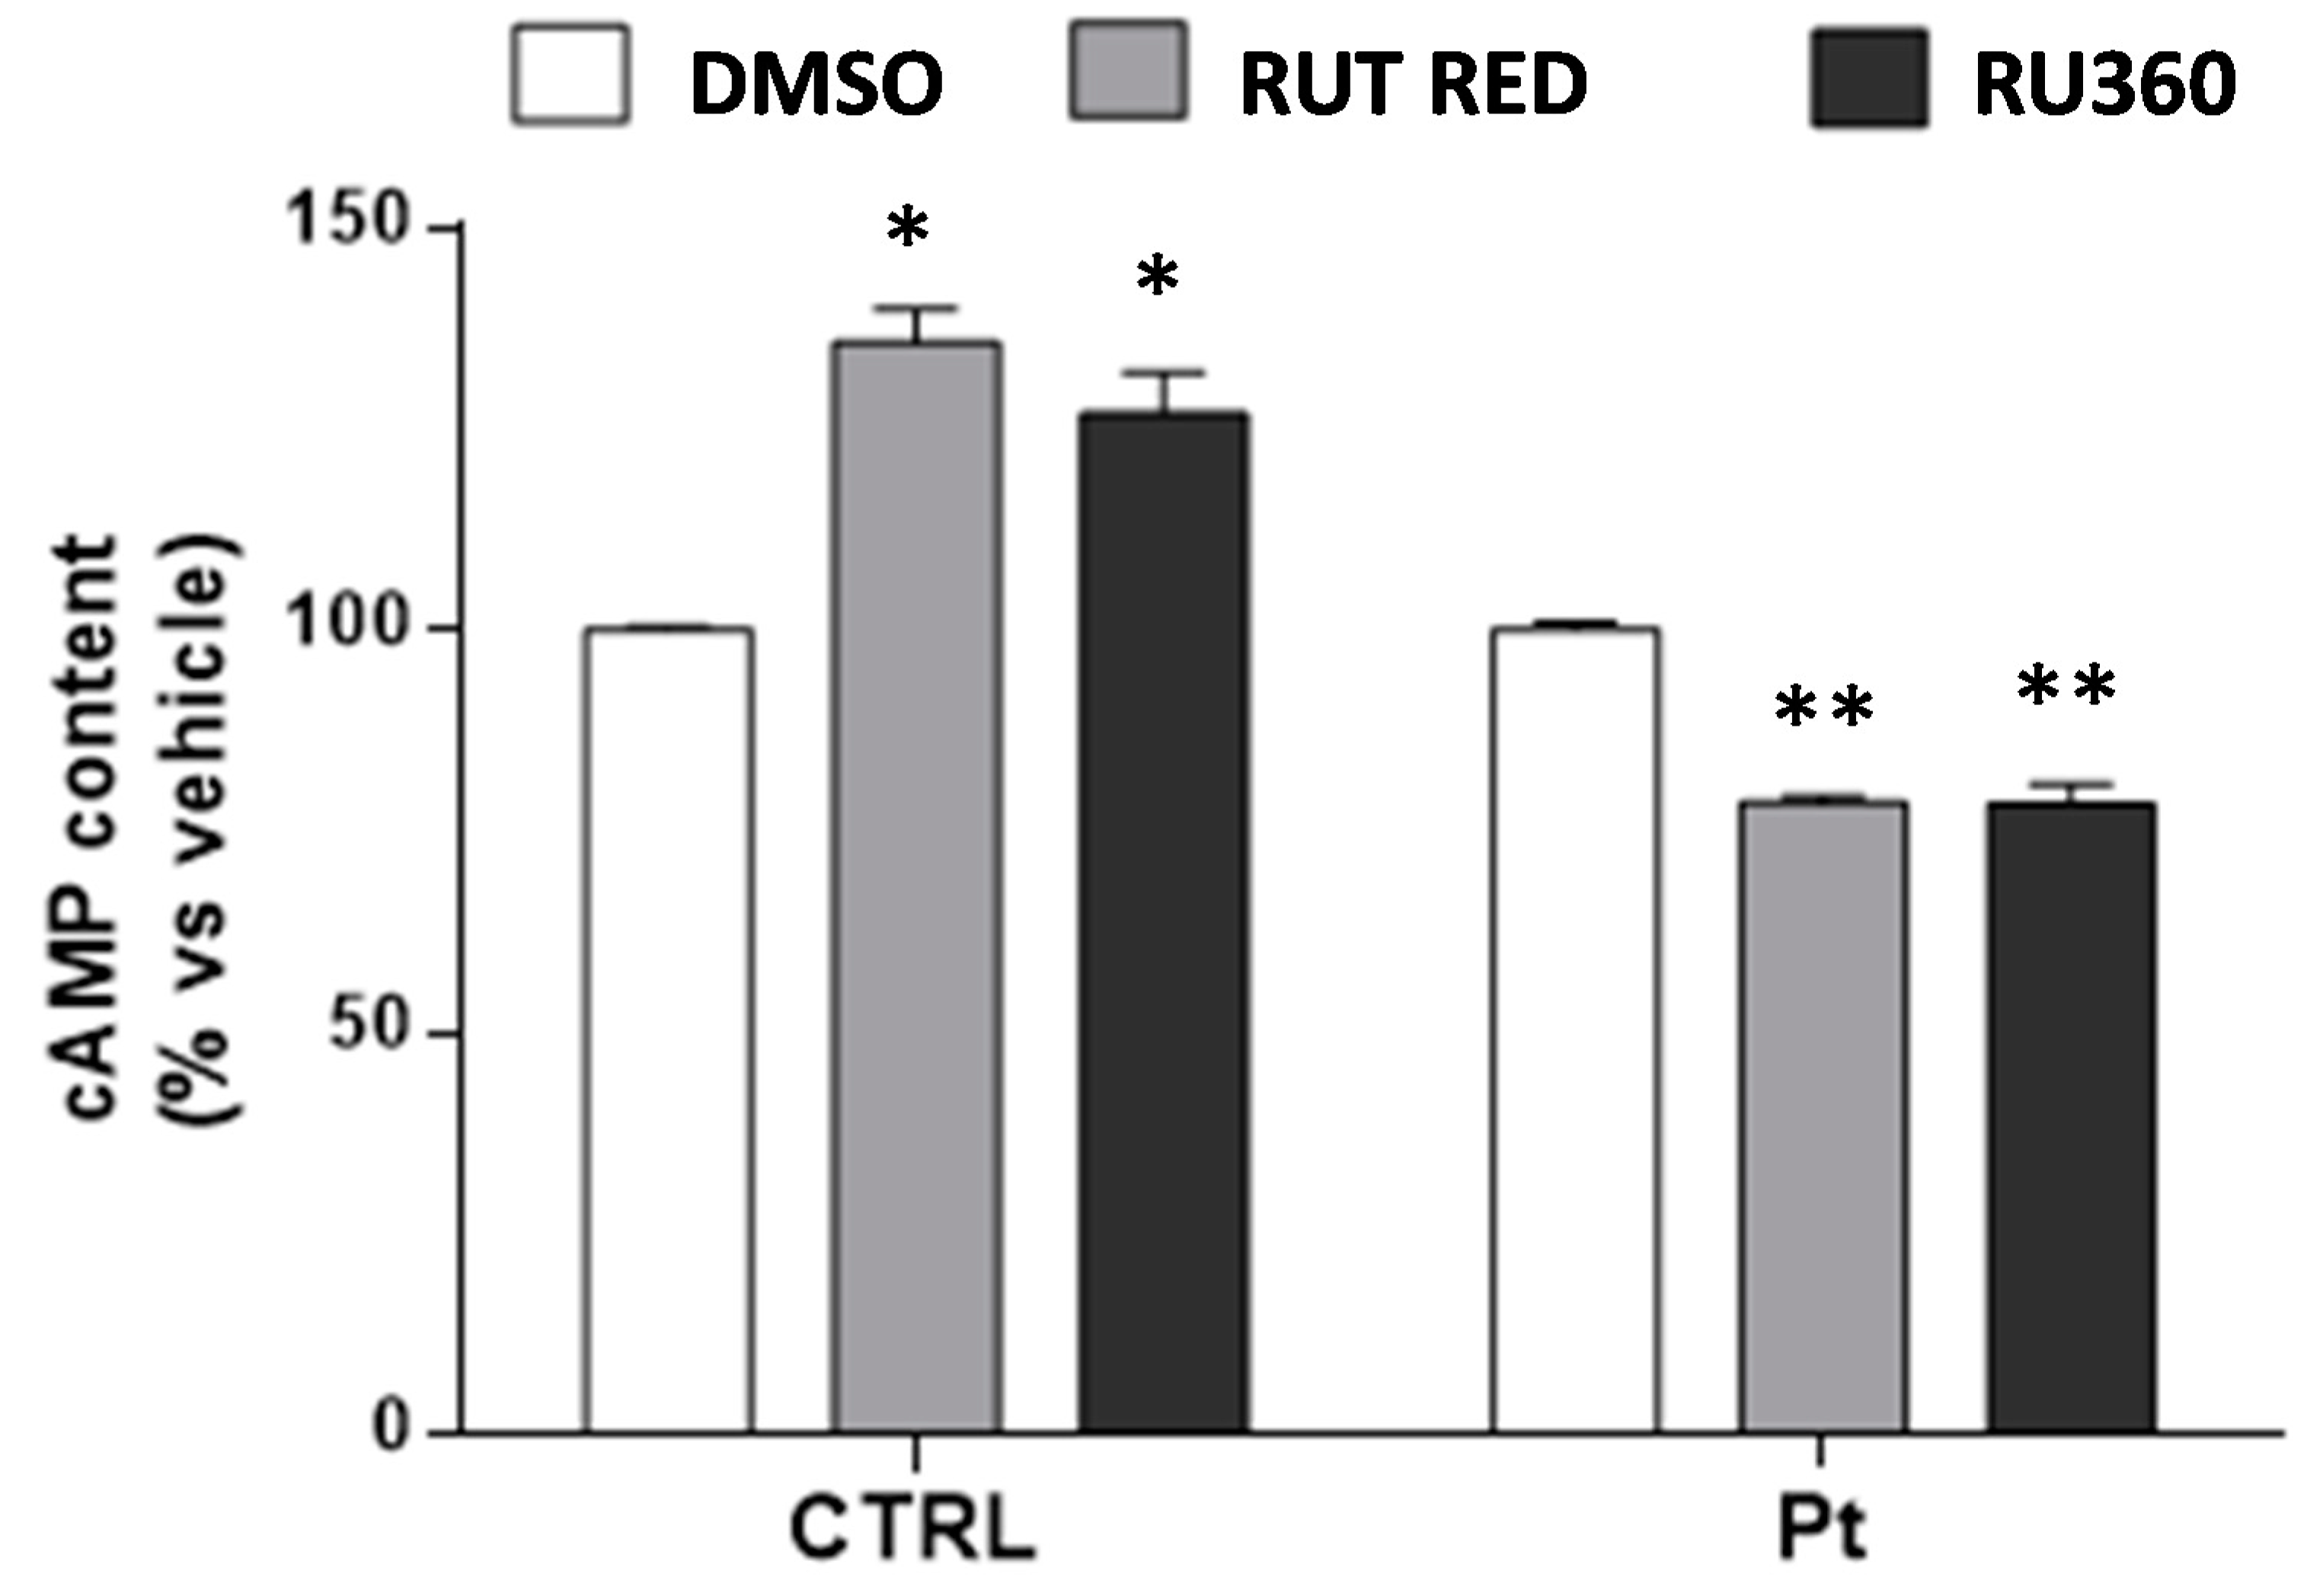
3.4. Inhibition of Ca2+ Uptake in Mitochondria Specifically Decreases cAMP Content in Parkin-Mutant Fibroblasts
3.5. High Mitochondrial Ca2+ Level Driven by Dantrolene Treatment in CTRL Fibroblasts Induces an Increase in cAMP Content
4. Discussion
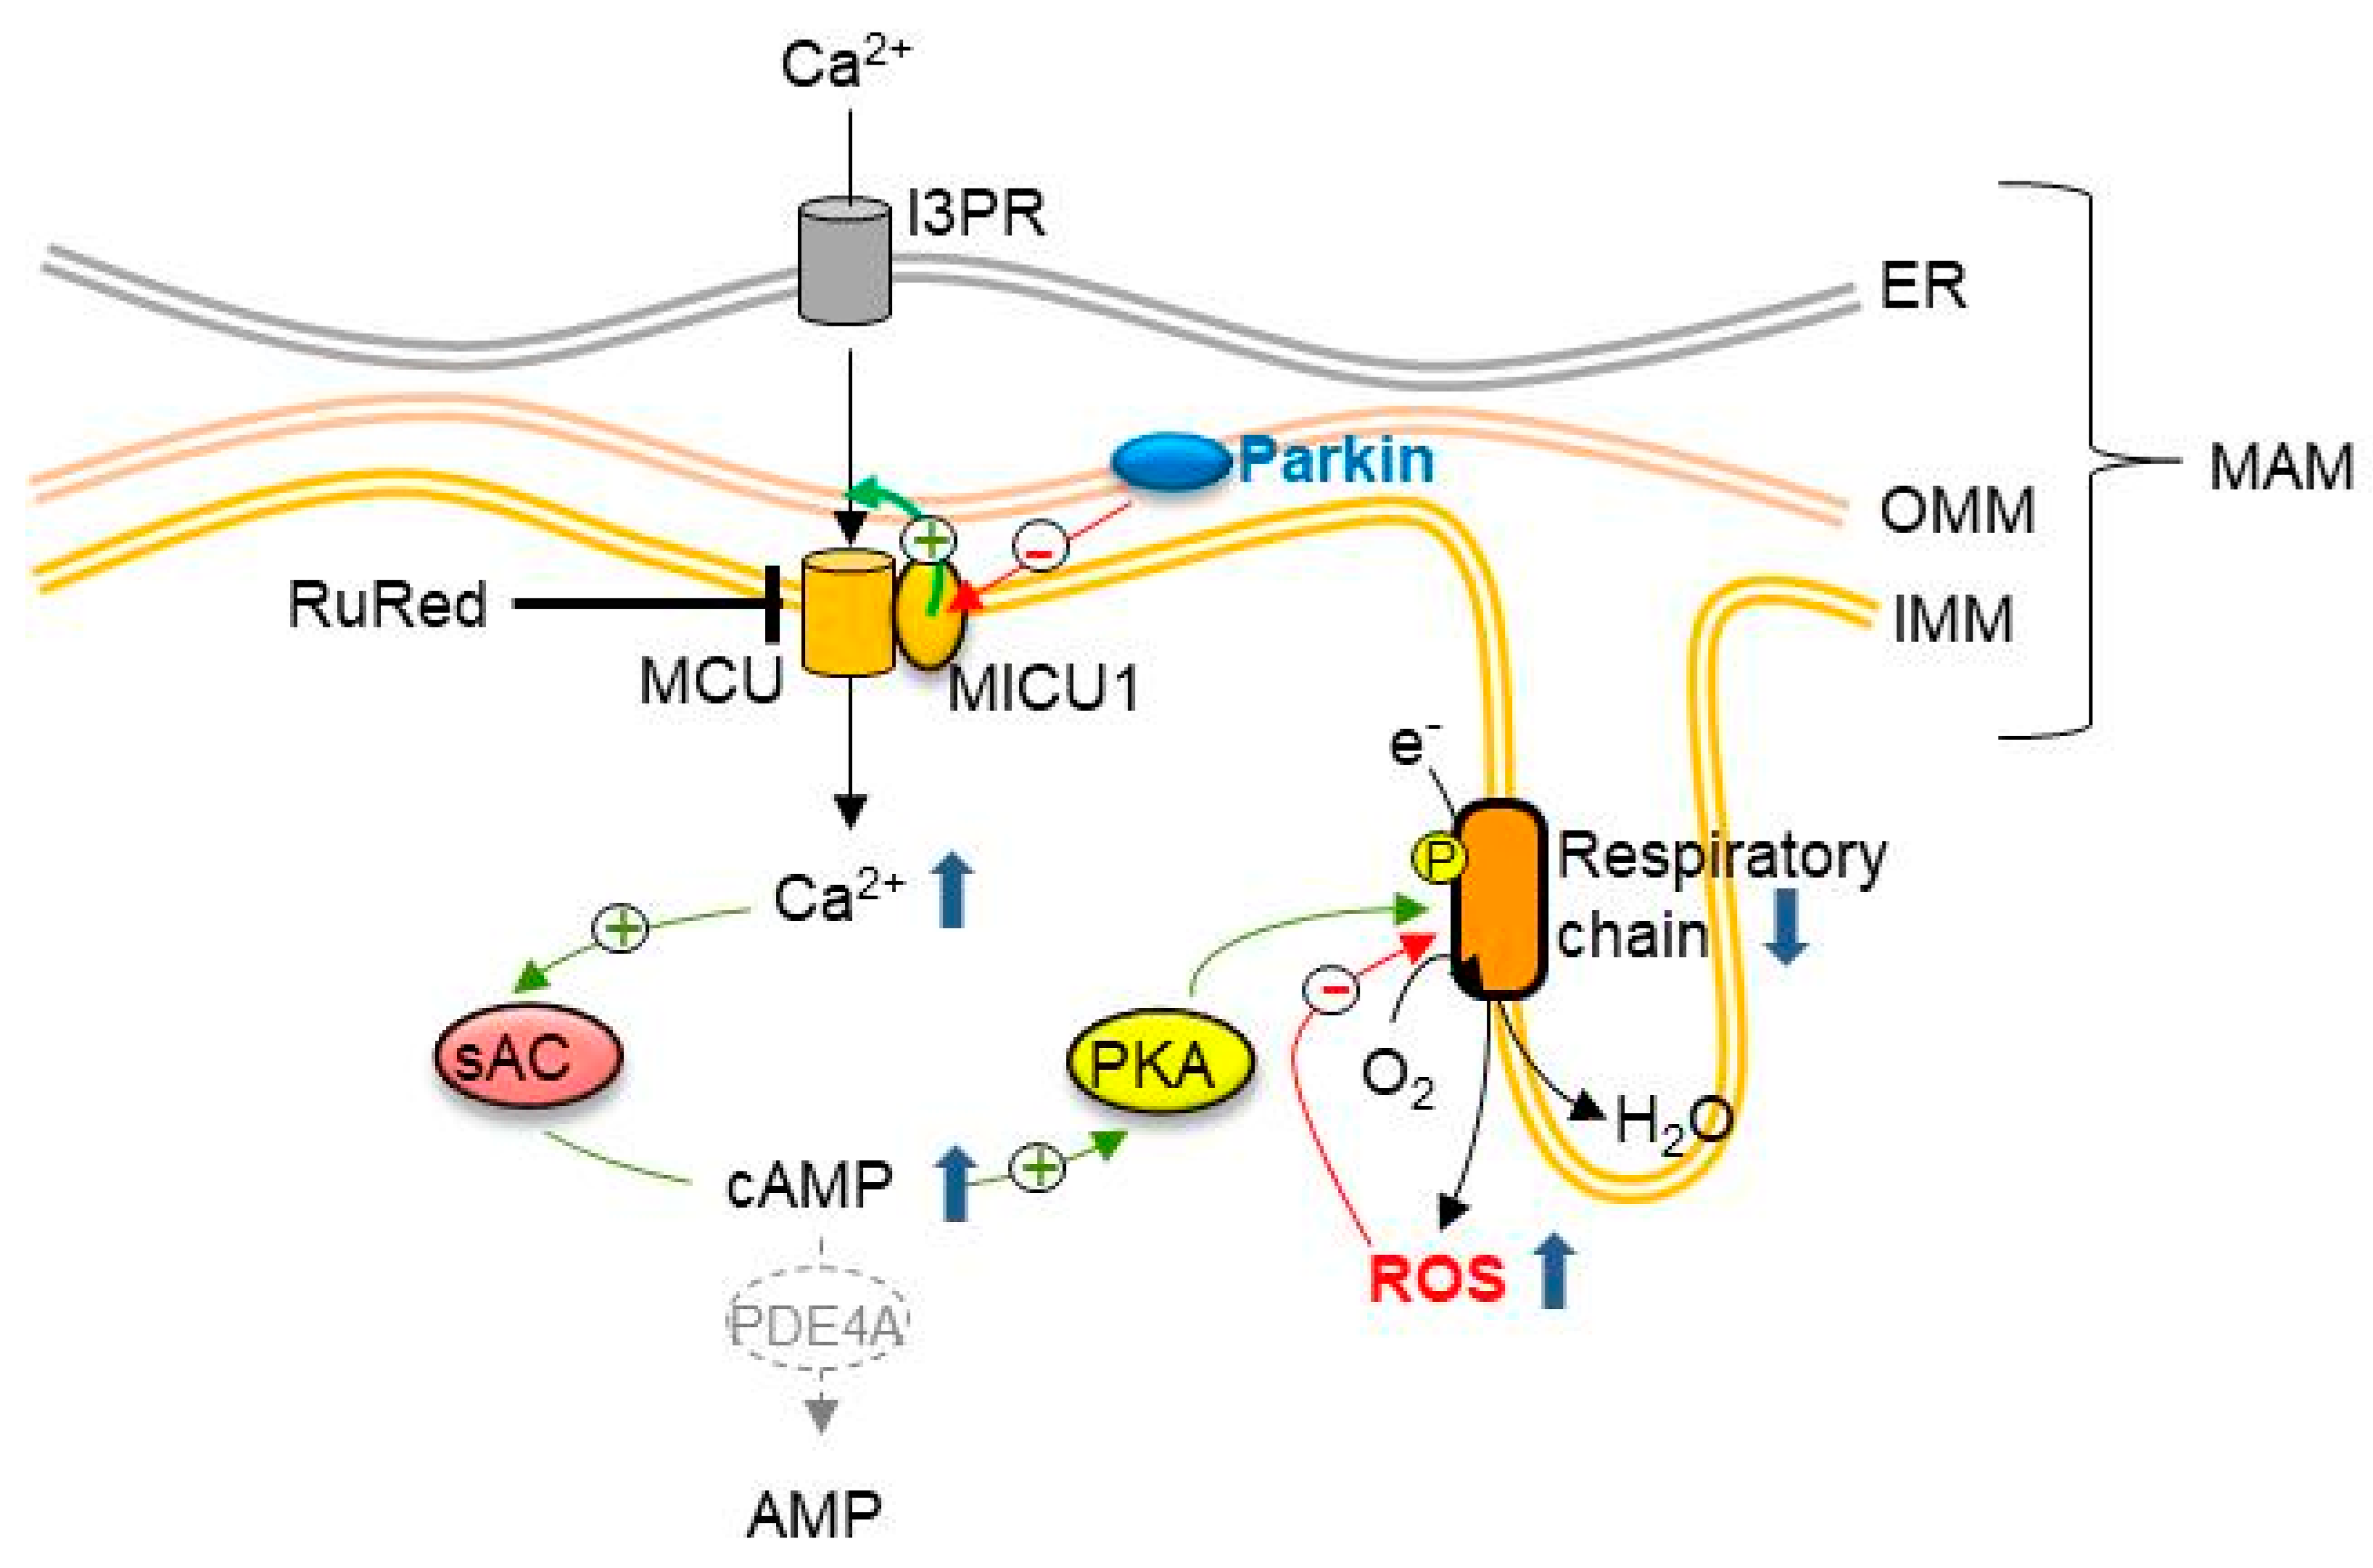
5. Conclusions
Supplementary Materials
Author Contributions
Funding
Conflicts of Interest
References
- Kitada, T.; Asakawa, S.; Hattori, N.; Matsumine, H.; Yamamura, Y.; Minoshima, S.; Yokochi, M.; Mizuno, Y.; Shimizu, N. Mutations in the parkin gene cause autosomal recessive juvenile parkinsonism. Nature 1998, 392, 605–608. [Google Scholar] [CrossRef] [PubMed]
- Shimura, H.; Hattori, N.; Kubo, S.; Mizuno, Y.; Asakawa, S.; Minoshima, S.; Shimizu, N.; Iwai, K.; Chiba, T.; Tanaka, K.; et al. Familial Parkinson disease gene product, parkin, is a ubiquitin-protein ligase. Nat. Genet. 2000, 25, 302–305. [Google Scholar] [CrossRef] [PubMed]
- Kahle, P.J.; Haass, C. How does parkin ligate ubiquitin to Parkinson’s disease? EMBO Rep. 2004, 5, 681–685. [Google Scholar] [CrossRef] [PubMed]
- Palacino, J.J.; Sagi, D.; Goldberg, M.S.; Krauss, S.; Motz, C.; Wacker, M.; Klose, J.; Shen, J. Mitochondrial dysfunction and oxidative damage in parkin-deficient mice. J. Biol. Chem. 2004, 279, 18614–18622. [Google Scholar] [CrossRef] [PubMed]
- Giguère, N.; Pacelli, C.; Saumure, C.; Bourque, M.-J.; Matheoud, D.; Levesque, D.; Slack, R.S.; Park, D.S.; Trudeau, L.-É. Comparative analysis of Parkinson’s disease-associated genes in mice reveals altered survival and bioenergetics of Parkin-deficient dopamine neurons. J. Biol. Chem. 2018, 293, 9580–9593. [Google Scholar] [CrossRef] [PubMed]
- Botella, J.A.; Bayersdorfer, F.; Gmeiner, F.; Schneuwly, S. Modelling Parkinson’s disease in Drosophila. Neuromol. Med. 2009, 11, 268–280. [Google Scholar] [CrossRef] [PubMed]
- Greene, J.C.; Whitworth, A.J.; Kuo, I.; Andrews, L.A.; Feany, M.B.; Pallanck, L.J. Mitochondrial pathology and apoptotic muscle degeneration in Drosophila parkin mutants. Proc. Natl. Acad. Sci. USA 2003, 100, 4078–4083. [Google Scholar] [CrossRef] [PubMed]
- Müftüoglu, M.; Elibol, B.; Dalmizrak, O.; Ercan, A.; Kulaksiz, G.; Ogüs, H.; Dalkara, T.; Ozer, N. Mitochondrial complex I and IV activities in leukocytes from patients with parkin mutations. Mov. Disord. 2004, 19, 544–548. [Google Scholar] [CrossRef] [PubMed]
- Mortiboys, H.; Thomas, K.J.; Koopman, W.J.H.; Klaffke, S.; Abou-Sleiman, P.; Olpin, S.; Wood, N.W.; Willems, P.H.G.M.; Smeitink, J.A.M.; Cookson, M.R.; et al. Mitochondrial function and morphology are impaired in parkin-mutant fibroblasts. Ann. Neurol. 2008, 64, 555–565. [Google Scholar] [CrossRef] [PubMed]
- Pacelli, C.; De Rasmo, D.; Signorile, A.; Grattagliano, I.; di Tullio, G.; D’Orazio, A.; Nico, B.; Comi, G.P.; Ronchi, D.; Ferranini, E.; et al. Mitochondrial defect and PGC-1α dysfunction in parkin-associated familial Parkinson’s disease. Biochim. Biophys. Acta 2011, 1812, 1041–1053. [Google Scholar] [CrossRef] [PubMed]
- Ferretta, A.; Gaballo, A.; Tanzarella, P.; Piccoli, C.; Capitanio, N.; Nico, B.; Annese, T.; Di Paola, M.; Dell’aquila, C.; De Mari, M.; et al. Effect of resveratrol on mitochondrial function: Implications in parkin-associated familiar Parkinson’s disease. Biochim. Biophys. Acta 2014, 1842, 902–915. [Google Scholar] [CrossRef] [PubMed]
- Whitworth, A.J.; Pallanck, L.J. The PINK1/Parkin pathway: A mitochondrial quality control system? J. Bioenerg. Biomembr. 2009, 41, 499–503. [Google Scholar] [CrossRef] [PubMed]
- Narendra, D.P.; Youle, R.J. Targeting mitochondrial dysfunction: Role for PINK1 and Parkin in mitochondrial quality control. Antioxid. Redox Signal. 2011, 14, 1929–1938. [Google Scholar] [CrossRef] [PubMed]
- Gautier, C.A.; Erpapazoglou, Z.; Mouton-Liger, F.; Muriel, M.P.; Cormier, F.; Bigou, S.; Duffaure, S.; Girard, M.; Foret, B.; Iannielli, A.; et al. The endoplasmic reticulum-mitochondria interface is perturbed in PARK2 knockout mice and patients with PARK2 mutations. Hum. Mol. Genet. 2016, 25, 2972–2984. [Google Scholar] [CrossRef] [PubMed]
- Sandebring, A.; Dehvari, N.; Perez-Manso, M.; Thomas, K.J.; Karpilovski, E.; Cookson, M.R.; Cowburn, R.F.; Cedazo-Mínguez, A. Parkin deficiency disrupts calcium homeostasis by modulating phospholipase C signalling. FEBS J. 2009, 276, 5041–5052. [Google Scholar] [CrossRef] [PubMed]
- Calì, T.; Ottolini, D.; Negro, A.; Brini, M. Enhanced parkin levels favor ER-mitochondria crosstalk and guarantee Ca(2+) transfer to sustain cell bioenergetics. Biochim. Biophys. Acta 2013, 1832, 495–508. [Google Scholar] [CrossRef] [PubMed]
- Cocco, T.; Papa, S. Molecular Targets for Improvement of Parkinson’s Disease Therapy. Brain Disord. Ther. 2015, 4, 173. [Google Scholar] [CrossRef]
- Vergara, D.; Gaballo, A.; Signorile, A.; Ferretta, A.; Tanzarella, P.; Pacelli, C.; Di Paola, M.; Cocco, T.; Maffia, M. Resveratrol Modulation of Protein Expression in parkin-Mutant Human Skin Fibroblasts: A Proteomic Approach. Oxid Med. Cell Longev. 2017, 2017, 2198243. [Google Scholar] [CrossRef] [PubMed]
- Lippolis, R.; Siciliano, R.A.; Pacelli, C.; Ferretta, A.; Mazzeo, M.F.; Scacco, S.; Papa, F.; Gaballo, A.; Dell’Aquila, C.; De Mari, M.; et al. Altered protein expression pattern in skin fibroblasts from parkin-mutant early-onset Parkinson’s disease patients. Biochim. Biophys. Acta 2015, 1852, 1960–1970. [Google Scholar] [CrossRef] [PubMed]
- Lobasso, S.; Tanzarella, P.; Vergara, D.; Maffia, M.; Cocco, T.; Corcelli, A. Lipid profiling of parkin-mutant human skin fibroblasts. J. Cell. Physiol. 2017, 232, 3540–3551. [Google Scholar] [CrossRef] [PubMed]
- Signorile, A.; Santeramo, A.; Tamma, G.; Pellegrino, T.; D’Oria, S.; Lattanzio, P.; De Rasmo, D. Mitochondrial cAMP prevents apoptosis modulating Sirt3 protein level and OPA1 processing in cardiac myoblast cells. Biochim. Biophys. Acta 2017, 1864, 355–366. [Google Scholar] [CrossRef] [PubMed]
- Valsecchi, F.; Ramos-Espiritu, L.S.; Buck, J.; Levin, L.R.; Manfredi, G. cAMP and mitochondria. Physiology 2013, 28, 199–209. [Google Scholar] [CrossRef] [PubMed]
- Zhang, F.; Zhang, L.; Qi, Y.; Xu, H. Mitochondrial cAMP signaling. Cell. Mol. Life Sci. 2016, 73, 4577–4590. [Google Scholar] [CrossRef] [PubMed]
- De Rasmo, D.; Signorile, A.; Santeramo, A.; Larizza, M.; Lattanzio, P.; Capitanio, G.; Papa, S. Intramitochondrial adenylyl cyclase controls the turnover of nuclear-encoded subunits and activity of mammalian complex I of the respiratory chain. Biochim. Biophys. Acta 2015, 1853, 183–191. [Google Scholar] [CrossRef] [PubMed]
- De Rasmo, D.; Signorile, A.; Papa, F.; Roca, E.; Papa, S. cAMP/Ca2+ response element-binding protein plays a central role in the biogenesis of respiratory chain proteins in mammalian cells. IUBMB Life 2010, 62, 447–452. [Google Scholar] [CrossRef] [PubMed]
- Papa, S.; Sardanelli, A.M.; Scacco, S.; Petruzzella, V.; Technikova-Dobrova, Z.; Vergari, R.; Signorile, A. The NADH: Ubiquinone oxidoreductase (complex I) of the mammalian respiratory chain and the cAMP cascade. J. Bioenerg. Biomembr. 2002, 34, 1–10. [Google Scholar] [CrossRef] [PubMed]
- Piccoli, C.; Scacco, S.; Bellomo, F.; Signorile, A.; Iuso, A.; Boffoli, D.; Scrima, R.; Capitanio, N.; Papa, S. cAMP controls oxygen metabolism in mammalian cells. FEBS Lett. 2006, 580, 4539–4543. [Google Scholar] [CrossRef] [PubMed]
- Valsecchi, F.; Konrad, C.; D’Aurelio, M.; Ramos-Espiritu, L.S.; Stepanova, A.; Burstein, S.R.; Galkin, A.; Magranè, J.; Starkov, A.; Buck, J.; et al. Distinct intracellular sAC-cAMP domains regulate ER Ca2+ signaling and OXPHOS function. J. Cell Sci. 2017, 130, 3713–3727. [Google Scholar] [CrossRef] [PubMed]
- Dessauer, C.W.; Watts, V.J.; Ostrom, R.S.; Conti, M.; Dove, S.; Seifert, R. International Union of Basic and Clinical Pharmacology. CI. Structures and Small Molecule Modulators of Mammalian Adenylyl Cyclases. Pharmacol. Rev. 2017, 69, 93–139. [Google Scholar] [CrossRef] [PubMed]
- Tresguerres, M.; Levin, L.R.; Buck, J. Intracellular cAMP signaling by soluble adenylyl cyclase. Kidney Int. 2011, 79, 1277–1288. [Google Scholar] [CrossRef] [PubMed]
- Rahman, N.; Buck, J.; Levin, L.R. pH sensing via bicarbonate-regulated “soluble” adenylyl cyclase (sAC). Front. Physiol 2013, 4, 343. [Google Scholar] [CrossRef] [PubMed]
- Zippin, J.H.; Chen, Y.; Nahirney, P.; Kamenetsky, M.; Wuttke, M.S.; Fischman, D.A.; Levin, L.R.; Buck, J. Compartmentalization of bicarbonate-sensitive adenylyl cyclase in distinct signaling microdomains. FASEB J. 2003, 17, 82–84. [Google Scholar] [CrossRef] [PubMed]
- Lefkimmiatis, K.; Zaccolo, M. cAMP signaling in subcellular compartments. Pharmacol. Ther. 2014, 143, 295–304. [Google Scholar] [CrossRef] [PubMed]
- Sardanelli, A.M.; Signorile, A.; Nuzzi, R.; Rasmo, D.D.; Technikova-Dobrova, Z.; Drahota, Z.; Occhiello, A.; Pica, A.; Papa, S. Occurrence of A-kinase anchor protein and associated cAMP-dependent protein kinase in the inner compartment of mammalian mitochondria. FEBS Lett. 2006, 580, 5690–5696. [Google Scholar] [CrossRef] [PubMed]
- Conti, M.; Jin, S.L. The molecular biology of cyclic nucleotide phosphodiesterases. Prog. Nucleic Acid Res. Mol. Biol. 1999, 63, 1–38. [Google Scholar] [PubMed]
- Bender, A.T.; Beavo, J.A. Cyclic nucleotide phosphodiesterases: Molecular regulation to clinical use. Pharmacol. Rev. 2006, 58, 488–520. [Google Scholar] [CrossRef] [PubMed]
- Francis, S.H.; Blount, M.A.; Corbin, J.D. Mammalian cyclic nucleotide phosphodiesterases: Molecular mechanisms and physiological functions. Physiol. Rev. 2011, 91, 651–690. [Google Scholar] [CrossRef] [PubMed]
- Halls, M.L.; Cooper, D.M.F. Regulation by Ca2+-Signaling Pathways of Adenylyl Cyclases. Cold Spring Harb. Perspect. Biol. 2011, 3, a004143. [Google Scholar] [CrossRef] [PubMed]
- Jaiswal, B.S.; Conti, M. Calcium regulation of the soluble adenylyl cyclase expressed in mammalian spermatozoa. Proc. Natl. Acad. Sci. USA 2003, 100, 10676–10681. [Google Scholar] [CrossRef] [PubMed]
- Di Benedetto, G.; Scalzotto, E.; Mongillo, M.; Pozzan, T. Mitochondrial Ca2+ uptake induces cyclic AMP generation in the matrix and modulates organelle ATP levels. Cell Metab. 2013, 17, 965–975. [Google Scholar] [CrossRef] [PubMed]
- Ludtmann, M.H.R.; Abramov, A.Y. Mitochondrial calcium imbalance in Parkinson’s disease. Neurosci. Lett. 2018, 663, 86–90. [Google Scholar] [CrossRef] [PubMed]
- Grynkiewicz, G.; Poenie, M.; Tsien, R.Y. A new generation of Ca2+ indicators with greatly improved fluorescence properties. J. Biol. Chem. 1985, 260, 3440–3450. [Google Scholar] [PubMed]
- Livak, K.J.; Schmittgen, T.D. Analysis of relative gene expression data using real-time quantitative PCR and the 2(-Delta Delta C(T)) Method. Methods 2001, 25, 402–408. [Google Scholar] [CrossRef] [PubMed]
- Laemmli, U.K. Cleavage of structural proteins during the assembly of the head of bacteriophage T4. Nature 1970, 227, 680–685. [Google Scholar] [CrossRef] [PubMed]
- Conti, M.; Richter, W.; Mehats, C.; Livera, G.; Park, J.-Y.; Jin, C. Cyclic AMP-specific PDE4 phosphodiesterases as critical components of cyclic AMP signaling. J. Biol. Chem. 2003, 278, 5493–5496. [Google Scholar] [CrossRef] [PubMed]
- Gustafsson, Å.B.; Brunton, L.L. Interactions of the Cyclic AMP and Nitric Oxide Pathways in Cardiac Fibroblasts. In Pathophysiology of Cardiovascular Disease; Progress in Experimental Cardiology; Springer: Boston, MA, USA, 2004; pp. 109–123. ISBN 978-1-4613-5084-2. [Google Scholar]
- Schafer, P.H.; Truzzi, F.; Parton, A.; Wu, L.; Kosek, J.; Zhang, L.-H.; Horan, G.; Saltari, A.; Quadri, M.; Lotti, R.; et al. Phosphodiesterase 4 in inflammatory diseases: Effects of apremilast in psoriatic blood and in dermal myofibroblasts through the PDE4/CD271 complex. Cell Signal. 2016, 28, 753–763. [Google Scholar] [CrossRef] [PubMed]
- Selige, J.; Hatzelmann, A.; Dunkern, T. The differential impact of PDE4 subtypes in human lung fibroblasts on cytokine-induced proliferation and myofibroblast conversion. J. Cell. Physiol. 2011, 226, 1970–1980. [Google Scholar] [CrossRef] [PubMed]
- Litvin, T.N.; Kamenetsky, M.; Zarifyan, A.; Buck, J.; Levin, L.R. Kinetic properties of “soluble” adenylyl cyclase. Synergism between calcium and bicarbonate. J. Biol. Chem. 2003, 278, 15922–15926. [Google Scholar] [CrossRef] [PubMed]
- Fabbri, E.; Brighenti, L.; Ottolenghi, C. Inhibition of adenylate cyclase of catfish and rat hepatocyte membranes by 9-(tetrahydro-2-furyl)adenine (SQ 22536). J. Enzym. Inhib. 1991, 5, 87–98. [Google Scholar] [CrossRef] [PubMed]
- Hess, K.C.; Jones, B.H.; Marquez, B.; Chen, Y.; Ord, T.S.; Kamenetsky, M.; Miyamoto, C.; Zippin, J.H.; Kopf, G.S.; Suarez, S.S.; et al. The “soluble” adenylyl cyclase in sperm mediates multiple signaling events required for fertilization. Dev. Cell 2005, 9, 249–259. [Google Scholar] [CrossRef] [PubMed]
- Bitterman, J.L.; Ramos-Espiritu, L.; Diaz, A.; Levin, L.R.; Buck, J. Pharmacological distinction between soluble and transmembrane adenylyl cyclases. J. Pharmacol. Exp. Ther. 2013, 347, 589–598. [Google Scholar] [CrossRef] [PubMed]
- Swenson, E.R. New insights into carbonic anhydrase inhibition, vasodilation, and treatment of hypertensive-related diseases. Curr. Hypertens. Rep. 2014, 16, 467. [Google Scholar] [CrossRef] [PubMed]
- Acin-Perez, R.; Salazar, E.; Kamenetsky, M.; Buck, J.; Levin, L.R.; Manfredi, G. Cyclic AMP produced inside mitochondria regulates oxidative phosphorylation. Cell Metab. 2009, 9, 265–276. [Google Scholar] [CrossRef] [PubMed]
- Wiggins, S.V.; Steegborn, C.; Levin, L.R.; Buck, J. Pharmacological modulation of the CO2/HCO3-/pH-, calcium-, and ATP-sensing soluble adenylyl cyclase. Pharmacol. Ther. 2018, 190, 173–186. [Google Scholar] [CrossRef] [PubMed]
- Saalau-Bethell, S.M.; Berdini, V.; Cleasby, A.; Congreve, M.; Coyle, J.E.; Lock, V.; Murray, C.W.; O’Brien, M.A.; Rich, S.J.; Sambrook, T.; et al. Crystal structure of human soluble adenylate cyclase reveals a distinct, highly flexible allosteric bicarbonate binding pocket. ChemMedChem 2014, 9, 823–832. [Google Scholar] [CrossRef] [PubMed]
- Treiman, M.; Caspersen, C.; Christensen, S.B. A tool coming of age: Thapsigargin as an inhibitor of sarco-endoplasmic reticulum Ca(2+)-ATPases. Trends Pharmacol. Sci. 1998, 19, 131–135. [Google Scholar] [CrossRef]
- Fruen, B.R.; Mickelson, J.R.; Louis, C.F. Dantrolene inhibition of sarcoplasmic reticulum Ca2+ release by direct and specific action at skeletal muscle ryanodine receptors. J. Biol. Chem. 1997, 272, 26965–26971. [Google Scholar] [CrossRef] [PubMed]
- Bravo, R.; Vicencio, J.M.; Parra, V.; Troncoso, R.; Munoz, J.P.; Bui, M.; Quiroga, C.; Rodriguez, A.E.; Verdejo, H.E.; Ferreira, J.; et al. Increased ER-mitochondrial coupling promotes mitochondrial respiration and bioenergetics during early phases of ER stress. J. Cell Sci. 2011, 124, 2143–2152. [Google Scholar] [CrossRef] [PubMed]
- Rizzuto, R.; Brini, M.; Murgia, M.; Pozzan, T. Microdomains with high Ca2+ close to IP3-sensitive channels that are sensed by neighboring mitochondria. Science 1993, 262, 744–747. [Google Scholar] [CrossRef] [PubMed]
- Chen, Y.; Cann, M.J.; Litvin, T.N.; Iourgenko, V.; Sinclair, M.L.; Levin, L.R.; Buck, J. Soluble adenylyl cyclase as an evolutionarily conserved bicarbonate sensor. Science 2000, 289, 625–628. [Google Scholar] [CrossRef] [PubMed]
- Niccolini, F.; Wilson, H.; Pagano, G.; Coello, C.; Mehta, M.A.; Searle, G.E.; Gunn, R.N.; Rabiner, E.A.; Foltynie, T.; Politis, M. Loss of phosphodiesterase 4 in Parkinson disease: Relevance to cognitive deficits. Neurology 2017, 89, 586–593. [Google Scholar] [CrossRef] [PubMed]
- Bruce, J.I.E.; Straub, S.V.; Yule, D.I. Crosstalk between cAMP and Ca2+ signaling in non-excitable cells. Cell Calcium 2003, 34, 431–444. [Google Scholar] [CrossRef]
- Kunzelmann, K.; Mehta, A. CFTR: A hub for kinases and crosstalk of cAMP and Ca2+. FEBS J. 2013, 280, 4417–4429. [Google Scholar] [CrossRef] [PubMed]
- Huang, Z.; Ren, S.; Jiang, Y.; Wang, T. PINK1 and Parkin cooperatively protect neurons against constitutively active TRP channel-induced retinal degeneration in Drosophila. Cell Death Dis. 2016, 7, e2179. [Google Scholar] [CrossRef] [PubMed]
- Ziviani, E.; Tao, R.N.; Whitworth, A.J. Drosophila parkin requires PINK1 for mitochondrial translocation and ubiquitinates mitofusin. Proc. Natl. Acad. Sci. USA 2010, 107, 5018–5023. [Google Scholar] [CrossRef] [PubMed]
- De Brito, O.M.; Scorrano, L. Mitofusin 2 tethers endoplasmic reticulum to mitochondria. Nature 2008, 456, 605–610. [Google Scholar] [CrossRef] [PubMed]
- Basso, V.; Marchesan, E.; Peggion, C.; Chakraborty, J.; von Stockum, S.; Giacomello, M.; Ottolini, D.; Debattisti, V.; Caicci, F.; Tasca, E.; et al. Regulation of ER-mitochondria contacts by Parkin via Mfn2. Pharmacol. Res. 2018, 138, 43–56. [Google Scholar] [CrossRef] [PubMed]
- Vance, J.E. MAM (mitochondria-associated membranes) in mammalian cells: Lipids and beyond. Biochim. Biophys. Acta 2014, 1841, 595–609. [Google Scholar] [CrossRef] [PubMed]
- Marchi, S.; Patergnani, S.; Pinton, P. The endoplasmic reticulum-mitochondria connection: One touch, multiple functions. Biochim. Biophys. Acta 2014, 1837, 461–469. [Google Scholar] [CrossRef] [PubMed]
- Krols, M.; Bultynck, G.; Janssens, S. ER-Mitochondria contact sites: A new regulator of cellular calcium flux comes into play. J. Cell Biol. 2016, 214, 367–370. [Google Scholar] [CrossRef] [PubMed]
- Paillusson, S.; Stoica, R.; Gomez-Suaga, P.; Lau, D.H.W.; Mueller, S.; Miller, T.; Miller, C.C.J. There’s Something Wrong with my MAM; the ER-Mitochondria Axis and Neurodegenerative Diseases. Trends Neurosci. 2016, 39, 146–157. [Google Scholar] [CrossRef] [PubMed]
- Arduíno, D.M.; Esteves, A.R.; Cardoso, S.M.; Oliveira, C.R. Endoplasmic reticulum and mitochondria interplay mediates apoptotic cell death: Relevance to Parkinson’s disease. Neurochem. Int. 2009, 55, 341–348. [Google Scholar] [CrossRef] [PubMed]
- Ottolini, D.; Calì, T.; Negro, A.; Brini, M. The Parkinson disease-related protein DJ-1 counteracts mitochondrial impairment induced by the tumour suppressor protein p53 by enhancing endoplasmic reticulum-mitochondria tethering. Hum. Mol. Genet. 2013, 22, 2152–2168. [Google Scholar] [CrossRef] [PubMed]
- Guardia-Laguarta, C.; Area-Gomez, E.; Rüb, C.; Liu, Y.; Magrané, J.; Becker, D.; Voos, W.; Schon, E.A.; Przedborski, S. α-Synuclein is localized to mitochondria-associated ER membranes. J. Neurosci. 2014, 34, 249–259. [Google Scholar] [CrossRef] [PubMed]
- Gómez-Suaga, P.; Pedro, J.M.B.-S.; González-Polo, R.A.; Fuentes, J.M.; Niso-Santano, M. ER–mitochondria signaling in Parkinson’s disease. Cell Death Dis. 2018, 9, 337. [Google Scholar] [CrossRef] [PubMed]
- Matteucci, A.; Patron, M.; Reane, D.V.; Gastaldello, S.; Amoroso, S.; Rizzuto, R.; Brini, M.; Raffaello, A.; Calì, T. Parkin-dependent regulation of the MCU complex component MICU1. Sci Rep. 2018, 8, 14199. [Google Scholar] [CrossRef] [PubMed]
- Patron, M.; Checchetto, V.; Raffaello, A.; Teardo, E.; Vecellio Reane, D.; Mantoan, M.; Granatiero, V.; Szabò, I.; De Stefani, D.; Rizzuto, R. MICU1 and MICU2 finely tune the mitochondrial Ca2+ uniporter by exerting opposite effects on MCU activity. Mol. Cell 2014, 53, 726–737. [Google Scholar] [CrossRef] [PubMed]
- Valsecchi, F.; Konrad, C.; Manfredi, G. Role of soluble adenylyl cyclase in mitochondria. Biochim. Biophys. Acta 2014, 1842, 2555–2560. [Google Scholar] [CrossRef] [PubMed]
- De Rasmo, D.; Signorile, A.; Larizza, M.; Pacelli, C.; Cocco, T.; Papa, S. Activation of the cAMP cascade in human fibroblast cultures rescues the activity of oxidatively damaged complex I. Free Radic. Biol. Med. 2012, 52, 757–764. [Google Scholar] [CrossRef] [PubMed]


© 2019 by the authors. Licensee MDPI, Basel, Switzerland. This article is an open access article distributed under the terms and conditions of the Creative Commons Attribution (CC BY) license (http://creativecommons.org/licenses/by/4.0/).
Share and Cite
Tanzarella, P.; Ferretta, A.; Barile, S.N.; Ancona, M.; De Rasmo, D.; Signorile, A.; Papa, S.; Capitanio, N.; Pacelli, C.; Cocco, T. Increased Levels of cAMP by the Calcium-Dependent Activation of Soluble Adenylyl Cyclase in Parkin-Mutant Fibroblasts. Cells 2019, 8, 250. https://doi.org/10.3390/cells8030250
Tanzarella P, Ferretta A, Barile SN, Ancona M, De Rasmo D, Signorile A, Papa S, Capitanio N, Pacelli C, Cocco T. Increased Levels of cAMP by the Calcium-Dependent Activation of Soluble Adenylyl Cyclase in Parkin-Mutant Fibroblasts. Cells. 2019; 8(3):250. https://doi.org/10.3390/cells8030250
Chicago/Turabian StyleTanzarella, Paola, Anna Ferretta, Simona Nicol Barile, Mariella Ancona, Domenico De Rasmo, Anna Signorile, Sergio Papa, Nazzareno Capitanio, Consiglia Pacelli, and Tiziana Cocco. 2019. "Increased Levels of cAMP by the Calcium-Dependent Activation of Soluble Adenylyl Cyclase in Parkin-Mutant Fibroblasts" Cells 8, no. 3: 250. https://doi.org/10.3390/cells8030250
APA StyleTanzarella, P., Ferretta, A., Barile, S. N., Ancona, M., De Rasmo, D., Signorile, A., Papa, S., Capitanio, N., Pacelli, C., & Cocco, T. (2019). Increased Levels of cAMP by the Calcium-Dependent Activation of Soluble Adenylyl Cyclase in Parkin-Mutant Fibroblasts. Cells, 8(3), 250. https://doi.org/10.3390/cells8030250