Meta-Analysis of Human and Mouse Biliary Epithelial Cell Gene Profiles


1
Liver Cell Biology Research Group, Department of Basic Biomedical Sciences, Vrije Universiteit Brussel, 1090 Brussels, Belgium
2
Department of Imaging and Pathology, Translational Cell and Tissue Research, KU Leuven and University Hospitals, 3000 Leuven, Belgium
3
Institut d’Investigacions Biomediques August Pi i Sunyer (IDIBAPS), 08001 Barcelona, Spain
*
Author to whom correspondence should be addressed.
Cells 2019, 8(10), 1117; https://doi.org/10.3390/cells8101117
Submission received: 29 July 2019
/
Revised: 3 September 2019
/
Accepted: 18 September 2019
/
Published: 20 September 2019
(This article belongs to the Special Issue Hepatic Stem Cells in Liver and Biliary Regeneration)
Abstract
:Background: Chronic liver diseases are frequently accompanied with activation of biliary epithelial cells (BECs) that can differentiate into hepatocytes and cholangiocytes, providing an endogenous back-up system. Functional studies on BECs often rely on isolations of an BEC cell population from healthy and/or injured livers. However, a consensus on the characterization of these cells has not yet been reached. The aim of this study was to compare the publicly available transcriptome profiles of human and mouse BECs and to establish gene signatures that can identify quiescent and activated human and mouse BECs. Methods: We used publicly available transcriptome data sets of human and mouse BECs, compared their profiles and analyzed co-expressed genes and pathways. By merging both human and mouse BEC-enriched genes, we obtained a quiescent and activation gene signature and tested them on BEC-like cells and different liver diseases using gene set enrichment analysis. In addition, we identified several genes from both gene signatures to identify BECs in a scRNA sequencing data set. Results: Comparison of mouse BEC transcriptome data sets showed that the isolation method and array platform strongly influences their general profile, still most populations are highly enriched in most genes currently associated with BECs. Pathway analysis on human and mouse BECs revealed the KRAS signaling as a new potential pathway in BEC activation. We established a quiescent and activated BEC gene signature that can be used to identify BEC-like cells and detect BEC enrichment in alcoholic hepatitis, non-alcoholic steatohepatitis (NASH) and peribiliary sclerotic livers. Finally, we identified a gene set that can distinguish BECs from other liver cells in mouse and human scRNAseq data. Conclusions: Through a meta-analysis of human and mouse BEC gene profiles we identified new potential pathways in BEC activation and created unique gene signatures for quiescent and activated BECs. These signatures and pathways will help in the further characterization of this progenitor cell type in mouse and human liver development and disease.
1. Introduction
Chronic liver diseases (CLD) can lead to hepatic dysfunction with organ failure. Early studies in humans showed that in conditions of submassive necrosis, reactive ductules and intermediate hepatocyte-like cells originate from the activation and differentiation of putative progenitor cells [1,2]. In such conditions, adult biliary epithelial cells (BECs) are believed to activate and differentiate, thereby providing an endogenous back-up system for replenishing hepatocytes and cholangiocytes when the regenerative capabilities of these cells are impaired [3,4,5]. When the biliary regeneration is compromised, hepatocytes can also provide a backup mechanism by transdifferentiating into BECs [6,7].
Due to their capacity for long-term expansion, chromosomal stability and their differentiation potential towards hepatocytes, such BECs could provide an exciting alternative over primary hepatocytes for toxicological studies and use in regenerative medicine [8]. Still, it is unclear whether BECs significantly contribute to liver regeneration. Studies based on in vivo lineage tracing in mice [9,10] initially revealed that only a limited percentage of BEC-derived hepatocytes could be detected during liver regeneration, suggesting a low contribution of BECs. Later studies show that, under very specific liver injury conditions in the mouse, BECs can significantly contribute to the regeneration of the liver [11,12]. In contrast, other studies have shown that inhibition of BEC regeneration impairs liver recovery and decreases survival [13,14].
The functionality of BECs can be studied by analyzing their transcriptome after isolation from healthy and injured mouse livers due to dietary supplements that result in chronic liver injury; the DDC (3,5-diethoxycarbonyl-1,4-dihydrocollidine) [15] and CDE (choline-deficient, ethionine-supplemented) [16] diets are the most frequently used models to establish an activation of the BECs (also known as a ductular reaction). The DDC diet is metabolized by hepatocytes into toxic protoporphyrins that are secreted into the bile ducts leading to cholangitis. This results in BEC expansion around the portal vein and differentiation into cholangiocytes [17]. A CDE diet results in hepatic damage with the formation of a ductular reaction going from the portal vein to the parenchyma and BEC differentiation towards hepatocytes [16]. BECs that can activate are sometimes also referred to as liver progenitor cells. In this manuscript we will refrain from using liver progenitor cells as a term and instead will refer to quiescent and activated BECs, depending on the state of the livers from which the BECs were isolated (healthy vs. diseased). For the isolation of BECs, surface markers [18,19], functional assays [20,21] or BEC reporter mice [10,22,23] are popular methods. While many studies have generated transcriptome profiles of BECs, isolated using different approaches from different mouse injury models (Table 1), so far, no comparative study has been conducted to compare gene signatures of human and mouse BECs. It is not unlikely that the use of different BEC isolation techniques has led to the isolation of subsets of BECs, which can lead to contradicting results if one considers them as the same.
An important hurdle to tackle in such a comparative study is that none of the publicly available transcriptome data sets of primary BECs use the same BEC marker or reporter gene for the isolation these cells. Indeed, Hnf1β [10], Mic1 1c3 [18] (further referred as Mic1c3), Foxl1 [22], Lgr5 [23] and Epcam [24] are all used to isolate BECs, but until recently there were no independent studies that confirmed any of these gene expression profiles. The Hnf1β+-, Foxl1+- and Lgr5+- BECs were isolated based on lineage tracing whereas Mic1c3+- and Epcam+-BECs were isolated based on their expression on the surface of these cells. One has to note that Hnf1β, Mic1c3 and Epcam are expressed in cholangiocytes as well as in quiescent BECs, while Foxl1 and Lgr5 are mainly expressed in activated BECs [10,18,22,23,24]. In addition, Foxl1 and Mic1c3 have been used to isolate activated BECs from DDC-injured livers, while Hnf1β positive cells were isolated from both CDE and DDC injured livers (Table 1). Other toxin-based models to study BEC biology have rarely been used to isolated BECs from, with exception of Lgr5+ cells isolated after a single CCl4 injection [23].
In a previous study, we reported on the first RNA sequencing-based transcriptome profiles of BECs isolated from alcoholic steatohepatitis patients through EpCAM- or TROP2-based FACS sorting (respectively epithelial cell adhesion molecule (TACSTD1) and trophoblast antigen 2 (TACSTD2) [25]. TROP-2 is a relatively new epithelial marker and is specifically expressed by activated progenitor cells in mouse models of liver disease [19]. Epcam is a well-established BEC marker which identifies cholangiocytes as well as BECs in mice and humans [26].
In this study, we performed a meta-analysis on gene expression data sets of both human and mouse BECs and created unique signatures for quiescent and activated BECs. Gene set enrichment analysis using these BEC signatures revealed an enrichment in livers of alcoholic steatohepatitis (ASH), non-alcoholic steatohepatitis (NASH) and primary sclerosing cholangitis (PSC) suggesting that these diseases are accompanied by a strong BEC activation. Finally, a selection of our BEC gene signatures can be used to identify quiescent and activated BECs in single cell RNA sequencing (scRNA seq) data sets.
2. Materials and Methods
2.1. Source of Gene Expression Data
We searched for publicly available transcriptomic data sets of BECs (see Table 1). We included only microarray data for mouse BECs, with at least two biological repeats, and using one of the three most widely used microarray platforms (Agilent 014868, Mouse 430_2 and Mogene 2.0st) so as to simplify the experiment. We avoided including more microarray platforms to avoid loss of genes due to mismatched annotation between the different platforms.
All microarray and RNA seq data used in this study are publicly available and described in Table 1 and Table 2. Raw microarray files were downloaded from NCBI (https://www.ncbi.nlm.nih.gov/geo) and imported into RStudio (https://www.rstudio.com). For human BEC RNA sequencing data, normalized count files were used from Ceulemans et al. (Table 1) [25]. BEC scRNA seq data was used from Pepe-Mooney et al., 2019 (GSE125688) and Azarina et al., 2019 (GSE124395) [27,28]. Supplementary Table S1 shows a list of samples that refer to quiescent or activated BECs.
2.2. Microarray Data Preparation
Microarray date sets were imported separately in RStudio and normalized using Robust Multiarray Averaging using R packages “affy” [31] and “limma” [32] and duplicated gene symbols were removed. Next, all datasets were pooled together based on their gene symbol and normalized a second time to decrease batch effects using Cycle Loess algorithm. Correlation analysis is performed on merged data with tSNE plot (R package “Rtsne”) and Pearson correlation heatmap in RStudio.
2.3. Generation of BEC Gene Signatures
First, mouse BEC transcriptome data was compared to healthy liver transcriptome data and genes were selected by a fold change larger than 8 and corrected p value lower than 0.05 using a Benjamini–Hochberg test. Next, genes were selected by comparing BEC transcriptomes to multiple cell types with criteria used in Friedmann et al., (fold change and p value) [33]. BEC signatures were obtained by merging both gene sets with those of human BEC signatures from Ceulemans et al. [25] using Venn diagrams (R package “VennDiagram”).
2.4. Gene Set Enrichment Analysis
Gene set enrichment analysis (GSEA) analysis was performed on normalized intensity values (microarray) or counts (RNA seq, transcripts per million) by comparing healthy livers (mouse data) or injured livers (human data) versus BEC transcriptomes. All Hallmark pathways were analyzed, and false discovery rate (FDR) scores were imported into RStudio to visualize, using heatmaps (R package “caret”). Significantly enriched pathways were based on positive NES score and FDR < 0.25 in at least one population. GSEA analysis to test BEC signatures were visualized using R package “circlize” by displaying -log(FDR) with a maximum -log(FDR) equal to 4 (FDR < 0.0001) for optimal visualization purposes. The direction of arrows represents enrichment of a signature towards cell types or liver tissues. Size of the arrow represents -log(FDR).
2.5. Gene Ontology Analysis
GO analysis from quiescent and activation BEC gene signature was obtained using R package “clusterProfiles” and human database from R package “AnnotationHub”. All biological processes were analyzed with p cutoff of 0.05. GO were visualized using the “dotplot” function in clusterProfiles.
2.6. Single Cell Signature Explorer
ScRNA seq data of BECs and Hepatocytes were downloaded from GEO database (GSE125688) and imported into RStudio. TSNE plots were created using “Seurat” packages [34]. Gene signature scores were calculated and visualized using “Single-Cell Signature Explorer” (https://sites.google.com/site/fredsoftwares/products/single-cell-signature-explorer). Briefly, gene signature scores are computed by Single-Cell Signature Score in linux. TSNE1 and tSNE2 values created within Seurat are merged together with signature score for each cell using Single-Cell Signature Merger and imported in RStudio. Single-Cell Signature Viewer, a shiny app (https://shiny.rstudio.com), was used to visualize signature scores on tSNE plots with adjustable scale bar.
3. Results
3.1. BEC Transcriptome Profiles Are Highly Affected by the Microarray Platform and Markers Used for Isolation
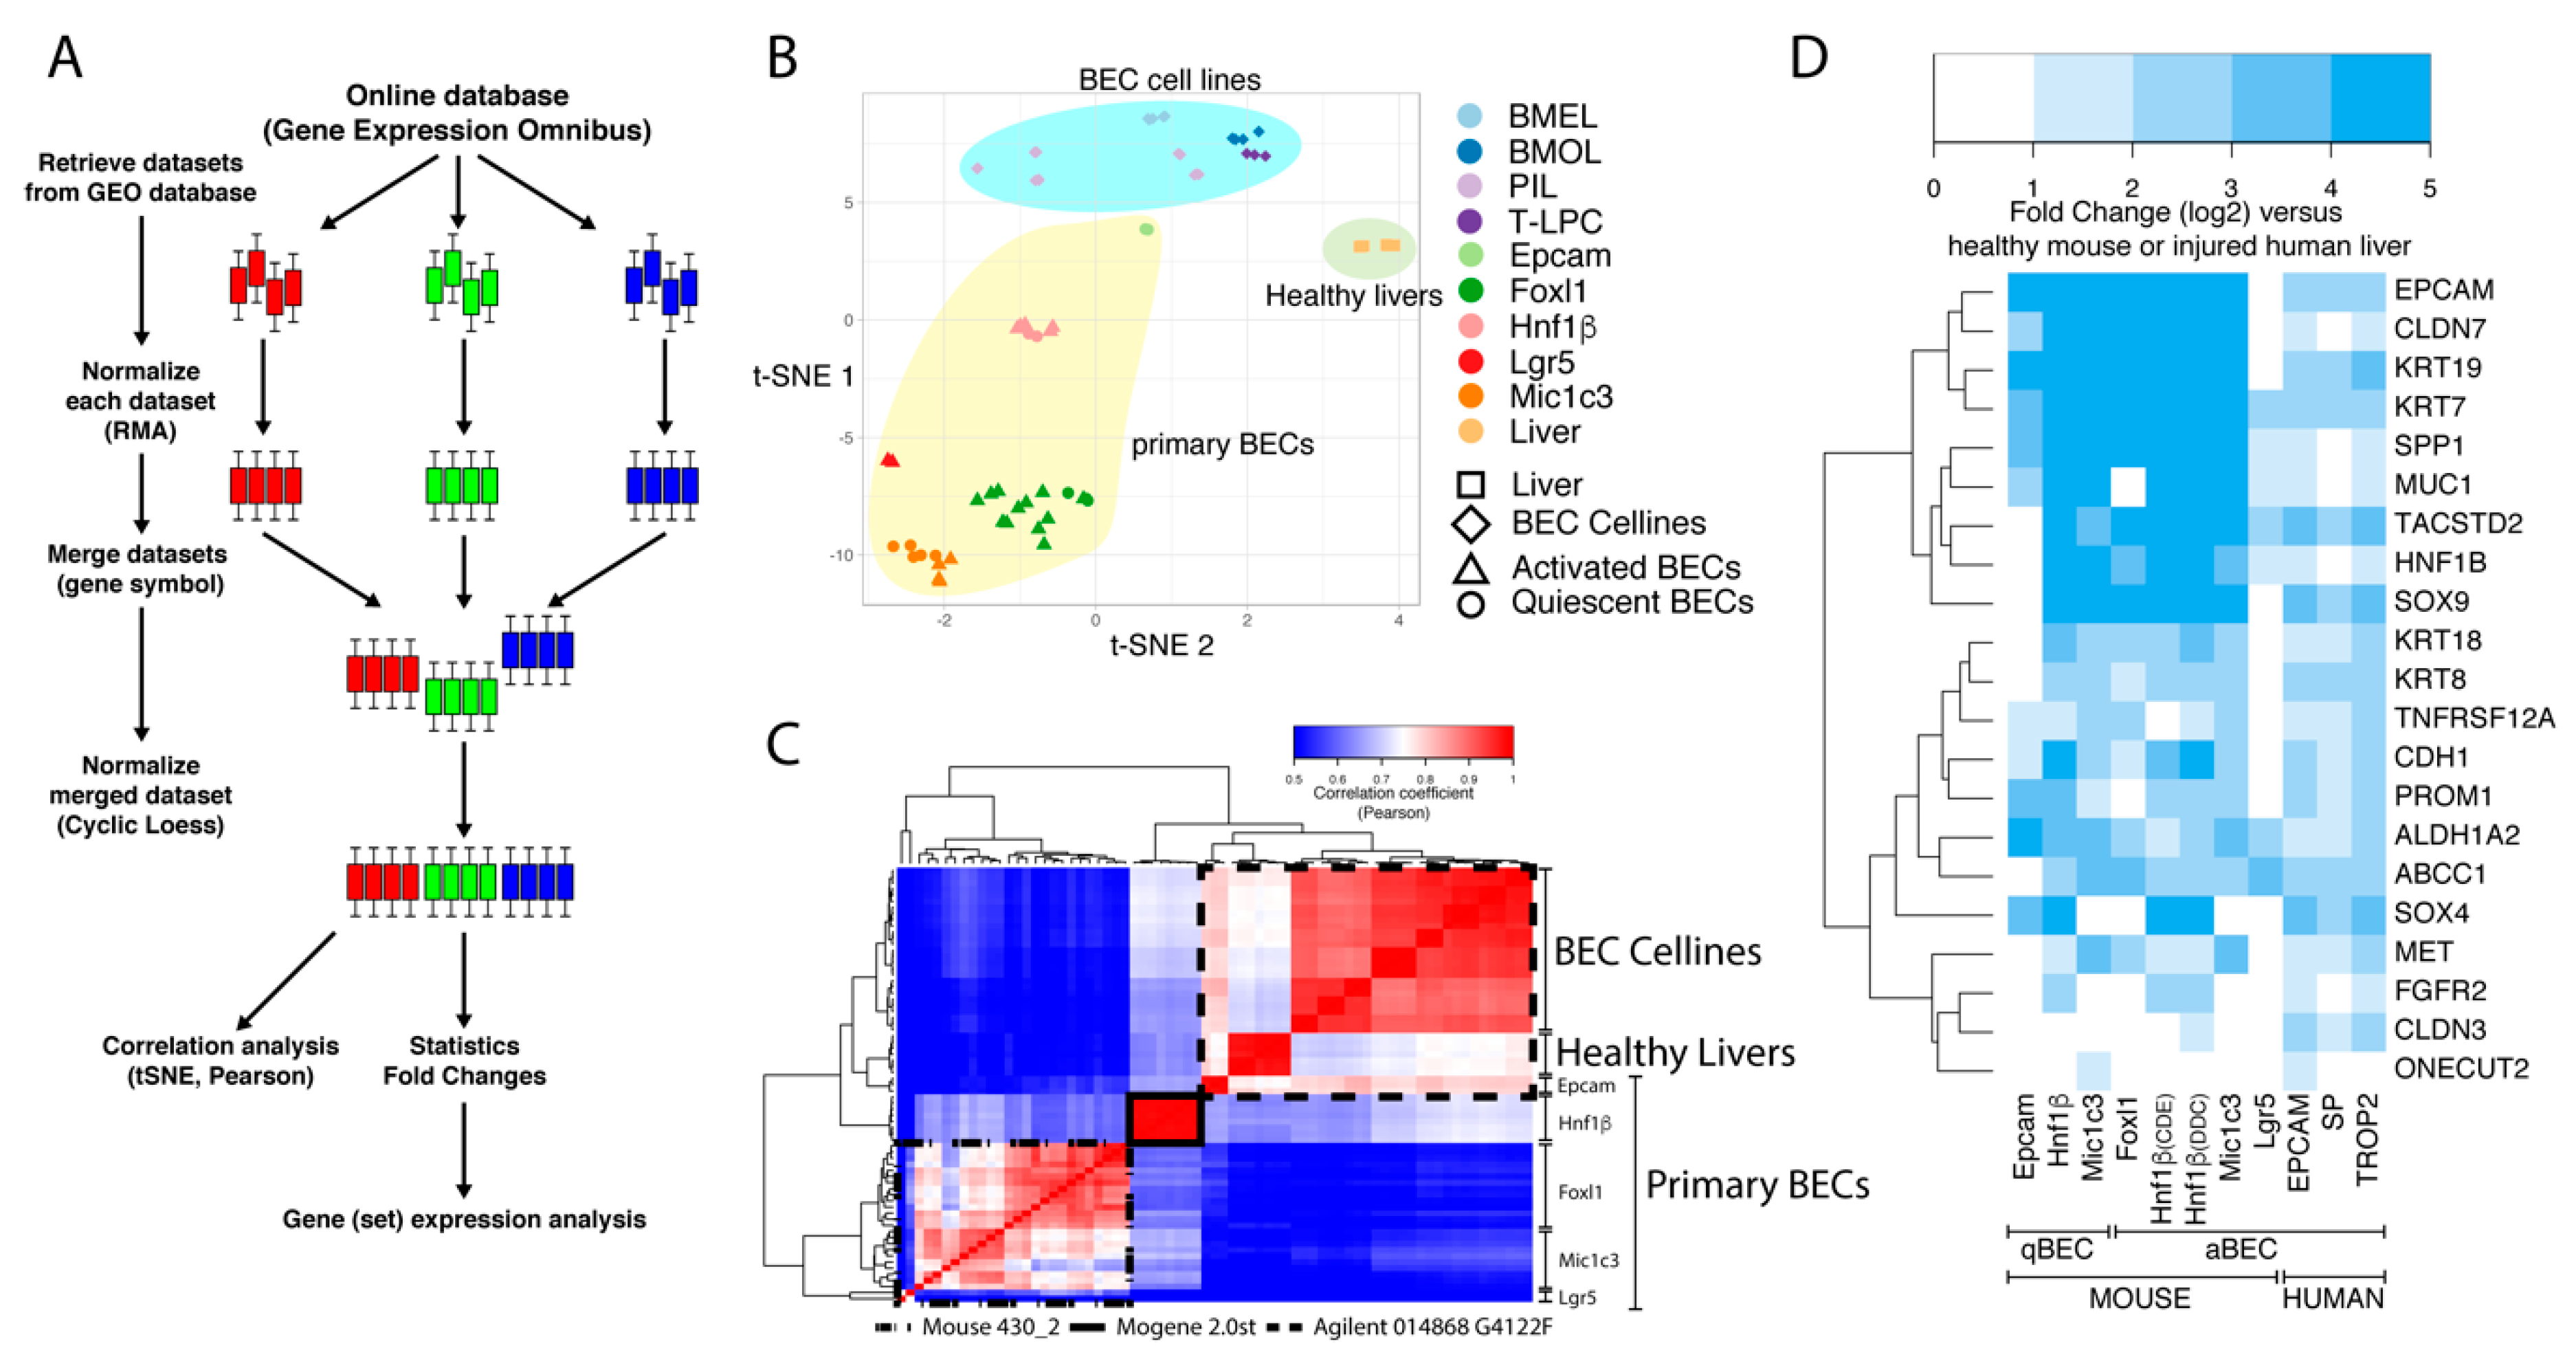
To establish comparable mouse BEC gene expression data sets, we first normalized each set separately and then pooled all sets together and eventually normalized the complete pooled set to minimize batch effects (Figure 1A). To be able to merge all of the microarrays, we first had to exclude some genes, for several reasons. Each microarray platform detects more than 20,000 genes by using probes that can bind to specific genes or even multiple genes. In our analysis, we first discarded probes that bind on multiple genes and afterwards discarded other genes that are not detected by all microarray platforms. We also noted that we lost several genes because multiple microarray platforms annotate some genes with different gene symbols. Finally, by pooling all microarrays, we obtained a dataset that contained 12,873 genes.
We first compared the expression profiles of freshly isolated mouse BECs [10,18,22,23,24,29] with four BEC cell lines [30] and healthy liver transcriptome data [30]. Multidimensional reduction analysis, presented in a t-distributed stochastic neighbor embedding (t-SNE) plot, showed that these three groups were clustered separately from each other (Figure 1B). We observed that within the primary BEC group, quiescent and activated BECs isolated using the same approach, could not be distinguished from each other (triangles cluster with circles of the same color; Figure 1B). Furthermore, it was striking to see that Hnf1b+ and EpCam+ BEC profiles were separated from the other primary BECs in this tSNE plot. This was confirmed by Pearson correlation analyses (Figure 1C); Epcam+ BECs cluster together with BEC cell lines and healthy livers while Hnf1β+ cells are again separated from these. A closer look at the platform taught us that Epcam+ BECs and the BEC cell lines were analyzed on the same Agilent platform, while Hnf1β+ cells were the only BECs analyzed with the Affimetrix (mogene 2.0 array). Together, this analysis confirms that the isolation method (or experimenter) and array platforms used are very strong confounders when different data sets need to be compared [35,36].
3.2. Meta-Analysis Confirms the Validity of Most BEC-Specific Genes
Despite these platform- and isolation-specific effects, we wanted to know whether the primary mouse and human BEC populations are indeed enriched in commonly used BEC-specific genes. As expected, virtually all commonly used BEC markers (highlighted by Rodrigo-Torres et al. [10]) are highly enriched in all the different mouse and human BEC populations (Figure 1D). The only exception is the Lgr5+ BEC population isolated from CCl4-treated mice, which suggests that Lgr5+ cells isolated from these livers are not similar to any of the other BECs isolated through other methods from other liver injury models.
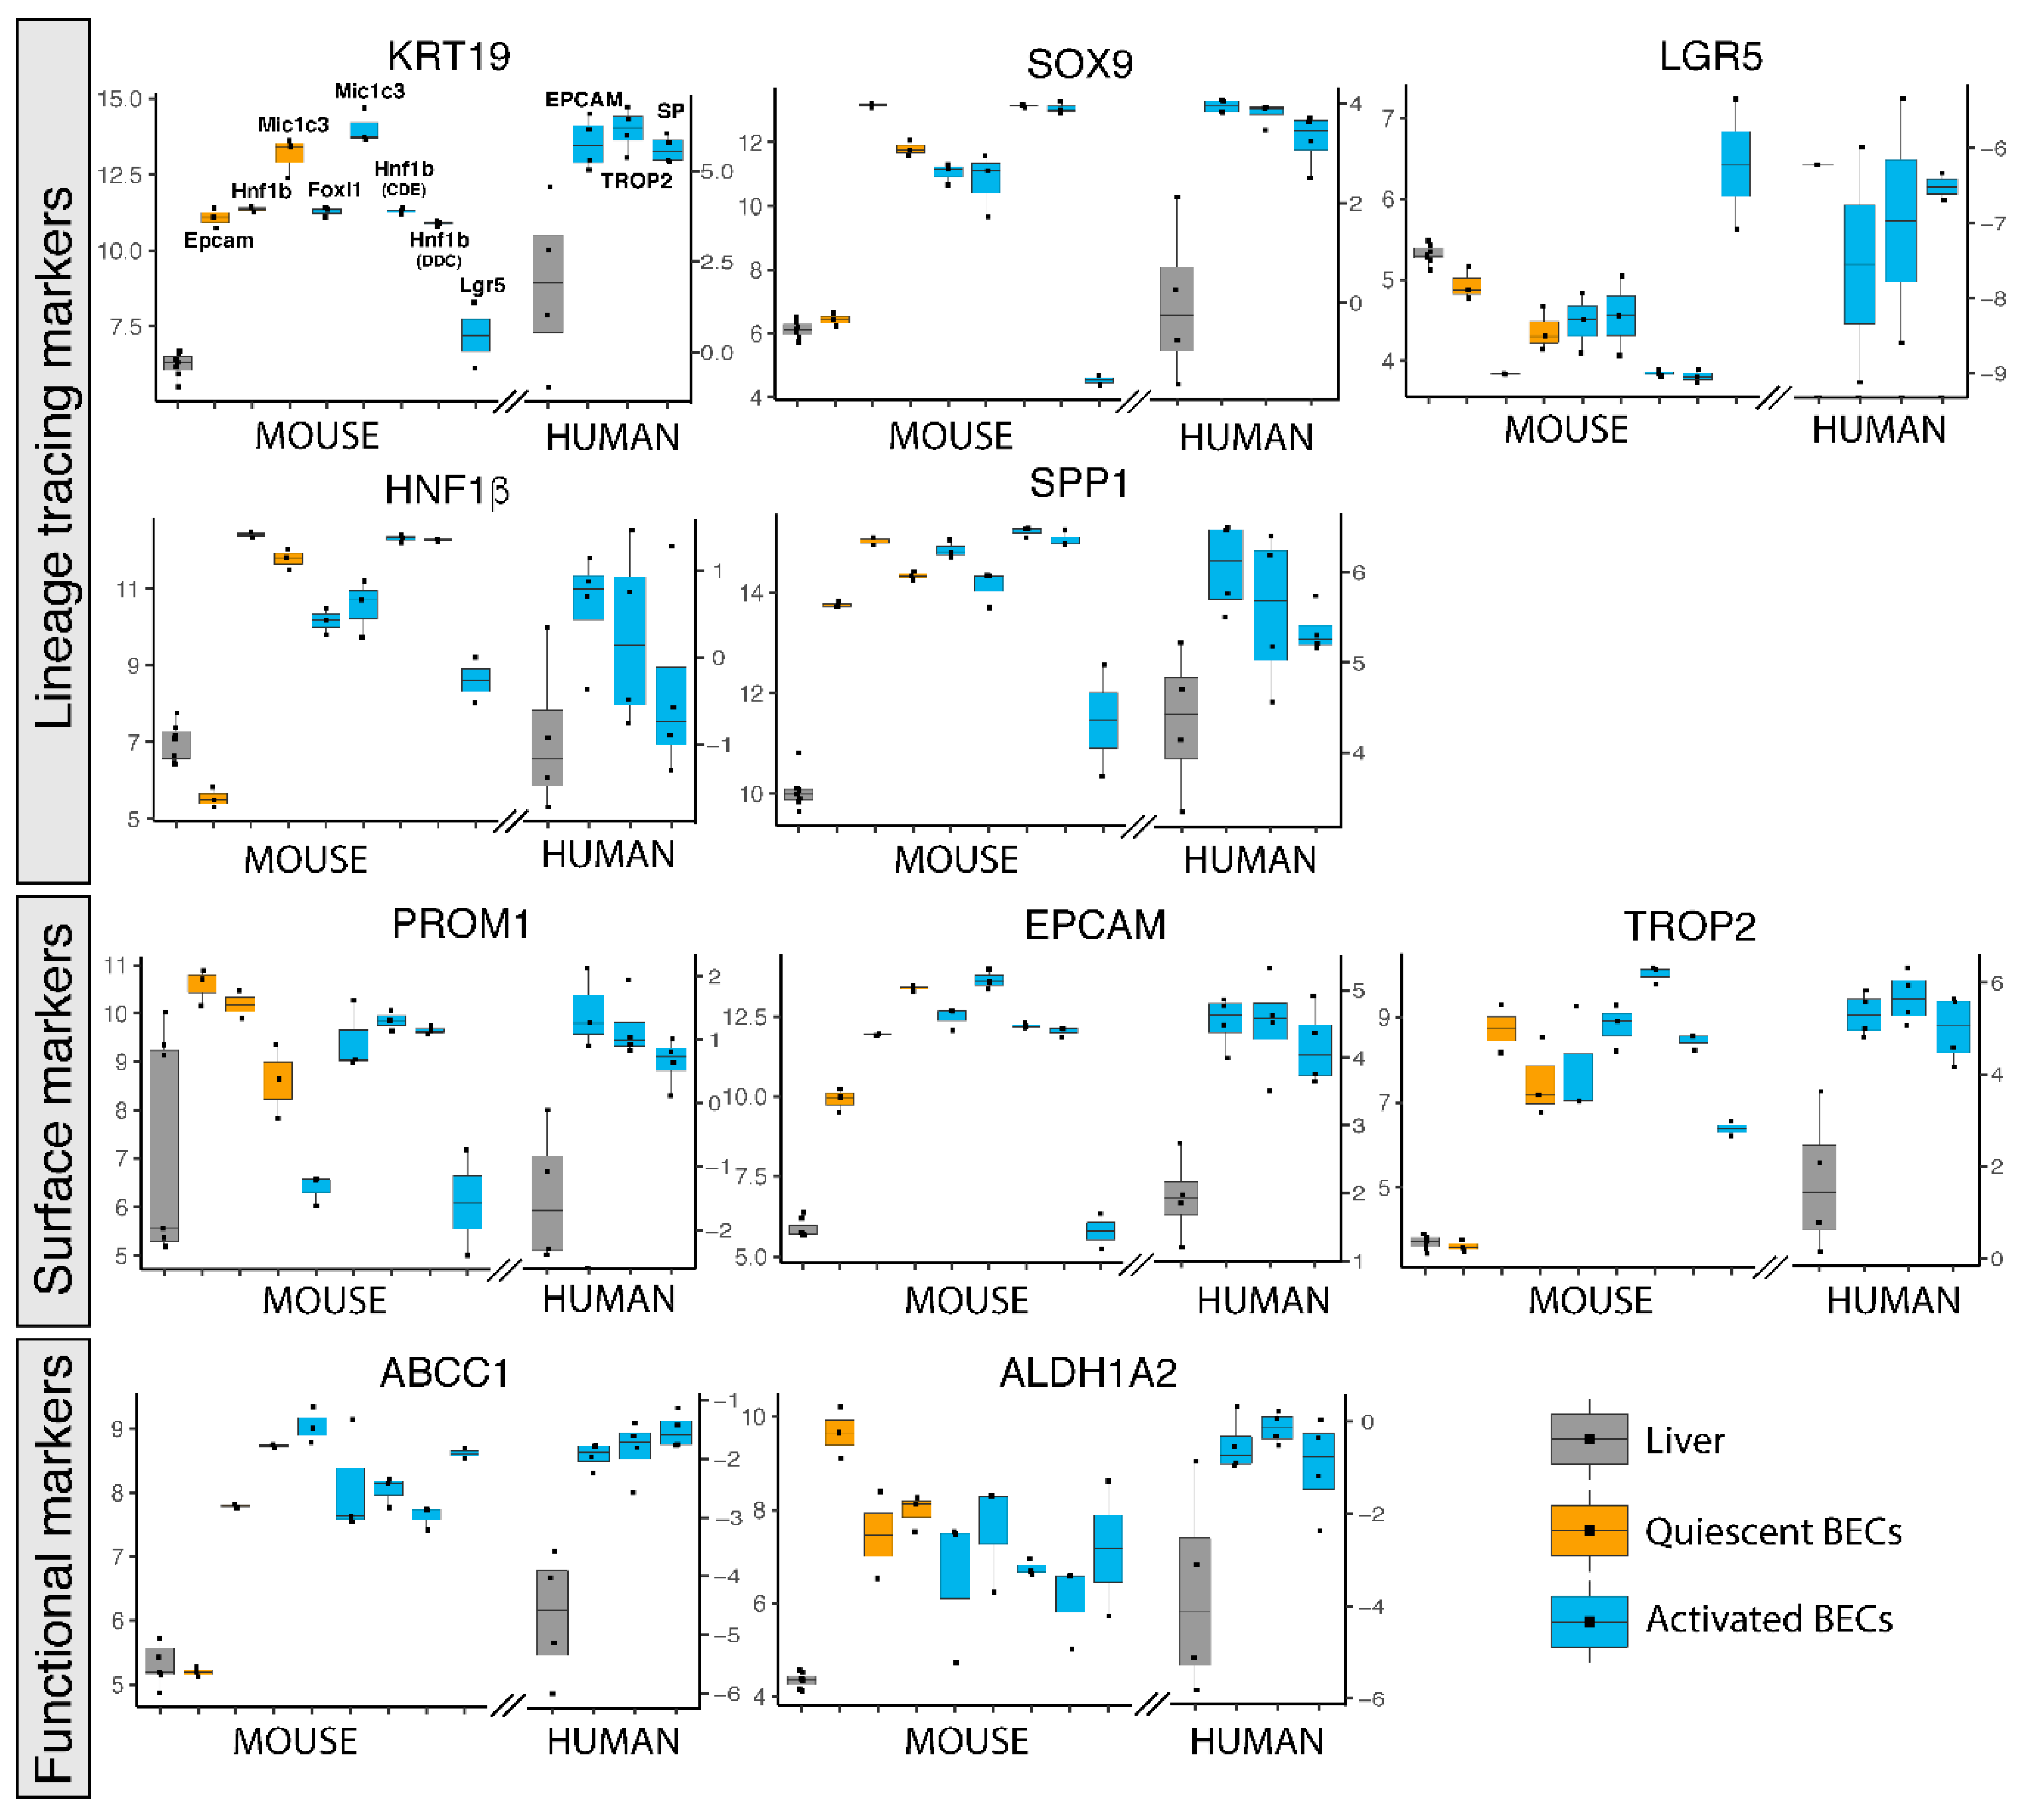
The role of BECs in healthy and diseased livers has been intensively studied by lineage tracing experiments in mice using BEC-specific reporter mice, such as Krt19, Sox9, Foxl1, Lgr5, Spp1 (Opn) or Hnf1β [9,12,14,22,23,37]. We therefore also analyzed their gene expression in these human and mouse BEC populations. KRT19, SOX9, SPP1 and HNF1β are greatly enriched in almost all mouse and human BEC populations confirming that these genes are indeed good candidates to be used as BEC-specific driver genes. Lgr5+ BECs do not show enriched expression of these genes and even under represents SOX9, suggesting again that Lgr5 positivity does not identify a traditional BEC population (Figure 2). This notion is strengthened by Lgr5 gene expression, which is only enriched in the Lgr5+ BEC population and not in other BEC populations. In contrast, the mouse Epcam+ population also expresses poorly SOX9 and HNF1β but the Epcam gene is highly expressed in all human and mouse BEC populations. A possible explanation could be the isolation procedure and analysis platform used, because Epcam positivity is probably the best established method to isolate BECs by flow cytometry [8,14].
Other frequently used surface markers to isolate BECs, such as PROM1 (aka CD133) and TROP2 are enriched in most BEC populations as well. Although TROP2 is described to be only expressed in mouse activated BECs, we see high enrichment of this gene in Hnf1β and Mic1c3 isolated BECs from healthy mouse livers, suggesting that TROP2 is also expressed in quiescent BECs (Figure 2). This confirms a previous study, in which TROP2 protein is indeed expressed in both quiescent and activated BECs in human livers from ASH patients [25].
Less popular methods to isolate BECs are functional assays, such as the side population (SP) and aldehyde dehydrogenase (ALDH) activity [20,21]. SP is based on efflux of Hoechst by ABC transporters, while ALDH activity assays rely on the conversion of a fluorescent molecule into a negatively charged dye initiated by ALDH enzymes [21,38]. Although these functional assays rely on protein activity, gene expression levels of both Abcc1 and Aldh1a2 are likewise enriched in human and mouse BECs (Figure 2).
3.3. Pathway Analysis Reveals New Potential Pathway in BEC Activation: KRAS Signalling
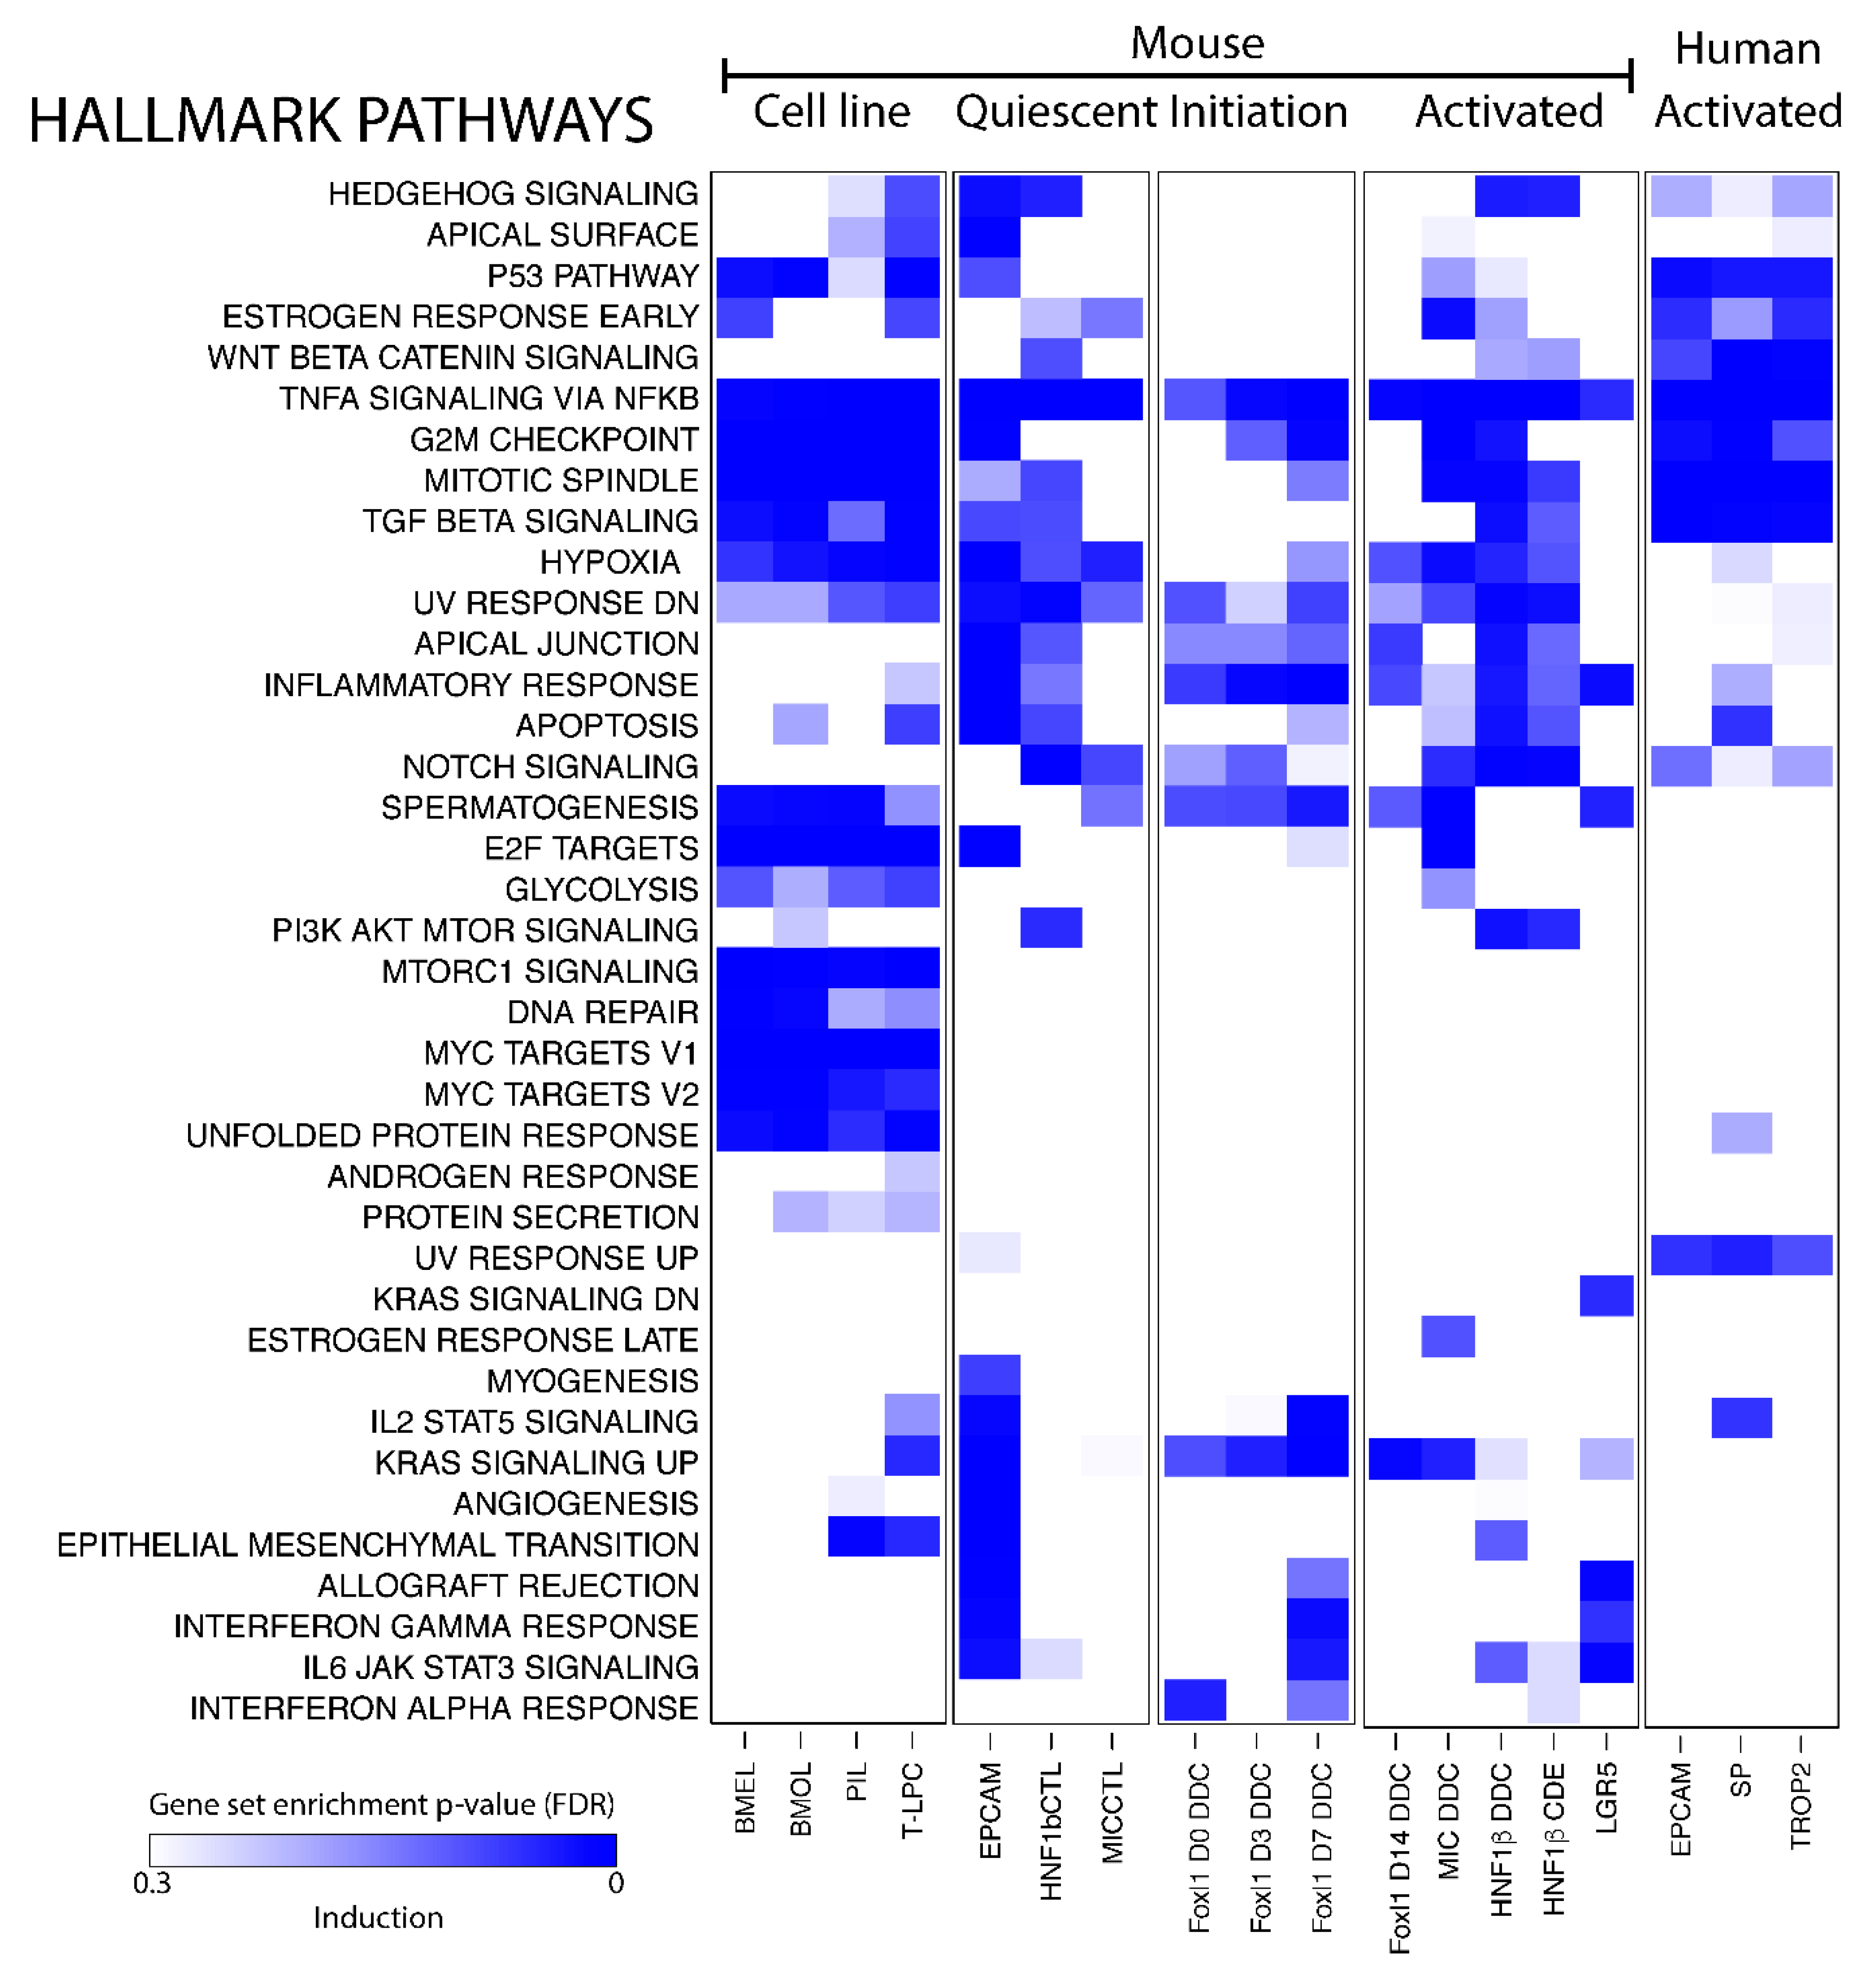
Single gene expression analysis of BEC transcriptomic profiles is a useful tool to look for biomarkers but cannot gain much insight into the function of BECs in healthy and damaged livers. Pathway analysis, on the other hand, looks at gene sets and can predict biological functions of a cell type. We used gene set enrichment analysis (GSEA) on all human and mouse BECs and made a distinction between mouse BEC cell lines, quiescent and activated BECs, and BECs isolated after different days of DDC diet (day 0, 3 and 7).
Gene expression profiles of BEC cell lines are obviously enriched in pathways that are involved in cell growth and proliferation, such as mTor and Myc signaling, mitotic spindle and G2M checkpoint control (Figure 3). Most quiescent BEC populations express genes involved in Hedgehog, Notch- and TGFβ-signaling, all pathways previously described to control the BEC phenotype [39,40,41,42,43]. Strikingly, TNF-signaling is the only pathway that is enriched in all BEC data sets analyzed and the KRAS signaling pathway seems to be only enriched in activated BEC populations (Figure 3). Note that not all pathways are enriched in both activated human and mouse BECs.
3.4. Creation of a Unique Quiescent and Activated BEC Gene Signature
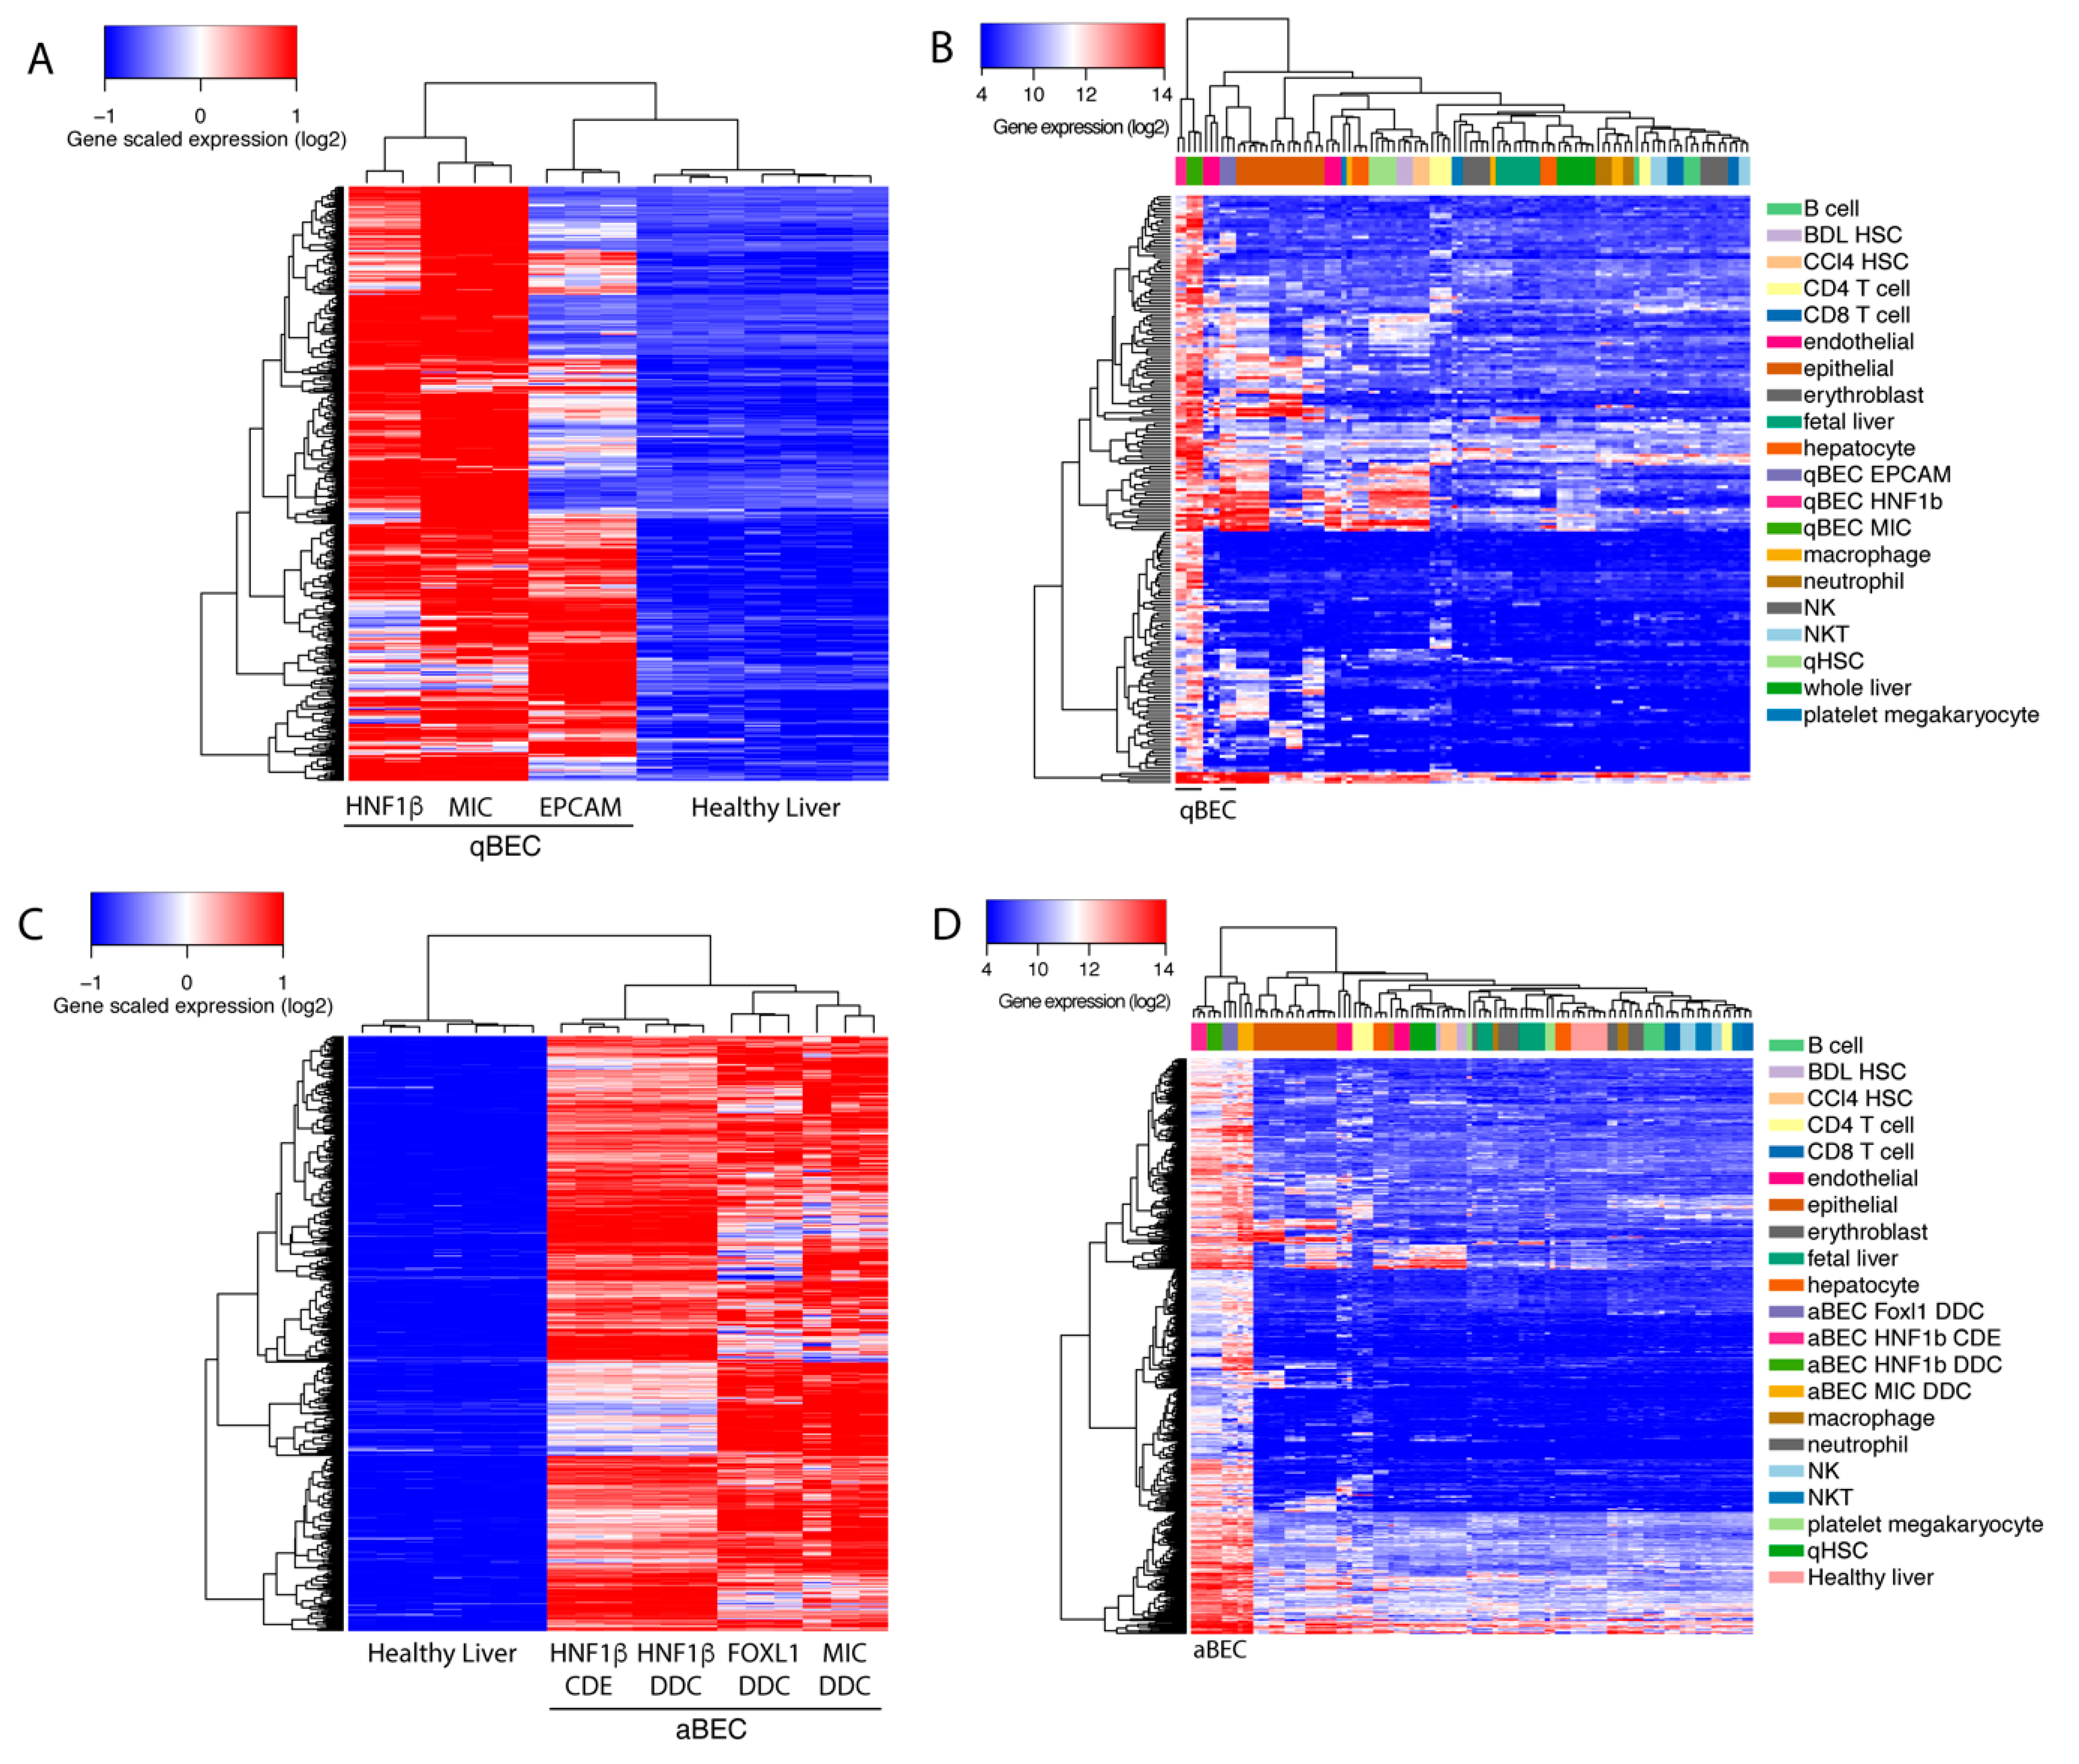
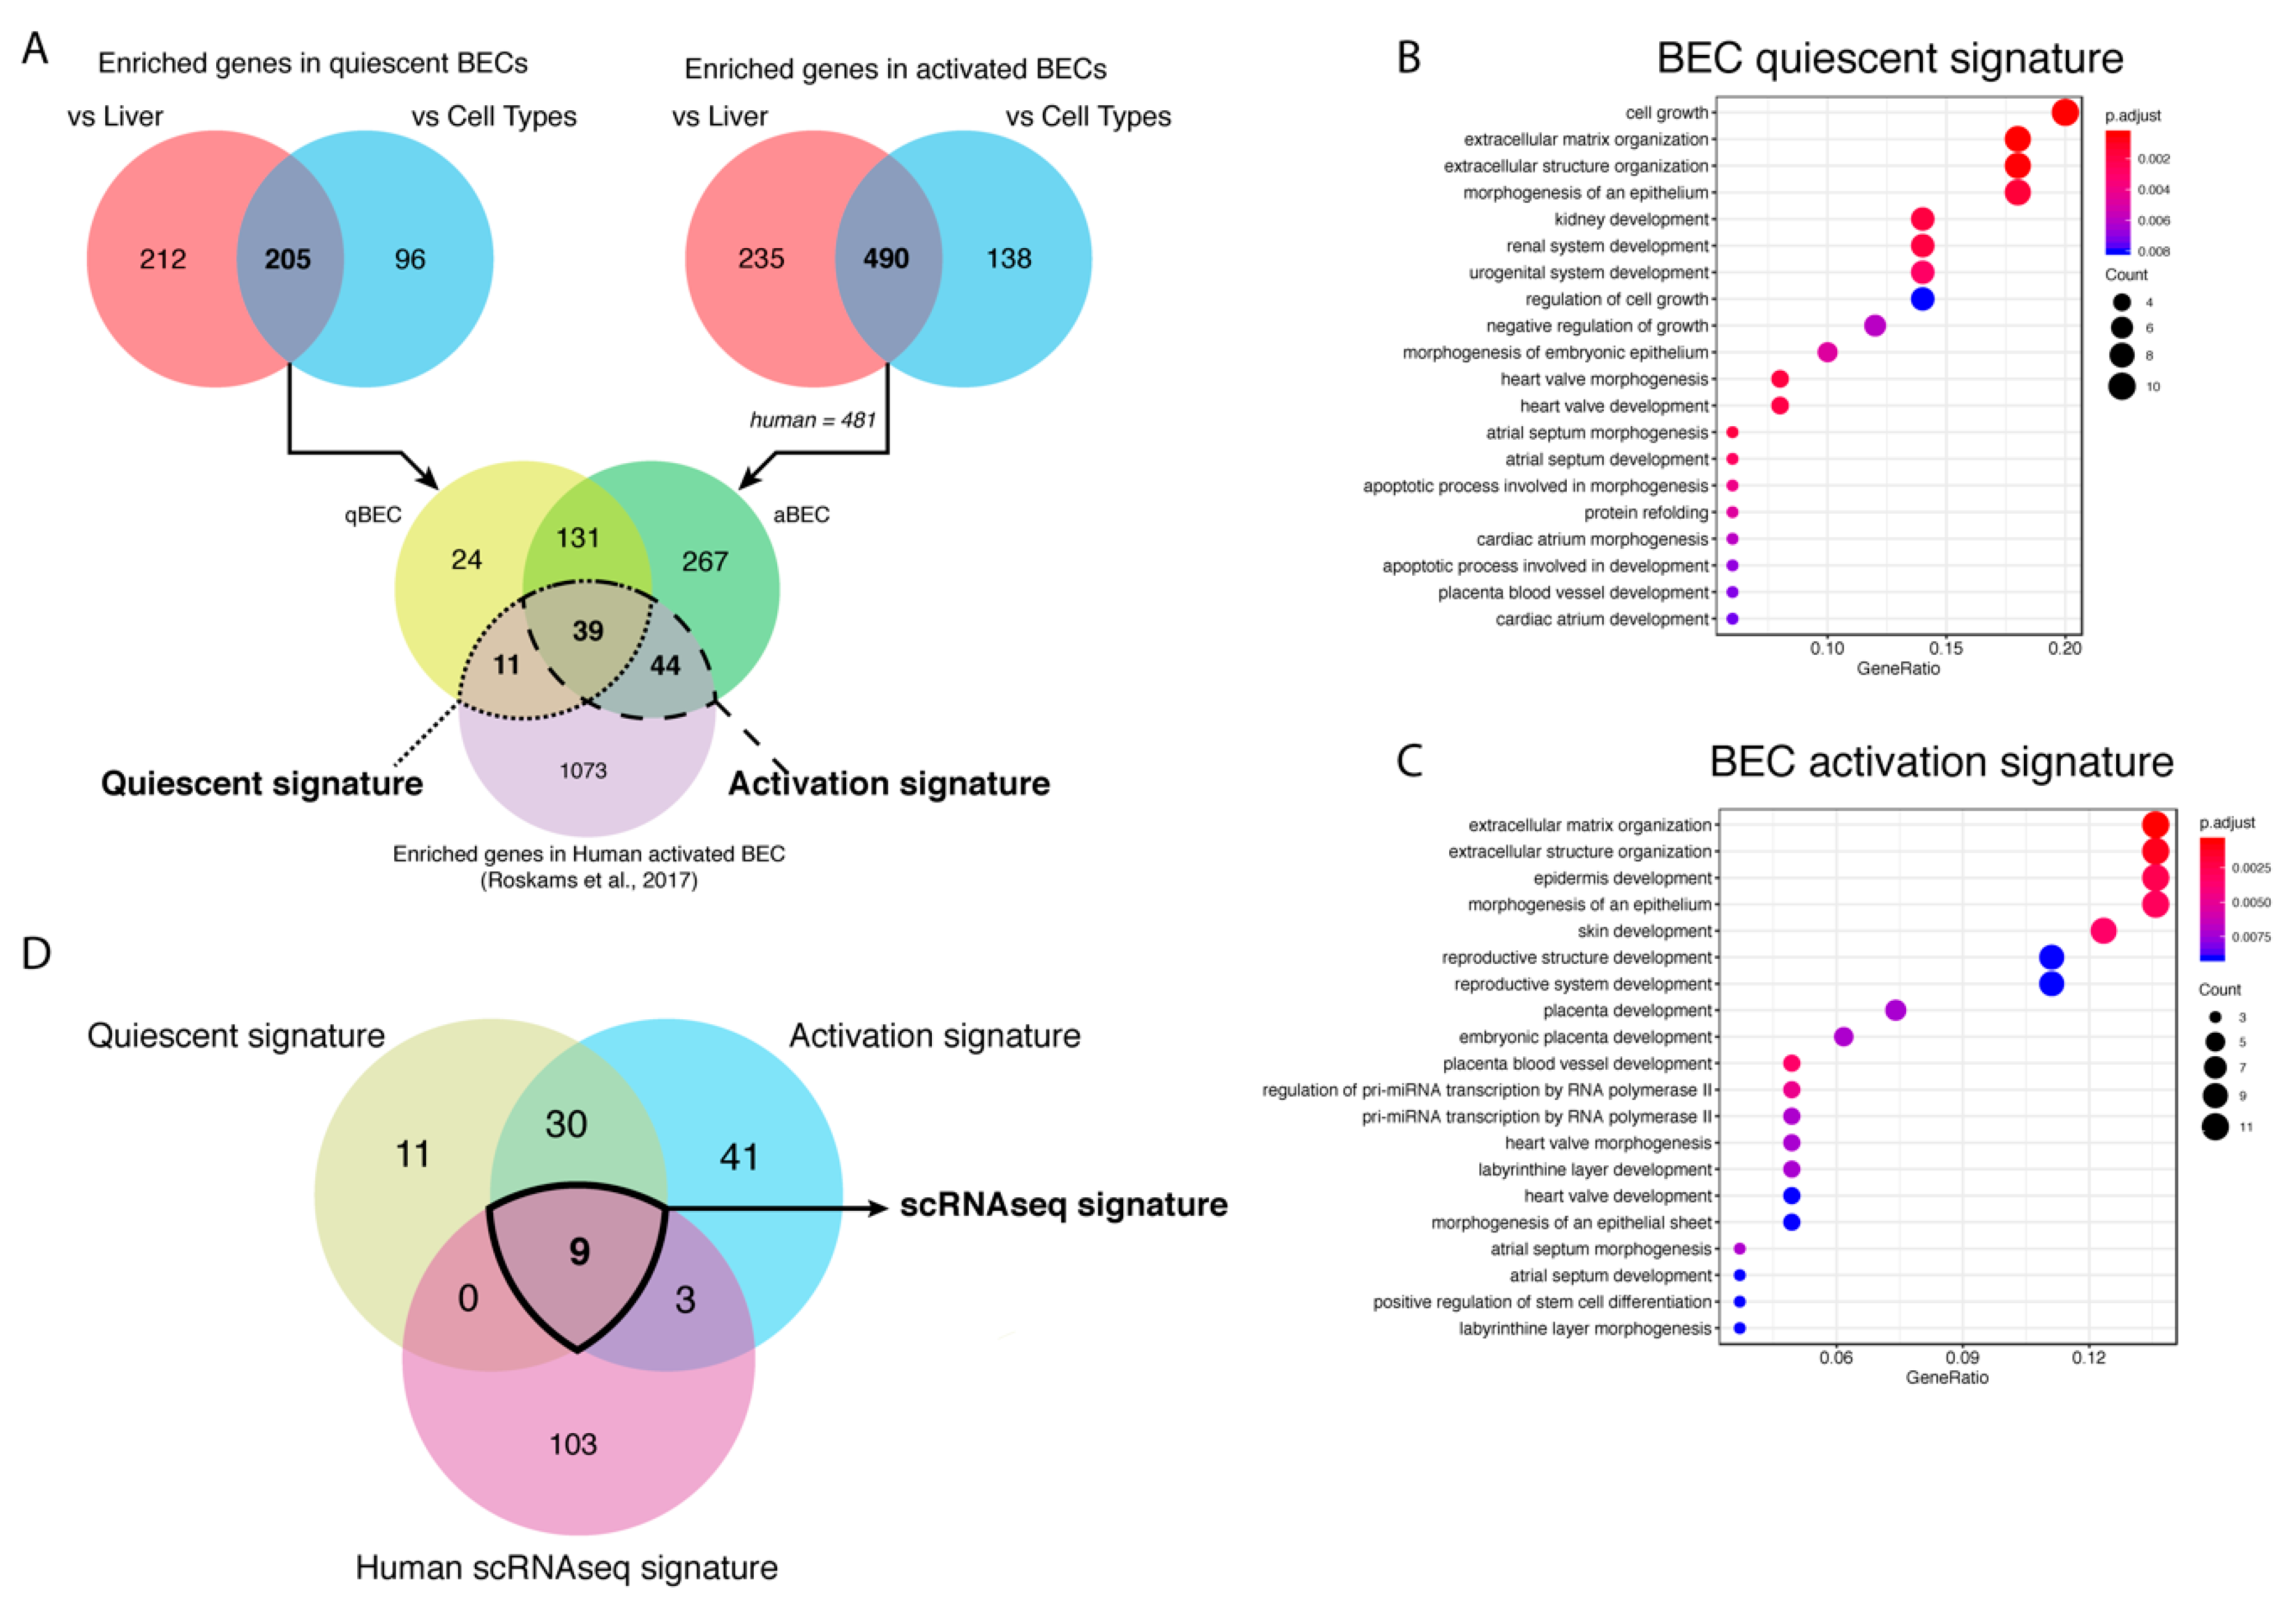
BECs isolated using different markers have a high variety in enriched genes and pathways. Therefore, we wanted to create a unique BEC gene set that can recognize BECs, mouse or human, in any conditions. To discard genes that are effected by batch effects, we used a fold change of at least 8 times or higher since most commonly used BEC genes are at least enriched 8 times (Figure 1D). We found 417 genes that were highly enriched in quiescent BECs, when comparing healthy livers, and identified 301 genes, when comparing BEC gene profiles, to the average expression of other cell types, such as immune cells, quiescent and activated stellate cells, endothelial cells, epithelial cells and hepatocytes (Figure 4A,B). By merging both gene sets, we created a mouse quiescent BEC signature containing 205 genes (Figure 5A). Our aim was to create a gene signature for both mouse and human BECs so we compared our mouse signature with our previously published human BEC signature [25]. Finally, this resulted in a signature for quiescent human and mouse BECs consisting of 50 genes predominantly involved in cell growth, extracellular matrix organization and morphogenesis (Table 3, Figure 5B). Using the same strategy, we obtained 725 genes enriched in activated mouse BECs compared to healthy livers and 628 genes when compared to different cell types (Figure 4C,D). In this comparison, we did not include Lrg5+ gene profiles since all the other mouse and human BEC populations are not enriched in LGR5 levels and the Lrg5+ population does not express the majority of typical BEC markers. When merging both gene sets (490 genes) with the human BEC signature, we obtained an activated mouse and human BEC signature of 83 genes that are mainly involved in extracellular matrix organization and tissue development (Figure 5A,C, Table 3). Thus, we generated a quiescent and activated BEC signature containing 50 and 83 genes, respectively. Interestingly, 39 genes are present in both signatures suggesting that these are “bona fide” BEC genes and can be used to identify both quiescent and activated BECs in human and mouse.
3.5. BEC Gene Signatures As a Tool for Identification of BECs
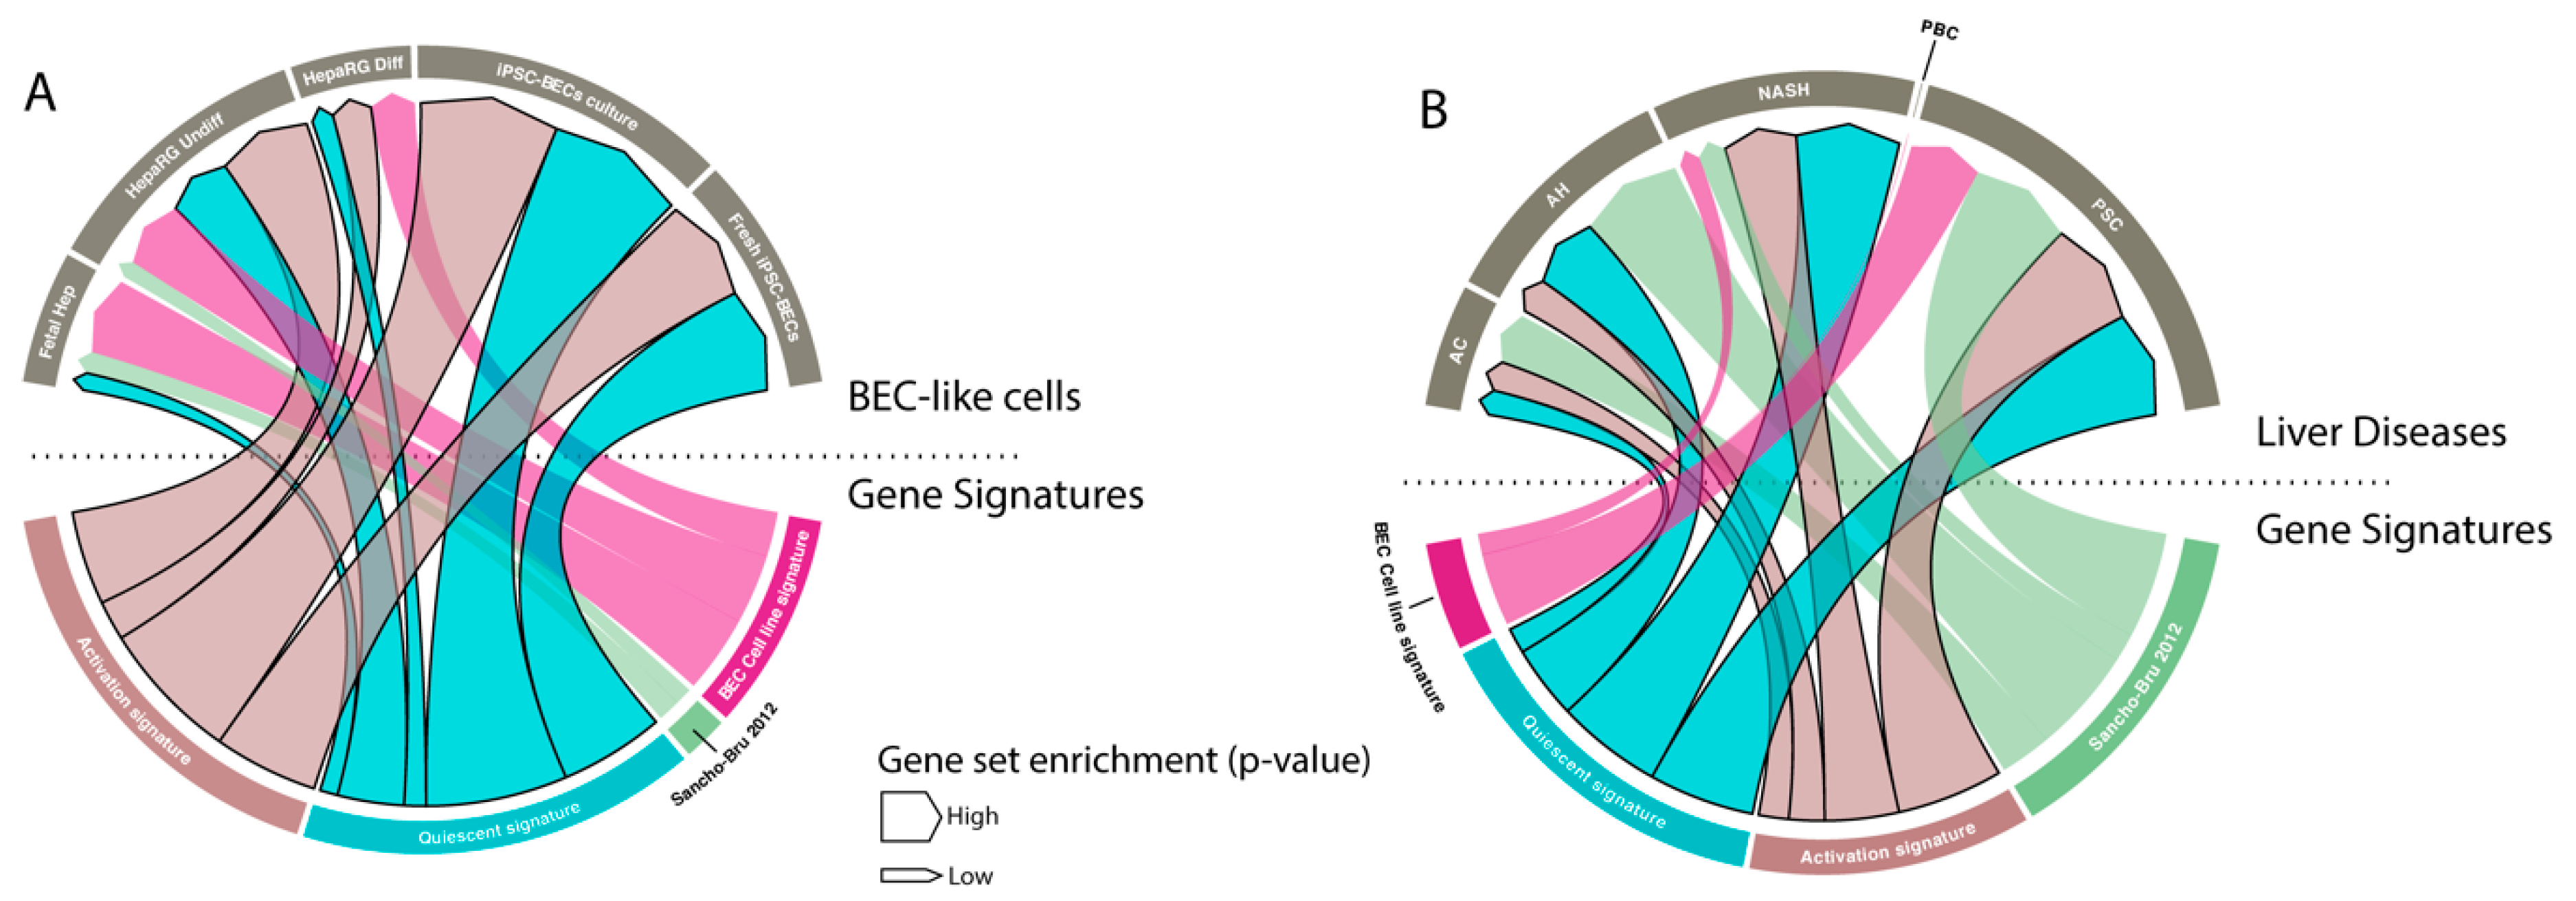
Gene signatures are frequently used to study functions of cells, but also to identify specific populations. Therefore, we tested our signature on BEC-like cells and compared it to two manually established BEC signatures [30,44]. We found that only our signatures were highly enriched in undifferentiated HepaRGs (human BEC stem cell line [45]) when compared to hepatocytes and in fresh or cultured BECs differentiated from induced pluripotent stem cells (iPSCs) when compared to iPSCs. Note that our signatures were not, or poorly, enriched in fetal hepatocytes (versus primary hepatocytes) and differentiated HepaRGs (Figure 6A).
BECs are known to be activated in many human liver diseases, such as alcoholic steatohepatitis and cirrhosis [44,46]. We therefore compared all BEC signatures to evaluate BEC enrichment in different human liver disorders. Our results show that only our generated signatures and the previously reported signature of Sancho-Bru et al. [44] are able to detect BEC enrichment in alcoholic hepatitis, NASH and peribiliary sclerotic livers. Remarkably, none of the signatures can recognize BECs in peribiliary cirrhosis (PBC) livers, even though it is well known that this disease state is accompanied with activated BECs (Figure 6B).
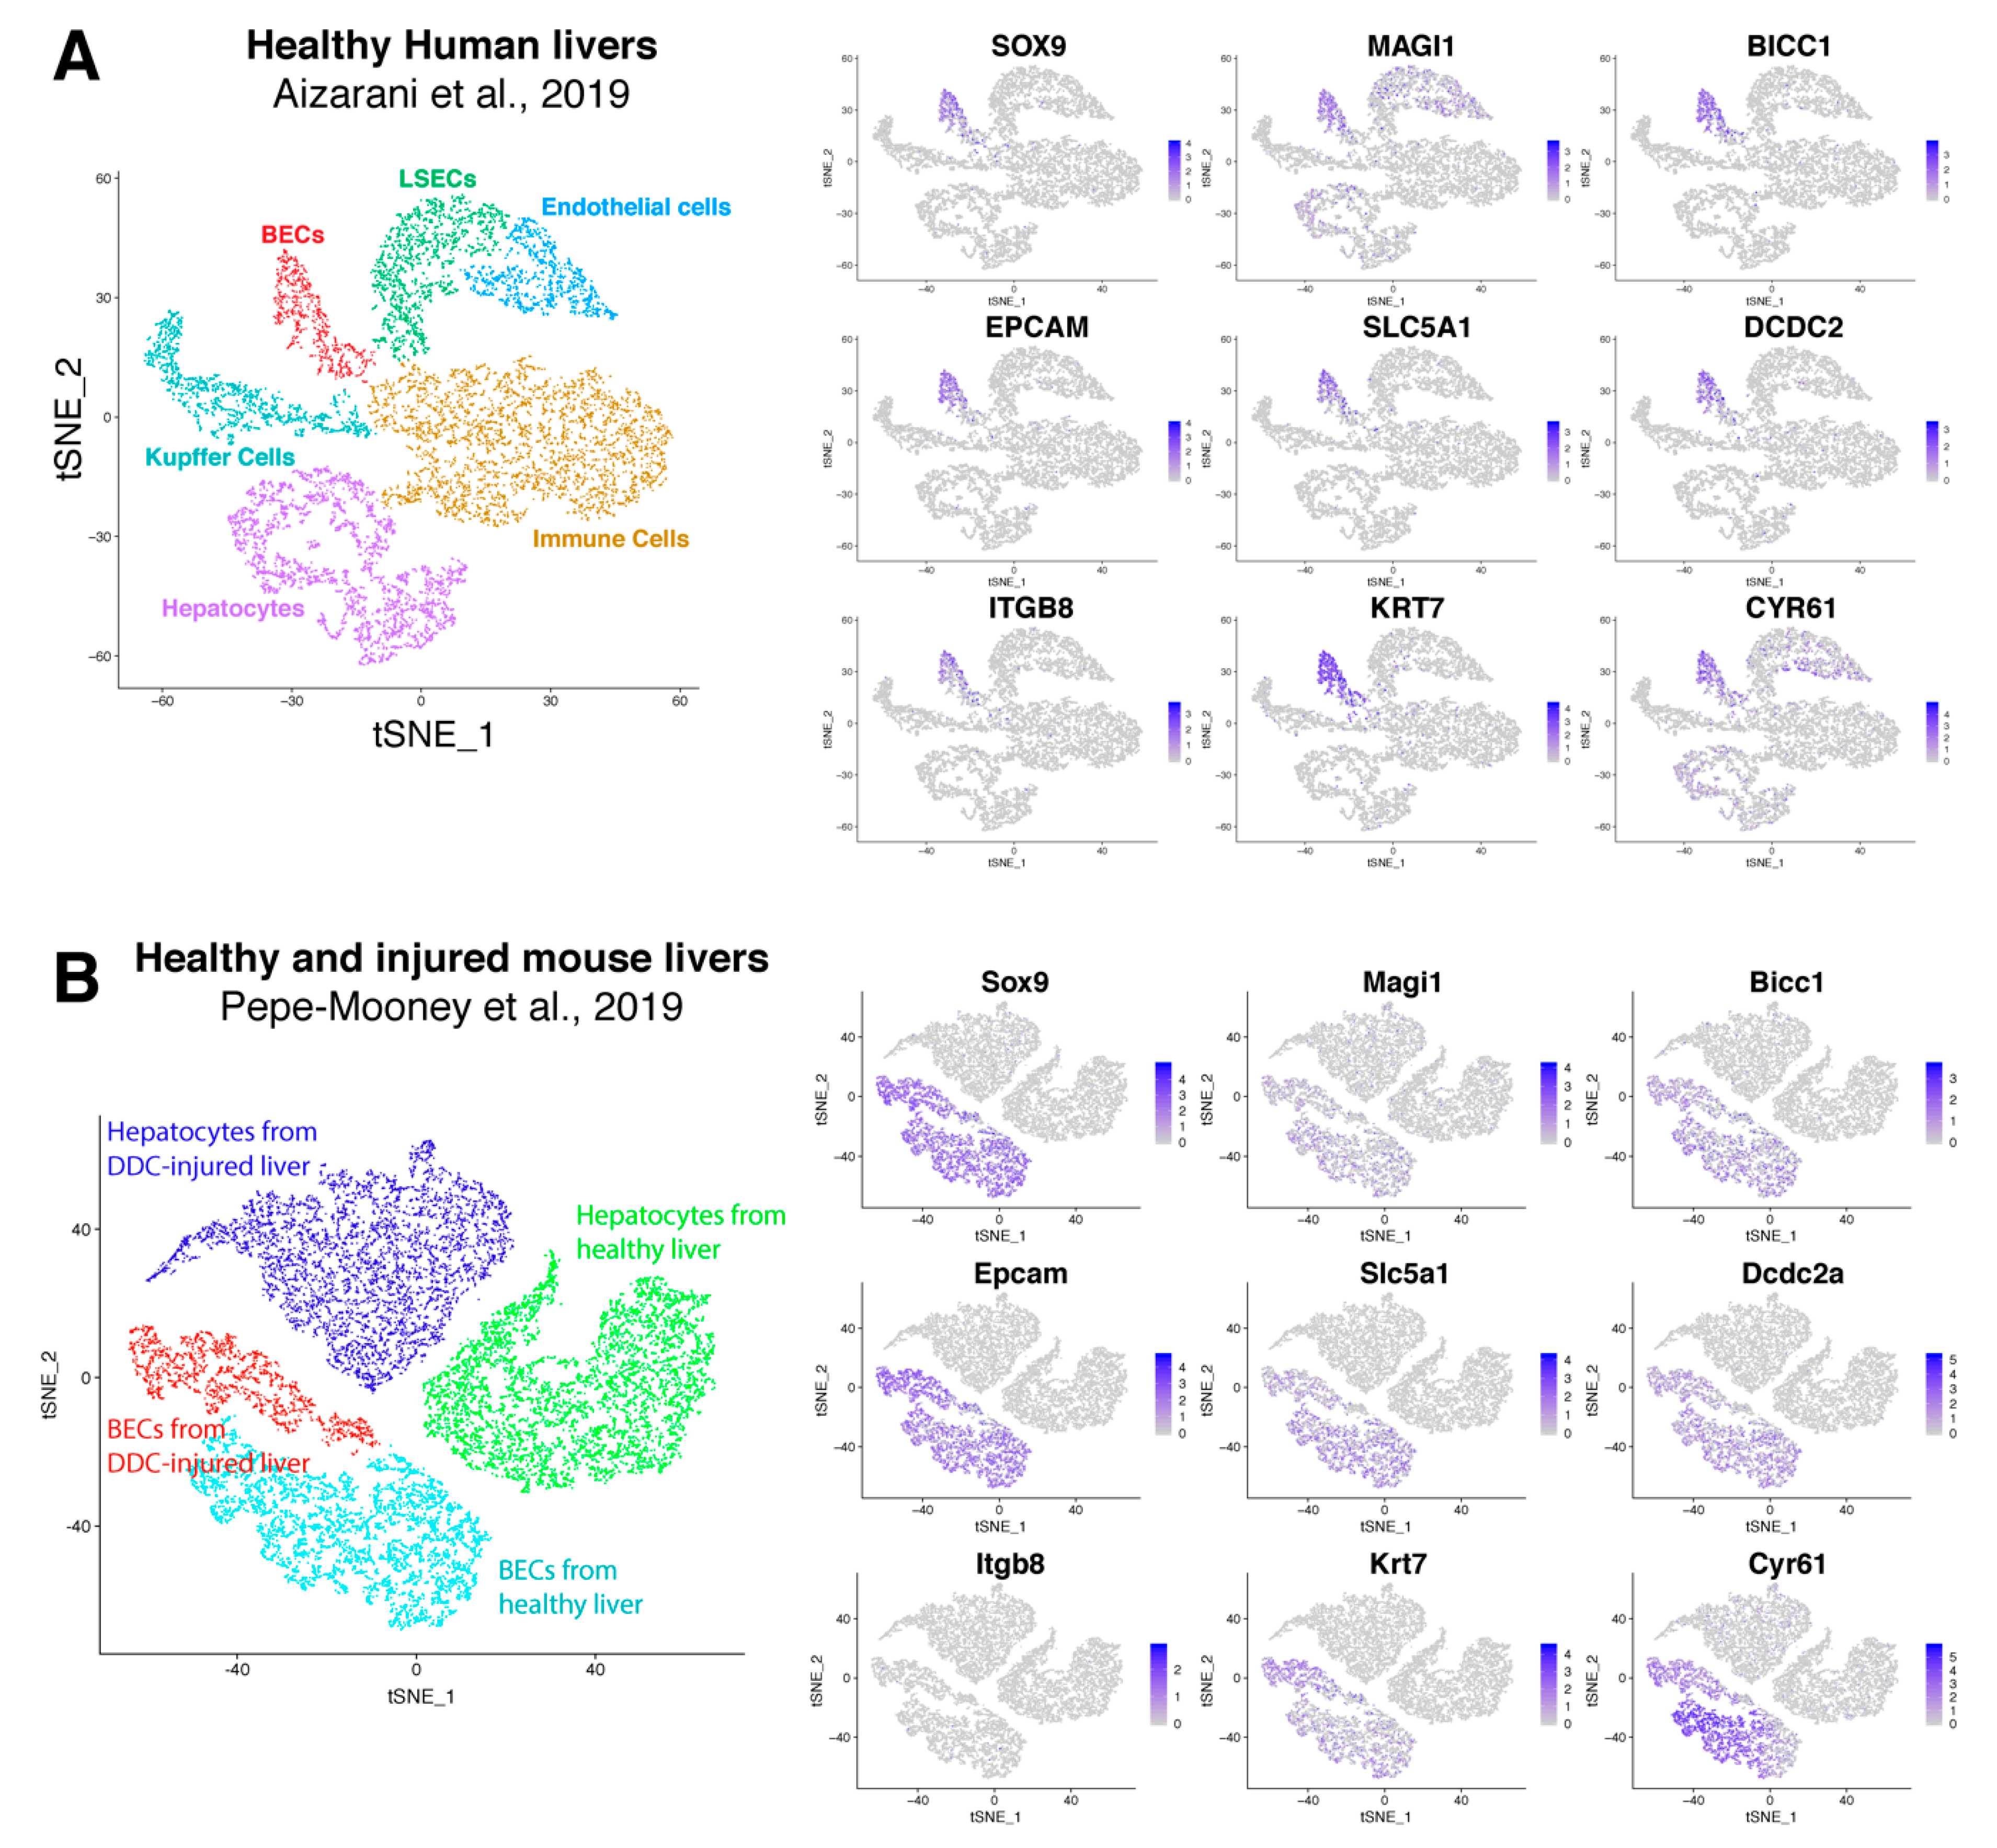
Recently, Pepe-Mooney et al. performed single cell RNA sequencing (scRNAseq, [47]) on BECs (Epcam+) and hepatocytes isolated from healthy and DDC-injured livers [27]. Unbiased detection of different cell populations are performed by tSNE plot and verified using well-known markers. We used their single cell transcriptome data and created a tSNE plot to verify our BEC signatures. This plot clearly presents four different groups (healthy and DDC-injured hepatocytes and BECs), which was confirmed by commonly used BEC and hepatocyte markers (Supplementary Figure S1A). Almost all hepatocytes expressed Cyp3a11, Cyp2e1 and albumin while the BEC fraction expressed Sox9 and Epcam. Tacstd2 (aka Trop2) was expressed only in BECs isolated from DDC-injured livers, suggesting that this fraction contains activated BECs. Instead of validating cell populations using one marker, Pont et al. designed “Single Cell Signature explorer” to calculate a signature score at the single cell level and visualize these scores on tSNE plots [48]. Using this tool, we calculated our activation and quiescent BEC signatures on scRNA seq data and represented them in tSNE plots (Supplemental Figure S1B). Our results show that our quiescent signature was enriched in most BECs isolated from healthy livers, while our activation signature was scattered between both BECs from healthy or DDC injured mice. This suggests that these signatures are not sufficiently restricted to distinguish these populations in this scRNAseq data set that only consists of BECs and hepatocytes. To establish a scRNAseq signature for BECs, we extracted genes that are mainly enriched in BECs using scRNAseq data of Aizarani et al., 2019 [28]. This data set contains single cell expression of BECs, hepatocytes, liver sinusoidal endothelial cells (LSECs), Kupffer cells and other immune cells, such as natural killer cells and cytotoxic T-cells (Supplementary Figure S2). We first extracted genes that are only expressed in human BECs with at least an average fold change of 2. By merging these genes with our quiescent and activated signature, we created a scBEC signature containing 9 genes (SOX9, MAGI1, BICC1, EPCAM, SLC5A1, DCDC2, ITGB8, KRT7 and CYR61, Figure 5D, Figure 7A). Next, we validated this scBEC signature in the tSNE plot of Pepe-Mooney et al. and confirmed that almost all genes were highly enriched in only quiescent as well as activated mouse BECs (Figure 7B). Note that mouse BECs and hepatocytes do not express Itgb8.
4. Discussion
BECs are intensively studied due to their potential to proliferate and differentiate into hepatocytes and cholangiocytes in vivo and in vitro. They form a type of backup system which is activated when hepatocytes no longer have the capacity to restore the liver cell mass [49,50]. Many studies describe the isolation of BECs from healthy and injured mouse livers and performed transcriptomic analysis to gain more insight into their function and their regulation. However, from these studies it was never clear whether the different reports were actually looking at the same BEC population since different isolation techniques and liver injury models were used. We therefore compared transcriptome data of BECs isolated from different injury models using different approaches. By doing so we established gene signatures that can be used to detect the presence or enrichment of BECs in gene expression data sets obtain through either standard gene array platforms or from (sc)RNA sequencing. A final scBEC signature, which consists of BEC-related and unrelated genes, was very efficient in separating qBECs and aBECs from other liver cell types in tSNE plots obtained from scRNAseq data.
Until recently, it was not common practice to compare the gene profile data of the cell type that one wanted to report on, to gene expression data of a similar cell type reported previously by someone else. Often the data had not been deposited in a public database or there has been an embargo period to download the data. This way researchers withhold published data from direct competitors or those with contrary views. It is fortunate that this trend is changing, and we used the kindly shared data (Table 1) to compare the BEC gene profiles with the aim to generate a gene signature for BECs and as a result of this perhaps identify novel genes involved in BEC biology.
We found that microarray platforms and the method used to isolate the BECs have a high impact on the transcriptome data obtained. However, most BEC populations are still highly enriched in popular BEC markers such as Krt19, Epcam and Sox9, but are clearly not similar and thus could affect the conclusions drawn in these studies. The difference in gene profiles can also be explained by the fact that the isolation procedures used were all based on the enrichment by only one BEC-marker (with exception of Mic1c3). Indeed, our results suggest that isolation of BECs based on only Epcam is not a good option, because this population is poorly enriched in Sox9, Hnf1β and Abcc1. A reason for this could be that these represent rarer subtypes of BECs are more difficult to detect in bulk transcriptomic data of Epcam positive cells. However, since gene expression of Epcam itself is highly enriched in all BEC populations, we do believe that Epcam-based cell sorting is a good way to enrich for BECs, but in combination with other markers. This corroborates studies by Lu et al. who investigated multiple markers for the isolation of BECs and found that CD45-CD31-Ter119-Epcam+CD24+CD133+ cells are true biliary cells, unfortunately the authors did not perform extensive gene expression profiling [14].
The BEC transcriptomic data obtained from human and mouse livers clearly show differences. Supplemental Table S2 shows a list of genes only expressed in human or mouse BECs which suggest that there are some differences between human and mouse BECs. Importantly, several papers have shown that analyzing transcriptome using RNA-seq and microarray can already result in significant differences [51,52,53]. Microarray depends on the variety of probes that can detect specific RNA molecules while RNA-seq analyses all RNAs. RNA-seq is therefore more sensitive and will find more differentially regulated genes which can result in finding different pathways. There is a platform-specific batch effect which cannot be circumvented since all quiescent mouse BECs were analyzed using different platforms. To overrule this batch effect, we included only genes in our BEC gene signatures that showed a >8 fold enrichment over healthy livers.
One could argue that, with the introduction of scRNAseq analysis, markers for BECs are not needed anymore to carry out transcriptome profiling of BECs in healthy and diseased states. However, due to the abundance of hepatocytes, macrophages and endothelial cells in a single cell suspension of livers, one still needs to enrich for low abundance cell types to obtain sufficient cells to be sequenced. A recent publication investigated human BECs on single cell level and reported the isolation of EPCAM+CDH6+TROP2- BECs [54]. CDH6 is also present in our BEC gene signature, and it is clear from the scRNAseq data from Pepe-Mooney et al., 2019 [27] (Figure 5C) that a negative selection for TROP2 would not discard many cells from an EPCAM isolation. However, by a negative selection of TROP2 one might dispose of a separate BEC population since TROP2 positive cells from alcoholic steatohepatitis livers are enriched in most BEC markers and TROP2 itself is highly enriched in almost all human and mouse BEC transcriptomes analyzed (Figure 2 and [19]).
In our efforts to identify additional BEC markers, we reviewed the expression patterns of our signature genes using the human protein atlas (www.proteinatlas.org). Several proteins from our signatures, previously not associated with BECs, are localized to biliary epithelial cells or ductular reactions (C1orf116, CDH6, S100A6, MYO6, AKAP7 and DCDC2) and thus can be used to identify or isolate (subsets) of BEC populations (Supplemental Figure S3). Their localizations in the liver and their association with an BEC signature makes these proteins interesting subjects for further analysis in BEC biology. ScRNA sequencing provides much more information compared to bulk microarray or RNA sequencing because the transcriptome from every cell is analyzed separately. Still, it does not necessarily give insight into the protein production and localization of the gene of interest in the liver. A recent study combined scRNA sequencing with RNA hybridization of livers, an approach that could be used to look for RNA as a marker for BECs instead of proteins [55]. Cellular indexing of transcriptomes and epitopes by sequencing (CITE-seq) is another recent development in which transcriptome analysis is combined with expression of a panel of proteins at a single cell level [56]. With this strategy, gene expression can be related to protein expression and could perhaps lead to the identification of other membrane proteins that are strongly linked to an BEC gene profile. Of course, in the case of BECs, one would still need to enrich for an BEC-like cell before CITE-seq analysis due to the low abundance of these cells in the liver.
Merging differently isolated BEC populations can remove batch effects and therefore be more precise when performing pathway analysis. We found that the KRAS signaling pathway is enriched in BECs that are being activated that thus could be important for BEC activation. Recent studies reported that KRAS signaling is indeed important in self-renewal, proliferation and differentiation of hematopoietic and induced pluripotent stem cells [57,58,59], however further studies are needed to determine whether this pathway is also essential for BEC biology.
Gene signatures can be used to identify certain isolated cell populations. We created a quiescent and activated BEC gene signature that can recognize BEC-like cells and detect BECs in liver diseases accompanied with an activation of the BEC compartment. Interestingly, both the quiescent and activated BEC signature were equally enriched in PSC and NASH, suggests that both populations are present. There is less gene enrichment for AH and AC, which suggests less BEC expansion in these diseases or a higher variability in AH and AC. Strangely, we found no enrichment in PBC which is known to contain expanded BECs [25]. We also investigated whether genes of the scBEC signature could be used to examine for BEC activation in the different liver diseases. Only EPCAM, SOX9 and DCDC2 were enriched in ASH and Cirrhotic livers (Supplemental Figure S4). This indicates that the scBEC signature is not able to identify activated BECs in bulk transcriptomic data of diseased livers. Probably because this scBEC signature only recognizes certain subsets of activated BECs while the quiescent and activated signatures can identify higher variety of BECs.
ScRNA seq is becoming the standard when analyzing transcriptomes of specific cell population. Several recent publications performed scRNA seq to study mechanisms of BECs from injured livers [27,60]. One of the main issues of scRNA seq is to categorize different cell clusters within a t-SNE plot. Most researchers use multiple gene markers to identify these clusters. We found that our gene signature, created by bulk microarray and RNA seq, was not able to recognize all activated BECs in a t-SNE plot representing hepatocytes and Epcam positive cells isolated from healthy and diseased mouse livers. This suggests that gene signatures might need to be re-evaluated, depending on the complexity of the scRNA sequencing data. In the example described here, we found several genes from our quiescent and activation gene signature that were only expressed in human BECs, based on tSNE plot from the data of Aizarani et al., 2019 [28]. However, these few genes might not be specific enough if other cell types such as hepatic stellate cells cells are included into the tSNE plot. For instance, S100A6 was recently identified as a universal marker of activated myofibroblasts [61]. Future scRNAseq data sets representing equal amounts of different liver cell populations in one tSNE plot will determine whether the BEC signatures that we describe here will be sufficient to identify quiescent and activated BECs in mouse or human livers.
To summarize, we describe here for, the first time, a meta-analysis on gene profiles obtained from BECs isolated from different liver injury models and human diseased livers, and analyzed by several different analysis platforms. We created a unique gene signature for the identification of BECs in bulk microarray and RNAseq data sets, but also created a gene signature that identifies both quiescent and activated BECs in a scRNA seq data set.
Supplementary Materials
The following are available online at https://www.mdpi.com/2073-4409/8/10/1117/s1, Figure S1 TSNE plots displaying expression of genes and gene signatures from scRNA seq data of Pepe-Mooney et al., 2019. Figure S2 TSNE plots of scRNAseq data of different cell types isolated from healthy human livers from Aizarani et al., 2019. Figure S3 Immunohistochemistry staining of new potential BEC markers from our BEC signature, obtained from protein atlas. Figure S4 Gene expression of genes in the scBEC signature on transcriptomic data of NASH, ASH, Cirrhosis and PSC. Table S1 BEC labeling based on injury model. Table S2 List of genes expressed by only human or mouse BECs.
Author Contributions
Conceptualization, methodology, writing—original draft preparation, S.V. and L.A.v.G.; software, validation and formal analysis, S.V.; review and editing, S.V., T.R., P.S.-B. and L.A.v.G.; supervision, project administration and funding acquisition, L.A.v.G.
Funding
This research was supported by a grant from the Fund for Scientific Research-Flanders (Belgium) (FWO-Vlaanderen).
Acknowledgments
We thank all our colleagues of Liver Cell Biology research group from Vrije Universiteit Brussels, Belgium.
Conflicts of Interest
The authors declare no conflict of interest.
References
- Roskams, T.; De Vos, R.; Van Eyken, P.; Myazaki, H.; Van Damme, B.; Desmet, V. Hepatic ov-6 expression in human liver disease and rat experiments: Evidence for hepatic progenitor cells in man. J. Hepatol. 1998, 29, 455–463. [Google Scholar] [CrossRef]
- Schmelzer, E.; Zhang, L.; Bruce, A.; Wauthier, E.; Ludlow, J.; Yao, H.L.; Moss, N.; Melhem, A.; McClelland, R.; Turner, W.; et al. Human hepatic stem cells from fetal and postnatal donors. J. Exp. Med. 2007, 204, 1973–1987. [Google Scholar] [CrossRef] [PubMed] [Green Version]
- Alison, M.R.; Islam, S.; Lim, S. Stem cells in liver regeneration, fibrosis and cancer: The good, the bad and the ugly. J. Pathol. 2009, 217, 282–298. [Google Scholar] [CrossRef] [PubMed]
- Russo, F.P.; Parola, M. Stem and progenitor cells in liver regeneration and repair. Cytotherapy 2011, 13, 135–144. [Google Scholar] [CrossRef] [PubMed]
- Rountree, C.B.; Mishra, L.; Willenbring, H. Stem cells in liver diseases and cancer: Recent advances on the path to new therapies. Hepatology 2012, 55, 298–306. [Google Scholar] [CrossRef] [PubMed]
- Michalopoulos, G.K.; Bowen, W.C.; Mule, K.; Lopez-Talavera, J.C.; Mars, W. Hepatocytes undergo phenotypic transformation to biliary epithelium in organoid cultures. Hepatology 2002, 36, 278–283. [Google Scholar] [CrossRef] [PubMed]
- Chen, Y.H.; Chen, H.L.; Chien, C.S.; Wu, S.H.; Ho, Y.T.; Yu, C.H.; Chang, M.H. Contribution of mature hepatocytes to biliary regeneration in rats with acute and chronic biliary injury. PLoS ONE 2015, 10, e0134327. [Google Scholar] [CrossRef]
- Huch, M.; Gehart, H.; van Boxtel, R.; Hamer, K.; Blokzijl, F.; Verstegen, M.M.; Ellis, E.; van Wenum, M.; Fuchs, S.A.; de Ligt, J.; et al. Long-term culture of genome-stable bipotent stem cells from adult human liver. Cell 2015, 160, 299–312. [Google Scholar] [CrossRef] [PubMed]
- Espanol-Suner, R.; Carpentier, R.; Van Hul, N.; Legry, V.; Achouri, Y.; Cordi, S.; Jacquemin, P.; Lemaigre, F.; Leclercq, I.A. Liver progenitor cells yield functional hepatocytes in response to chronic liver injury in mice. Gastroenterology 2012, 143, 1564–1575 e7. [Google Scholar] [CrossRef]
- Rodrigo-Torres, D.; Affo, S.; Coll, M.; Morales-Ibanez, O.; Millan, C.; Blaya, D.; Alvarez-Guaita, A.; Rentero, C.; Lozano, J.J.; Maestro, M.A.; et al. The biliary epithelium gives rise to liver progenitor cells. Hepatology 2014, 60, 1367–1377. [Google Scholar] [CrossRef] [Green Version]
- Raven, A.; Lu, W.Y.; Man, T.Y.; Ferreira-Gonzalez, S.; O’Duibhir, E.; Dwyer, B.J.; Thomson, J.P.; Meehan, R.R.; Bogorad, R.; Koteliansky, V.; et al. Cholangiocytes act as facultative liver stem cells during impaired hepatocyte regeneration. Nature 2017, 547, 350–354. [Google Scholar] [CrossRef] [PubMed]
- Manco, R.; Clerbaux, L.A.; Verhulst, S.; Nader, M.B.; Sempoux, C.; Ambroise, J.; Bearzatto, B.; Gala, J.L.; Horsmans, Y.; van Grunsven, L.; et al. Reactive cholangiocytes differentiate into proliferative hepatocytes with efficient DNA repair in mice with chronic liver injury. J. Hepatol. 2019. [Google Scholar] [CrossRef] [PubMed]
- Shin, S.; Upadhyay, N.; Greenbaum, L.E.; Kaestner, K.H. Ablation of foxl1-cre-labeled hepatic progenitor cells and their descendants impairs recovery of mice from liver injury. Gastroenterology 2015, 148, 192–202 e3. [Google Scholar] [CrossRef] [PubMed]
- Lu, W.Y.; Bird, T.G.; Boulter, L.; Tsuchiya, A.; Cole, A.M.; Hay, T.; Guest, R.V.; Wojtacha, D.; Man, T.Y.; Mackinnon, A.; et al. Hepatic progenitor cells of biliary origin with liver repopulation capacity. Nat. Cell Biol. 2015, 17, 971–983. [Google Scholar] [CrossRef]
- Preisegger, K.H.; Factor, V.M.; Fuchsbichler, A.; Stumptner, C.; Denk, H.; Thorgeirsson, S.S. Atypical ductular proliferation and its inhibition by transforming growth factor beta1 in the 3,5-diethoxycarbonyl-1,4-dihydrocollidine mouse model for chronic alcoholic liver disease. Lab. Invest. 1999, 79, 103–109. [Google Scholar] [PubMed]
- Akhurst, B.; Croager, E.J.; Farley-Roche, C.A.; Ong, J.K.; Dumble, M.L.; Knight, B.; Yeoh, G.C. A modified choline-deficient, ethionine-supplemented diet protocol effectively induces oval cells in mouse liver. Hepatology 2001, 34, 519–522. [Google Scholar] [CrossRef]
- Fickert, P.; Stoger, U.; Fuchsbichler, A.; Moustafa, T.; Marschall, H.U.; Weiglein, A.H.; Tsybrovskyy, O.; Jaeschke, H.; Zatloukal, K.; Denk, H.; et al. A new xenobiotic-induced mouse model of sclerosing cholangitis and biliary fibrosis. Am. J. Pathol. 2007, 171, 525–536. [Google Scholar] [CrossRef] [PubMed]
- Dorrell, C.; Erker, L.; Schug, J.; Kopp, J.L.; Canaday, P.S.; Fox, A.J.; Smirnova, O.; Duncan, A.W.; Finegold, M.J.; Sander, M.; et al. Prospective isolation of a bipotential clonogenic liver progenitor cell in adult mice. Genes Dev. 2011, 25, 1193–1203. [Google Scholar] [CrossRef] [Green Version]
- Okabe, M.; Tsukahara, Y.; Tanaka, M.; Suzuki, K.; Saito, S.; Kamiya, Y.; Tsujimura, T.; Nakamura, K.; Miyajima, A. Potential hepatic stem cells reside in epcam+ cells of normal and injured mouse liver. Development 2009, 136, 1951–1960. [Google Scholar] [CrossRef]
- Govaere, O.; Wouters, J.; Petz, M.; Vandewynckel, Y.P.; Van den Eynde, K.; Van den Broeck, A.; Verhulst, S.; Dolle, L.; Gremeaux, L.; Ceulemans, A.; et al. Laminin-332 sustains chemoresistance and quiescence as part of the human hepatic cancer stem cell niche. J. Hepatol. 2016, 64, 609–617. [Google Scholar] [CrossRef]
- Dolle, L.; Best, J.; Empsen, C.; Mei, J.; Van Rossen, E.; Roelandt, P.; Snykers, S.; Najimi, M.; Al Battah, F.; Theise, N.D.; et al. Successful isolation of liver progenitor cells by aldehyde dehydrogenase activity in naive mice. Hepatology 2012, 55, 540–552. [Google Scholar] [CrossRef] [PubMed]
- Sackett, S.D.; Li, Z.; Hurtt, R.; Gao, Y.; Wells, R.G.; Brondell, K.; Kaestner, K.H.; Greenbaum, L.E. Foxl1 is a marker of bipotential hepatic progenitor cells in mice. Hepatology 2009, 49, 920–929. [Google Scholar] [CrossRef] [PubMed]
- Huch, M.; Dorrell, C.; Boj, S.F.; van Es, J.H.; Li, V.S.; van de Wetering, M.; Sato, T.; Hamer, K.; Sasaki, N.; Finegold, M.J.; et al. In vitro expansion of single lgr5+ liver stem cells induced by wnt-driven regeneration. Nature 2013, 494, 247–250. [Google Scholar] [CrossRef] [PubMed]
- Tarangelo, A.; Lo, N.; Teng, R.; Kim, E.; Le, L.; Watson, D.; Furth, E.E.; Raman, P.; Ehmer, U.; Viatour, P. Recruitment of pontin/reptin by e2f1 amplifies e2f transcriptional response during cancer progression. Nat. Commun. 2015, 6, 10028. [Google Scholar] [CrossRef] [PubMed]
- Ceulemans, A.; Verhulst, S.; Van Haele, M.; Govaere, O.; Ventura, J.J.; van Grunsven, L.A.; Roskams, T. Rna-sequencing-based comparative analysis of human hepatic progenitor cells and their niche from alcoholic steatohepatitis livers. Cell Death Dis. 2017, 8, e3164. [Google Scholar] [CrossRef] [PubMed]
- Yoon, S.M.; Gerasimidou, D.; Kuwahara, R.; Hytiroglou, P.; Yoo, J.E.; Park, Y.N.; Theise, N.D. Epithelial cell adhesion molecule (epcam) marks hepatocytes newly derived from stem/progenitor cells in humans. Hepatology 2011, 53, 964–973. [Google Scholar] [CrossRef] [PubMed]
- Pepe-Mooney, B.J.; Dill, M.T.; Alemany, A.; Ordovas-Montanes, J.; Matsushita, Y.; Rao, A.; Sen, A.; Miyazaki, M.; Anakk, S.; Dawson, P.A.; et al. Single-cell analysis of the liver epithelium reveals dynamic heterogeneity and an essential role for yap in homeostasis and regeneration. Cell Stem Cell 2019, 25, 23–38 e8. [Google Scholar] [CrossRef]
- Aizarani, N.; Saviano, A.; Sagar; Mailly, L.; Durand, S.; Herman, J.S.; Pessaux, P.; Baumert, T.F.; Grun, D. A human liver cell atlas reveals heterogeneity and epithelial progenitors. Nature 2019, 572, 199–204. [Google Scholar] [CrossRef]
- Shin, S.; Walton, G.; Aoki, R.; Brondell, K.; Schug, J.; Fox, A.; Smirnova, O.; Dorrell, C.; Erker, L.; Chu, A.S.; et al. Foxl1-cre-marked adult hepatic progenitors have clonogenic and bilineage differentiation potential. Genes Dev. 2011, 25, 1185–1192. [Google Scholar] [CrossRef]
- Passman, A.M.; Low, J.; London, R.; Tirnitz-Parker, J.E.; Miyajima, A.; Tanaka, M.; Strick-Marchand, H.; Darlington, G.J.; Finch-Edmondson, M.; Ochsner, S.; et al. A transcriptomic signature of mouse liver progenitor cells. Stem Cells Int. 2016, 2016, 5702873. [Google Scholar] [CrossRef]
- Gautier, L.; Cope, L.; Bolstad, B.M.; Irizarry, R.A. Affy—Analysis of affymetrix genechip data at the probe level. Bioinformatics 2004, 20, 307–315. [Google Scholar] [CrossRef] [PubMed]
- Ritchie, M.E.; Phipson, B.; Wu, D.; Hu, Y.; Law, C.W.; Shi, W.; Smyth, G.K. Limma powers differential expression analyses for rna-sequencing and microarray studies. Nucleic Acids Res. 2015, 43, e47. [Google Scholar] [CrossRef] [PubMed]
- Zhang, D.Y.; Goossens, N.; Guo, J.; Tsai, M.C.; Chou, H.I.; Altunkaynak, C.; Sangiovanni, A.; Iavarone, M.; Colombo, M.; Kobayashi, M.; et al. A hepatic stellate cell gene expression signature associated with outcomes in hepatitis c cirrhosis and hepatocellular carcinoma after curative resection. Gut 2016, 65, 1754–1764. [Google Scholar] [CrossRef] [PubMed]
- Butler, A.; Hoffman, P.; Smibert, P.; Papalexi, E.; Satija, R. Integrating single-cell transcriptomic data across different conditions, technologies, and species. Nat. Biotechnol. 2018, 36, 411–420. [Google Scholar] [CrossRef] [PubMed]
- Yauk, C.L.; Berndt, M.L.; Williams, A.; Douglas, G.R. Comprehensive comparison of six microarray technologies. Nucleic Acids Res. 2004, 32, e124. [Google Scholar] [CrossRef]
- Irizarry, R.A.; Warren, D.; Spencer, F.; Kim, I.F.; Biswal, S.; Frank, B.C.; Gabrielson, E.; Garcia, J.G.; Geoghegan, J.; Germino, G.; et al. Multiple-laboratory comparison of microarray platforms. Nat. Methods 2005, 2, 345–350. [Google Scholar] [CrossRef] [PubMed]
- Furuyama, K.; Kawaguchi, Y.; Akiyama, H.; Horiguchi, M.; Kodama, S.; Kuhara, T.; Hosokawa, S.; Elbahrawy, A.; Soeda, T.; Koizumi, M.; et al. Continuous cell supply from a sox9-expressing progenitor zone in adult liver, exocrine pancreas and intestine. Nat. Genet. 2011, 43, 34–41. [Google Scholar] [CrossRef]
- Arends, B.; Vankelecom, H.; Vander Borght, S.; Roskams, T.; Penning, L.C.; Rothuizen, J.; Spee, B. The dog liver contains a “side population” of cells with hepatic progenitor-like characteristics. Stem Cells Dev. 2009, 18, 343–350. [Google Scholar] [CrossRef]
- Sicklick, J.K.; Li, Y.X.; Melhem, A.; Schmelzer, E.; Zdanowicz, M.; Huang, J.; Caballero, M.; Fair, J.H.; Ludlow, J.W.; McClelland, R.E.; et al. Hedgehog signaling maintains resident hepatic progenitors throughout life. Am. J. Physiol. Gastrointest. Liver Physiol. 2006, 290, G859–G870. [Google Scholar] [CrossRef]
- Bird, T.G.; Lu, W.-Y.; Boulter, L.; Gordon-Keylock, S.; Ridgway, R.A.; Williams, M.J.; Taube, J.; Thomas, J.A.; Wojtacha, D.; Gambardella, A.; et al. Bone marrow injection stimulates hepatic ductular reactions in the absence of injury via macrophage-mediated tweak signaling. Proc. Natl. Acad. Sci. USA 2013, 110, 6542–6547. [Google Scholar] [CrossRef]
- Boulter, L.; Govaere, O.; Bird, T.G.; Radulescu, S.; Ramachandran, P.; Pellicoro, A.; Ridgway, R.A.; Seo, S.S.; Spee, B.; Van Rooijen, N.; et al. Macrophage-derived wnt opposes notch signaling to specify hepatic progenitor cell fate in chronic liver disease. Nat. Med. 2012, 18, 572–579. [Google Scholar] [CrossRef] [PubMed]
- Thenappan, A.; Li, Y.; Kitisin, K.; Rashid, A.; Shetty, K.; Johnson, L.; Mishra, L. Role of transforming growth factor beta signaling and expansion of progenitor cells in regenerating liver. Hepatology 2010, 51, 1373–1382. [Google Scholar] [CrossRef] [PubMed]
- Lim, R.; Knight, B.; Patel, K.; McHutchison, J.G.; Yeoh, G.C.; Olynyk, J.K. Antiproliferative effects of interferon alpha on hepatic progenitor cells in vitro and in vivo. Hepatology 2006, 43, 1074–1083. [Google Scholar] [CrossRef] [PubMed]
- Sancho-Bru, P.; Altamirano, J.; Rodrigo-Torres, D.; Coll, M.; Millan, C.; Jose Lozano, J.; Miquel, R.; Arroyo, V.; Caballeria, J.; Gines, P.; et al. Liver progenitor cell markers correlate with liver damage and predict short-term mortality in patients with alcoholic hepatitis. Hepatology 2012, 55, 1931–1941. [Google Scholar] [CrossRef] [PubMed]
- Parent, R.; Marion, M.J.; Furio, L.; Trepo, C.; Petit, M.A. Origin and characterization of a human bipotent liver progenitor cell line. Gastroenterology 2004, 126, 1147–1156. [Google Scholar] [CrossRef] [PubMed]
- Roskams, T.; Yang, S.Q.; Koteish, A.; Durnez, A.; DeVos, R.; Huang, X.; Achten, R.; Verslype, C.; Diehl, A.M. Oxidative stress and oval cell accumulation in mice and humans with alcoholic and nonalcoholic fatty liver disease. Am. J. Pathol. 2003, 163, 1301–1311. [Google Scholar] [CrossRef]
- Tang, F.; Barbacioru, C.; Wang, Y.; Nordman, E.; Lee, C.; Xu, N.; Wang, X.; Bodeau, J.; Tuch, B.B.; Siddiqui, A.; et al. Mrna-seq whole-transcriptome analysis of a single cell. Nat. Methods 2009, 6, 377–382. [Google Scholar] [CrossRef]
- Pont, F.; Tosolini, M.; Fournié, J.J. Single-cell signature explorer for comprehensive visualization of single cell signatures across scrna-seq data sets. bioRxiv 2019. [Google Scholar] [CrossRef]
- Theise, N.D.; Saxena, R.; Portmann, B.C.; Thung, S.N.; Yee, H.; Chiriboga, L.; Kumar, A.; Crawford, J.M. The canals of hering and hepatic stem cells in humans. Hepatology 1999, 30, 1425–1433. [Google Scholar] [CrossRef]
- Kuwahara, R.; Kofman, A.V.; Landis, C.S.; Swenson, E.S.; Barendswaard, E.; Theise, N.D. The hepatic stem cell niche: Identification by label-retaining cell assay. Hepatology 2008, 47, 1994–2002. [Google Scholar] [CrossRef] [Green Version]
- Van Delft, J.; Gaj, S.; Lienhard, M.; Albrecht, M.W.; Kirpiy, A.; Brauers, K.; Claessen, S.; Lizarraga, D.; Lehrach, H.; Herwig, R.; et al. Rna-seq provides new insights in the transcriptome responses induced by the carcinogen benzo[a]pyrene. Toxicol. Sci. 2012, 130, 427–439. [Google Scholar] [CrossRef] [PubMed]
- Zhao, S.; Fung-Leung, W.P.; Bittner, A.; Ngo, K.; Liu, X. Comparison of rna-seq and microarray in transcriptome profiling of activated t cells. PLoS ONE 2014, 9, e78644. [Google Scholar] [CrossRef] [PubMed]
- Bottomly, D.; Walter, N.A.; Hunter, J.E.; Darakjian, P.; Kawane, S.; Buck, K.J.; Searles, R.P.; Mooney, M.; McWeeney, S.K.; Hitzemann, R. Evaluating gene expression in c57bl/6j and dba/2j mouse striatum using rna-seq and microarrays. PLoS ONE 2011, 6, e17820. [Google Scholar] [CrossRef] [PubMed]
- Segal, J.M.; Wesche, D.J.; Serra, M.P.; Oulès, B.; Kent, D.; Ng, S.S.; Kar, G.; Emerton, G.; Blackford, S.J.I.; Darmanis, S.; et al. Single-cell analysis identifies epcam+/cdh6+/trop-2- cells as human liver progenitors. bioRxiv 2018. [Google Scholar] [CrossRef]
- Halpern, K.B.; Shenhav, R.; Matcovitch-Natan, O.; Toth, B.; Lemze, D.; Golan, M.; Massasa, E.E.; Baydatch, S.; Landen, S.; Moor, A.E.; et al. Single-cell spatial reconstruction reveals global division of labour in the mammalian liver. Nature 2017, 542, 352–356. [Google Scholar] [CrossRef]
- Stoeckius, M.; Hafemeister, C.; Stephenson, W.; Houck-Loomis, B.; Chattopadhyay, P.K.; Swerdlow, H.; Satija, R.; Smibert, P. Simultaneous epitope and transcriptome measurement in single cells. Nat. Methods 2017, 14, 865–868. [Google Scholar] [CrossRef] [PubMed] [Green Version]
- Sasine, J.P.; Himburg, H.A.; Zhao, L.M.; Tran, E.; Counter, C.; Chute, J.P. Overexpression of wild-type kras promotes hematopoietic stem cell expansion and self-renewal without induction of malignancy. Biol. Blood Marrow Transplantat. 2016, 22, S424. [Google Scholar] [CrossRef]
- Sasine, J.P.; Himburg, H.A.; Termini, C.M.; Roos, M.; Tran, E.; Zhao, L.; Kan, J.; Li, M.; Zhang, Y.; de Barros, S.C.; et al. Wild-type kras expands and exhausts hematopoietic stem cells. JCI Insight 2018, 3. [Google Scholar] [CrossRef]
- Kubara, K.; Yamazaki, K.; Ishihara, Y.; Naruto, T.; Lin, H.T.; Nishimura, K.; Ohtaka, M.; Nakanishi, M.; Ito, M.; Tsukahara, K.; et al. Status of kras in ipscs impacts upon self-renewal and differentiation propensity. Stem Cell Rep. 2018, 11, 380–394. [Google Scholar] [CrossRef]
- Aizarani, N.; Saviano, A.; Sagar; Mailly, L.; Durand, S.; Pessaux, P.; Baumert, T.F.; Grün, D. A human liver cell atlas: Revealing cell type heterogeneity and adult liver progenitors by single-cell rna-sequencing. bioRxiv 2019. [Google Scholar] [CrossRef]
- Krenkel, O.; Hundertmark, J.; Ritz, T.P.; Weiskirchen, R.; Tacke, F. Single cell rna sequencing identifies subsets of hepatic stellate cells and myofibroblasts in liver fibrosis. Cells 2019, 8, 503. [Google Scholar] [CrossRef]
Figure 1.
Workflow and clustering of BEC transcriptome data sets. (A) Schematic overview of the workflow to merge microarray data from different platforms. Colored bars represent boxplots of the expression of all genes from one sample. Three colors are an example of three different datasets with multiple samples. (B,C) T-distributed stochastic neighbor embedding (t-SNE) and Pearson correlation analysis of mouse transcriptomic data from BEC cell lines, primary BECs and healthy livers. (D) Relative gene expression analysis (fold change, log2) of common BEC markers in primary human and mouse BECs compared to livers.

Figure 2.
Gene expression of popularly used BEC markers for isolation in primary human and mouse BECs. Gene expression of mouse and human livers (grey), quiescent (orange) and activated (blue) BECs. Left axis represents normalized intensity values (log2) for all mouse gene expression and right axis normalized transcript per million (log2) for human data.

Figure 3.
Pathway analysis of BEC populations. Gene set enrichment analysis of Hallmark pathways on transcriptomic profiles of BECs compared to healthy (mouse) or injured (human) livers. Gradient of the blue color represents positively enriched pathway (False discovery rate, FDR).
Figure 3.
Pathway analysis of BEC populations. Gene set enrichment analysis of Hallmark pathways on transcriptomic profiles of BECs compared to healthy (mouse) or injured (human) livers. Gradient of the blue color represents positively enriched pathway (False discovery rate, FDR).

Figure 4.
Selection of genes enriched in BECs. Heatmap of genes enriched in BECs compared to healthy livers (A and C) or different cell types (B and D). For A only genes enriched in BECs isolated from healthy mouse livers were used while for C only genes enriched in BECs isolated from either choline-deficient, ethionine-supplemented (CDE)- or 3,5-diethoxycarbonyl-1,4-dihydrocollidine (DDC)-treated mice.

Figure 5.
Generation of BEC gene signatures. (A) Venn diagrams of the genes enriched in BECs compared to healthy livers or different cell types and both merged gene sets compared to genes enriched in human BECs. Gene ontology (GO) analysis of quiescent (B) and activated (C) BEC gene signature. The size of the circle is correlated to the number of genes involved in that GO. The color of the circle represents significance (adjusted p-value) and the x-axis stands for gene ratio (genes within signature versus total number of genes in GO). (D) Venn diagram of genes enriched in quiescent and activated BECs (microarray/RNAseq) and in BECs from scRNAseq of human livers.

Figure 6.
BEC signatures to identify BECs. (A and B) Visual representation (chord diagram) of gene set enrichment analysis with our quiescent and activated BEC signatures, Sancho-Bru signature (2012) [44] and BEC cell line signature of Passman et al. 2016 [30] on BEC-like cells and liver diseases (AC: alcoholic cirrhosis, AH: alcoholic hepatitis, NASH: non-alcoholic steatohepatitis, PBC: peribiliary cirrhosis, PSC: primary sclerosis cholangitis). The size of the arrow presents the positive enrichment (significance, -log p-value).

Figure 7.
Validation of scBEC signature. TSNE plots of human (A) and mouse (B) liver cells from respectively Aizarani et al. 2019 [28] and Pepe-Mooney et al. 2019 [27], with expression of every single gene of the scBEC signature. Blue scale bars represent normalized counts.


Table 1.
Biliary epithelial cells (BEC) gene expression data.
| LPC Marker | Reference | Healthy | Injury | Hepatocytes | Niche | Injury Model | Species | Platform | GSEA | ||||
|---|---|---|---|---|---|---|---|---|---|---|---|---|---|
| LPC | Liver | Negative Fraction | LPC | Liver | Negative Fraction | ||||||||
| LGR5 | [23] | x | x | x | x | CCl4 | Mouse | Agilent 014868 G4122F | GSE32210 | ||||
| MIC1 1C3 | [18] | x | x | x | x | DDC | Mouse | Agilent 014868 G4122F | GSE29121 | ||||
| HNF1b | [10] | x | x | x | DDC / CDE | Mouse | Mogene 2.0st | GSE51389 | |||||
| Foxl1 | [29] | x | x | x | DDC | Mouse | Agilent 014868 G4122F | GSE28892 | |||||
| LPC cell lines | [30] | x | x | None | Mouse | Mouse 430_2 | GSE85114/GSE12908/GSE18269 | ||||||
| Side population | [25] | x | x | x | ASH | Human | Truseq LT | GSE102683 | |||||
| EpCAM | [25] | x | x | x | ASH | Human | Truseq LT | GSE102683 | |||||
| TROP2 | [25] | x | x | x | ASH | Human | Truseq LT | GSE102683 | |||||
| EpCAM | [24] | x | None | Mouse | Mouse 430_2 | GSE63793 | |||||||
Table 2.
Microarray GEO sample (GSM) number associated with cell type or tissue.
| GSM Number | Cell Type or Tissue | Specie |
|---|---|---|
| GSM1061907, GSM1061908, GSM686644, GSM686645 | Bcell | Mouse |
| GSM1071644, GSM361592, GSM389821 | platelet_megakaryocyte | Mouse |
| GSM1081398 - GSM1081400 | CD8_T_cell | Mouse |
| GSM1129665, GSM686658, GSM686659 | macrophage | Mouse |
| GSM1214478-GSM1214480, GSM686650, GSM686651 | NK | Mouse |
| GSM1232678 - GSM1232680, GSM686652, GSM686653 | NKT | Mouse |
| GSM1281320 - GSM1281322, GSM525382 - GSM525384 | hepatocyte | Mouse |
| GSM1301661, GSM1301662 | neutrophil | Mouse |
| GSM190795 - GSM190797, GSM598999 - GSM599002, GSM658893 - GSM658898, GSM765922 - GSM765924 | epithelial | Mouse |
| GSM216494 - GSM216497, GSM686654 | erythroblast | Mouse |
| GSM298115 - GSM298117, GSM378250 - GSM378254 | fetal_liver | Mouse |
| GSM344315 - GSM344318 | neutrophil | Mouse |
| GSM547762 - GSM547766, GSM690763 - GSM690765 | endothelial | Mouse |
| GSM555381 - GSM555384 | CD4_T_cell | Mouse |
| GSM571897 | macrophage | Mouse |
| GSM591473, GSM591475, GSM591477, GSM591480, GSM602665 - GSM602667 | Healthy Liver | Mouse |
| GSM686646, GSM686647 | CD4_T_cell | Mouse |
| GSM686648, GSM686649 | CD8_T_cell | Mouse |
| GSM852330 - GSM852334 | Quiescent HSC | Mouse |
| GSM852341 - GSM852343 | HSC from BDL | Mouse |
| GSM852344 - GSM852346 | CCl4_HSC | Mouse |
| GSM1557526 - GSM1557528 | LPC EPCAM | Mouse |
| GSM2257924 - GSM2257940 | PIL | Mouse |
| GSM2257941 - GSM2257944 | BMOL | Mouse |
| GSM2257945 - GSM2257947 | T_LPC | Mouse |
| GSM323977 - GSM323981 | BMEL | Mouse |
| GSM715841 - GSM715844 | LPC_Foxl1_D0 | Mouse |
| GSM715856 - GSM715859 | LPC_Foxl1_POS_D3 | Mouse |
| GSM715860 - GSM715863 | LPC_Foxl1_POS_D7 | Mouse |
| GSM715864 - GSM715866 | LPC_Foxl1_POS_D14 | Mouse |
| GSM715867 - GSM715870 | LPC_Foxl1_undiff | Mouse |
| GSM721145 - GSM721149 | LPC_MIC_POS_CTL | Mouse |
| GSM721153 - GSM721156 | LPC_MIC_POS_DDC | Mouse |
| GSM1047599, GSM1047603 | LPC_LGR5 | Mouse |
| GSM1244523, GSM1244525 | LPC_HNF1b_POS_CDE | Mouse |
| GSM1244526 - GSM1244528 | LPC_HNF1b_POS_DDC | Mouse |
| GSM1244529, GSM1244530 | LPC_HNF1b_POS_CTL | Mouse |
| GSM709348 - GSM709354 | Healthy Livers for ASH | Human |
| GSM709355 - GSM709369 | ASH | Human |
| GSM1974233, GSM1974234 | Primary hepatocytes | Human |
| GSM1974235, GSM1974236 | Fetal hepatocytes | Human |
| GSM1627740 - GSM1627773 | Healthy livers for NASH | Human |
| GSM1627805, GSM1627806 | Definite NASH | Human |
| GSM155919, GSM155926 - GSM155928, GSM155947, GSM155948, GSM155961, GSM155964, GSM155988, GSM155989 | Healthy livers as control for Cirrhotic livers | Human |
| GSM155920 - GSM155923, GSM155931, GSM155951, GSM155952, GSM155965 - GSM155969, GSM155984 | Cirrhotic livers | Human |
| GSM2787428, GSM2787427 | Human iPSC | Human |
| GSM2787426, GSM2787425 | Cultured iPSC-LPC | Human |
| GSM2787422, GSM2787421 | Fresh iPSC-LPC | Human |
| GSM456340 - GSM456342 | HepaRG_diff | Human |
| GSM456343 - GSM456345 | HepaRG_undiff | Human |
| GSM456349 - GSM456351 | Primary hepatocytes Control for HepaRG | Human |
Table 3.
List of human and mouse genes in quiescent and activated BECs.
| HUMAN | MOUSE | HUMAN/MOUSE | ||||
|---|---|---|---|---|---|---|
| Gene Name | Gene Description | Entrez ID | Ensemble ID | Gene Name | Ensemble ID | LPC expression |
| AKAP7 | A-kinase anchoring protein 7 | 9465 | ENSG00000118507 | Akap7 | ENSMUSG00000039166 | Activated |
| ALDH1A2 | aldehyde dehydrogenase 1 family member A2 | 8854 | ENSG00000128918 | Aldh1a2 | ENSMUSG00000013584 | Quiescent |
| ANKRD1 | ankyrin repeat domain 1 | 27063 | ENSG00000148677 | Ankrd1 | ENSMUSG00000024803 | Activated |
| ANKRD42 | ankyrin repeat domain 42 | 338699 | ENSG00000137494 | Ankrd42 | ENSMUSG00000041343 | Activated |
| ARL14 | ADP ribosylation factor like GTPase 14 | 80117 | ENSG00000179674 | Arl14 | ENSMUSG00000098207 | Quiescent and Activated |
| ATF3 | activating transcription factor 3 | 467 | ENSG00000162772 | Atf3 | ENSMUSG00000026628 | Quiescent |
| B4GALT5 | beta-1,4-galactosyltransferase 5 | 9334 | ENSG00000158470 | B4galt5 | ENSMUSG00000017929 | Activated |
| BICC1 | BicC family RNA binding protein 1 | 80114 | ENSG00000122870 | Bicc1 | ENSMUSG00000014329 | Quiescent and Activated |
| C1orf116 | chromosome 1 open reading frame 116 | 79098 | ENSG00000182795 | AA986860 | ENSMUSG00000042510 | Quiescent and Activated |
| CDH1 | cadherin 1 | 999 | ENSG00000039068 | Cdh1 | ENSMUSG00000000303 | Activated |
| CDH6 | cadherin 6 | 1004 | ENSG00000113361 | Cdh6 | ENSMUSG00000039385 | Activated |
| CREB5 | cAMP responsive element binding protein 5 | 9586 | ENSG00000146592 | Creb5 | ENSMUSG00000053007 | Activated |
| CRYAB | crystallin alpha B | 1410 | ENSG00000109846 | Cryab | ENSMUSG00000032060 | Quiescent and Activated |
| CTGF | connective tissue growth factor | 1490 | ENSG00000118523 | Ctgf | ENSMUSG00000019997 | Quiescent and Activated |
| CYR61 | cysteine rich angiogenic inducer 61 | 3491 | ENSG00000142871 | Cyr61 | ENSMUSG00000028195 | Quiescent and Activated |
| DCDC2 | doublecortin domain containing 2 | 51473 | ENSG00000146038 | Dcdc2a | ENSMUSG00000035910 | Quiescent and Activated |
| DDR1 | discoidin domain receptor tyrosine kinase 1 | 780 | ENSG00000223680 | Ddr1 | ENSMUSG00000003534 | Activated |
| DSP | desmoplakin | 1832 | ENSG00000096696 | Dsp | ENSMUSG00000054889 | Activated |
| EGR2 | early growth response 2 | 1959 | ENSG00000122877 | Egr2 | ENSMUSG00000037868 | Quiescent |
| EHF | ETS homologous factor | 26298 | ENSG00000135373 | Ehf | ENSMUSG00000012350 | Quiescent and Activated |
| ELOVL7 | ELOVL fatty acid elongase 7 | 79993 | ENSG00000164181 | Elovl7 | ENSMUSG00000021696 | Activated |
| ENC1 | ectodermal-neural cortex 1 | 8507 | ENSG00000171617 | Enc1 | ENSMUSG00000041773 | Activated |
| ENTPD2 | ectonucleoside triphosphate diphosphohydrolase 2 | 954 | ENSG00000054179 | Entpd2 | ENSMUSG00000015085 | Quiescent |
| EPCAM | epithelial cell adhesion molecule | 4072 | ENSG00000119888 | Epcam | ENSMUSG00000045394 | Quiescent and Activated |
| FBRS | fibrosin | 64319 | ENSG00000156860 | Fbrs | ENSMUSG00000042423 | Activated |
| FLRT3 | fibronectin leucine rich transmembrane protein 3 | 23767 | ENSG00000125848 | Flrt3 | ENSMUSG00000051379 | Quiescent and Activated |
| FOSB | FosB proto-oncogene, AP-1 transcription factor subunit | 2354 | ENSG00000125740 | Fosb | ENSMUSG00000003545 | Quiescent and Activated |
| FOXJ1 | forkhead box J1 | 2302 | ENSG00000129654 | Foxj1 | ENSMUSG00000034227 | Activated |
| FRAS1 | Fraser extracellular matrix complex subunit 1 | 80144 | ENSG00000138759 | Fras1 | ENSMUSG00000034687 | Quiescent |
| GADD45B | growth arrest and DNA damage inducible beta | 4616 | ENSG00000099860 | Gadd45b | ENSMUSG00000015312 | Activated |
| GLIS2 | GLIS family zinc finger 2 | 84662 | ENSG00000274636 | Glis2 | ENSMUSG00000014303 | Quiescent and Activated |
| GLIS3 | GLIS family zinc finger 3 | 169792 | ENSG00000107249 | Glis3 | ENSMUSG00000052942 | Quiescent and Activated |
| GOLGB1 | golgin B1 | 2804 | ENSG00000173230 | Golgb1 | ENSMUSG00000034243 | Quiescent |
| HBEGF | heparin binding EGF like growth factor | 1839 | ENSG00000113070 | Hbegf | ENSMUSG00000024486 | Quiescent and Activated |
| HSPA1A | heat shock protein family A (Hsp70) member 1A | 3303 | ENSG00000237724 | Hspa1a | ENSMUSG00000091971 | Quiescent |
| HSPA1B | heat shock protein family A (Hsp70) member 1B | 3304 | ENSG00000224501 | Hspa1b | ENSMUSG00000090877 | Quiescent |
| ITGB4 | integrin subunit beta 4 | 3691 | ENSG00000132470 | Itgb4 | ENSMUSG00000020758 | Activated |
| ITGB8 | integrin subunit beta 8 | 3696 | ENSG00000105855 | Itgb8 | ENSMUSG00000025321 | Quiescent and Activated |
| JUNB | JunB proto-oncogene, AP-1 transcription factor subunit | 3726 | ENSG00000171223 | Junb | ENSMUSG00000052837 | Activated |
| JUND | JunD proto-oncogene, AP-1 transcription factor subunit | 3727 | ENSG00000130522 | Jund | ENSMUSG00000071076 | Quiescent and Activated |
| KIAA1324 | KIAA1324 | 57535 | ENSG00000116299 | 5330417C22Rik | ENSMUSG00000040412 | Quiescent and Activated |
| KLF5 | Kruppel like factor 5 | 688 | ENSG00000102554 | Klf5 | ENSMUSG00000005148 | Quiescent and Activated |
| KRT17 | keratin 17 | 3872 | ENSG00000128422 | Krt17 | ENSMUSG00000035557 | Activated |
| KRT19 | keratin 19 | 3880 | ENSG00000171345 | Krt19 | ENSMUSG00000020911 | Quiescent and Activated |
| KRT7 | keratin 7 | 3855 | ENSG00000135480 | Krt7 | ENSMUSG00000023039 | Quiescent and Activated |
| LAMB2 | laminin subunit beta 2 | 3913 | ENSG00000172037 | Lamb2 | ENSMUSG00000052911 | Quiescent |
| LAMC2 | laminin subunit gamma 2 | 3918 | ENSG00000058085 | Lamc2 | ENSMUSG00000026479 | Quiescent and Activated |
| LRRC49 | leucine rich repeat containing 49 | 54839 | ENSG00000137821 | Lrrc49 | ENSMUSG00000047766 | Activated |
| MACC1 | MET transcriptional regulator MACC1 | 346389 | ENSG00000183742 | Macc1 | ENSMUSG00000041886 | Quiescent and Activated |
| MAGI1 | membrane associated guanylate kinase, WW and PDZ domain containing 1 | 9223 | ENSG00000151276 | Magi1 | ENSMUSG00000045095 | Quiescent and Activated |
| MYO5C | myosin VC | 55930 | ENSG00000128833 | Myo5c | ENSMUSG00000033590 | Activated |
| MYO6 | myosin VI | 4646 | ENSG00000196586 | Myo6 | ENSMUSG00000033577 | Activated |
| NFAT5 | nuclear factor of activated T cells 5 | 10725 | ENSG00000102908 | Nfat5 | ENSMUSG00000003847 | Activated |
| NFE2L3 | nuclear factor, erythroid 2 like 3 | 9603 | ENSG00000050344 | Nfe2l3 | ENSMUSG00000029832 | Quiescent |
| NFKBIE | NFKB inhibitor epsilon | 4794 | ENSG00000146232 | Nfkbie | ENSMUSG00000023947 | Activated |
| NOTCH2 | notch 2 | 4853 | ENSG00000134250 | Notch2 | ENSMUSG00000027878 | Quiescent and Activated |
| NSD1 | nuclear receptor binding SET domain protein 1 | 64324 | ENSG00000165671 | Nsd1 | ENSMUSG00000021488 | Quiescent and Activated |
| PEG10 | paternally expressed 10 | 23089 | ENSG00000242265 | Peg10 | ENSMUSG00000092035 | Activated |
| POGZ | pogo transposable element derived with ZNF domain | 23126 | ENSG00000143442 | Pogz | ENSMUSG00000038902 | Activated |
| PPP1R9A | protein phosphatase 1 regulatory subunit 9A | 55607 | ENSG00000158528 | Ppp1r9a | ENSMUSG00000032827 | Activated |
| RAI2 | retinoic acid induced 2 | 10742 | ENSG00000131831 | Rai2 | ENSMUSG00000043518 | Quiescent and Activated |
| RASSF9 | Ras association domain family member 9 | 9182 | ENSG00000198774 | Rassf9 | ENSMUSG00000044921 | Quiescent and Activated |
| RBM25 | RNA binding motif protein 25 | 58517 | ENSG00000119707 | Rbm25 | ENSMUSG00000010608 | Activated |
| RIPK4 | receptor interacting serine/threonine kinase 4 | 54101 | ENSG00000183421 | Ripk4 | ENSMUSG00000005251 | Activated |
| S100A6 | S100 calcium binding protein A6 | 6277 | ENSG00000197956 | S100a6 | ENSMUSG00000001025 | Quiescent and Activated |
| SERPINH1 | serpin family H member 1 | 871 | ENSG00000149257 | Serpinh1 | ENSMUSG00000070436 | Quiescent |
| SF1 | splicing factor 1 | 7536 | ENSG00000168066 | Sf1 | ENSMUSG00000024949 | Activated |
| SHROOM3 | shroom family member 3 | 57619 | ENSG00000138771 | Shroom3 | ENSMUSG00000029381 | Quiescent and Activated |
| SLC5A1 | solute carrier family 5 member 1 | 6523 | ENSG00000100170 | Slc5a1 | ENSMUSG00000011034 | Quiescent and Activated |
| SLC6A6 | solute carrier family 6 member 6 | 6533 | ENSG00000131389 | Slc6a6 | ENSMUSG00000030096 | Activated |
| SLC7A1 | solute carrier family 7 member 1 | 6541 | ENSG00000139514 | Slc7a1 | ENSMUSG00000041313 | Activated |
| SLCO3A1 | solute carrier organic anion transporter family member 3A1 | 28232 | ENSG00000176463 | Slco3a1 | ENSMUSG00000025790 | Activated |
| SNRNP200 | small nuclear ribonucleoprotein U5 subunit 200 | 23020 | ENSG00000144028 | Snrnp200 | ENSMUSG00000003660 | Activated |
| SNRNP70 | small nuclear ribonucleoprotein U1 subunit 70 | 6625 | ENSG00000104852 | Snrnp70 | ENSMUSG00000063511 | Quiescent and Activated |
| SOX9 | SRY-box 9 | 6662 | ENSG00000125398 | Sox9 | ENSMUSG00000000567 | Quiescent and Activated |
| SPHK1 | sphingosine kinase 1 | 8877 | ENSG00000176170 | Sphk1 | ENSMUSG00000061878 | Activated |
| SPINT1 | serine peptidase inhibitor, Kunitz type 1 | 6692 | ENSG00000166145 | Spint1 | ENSMUSG00000027315 | Quiescent and Activated |
| SREBF2 | sterol regulatory element binding transcription factor 2 | 6721 | ENSG00000198911 | Srebf2 | ENSMUSG00000022463 | Activated |
| STK35 | serine/threonine kinase 35 | 140901 | ENSG00000125834 | Stk35 | ENSMUSG00000037885 | Activated |
| SYNJ2 | synaptojanin 2 | 8871 | ENSG00000078269 | Synj2 | ENSMUSG00000023805 | Quiescent and Activated |
| TACSTD2 | tumor associated calcium signal transducer 2 | 4070 | ENSG00000184292 | Tacstd2 | ENSMUSG00000051397 | Activated |
| TCF20 | transcription factor 20 | 6942 | ENSG00000100207 | Tcf20 | ENSMUSG00000041852 | Activated |
| TGFB2 | transforming growth factor beta 2 | 7042 | ENSG00000092969 | Tgfb2 | ENSMUSG00000039239 | Quiescent and Activated |
| THSD4 | thrombospondin type 1 domain containing 4 | 79875 | ENSG00000187720 | Thsd4 | ENSMUSG00000032289 | Activated |
| TNFRSF19 | TNF receptor superfamily member 19 | 55504 | ENSG00000127863 | Tnfrsf19 | ENSMUSG00000060548 | Activated |
| TUBB2B | tubulin beta 2B class IIb | 347733 | ENSG00000137285 | Tubb2b | ENSMUSG00000045136 | Activated |
| UBAP2L | ubiquitin associated protein 2 like | 9898 | ENSG00000143569 | Ubap2l | ENSMUSG00000042520 | Quiescent and Activated |
| UGT8 | UDP glycosyltransferase 8 | 7368 | ENSG00000174607 | Ugt8a | ENSMUSG00000032854 | Quiescent and Activated |
| UNC119B | unc-119 lipid binding chaperone B | 84747 | ENSG00000175970 | Unc119b | ENSMUSG00000046562 | Activated |
| VTCN1 | V-set domain containing T cell activation inhibitor 1 | 79679 | ENSG00000134258 | Vtcn1 | ENSMUSG00000051076 | Activated |
| WFDC2 | WAP four-disulfide core domain 2 | 10406 | ENSG00000101443 | Wfdc2 | ENSMUSG00000017723 | Activated |
| WWC1 | WW and C2 domain containing 1 | 23286 | ENSG00000113645 | Wwc1 | ENSMUSG00000018849 | Quiescent and Activated |
| ZFP36 | ZFP36 ring finger protein | 7538 | ENSG00000128016 | Zfp36 | ENSMUSG00000044786 | Activated |
| ZFP36L1 | ZFP36 ring finger protein like 1 | 677 | ENSG00000185650 | Zfp36l1 | ENSMUSG00000021127 | Activated |
© 2019 by the authors. Licensee MDPI, Basel, Switzerland. This article is an open access article distributed under the terms and conditions of the Creative Commons Attribution (CC BY) license (http://creativecommons.org/licenses/by/4.0/).
Share and Cite
MDPI and ACS Style
Verhulst, S.; Roskams, T.; Sancho-Bru, P.; van Grunsven, L.A. Meta-Analysis of Human and Mouse Biliary Epithelial Cell Gene Profiles. Cells 2019, 8, 1117. https://doi.org/10.3390/cells8101117
AMA Style
Verhulst S, Roskams T, Sancho-Bru P, van Grunsven LA. Meta-Analysis of Human and Mouse Biliary Epithelial Cell Gene Profiles. Cells. 2019; 8(10):1117. https://doi.org/10.3390/cells8101117
Chicago/Turabian StyleVerhulst, Stefaan, Tania Roskams, Pau Sancho-Bru, and Leo A. van Grunsven. 2019. "Meta-Analysis of Human and Mouse Biliary Epithelial Cell Gene Profiles" Cells 8, no. 10: 1117. https://doi.org/10.3390/cells8101117
Note that from the first issue of 2016, this journal uses article numbers instead of page numbers. See further details here.