
Etiological Roles of p75NTR in a Mouse Model of Wet Age-Related Macular Degeneration

 , , , and
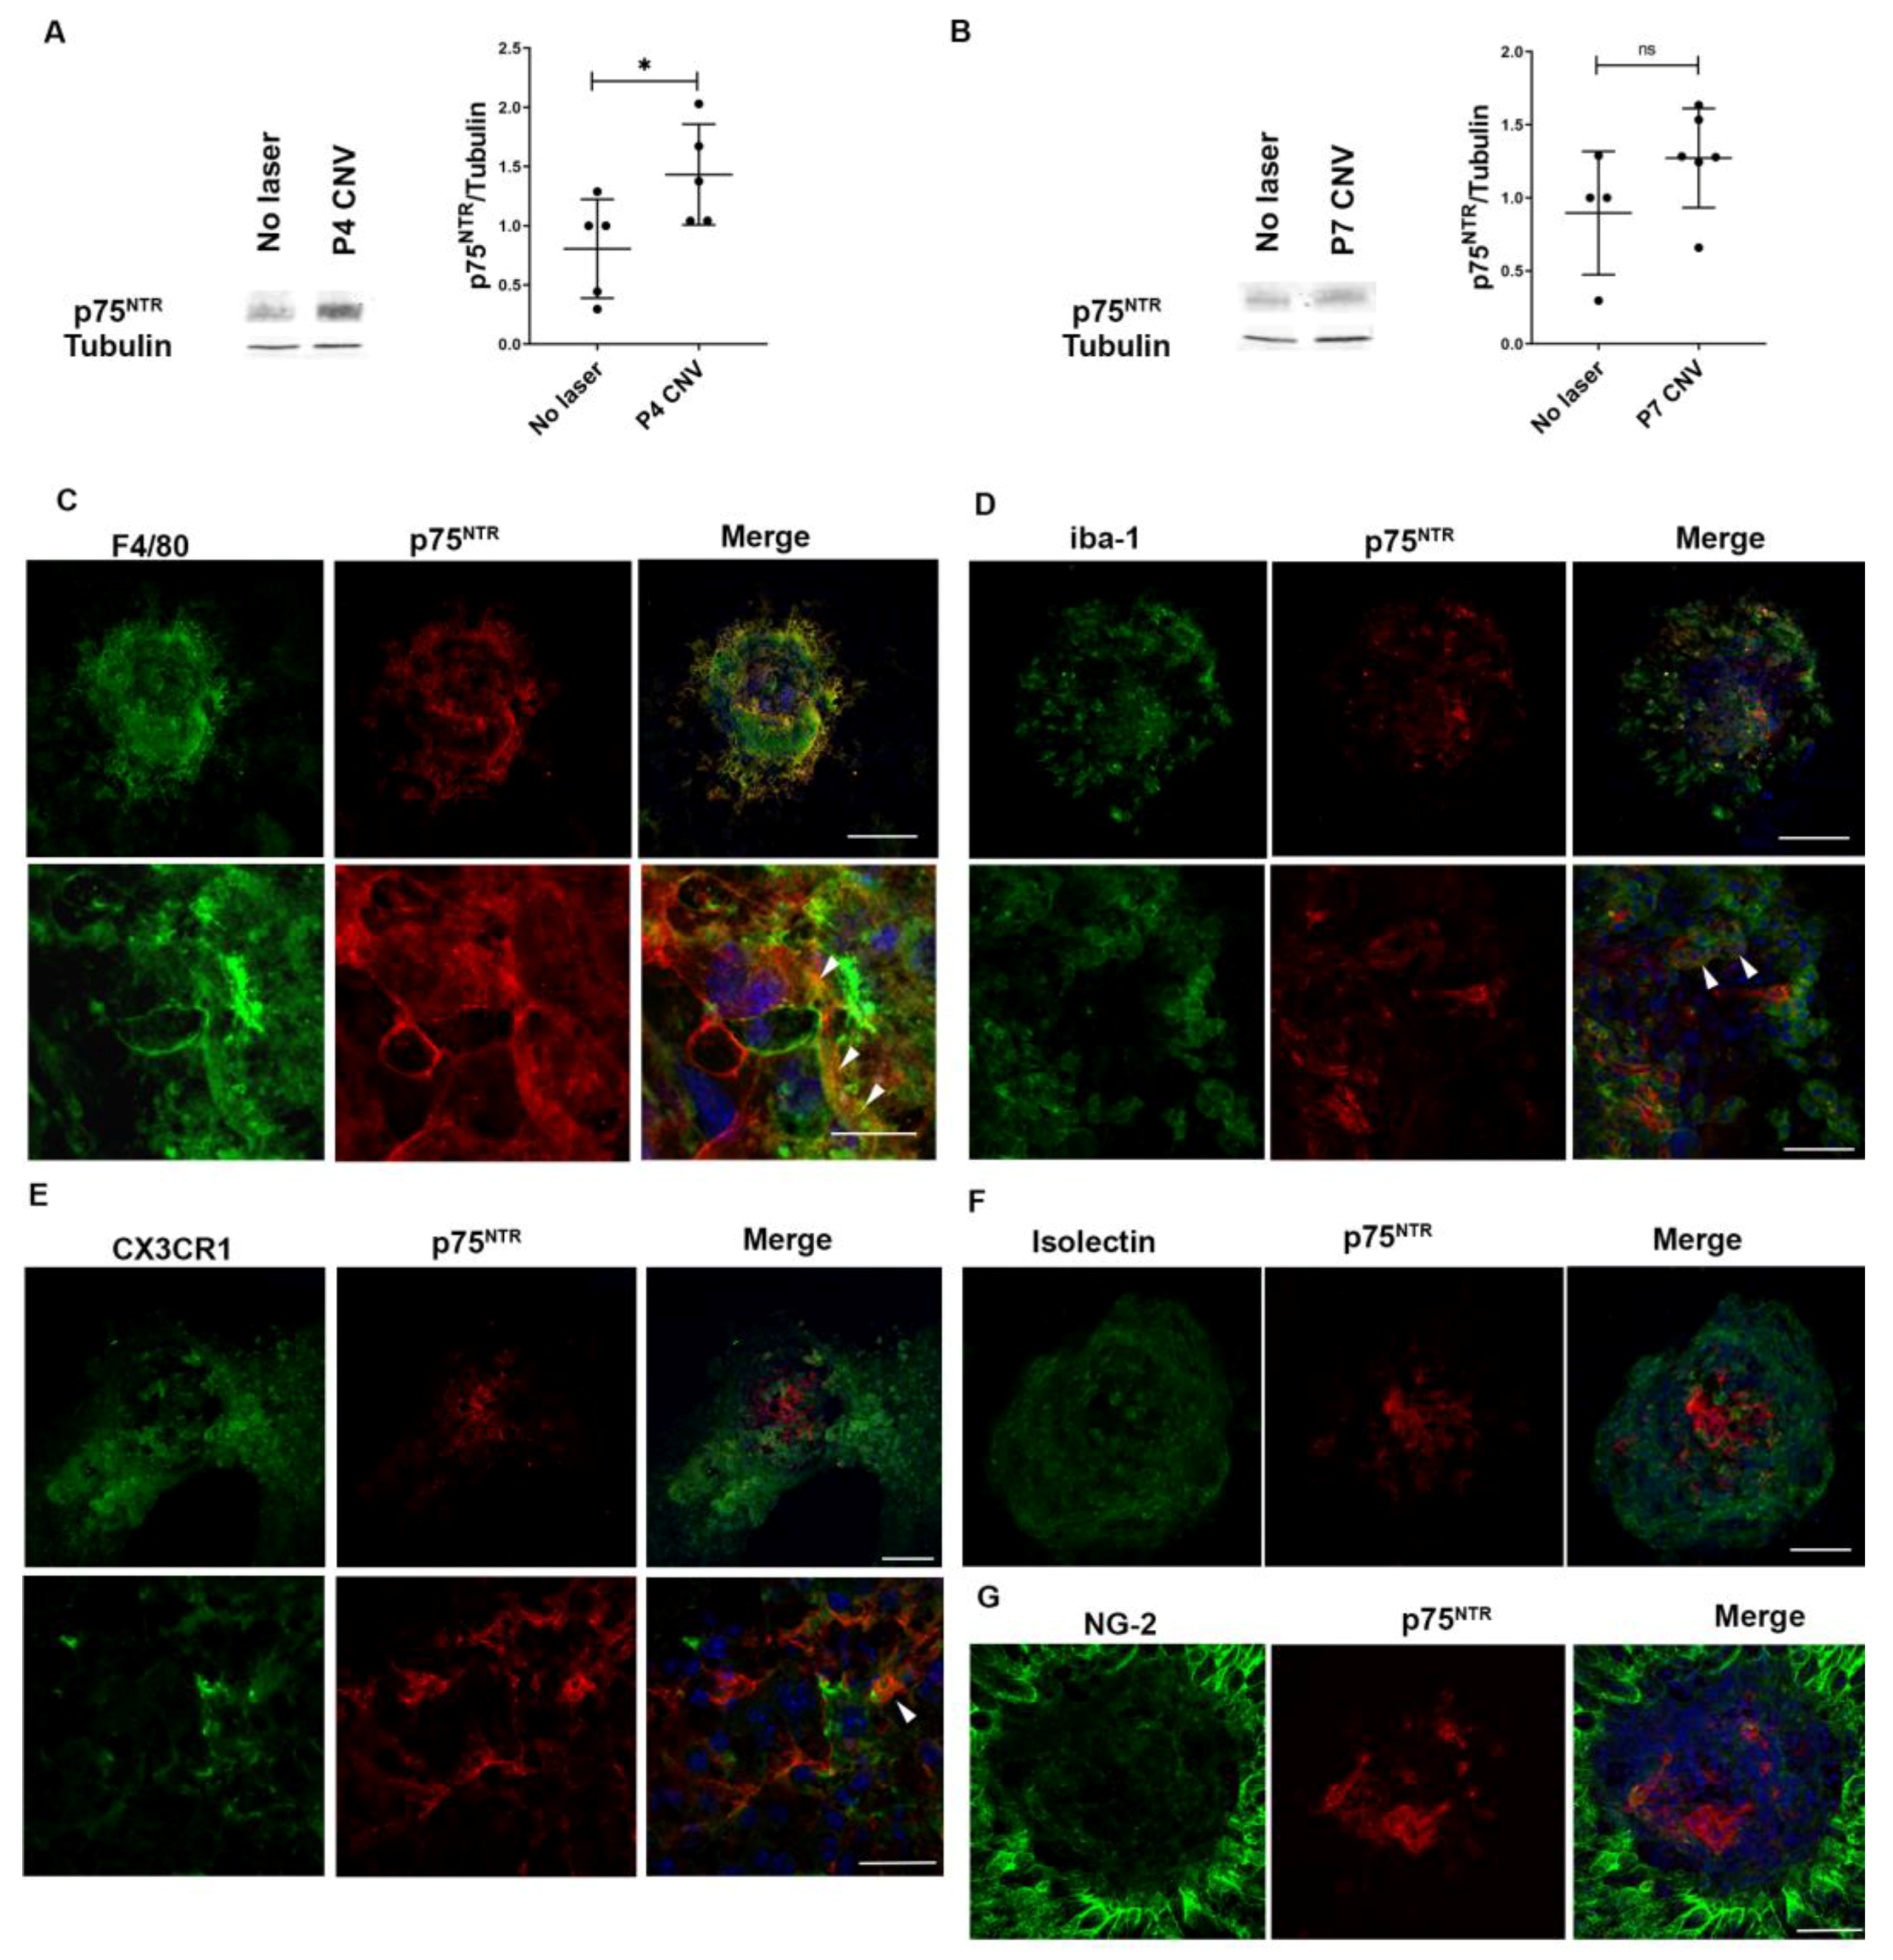
Abstract
1. Introduction
2. Materials and Methods
2.1. Mouse Laser-Induced CNV Model
2.2. Pharmacological Treatment
2.3. Genotyping
2.4. Immunofluorescent Detections in Flat-Mount RPE-Choroids and Retinas
2.5. Immunofluorescent Detections in Retinal Cryosections
2.6. Western Blot
2.7. Electroretinography (ERG)
2.8. Fluorescence-Activated Cell Sorting (FACS) Analysis
2.9. Statistical Analysis
3. Results
3.1. p75NTR Expression Is Increased in the Choroidal Neovascularization Lesions
3.2. p75NTR Expression Is Also Increased in the Injured Retina
3.3. P75NTR Deletion Reduces the Recruitment of Mononuclear Phagocytic Cells to the Lesioned Area in Laser-Injured Mice
3.4. P75NTR Deletion Reduces Choroidal Neovessels Formation, Lesion Size, and Neuronal Alterations in CNV Mice
3.5. Pharmacological Inhibition of p75NTR Reduced CNV Area and Partially Prevents the Lesion-Induced Retinal Functional Defects
4. Discussion
Author Contributions
Funding
Institutional Review Board Statement
Informed Consent Statement
Data Availability Statement
Acknowledgments
Conflicts of Interest
References
- Wong, W.L.; Su, X.; Li, X.; Cheung, C.M.; Klein, R.; Cheng, C.Y.; Wong, T.Y. Global prevalence of age-related macular degeneration and disease burden projection for 2020 and 2040: A systematic review and meta-analysis. Lancet Glob. Health 2014, 2, e106–e116. [Google Scholar] [CrossRef] [PubMed]
- Armstrong, R.A.; Mousavi, M. Overview of Risk Factors for Age-Related Macular Degeneration (AMD). J. Stem Cells 2015, 10, 171–191. [Google Scholar] [PubMed]
- Bhutto, I.; Lutty, G. Understanding age-related macular degeneration (AMD): Relationships between the photoreceptor/retinal pigment epithelium/Bruch’s membrane/choriocapillaris complex. Mol. Asp. Med. 2012, 33, 295–317. [Google Scholar] [CrossRef] [PubMed]
- van Lookeren Campagne, M.; LeCouter, J.; Yaspan, B.L.; Ye, W. Mechanisms of age-related macular degeneration and therapeutic opportunities. J. Pathol. 2014, 232, 151–164. [Google Scholar] [CrossRef]
- Karlen, S.J.; Miller, E.B.; Burns, M.E. Microglia Activation and Inflammation During the Death of Mammalian Photoreceptors. Annu. Rev. Vis. Sci. 2020, 6, 149–169. [Google Scholar] [CrossRef]
- Silverman, S.M.; Wong, W.T. Microglia in the Retina: Roles in Development, Maturity, and Disease. Annu. Rev. Vis. Sci. 2018, 4, 45–77. [Google Scholar] [CrossRef]
- Chinnery, H.R.; McLenachan, S.; Humphries, T.; Kezic, J.M.; Chen, X.; Ruitenberg, M.J.; McMenamin, P.G. Accumulation of murine subretinal macrophages: Effects of age, pigmentation and CX3CR1. Neurobiol. Aging 2012, 33, 1769–1776. [Google Scholar] [CrossRef]
- Aredo, B.; Li, T.; Chen, X.; Zhang, K.; Wang, C.X.; Gou, D.; Zhao, B.; He, Y.; Ufret-Vincenty, R.L. A chimeric Cfh transgene leads to increased retinal oxidative stress, inflammation, and accumulation of activated subretinal microglia in mice. Investig. Ophthalmol. Vis. Sci. 2015, 56, 3427–3440. [Google Scholar] [CrossRef]
- Noailles, A.; Maneu, V.; Campello, L.; Gomez-Vicente, V.; Lax, P.; Cuenca, N. Persistent inflammatory state after photoreceptor loss in an animal model of retinal degeneration. Sci. Rep. 2016, 6, 33356. [Google Scholar] [CrossRef]
- Lambert, V.; Lecomte, J.; Hansen, S.; Blacher, S.; Gonzalez, M.L.; Struman, I.; Sounni, N.E.; Rozet, E.; de Tullio, P.; Foidart, J.M.; et al. Laser-induced choroidal neovascularization model to study age-related macular degeneration in mice. Nat. Protoc. 2013, 8, 2197–2211. [Google Scholar] [CrossRef]
- Hikage, F.; Lennikov, A.; Mukwaya, A.; Lachota, M.; Ida, Y.; Utheim, T.P.; Chen, D.F.; Huang, H.; Ohguro, H. NF-kappaB activation in retinal microglia is involved in the inflammatory and neovascularization signaling in laser-induced choroidal neovascularization in mice. Exp. Cell Res. 2021, 403, 112581. [Google Scholar] [CrossRef] [PubMed]
- Yang, Y.; Liu, F.; Tang, M.; Yuan, M.; Hu, A.; Zhan, Z.; Li, Z.; Li, J.; Ding, X.; Lu, L. Macrophage polarization in experimental and clinical choroidal neovascularization. Sci. Rep. 2016, 6, 30933. [Google Scholar] [CrossRef] [PubMed]
- Nakamura, R.; Sene, A.; Santeford, A.; Gdoura, A.; Kubota, S.; Zapata, N.; Apte, R.S. IL10-driven STAT3 signalling in senescent macrophages promotes pathological eye angiogenesis. Nat. Commun. 2015, 6, 7847. [Google Scholar] [CrossRef] [PubMed]
- Sakurai, E.; Anand, A.; Ambati, B.K.; van Rooijen, N.; Ambati, J. Macrophage depletion inhibits experimental choroidal neovascularization. Investig. Ophthalmol. Vis. Sci. 2003, 44, 3578–3585. [Google Scholar] [CrossRef]
- Yang, X.; Zhao, L.; Campos, M.M.; Abu-Asab, M.; Ortolan, D.; Hotaling, N.; Bharti, K.; Wong, W.T. CSF1R blockade induces macrophage ablation and results in mouse choroidal vascular atrophy and RPE disorganization. Elife 2020, 9, e55564. [Google Scholar] [CrossRef]
- Kliffen, M.; Sharma, H.S.; Mooy, C.M.; Kerkvliet, S.; de Jong, P.T. Increased expression of angiogenic growth factors in age-related maculopathy. Br. J. Ophthalmol. 1997, 81, 154–162. [Google Scholar] [CrossRef]
- Grossniklaus, H.E.; Ling, J.X.; Wallace, T.M.; Dithmar, S.; Lawson, D.H.; Cohen, C.; Elner, V.M.; Elner, S.G.; Sternberg, P., Jr. Macrophage and retinal pigment epithelium expression of angiogenic cytokines in choroidal neovascularization. Mol. Vis. 2002, 8, 119–126. [Google Scholar]
- Martin, G.; Schlunck, G.; Hansen, L.L.; Agostini, H.T. Differential expression of angioregulatory factors in normal and CNV-derived human retinal pigment epithelium. Graefes Arch. Clin. Exp. Ophthalmol. 2004, 242, 321–326. [Google Scholar] [CrossRef]
- Garcia, T.B.; Hollborn, M.; Bringmann, A. Expression and signaling of NGF in the healthy and injured retina. Cytokine Growth Factor Rev. 2017, 34, 43–57. [Google Scholar] [CrossRef]
- Barcelona, P.F.; Galan, A.; Nedev, H.; Jian, Y.; Sarunic, M.V.; Saragovi, H.U. The route of administration influences the therapeutic index of an anti-proNGF neutralizing mAb for experimental treatment of Diabetic Retinopathy. PLoS ONE 2018, 13, e0199079. [Google Scholar] [CrossRef]
- Lebrun-Julien, F.; Bertrand, M.J.; De Backer, O.; Stellwagen, D.; Morales, C.R.; Di Polo, A.; Barker, P.A. ProNGF induces TNFalpha-dependent death of retinal ganglion cells through a p75NTR non-cell-autonomous signaling pathway. Proc. Natl. Acad. Sci. USA 2010, 107, 3817–3822. [Google Scholar] [CrossRef] [PubMed]
- Wexler, E.M.; Berkovich, O.; Nawy, S. Role of the low-affinity NGF receptor (p75) in survival of retinal bipolar cells. Vis. Neurosci. 1998, 15, 211–218. [Google Scholar] [CrossRef] [PubMed]
- Elshaer, S.L.; Park, H.S.; Pearson, L.; Hill, W.D.; Longo, F.M.; El-Remessy, A.B. Modulation of p75(NTR) on Mesenchymal Stem Cells Increases Their Vascular Protection in Retinal Ischemia-Reperfusion Mouse Model. Int. J. Mol. Sci. 2021, 22, 829. [Google Scholar] [CrossRef]
- Barcelona, P.F.; Sitaras, N.; Galan, A.; Esquiva, G.; Jmaeff, S.; Jian, Y.; Sarunic, M.V.; Cuenca, N.; Sapieha, P.; Saragovi, H.U. p75NTR and Its Ligand ProNGF Activate Paracrine Mechanisms Etiological to the Vascular, Inflammatory, and Neurodegenerative Pathologies of Diabetic Retinopathy. J. Neurosci. 2016, 36, 8826–8841. [Google Scholar] [CrossRef] [PubMed]
- Meeker, R.; Williams, K. Dynamic nature of the p75 neurotrophin receptor in response to injury and disease. J. Neuroimmune Pharmacol. 2014, 9, 615–628. [Google Scholar] [CrossRef]
- von Bartheld, C.S. Neurotrophins in the developing and regenerating visual system. Histol. Histopathol. 1998, 13, 437–459. [Google Scholar] [CrossRef]
- Anastasia, A.; Barker, P.A.; Chao, M.V.; Hempstead, B.L. Detection of p75NTR Trimers: Implications for Receptor Stoichiometry and Activation. J. Neurosci. 2015, 35, 11911–11920. [Google Scholar] [CrossRef]
- Bhakar, A.L.; Howell, J.L.; Paul, C.E.; Salehi, A.H.; Becker, E.B.; Said, F.; Bonni, A.; Barker, P.A. Apoptosis induced by p75NTR overexpression requires Jun kinase-dependent phosphorylation of Bad. J. Neurosci. 2003, 23, 11373–11381. [Google Scholar] [CrossRef]
- Bredesen, D.E.; Ye, X.; Tasinato, A.; Sperandio, S.; Wang, J.J.; Assa-Munt, N.; Rabizadeh, S. p75NTR and the concept of cellular dependence: Seeing how the other half die. Cell Death Differ. 1998, 5, 365–371. [Google Scholar] [CrossRef]
- Galan, A.; Barcelona, P.F.; Nedev, H.; Sarunic, M.V.; Jian, Y.; Saragovi, H.U. Subconjunctival Delivery of p75NTR Antagonists Reduces the Inflammatory, Vascular, and Neurodegenerative Pathologies of Diabetic Retinopathy. Investig. Ophthalmol. Vis. Sci. 2017, 58, 2852–2862. [Google Scholar] [CrossRef]
- Le Moan, N.; Houslay, D.M.; Christian, F.; Houslay, M.D.; Akassoglou, K. Oxygen-dependent cleavage of the p75 neurotrophin receptor triggers stabilization of HIF-1alpha. Mol. Cell 2011, 44, 476–490. [Google Scholar] [CrossRef] [PubMed]
- Elshaer, S.L.; El-Remessy, A.B. Deletion of p75(NTR) prevents vaso-obliteration and retinal neovascularization via activation of Trk- A receptor in ischemic retinopathy model. Sci. Rep. 2018, 8, 12490. [Google Scholar] [CrossRef] [PubMed]
- Shah, R.S.; Soetikno, B.T.; Lajko, M.; Fawzi, A.A. A Mouse Model for Laser-induced Choroidal Neovascularization. J. Vis. Exp. 2015, 106, e53502. [Google Scholar] [CrossRef]
- Paz, M.C.; Barcelona, P.F.; Subirada, P.V.; Ridano, M.E.; Chiabrando, G.A.; Castro, C.; Sanchez, M.C. Metabolic Syndrome Triggered by Fructose Diet Impairs Neuronal Function and Vascular Integrity in ApoE-KO Mouse Retinas: Implications of Autophagy Deficient Activation. Front. Cell Dev. Biol. 2020, 8, 573987. [Google Scholar] [CrossRef]
- Ridano, M.E.; Subirada, P.V.; Paz, M.C.; Lorenc, V.E.; Stupirski, J.C.; Gramajo, A.L.; Luna, J.D.; Croci, D.O.; Rabinovich, G.A.; Sanchez, M.C. Galectin-1 expression imprints a neurovascular phenotype in proliferative retinopathies and delineates responses to anti-VEGF. Oncotarget 2017, 8, 32505–32522. [Google Scholar] [CrossRef] [PubMed]
- Subirada, P.V.; Paz, M.C.; Ridano, M.E.; Lorenc, V.E.; Fader, C.M.; Chiabrando, G.A.; Sanchez, M.C. Effect of Autophagy Modulators on Vascular, Glial, and Neuronal Alterations in the Oxygen-Induced Retinopathy Mouse Model. Front. Cell Neurosci. 2019, 13, 279. [Google Scholar] [CrossRef] [PubMed]
- Romagnoli, P.A.; Premenko-Lanier, M.F.; Loria, G.D.; Altman, J.D. CD8 T cell memory recall is enhanced by novel direct interactions with CD4 T cells enabled by MHC class II transferred from APCs. PLoS ONE 2013, 8, e56999. [Google Scholar] [CrossRef] [PubMed]
- Liu, J.; Jha, P.; Lyzogubov, V.V.; Tytarenko, R.G.; Bora, N.S.; Bora, P.S. Relationship between complement membrane attack complex, chemokine (C-C motif) ligand 2 (CCL2) and vascular endothelial growth factor in mouse model of laser-induced choroidal neovascularization. J. Biol. Chem. 2011, 286, 20991–21001. [Google Scholar] [CrossRef]
- Choi, S.; Friedman, W.J. Interleukin-1beta enhances neuronal vulnerability to proNGF-mediated apoptosis by increasing surface expression of p75(NTR) and sortillin. Neuroscience 2014, 257, 11–19. [Google Scholar] [CrossRef]
- Minnone, G.; De Benedetti, F.; Bracci-Laudiero, L. NGF and Its Receptors in the Regulation of Inflammatory Response. Int. J. Mol. Sci. 2017, 18, 1028. [Google Scholar] [CrossRef]
- Yang, C.R.; Ding, H.J.; Yu, M.; Zhou, F.H.; Han, C.Y.; Liang, R.; Zhang, X.Y.; Zhang, X.L.; Meng, F.J.; Wang, S.; et al. proBDNF/p75NTR promotes rheumatoid arthritis and inflammatory response by activating proinflammatory cytokines. FASEB J. 2022, 36, e22180. [Google Scholar] [CrossRef] [PubMed]
- Dusedau, H.P.; Kleveman, J.; Figueiredo, C.A.; Biswas, A.; Steffen, J.; Kliche, S.; Haak, S.; Zagrebelsky, M.; Korte, M.; Dunay, I.R. p75(NTR) regulates brain mononuclear cell function and neuronal structure in Toxoplasma infection-induced neuroinflammation. Glia 2019, 67, 193–211. [Google Scholar] [CrossRef] [PubMed]
- Shi, W.; Wu, Y.; Bian, D. p75NTR silencing inhibits proliferation, migration, and extracellular matrix deposition of hypertrophic scar fibroblasts by activating autophagy through inhibiting the PI3K/Akt/mTOR pathway. Can. J. Physiol. Pharmacol. 2021, 99, 349–359. [Google Scholar] [CrossRef]
- Garcia-Silva, S.; Benito-Martin, A.; Nogues, L.; Hernandez-Barranco, A.; Mazariegos, M.S.; Santos, V.; Hergueta-Redondo, M.; Ximenez-Embun, P.; Kataru, R.P.; Lopez, A.A.; et al. Melanoma-derived small extracellular vesicles induce lymphangiogenesis and metastasis through an NGFR-dependent mechanism. Nat. Cancer 2021, 2, 1387–1405. [Google Scholar] [CrossRef]
- Subirada, P.V.; Paz, M.C.; Ridano, M.E.; Lorenc, V.E.; Vaglienti, M.V.; Barcelona, P.F.; Luna, J.D.; Sanchez, M.C. A journey into the retina: Muller glia commanding survival and death. Eur. J. Neurosci. 2018, 47, 1429–1443. [Google Scholar] [CrossRef] [PubMed]
- Deinhardt, K.; Kim, T.; Spellman, D.S.; Mains, R.E.; Eipper, B.A.; Neubert, T.A.; Chao, M.V.; Hempstead, B.L. Neuronal growth cone retraction relies on proneurotrophin receptor signaling through Rac. Sci. Signal. 2011, 4, ra82. [Google Scholar] [CrossRef] [PubMed]
- Teng, H.K.; Teng, K.K.; Lee, R.; Wright, S.; Tevar, S.; Almeida, R.D.; Kermani, P.; Torkin, R.; Chen, Z.Y.; Lee, F.S.; et al. ProBDNF induces neuronal apoptosis via activation of a receptor complex of p75NTR and sortilin. J. Neurosci. 2005, 25, 5455–5463. [Google Scholar] [CrossRef]
- Kommaddi, R.P.; Thomas, R.; Ceni, C.; Daigneault, K.; Barker, P.A. Trk-dependent ADAM17 activation facilitates neurotrophin survival signaling. FASEB J. 2011, 25, 2061–2070. [Google Scholar] [CrossRef]
- Anastasia, A.; Deinhardt, K.; Chao, M.V.; Will, N.E.; Irmady, K.; Lee, F.S.; Hempstead, B.L.; Bracken, C. Val66Met polymorphism of BDNF alters prodomain structure to induce neuronal growth cone retraction. Nat. Commun. 2013, 4, 2490. [Google Scholar] [CrossRef]
- Mohamed, R.; Shanab, A.Y.; El Remessy, A.B. Deletion of the Neurotrophin Receptor p75(NTR) Prevents Diabetes-Induced Retinal Acellular Capillaries in Streptozotocin-Induced Mouse Diabetic Model. J. Diabetes Metab. Disord. Control 2017, 4, 129. [Google Scholar] [CrossRef]
- Zhang, J.; Zhao, J.; Bai, Y.; Huang, L.; Yu, W.; Li, X. Effects of p75 neurotrophin receptor on regulating hypoxia-induced angiogenic factors in retinal pigment epithelial cells. Mol. Cell. Biochem. 2015, 398, 123–134. [Google Scholar] [CrossRef] [PubMed]
- Caporali, A.; Meloni, M.; Nailor, A.; Mitic, T.; Shantikumar, S.; Riu, F.; Sala-Newby, G.B.; Rose, L.; Besnier, M.; Katare, R.; et al. p75(NTR)-dependent activation of NF-kappaB regulates microRNA-503 transcription and pericyte-endothelial crosstalk in diabetes after limb ischaemia. Nat. Commun. 2015, 6, 8024. [Google Scholar] [CrossRef] [PubMed]
- Lee, S.; Mattingly, A.; Lin, A.; Sacramento, J.; Mannent, L.; Castel, M.N.; Canolle, B.; Delbary-Gossart, S.; Ferzaz, B.; Morganti, J.M.; et al. A novel antagonist of p75NTR reduces peripheral expansion and CNS trafficking of pro-inflammatory monocytes and spares function after traumatic brain injury. J. Neuroinflamm. 2016, 13, 88. [Google Scholar] [CrossRef] [PubMed]
- Du Cheyne, C.; Tay, H.; De Spiegelaere, W. The complex TIE between macrophages and angiogenesis. Anat. Histol. Embryol. 2020, 49, 585–596. [Google Scholar] [CrossRef]
- Droho, S.; Cuda, C.M.; Perlman, H.; Lavine, J.A. Macrophage-derived interleukin-6 is necessary and sufficient for choroidal angiogenesis. Sci. Rep. 2021, 11, 18084. [Google Scholar] [CrossRef]
- Jetten, N.; Verbruggen, S.; Gijbels, M.J.; Post, M.J.; De Winther, M.P.; Donners, M.M. Anti-inflammatory M2, but not pro-inflammatory M1 macrophages promote angiogenesis in vivo. Angiogenesis 2014, 17, 109–118. [Google Scholar] [CrossRef]
- Bai, Y.; Dergham, P.; Nedev, H.; Xu, J.; Galan, A.; Rivera, J.C.; ZhiHua, S.; Mehta, H.M.; Woo, S.B.; Sarunic, M.V.; et al. Chronic and acute models of retinal neurodegeneration TrkA activity are neuroprotective whereas p75NTR activity is neurotoxic through a paracrine mechanism. J. Biol. Chem. 2010, 285, 39392–39400. [Google Scholar] [CrossRef]
- Takata, S.; Masuda, T.; Nakamura, S.; Kuchimaru, T.; Tsuruma, K.; Shimazawa, M.; Nagasawa, H.; Kizaka-Kondoh, S.; Hara, H. The effect of triamcinolone acetonide on laser-induced choroidal neovascularization in mice using a hypoxia visualization bio-imaging probe. Sci. Rep. 2015, 5, 9898. [Google Scholar] [CrossRef]
- Hussain, R.M.; Ciulla, T.A. Treatment strategies for refractory diabetic macular edema: Switching anti-VEGF treatments, adopting corticosteroid-based treatments, and combination therapy. Expert Opin. Biol. Ther. 2016, 16, 365–374. [Google Scholar] [CrossRef]
- Hu, Q.; Li, H.; Xu, W.; Du, Y.; Ma, C.; He, J. Comparison between Ozurdex and intravitreal anti-vascular endothelial growth factor treatment for retinal vein occlusion-related macular edema: A systematic review and meta-analysis of randomized controlled trials. Indian J. Ophthalmol. 2019, 67, 1800–1809. [Google Scholar] [CrossRef]


Disclaimer/Publisher’s Note: The statements, opinions and data contained in all publications are solely those of the individual author(s) and contributor(s) and not of MDPI and/or the editor(s). MDPI and/or the editor(s) disclaim responsibility for any injury to people or property resulting from any ideas, methods, instructions or products referred to in the content. |
© 2023 by the authors. Licensee MDPI, Basel, Switzerland. This article is an open access article distributed under the terms and conditions of the Creative Commons Attribution (CC BY) license (https://creativecommons.org/licenses/by/4.0/).
Share and Cite
Subirada, P.V.; Tovo, A.; Vaglienti, M.V.; Luna Pinto, J.D.; Saragovi, H.U.; Sánchez, M.C.; Anastasía, A.; Barcelona, P.F. Etiological Roles of p75NTR in a Mouse Model of Wet Age-Related Macular Degeneration. Cells 2023, 12, 297. https://doi.org/10.3390/cells12020297
Subirada PV, Tovo A, Vaglienti MV, Luna Pinto JD, Saragovi HU, Sánchez MC, Anastasía A, Barcelona PF. Etiological Roles of p75NTR in a Mouse Model of Wet Age-Related Macular Degeneration. Cells. 2023; 12(2):297. https://doi.org/10.3390/cells12020297
Chicago/Turabian StyleSubirada, Paula Virginia, Albana Tovo, María Victoria Vaglienti, José Domingo Luna Pinto, Horacio Uri Saragovi, Maria Cecilia Sánchez, Agustín Anastasía, and Pablo Federico Barcelona. 2023. "Etiological Roles of p75NTR in a Mouse Model of Wet Age-Related Macular Degeneration" Cells 12, no. 2: 297. https://doi.org/10.3390/cells12020297
APA StyleSubirada, P. V., Tovo, A., Vaglienti, M. V., Luna Pinto, J. D., Saragovi, H. U., Sánchez, M. C., Anastasía, A., & Barcelona, P. F. (2023). Etiological Roles of p75NTR in a Mouse Model of Wet Age-Related Macular Degeneration. Cells, 12(2), 297. https://doi.org/10.3390/cells12020297